1. Introduction
The zebrafish and its larvae are becoming prominent vertebrate models in biological and medical research [
1,
2,
3,
4,
5,
6]. The transparency of zebrafish larvae facilitates convenient observation of the experimental process. Compared to the observations made by naked eyes in early days, the development of modern microscopy and imaging technology has facilitated the implementation of more complicated experiments by obtaining and storing massive zebrafish phenotype imaging data digitally [
7].
Early methods of phenotype image analysis mostly rely on manual work which is labour intensive and error prone. Due to the increasing amount of image data, efficient image-processing methods extracting meaningful information from a massive amount of phenotype images are increasingly important [
8]. So far, automatic approaches have been proposed for classifying the stages of zebrafish embryo development [
3,
9,
10] and recognition of adult fish behavior [
11,
12,
13], following classical image-processing techniques like wavelet analysis and fractal geometry [
14,
15,
16]. These studies opened a new era of computerized zebrafish microscopic image analysis, liberating biologists from tedious manual work and increasing the objectivity of the task.
Comparing to the development of image-analysis methods for zebrafish adults or eggs, the studies on zebrafish larvae are relatively rare. The analysis of the larvae image remains a challenging task due to the complexity and diversity of larvae phenotypes [
17,
18,
19]. The distinctions among different phenotypes are difficult to identify even for human experts. Among the limited number of existing zebrafish larvae image-analysis studies, Nathalie Jeanray et al. proposed an automatic approach for larvae defects classification from microscopic images using a supervised machine-learning approach [
20]. They used dense random sub-windows to extract hand-crafted image features for phenotype defects classification. For nine out of 11 classification categories, their method reached 90% to 100% agreement with consensus voting of biologists. This method gives new insights into automatic recognition of zebrafish larvae phenotypes by replacing human labour with the computerized method.
Even though the machine-learning method using hand-crafted features achieved comparable performance to human experts, there is still significant scope to improve the accuracy and automation of the method. The accuracy of these methods mostly depends on the quality of the extracted features. The process for feature extraction involves subjective factors and human interventions. In contrast to the classical machine-learning methods using hand-crafted features, the newly developed deep-learning (DL) methods automatically extract image features and achieved a dramatic improvement of the classification accuracy. In the last decade, DL methods, especially convolutional neural networks (CNNs), have revolutionised the field of image analysis [
21,
22,
23]. Despite the success of deep learning in image processing, there are some unique difficulties of zebrafish larvae microscopic images hampering the application of DL approaches:
- (i)
Scarce training data. Biological experiments usually produce small datasets far from enough for training large neural networks. It is difficult to generate a large training set of expert-annotated zebrafish larvae images. Manual annotation of the training images is labour-intensive. It is unlikely to create large annotated biological image datasets with comparable scale to the natural image datasets [
24].
- (ii)
Fuzzy inter-class difference. The appearance difference between different zebrafish larvae phenotypes are sometimes too trivial to be identified by the naked eye, and even human experts do not agree with each other on the annotation labels.
- (iii)
Multi-label nature. Unlike the natural image classification tasks which assign one unique label (e.g., cat or dog) to each subject, some zebrafish larvae phenotypes may simultaneously belong to multiple classes. For example, a larva with a necrosed yolk sac may also have an up curved short tail. Existing DL models are mostly designed for single-label classification task thus cannot be directly applied to zebrafish larvae phenotype classification.
Considering these difficulties, it is necessary to develop a specific deep-learning method for zebrafish phenotype classification from brightfield microscopic images. In this work, to cope with the scarce training data problem, we adopted the idea of separable convolution from the Xception (extreme inception) network [
25] to overcome the overfitting issue caused by limited training data. To tackle the fuzzy inter-class difference and multi-label problems, a two-tier classification strategy is used. The phenotypes that are easy to recognize are firstly recognized in the first-tier classification process. The remaining difficult phenotypes are then recognized with dedicated trained classifiers in the second tier. For each of the difficult phenotypes, we train one network for each single phenotype, so that the networks are more focused on the specific phenotypes. Since each test image is processed with multiple networks, multiple phenotype labels can be assigned to one image, thus the multi-label problem is tackled.
To test our algorithm and compare it fairly with the state-out-the-art solutions, we used a publicly available zebrafish larvae microscopic image dataset [
20] which has corresponding human expert annotation labels. Based on the researching achievements of the predecessor, we worked further on this dataset and developed a DL-based zebrafish larvae classification model that is more robust and accurate. In
Section 2, the dataset annotated elaborately by the Nathalie Jeanray et al. is described.
Section 3 introduces the detailed structure and method. Experimental results are reported in
Section 4, with further discussions presented in
Section 5.
2. Materials and Methods
2.1. Data Collection
To train and develop an effective model for phenotype classification, the quality of the carefully collected dataset is crucial. Ground-truth datasets acquired and annotated by domain experts with the depiction of various classes are required [
26]. Research based on publicly available ground-truth datasets has the advantage of enabling better evaluation and comparison of algorithms to enable continuous progress. Therefore, we chose the dataset from the Jeanray et al. group which were produced and collected with rigorous processes [
20].
To obtain a collection of different defect phenotypes, Jeanray et al. used increasing concentrations of varied chemicals for zebrafish embryo treatment, including propranolol, amiodarone, acetaminophen, valproic acid caffeine, theophylline 4,5-dichloroanilin, as well as heavy metals such as thallium, methylmercury, lead acetate and zinc sulfate. Phenotype images of control or treated embryos were captured in a lateral view with a high-resolution Olympus SZX10 microscope coupled with a camera and transmitted light illumination. The acquired images were in the size of 2575 × 1932 pixels.
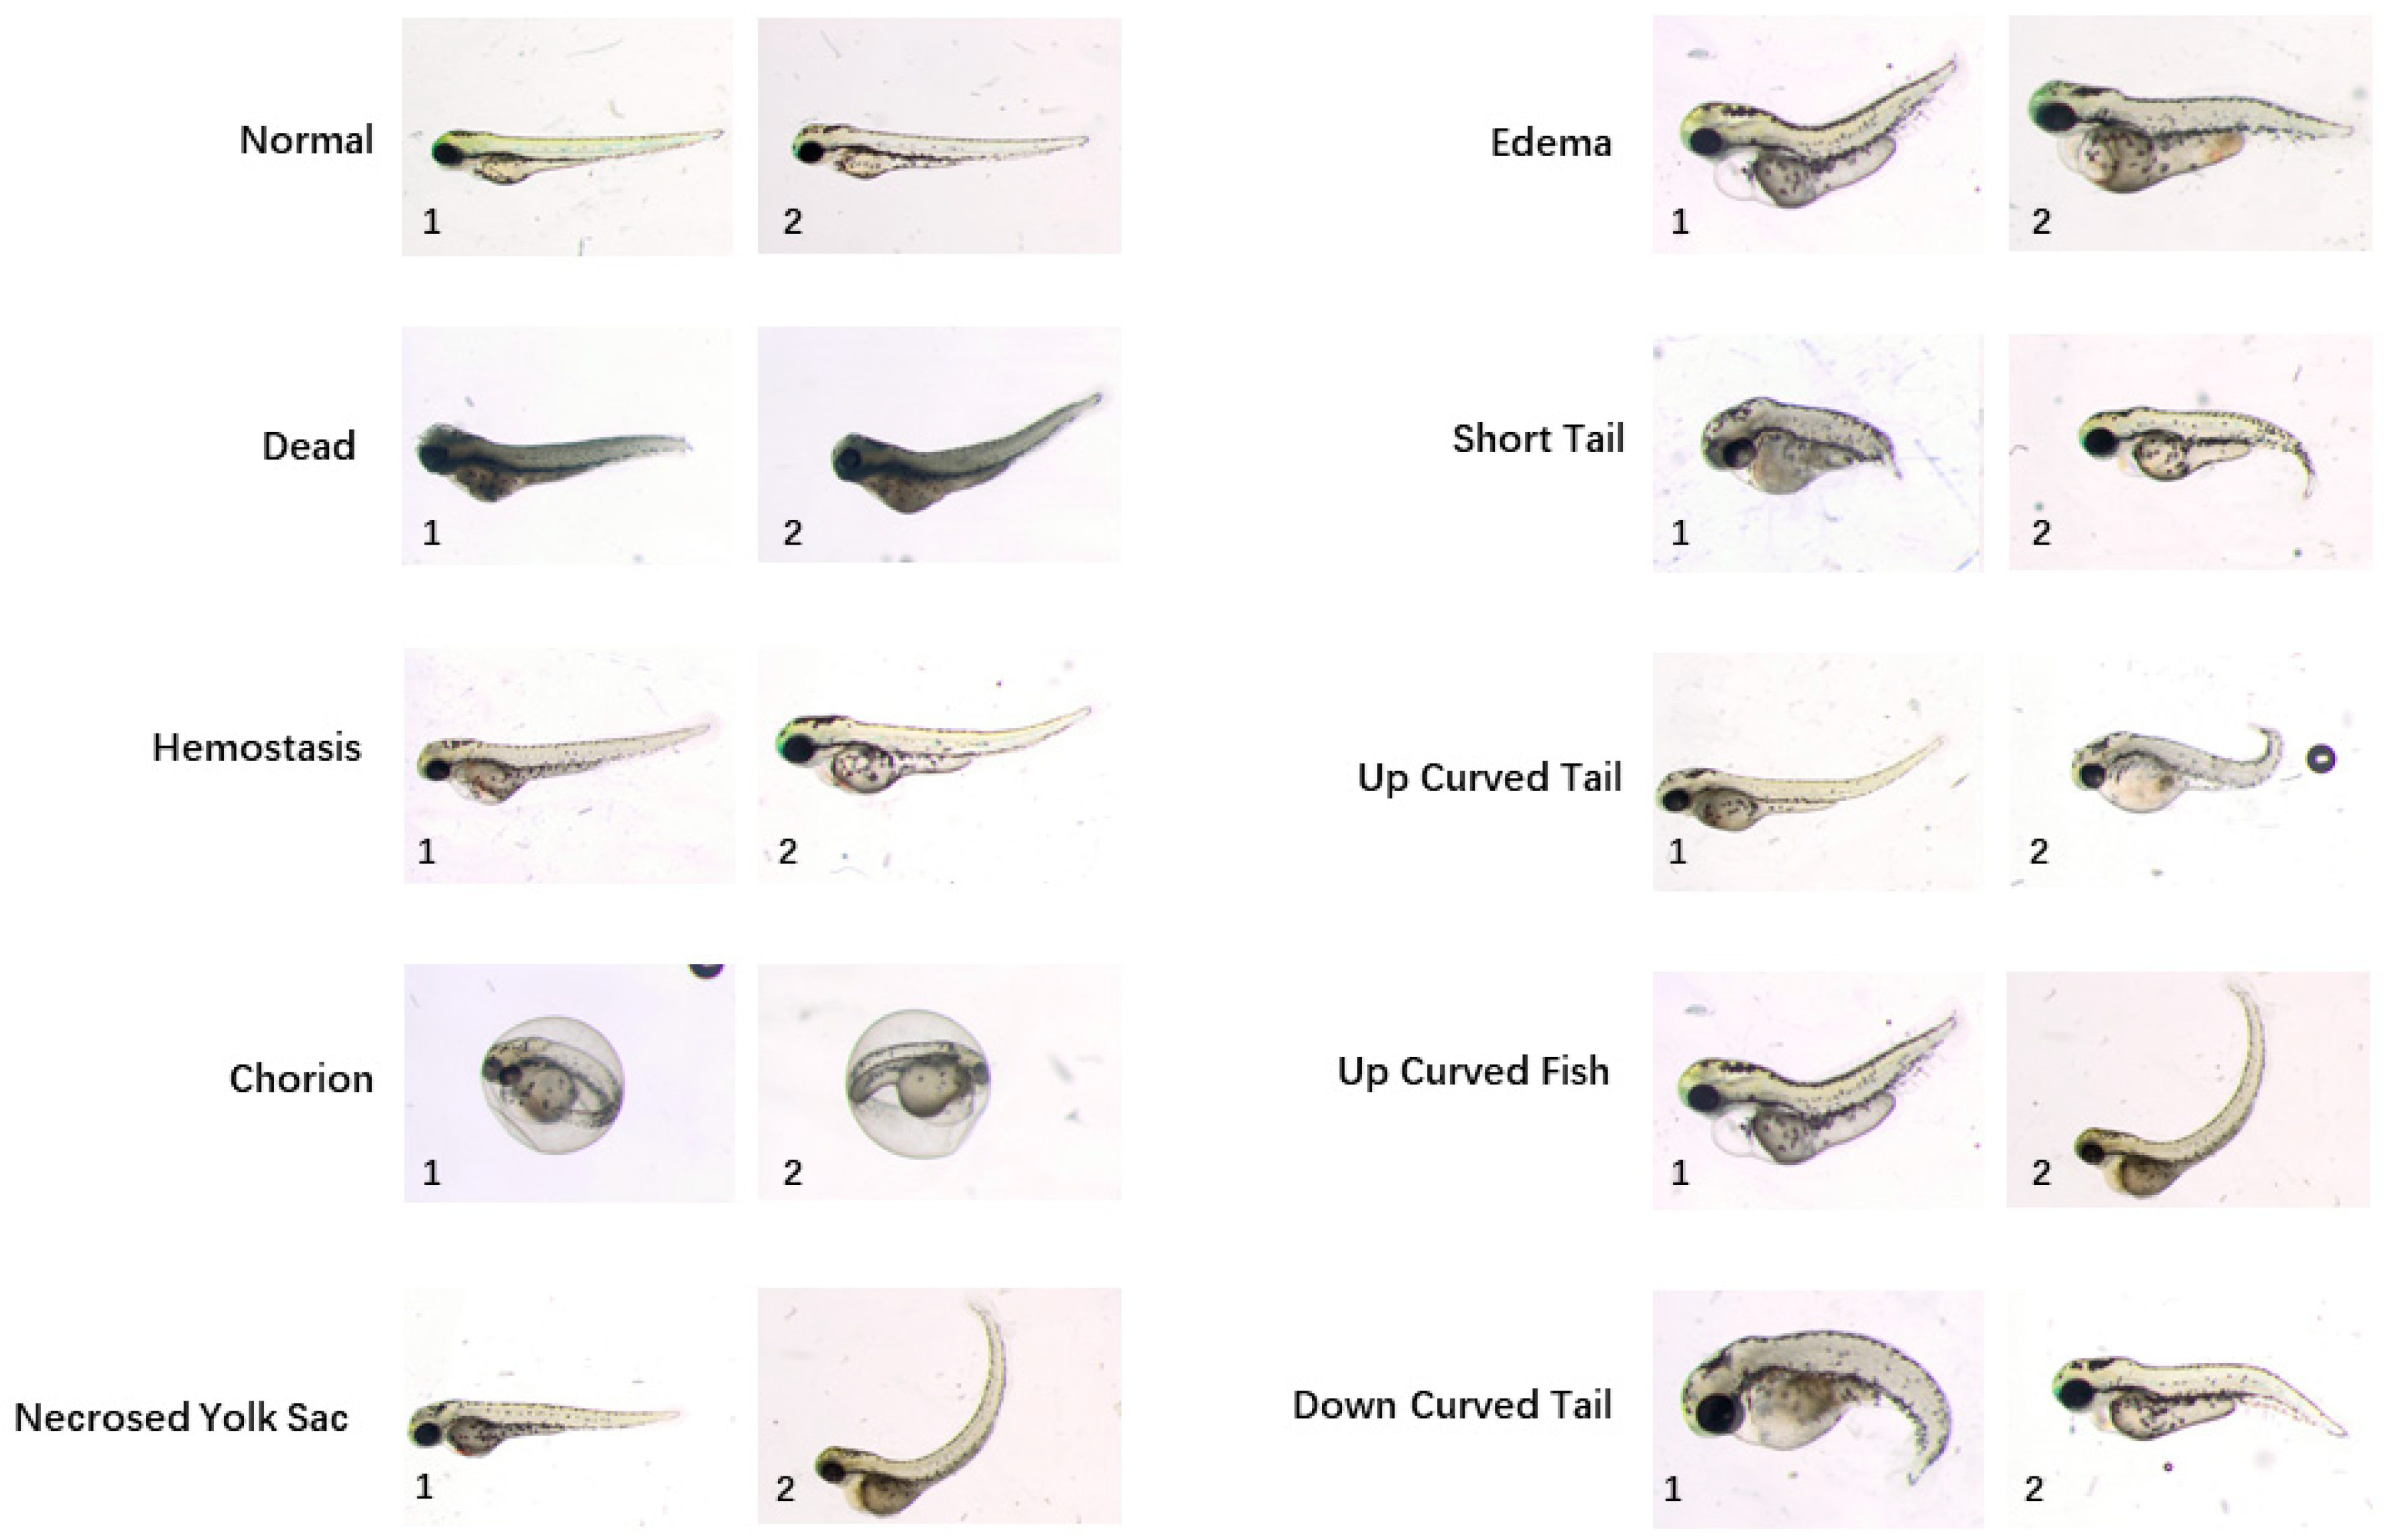
A sophisticated workflow of manual annotation was performed to build a high-quality ground-truth dataset. Three biologists labelled images with different categories of phenotypes by observations only in the first round. For each phenotype assigned to each image, the ground-truth was calculated by majority voting. Ten categories of phenotypes are identified, i.e., “normal”, “dead”, “chorion”, “down curved tail”, “hemostasis”, “necrosed yolk sac”, “edema”, “short tail”, “up curved tail” and “up curved fish”. Sample images for different phenotypes are shown in
Figure 1. By contrast with a regular classification dataset, there may be more than one phenotype assigned to a single image since more than one deformity may be found on one larva. Next, all annotations were reviewed by three biologists at the same time in order to reach agreement on phenotypes assigned to each image. After repeating the annotation and voting session, consensus was reached on 870 images. In total, 529 of them acquired in five independent acquisition days were set as a training dataset and other 341 images acquired in three additional acquisition days were integrated into the test dataset. The rigorous process of building the ground-truth dataset has laid the foundation of high-performance phenotype classification algorithms.
Table 1 reports the number of training and testing images in this dataset. The training images are to be used for training the machine learning model for phenotype classification. The testing images are used for validating the trained model. The testing images are not included in the training images.
2.2. Data Pre-Processing
One of the greatest impediments to developing deep-learning networks for biological images is that the sizes of training datasets from biological experiments are usually too small. The zebrafish larvae image dataset used in this study is the biggest dataset we could find, but its data size (hundreds of images) is still up to four orders of magnitudes less than the number of images needed to train a deep neural network. Training a deep network using such a small dataset will inevitably cause overfitting, leading to imperfect generalization ability of the network. Another obstacle is that the numbers of each category of the dataset are seriously imbalanced (as
Table 1 reports). Imbalanced training samples will result in poor classification performance for those phenotypes with insufficient training samples.
To address the problem of the small and imbalanced training dataset, a data argumentation strategy is applied. Data augmentation is an effective way to extend an existing dataset by creating altered versions of the training data according to possible varied experimental situations. The trained network will be more robust against possible image variations due to the added possible diversification. Image augmentation is proved to be one of the effective solutions for preventing over-fitting. In this way, a wider variety of images is available for training the classification network to make it more robust to possible image variations.
Data-augmentation techniques were chosen based on the peculiarity of the zebrafish larvae microscopic image dataset. The most possible variations of the microscopic images were caused by random larvae placement which resulted in slight differences of the larvae location and orientation. Therefore, each training image was shifted and rotated in different directions to generate pseudo augmented images. We applied small shifting in four directions of the objects, i.e., up, down, left and right. Similarly, we also added small rotations to the original and shifted images in both clockwise and counterclockwise directions to simulate possible deviation caused by manual operation during experiments.
To cope with the imbalanced training data problem, the images of different phenotypes were augmented a different number of times to produce a more balanced dataset. The phenotypes with relatively abundant images (i.e., normal, dead, necrosed yolk sac, and edema) were shifted in each direction four times with 10 pixels step and rotated in each direction three times with 10 degrees interval, therefore they were augmented 44 × (3 × 2) = 1536 times. The phenotypes with middle sample sizes (i.e., hemostasis, short tail, upcurved tail and upcurved fish) were shifted in each direction four times with 10 pixels step and rotated in each direction five times with six degrees interval, therefore they were augmented 44 × (5 × 2) = 2560 times. The phenotypes with scarce training sample (i.e., chorion and down curved tail) were shifted in each direction five times with eight pixels step and rotated in each direction 10 times with three degrees interval, they were augmented 54 × (10 × 2) = 12,500 times.
Table 2 summarizes the number of training images of each phenotype before and after data augmentation.
2.3. Network Structure
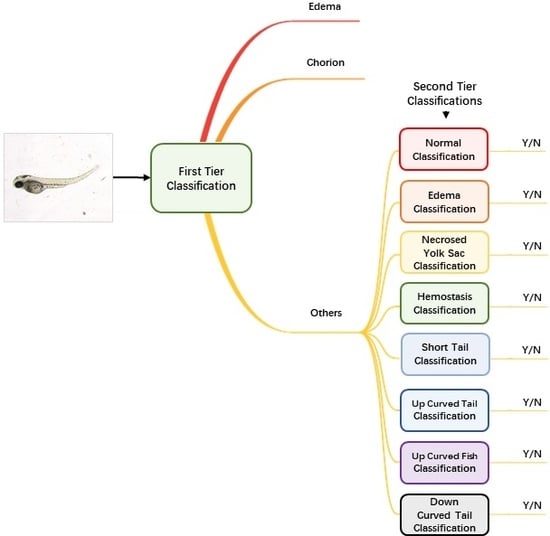
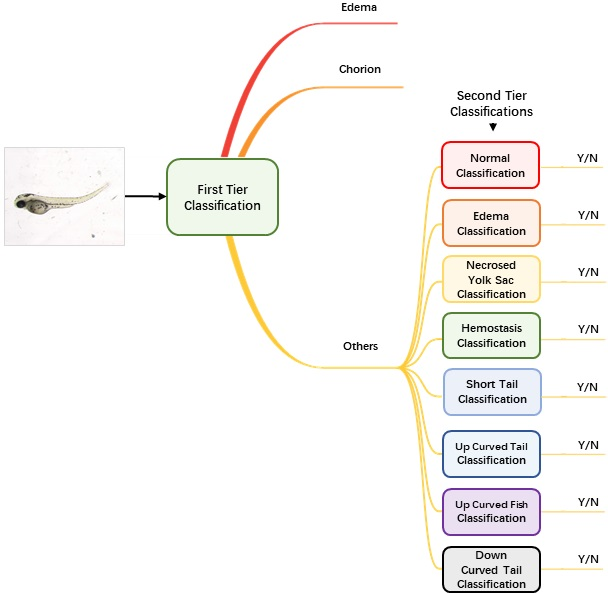
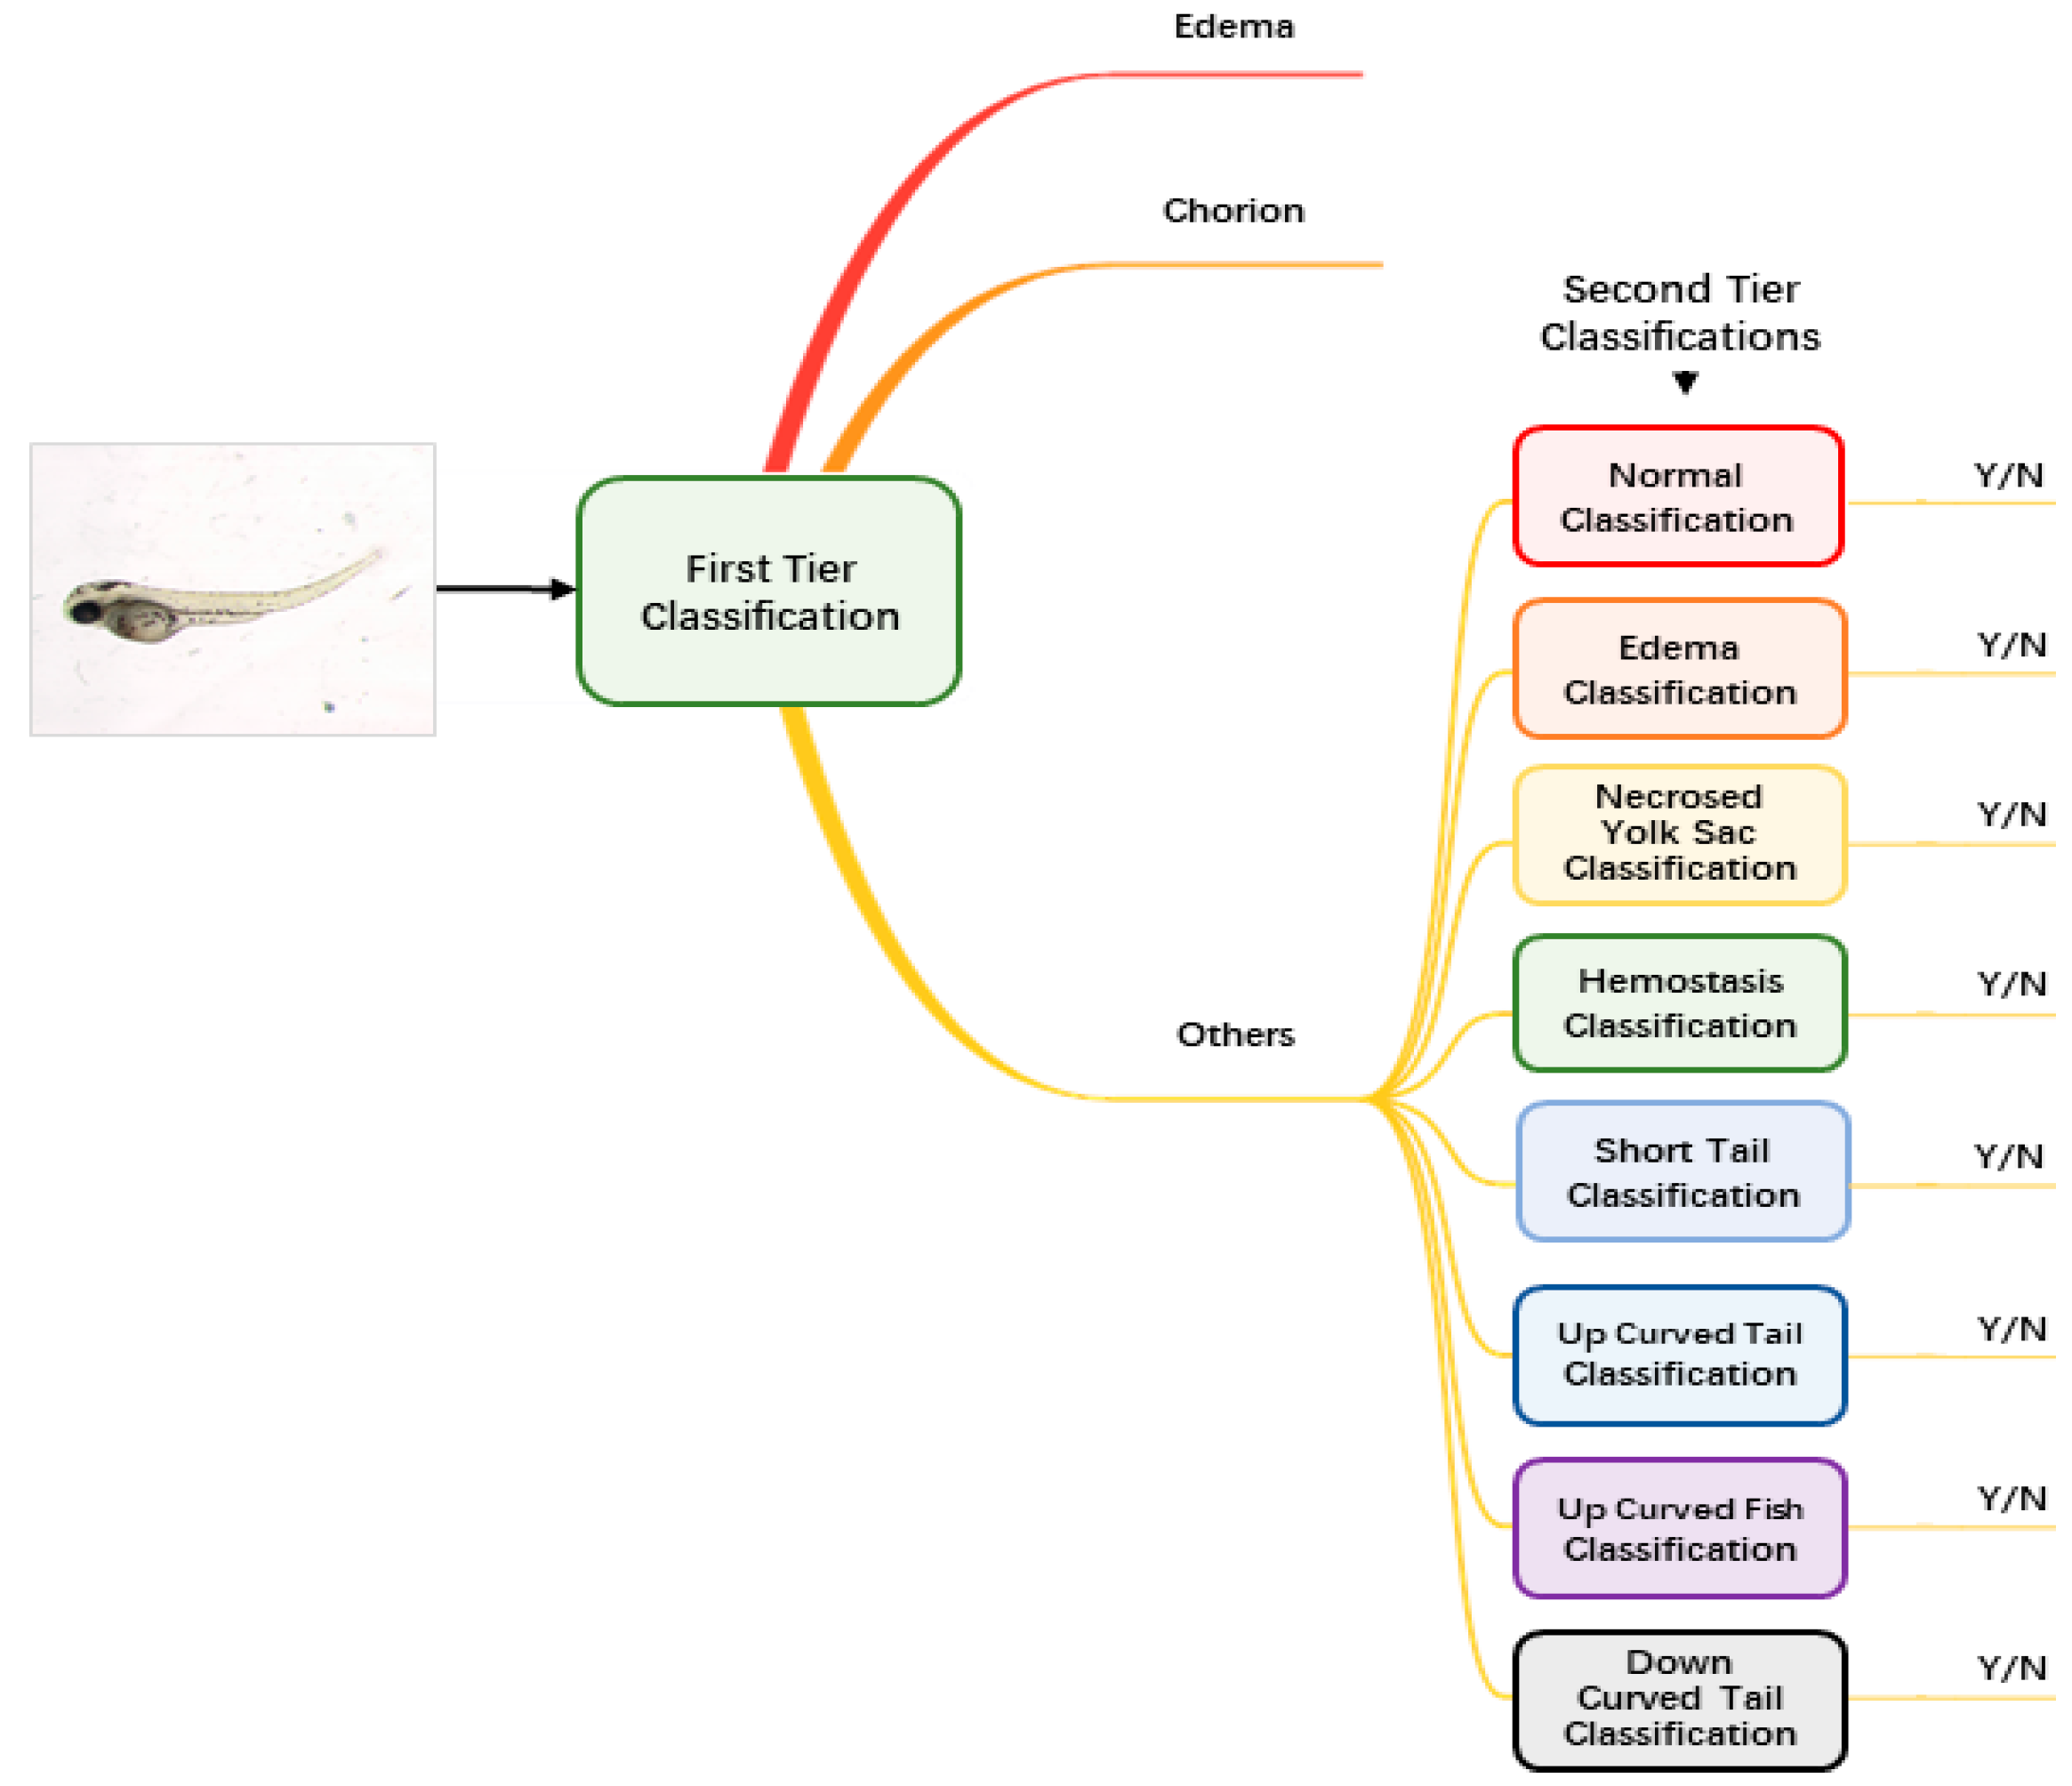
Augmented and normalized images were then fed into our classification module to identify the malformation type of each larva. Unlike regular classification datasets of which one image belongs to one category only, images of zebrafish larvae can be classified to have more than one label. Therefore, we used a two-tier classification pipeline to address the multi-label problem. As
Figure 2 shows, the first-tier classifier performs a tri-category classification, classifying the input image as edema, chorion or other phenotypes. We separate edema and chorion from other classes because they are quite easy to recognize, and it is not necessary to train individual classifiers for them. If the image is classified as others, it will go into the second-tier classification process in which eight binary classifiers are applied in parallel. Each of the classifiers is only responsible to judge whether the larva belongs to one of the eight classes. The objective of the second-tier classification is to find out whether the larva has one or more of the labels out of the eight phenotypes.
2.4. Larva Classification Network
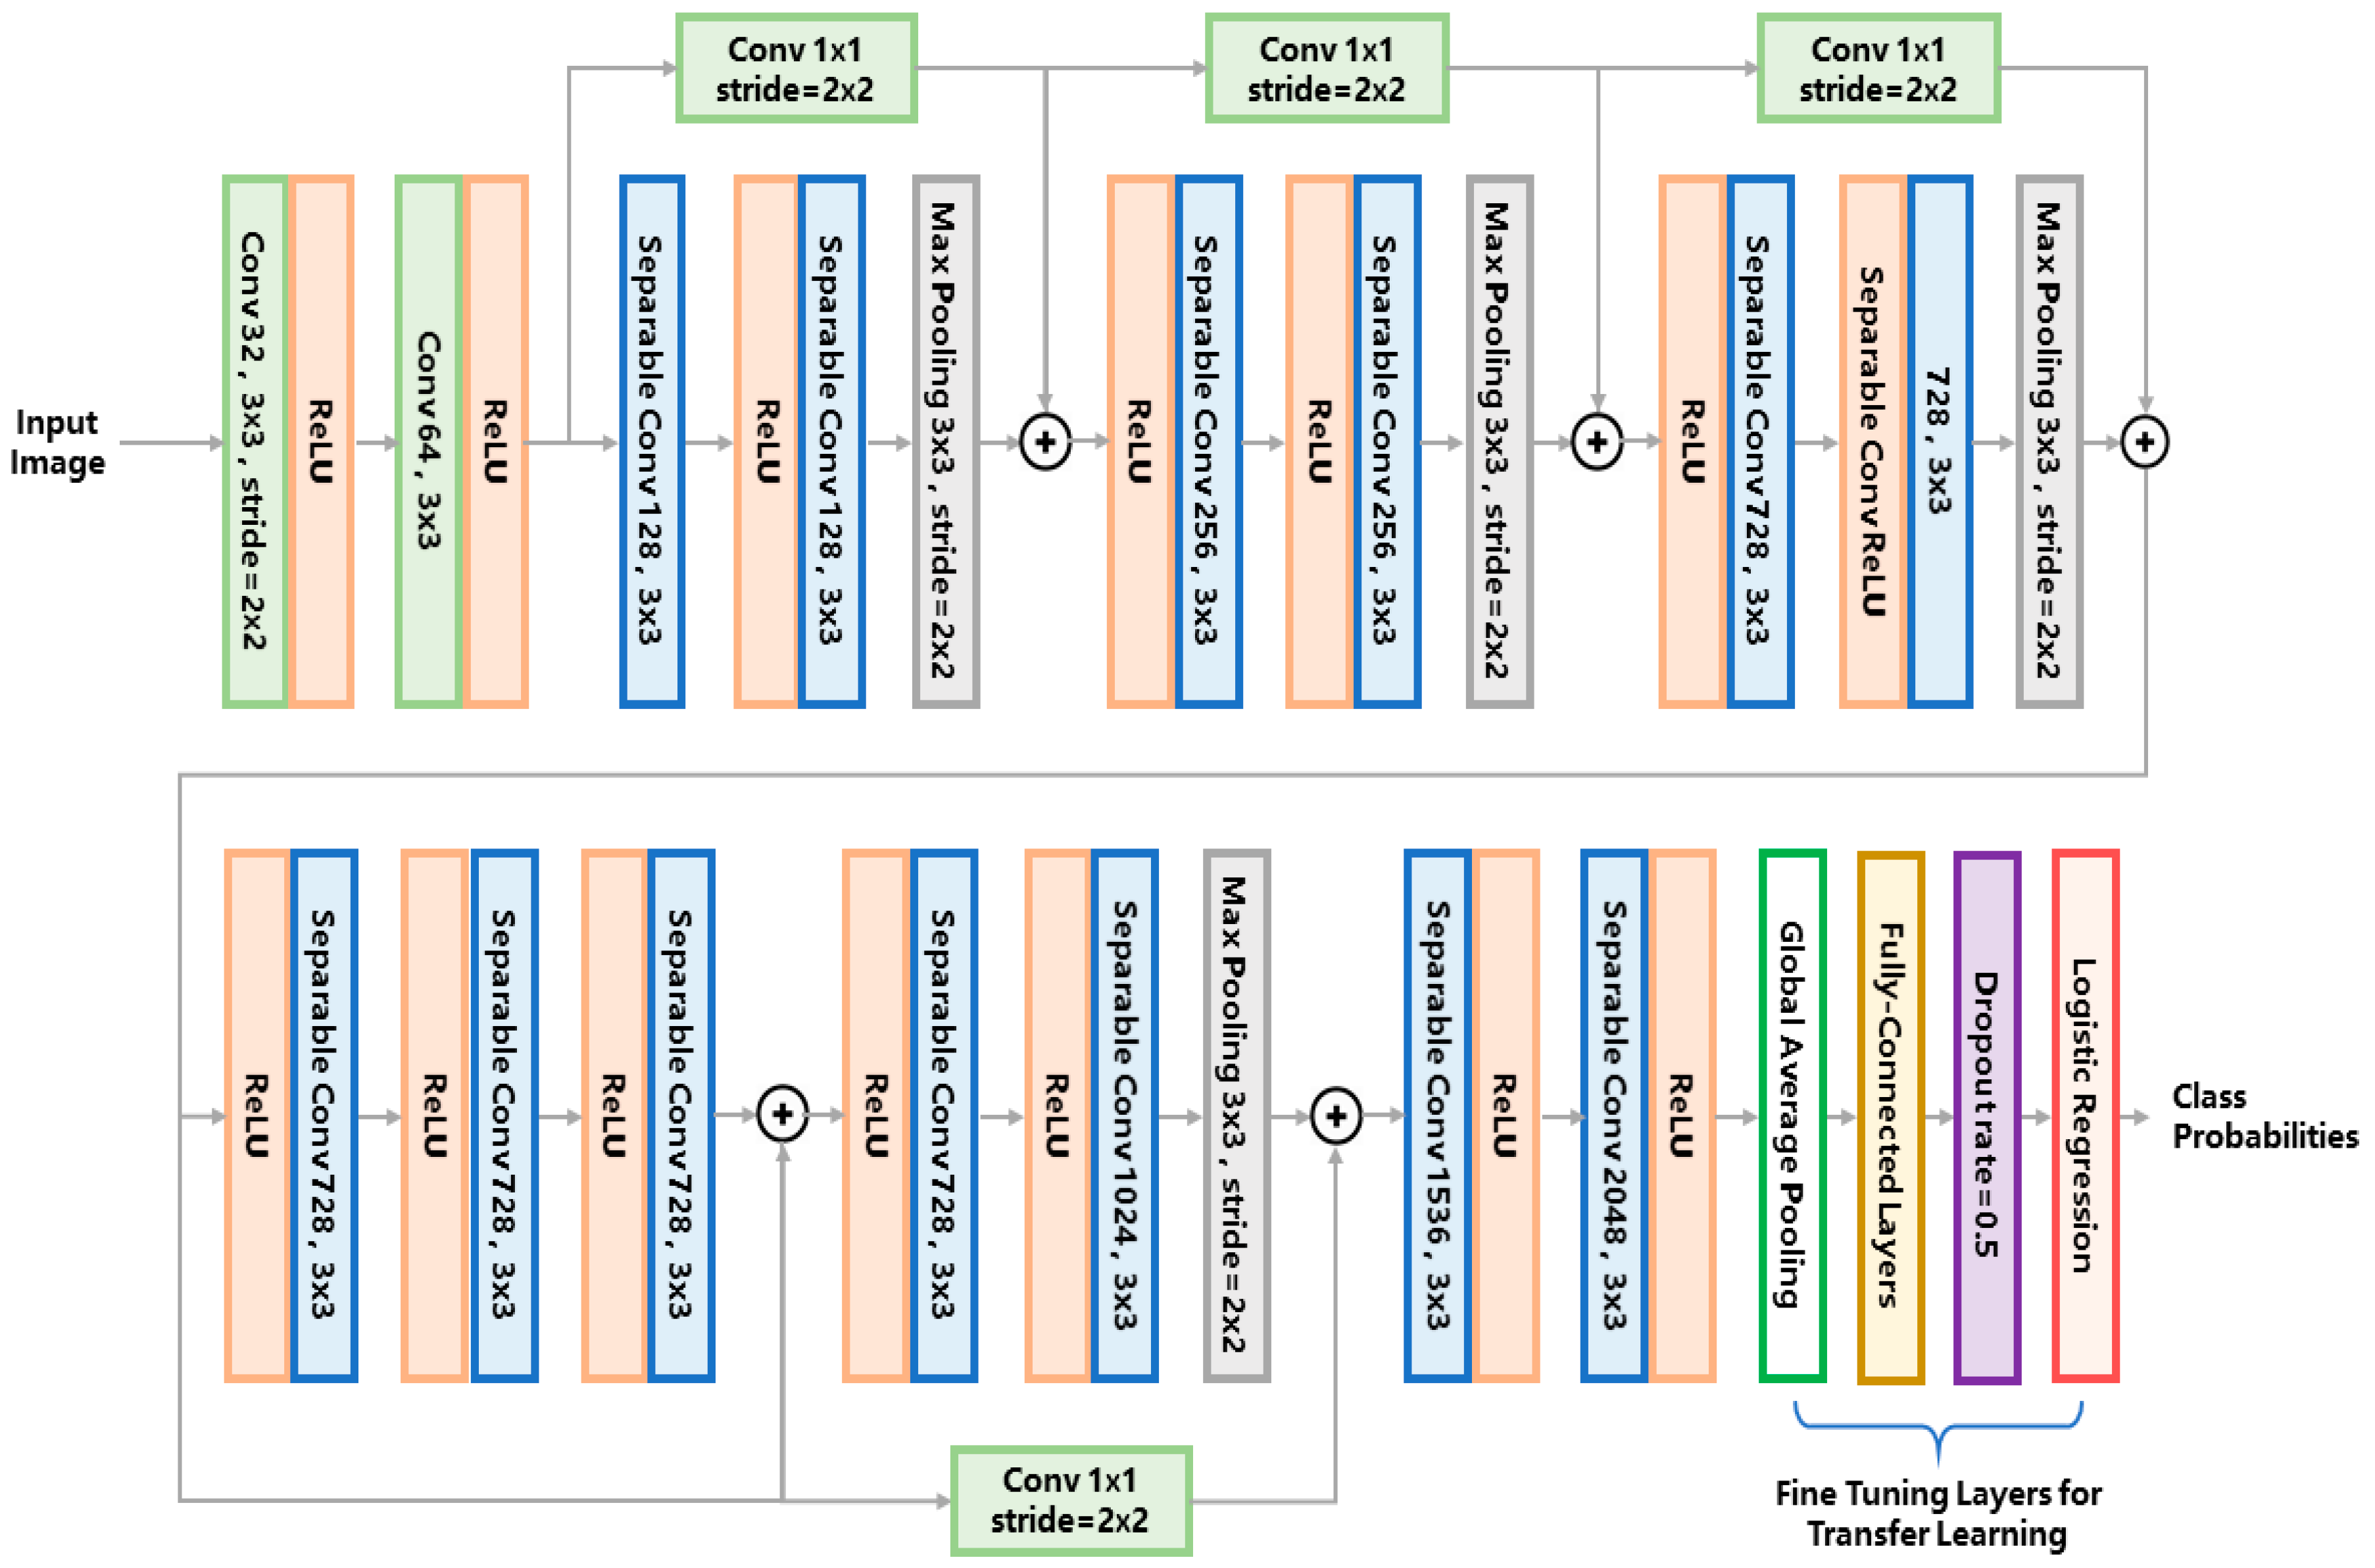
For the entire pipeline, we use the same network structure for both the first- and second-tier classification. We adopt the Xception network as the classifier model. The network structure is illustrated in
Figure 3. For conciseness of the article, we refer the readers to [
25] for a detailed explanation of the network architecture. For the first-tier classification, the network outputs the probabilities of three phenotypes, i.e., edema, chorion and others. The phenotype label with the maximum probability is assigned to the target larva. For the second-tier classification, the same network is used for each binary classifier, outputting the probability of belonging to each of the eight phenotypes. If the probability of a certain phenotype is over 0.5, the larva is classified to have the label of this phenotype.
So far, various types of convolutional networks have been developed for image classification. The reason we chose the Xception network instead of other classical networks (e.g., VGG16 [
27]) is that the Xception network uses the so-called ‘separable convolution’ mechanism (shown as the blue blocks in
Figure 3) to reduce the number of network hyperparameters.
Figure 4 compares the separable convolution architecture with conventional convolution architecture. The input of the convolutional architecture is a k-channel feature map (k = 4 in
Figure 4 as an example) produced by the previous network layer. The separable convolution architecture (
Figure 4a) conducts separated channel-wise and space-wise convolutions while the conventional convolution architecture (
Figure 4b) conducts channel-wise and space-wise convolutions simultaneously using a k × 3 × 3 kernel containing 9k hyperparameters. The channel-wise convolution is firstly performed using a k × 1 × 1 kernel, producing a single-channel intermediate feature map which is further convoluted with a 1 × 3 × 3 kernel. Such separable convolution uses only 9 + k hyperparameters which is much less than the 9k parameters of the conventional convolution. The merit of separable convolution for zebrafish larvae image classification is that it avoids overfitting to the limited training data because the network has much fewer hyperparameters than the conventional CNN.
To further relieve the problem of scarce training data, a technique called transfer learning is used to train a robust network for complicated zebrafish larvae classification. By transfer learning, we can obtain deep features that an existing model has learned from tens of thousands of natural images, therefore the burden of training such a deep network from scratch is alleviated. We used an existing Xception network pretrained on the imagenet datasets [
25] and froze the hyperparameters of the feature extraction layers, leaving only the classification layers trainable (i.e., the global average pooling layer, the fully-connected layers and the logistic regression layer as marked in
Figure 3). These classification layers were trained on our augmented dataset using the stochastic gradient descent (SGD) optimizer with a slow learning rate of 0.0001 and a momentum of 0.9. We used such a slow learning rate because the network was already pretrained, the learning rate should be small enough to fine tune the network to suit the limited training data of zebrafish larvae.
3. Results
Thanks to the availability of public zebrafish larvae microscopic images, we can compare our approach with the published state-of-the-art machine learning methods based on the same training and test data. As explained in the Introduction Section, the strength of our method lies in the usage of a two-tier classification pipeline and the Xception network. To prove the advantages of the two-tier pipeline, we compare our method with a single-tier classification pipeline. To evaluate the effectiveness of the Xception network, we run a comparison with an existing method using other classical CNN models, including AlexNet, the Visual Geometry Group networks of 16 and 19 layers (VGG16 and VGG19) and GooLeNet [
24,
27,
28]. All these comparisons were conducted using the classification accuracy as the performance metric, i.e., Accuracy = (N
TP + N
TN)/N
all, where N
TP, N
TN and N
all denote the number of true positive, true negative, and all test samples respectively for each phenotype. Our networks were programmed with the Keras platform running on a server using NVIDIA TITAN X graphics processing unit (GPU). The training process took −200 min on the entire augmented training set and took −2 s on each test image.
3.1. Comparison with the State-of-the-Art Larva Phenotype Classification Method
In the previous study by Jeanray et al. [
20], they published the zebrafish larvae image dataset along with a supervised phenotype classification algorithm using a randomized trees classifier, which is a conventional machine learning method dedicatedly adapted to the zebrafish larvae images. They also used a two-tier classification strategy quite similar to ours, and therefore the major difference between our and their method is whether the deep learning approach was used. We refer Jeanray’s method as the state-of-the-art baseline method and conducted the comparison based on the same training images (as listed in
Table 2) and testing images (as listed in
Table 1).
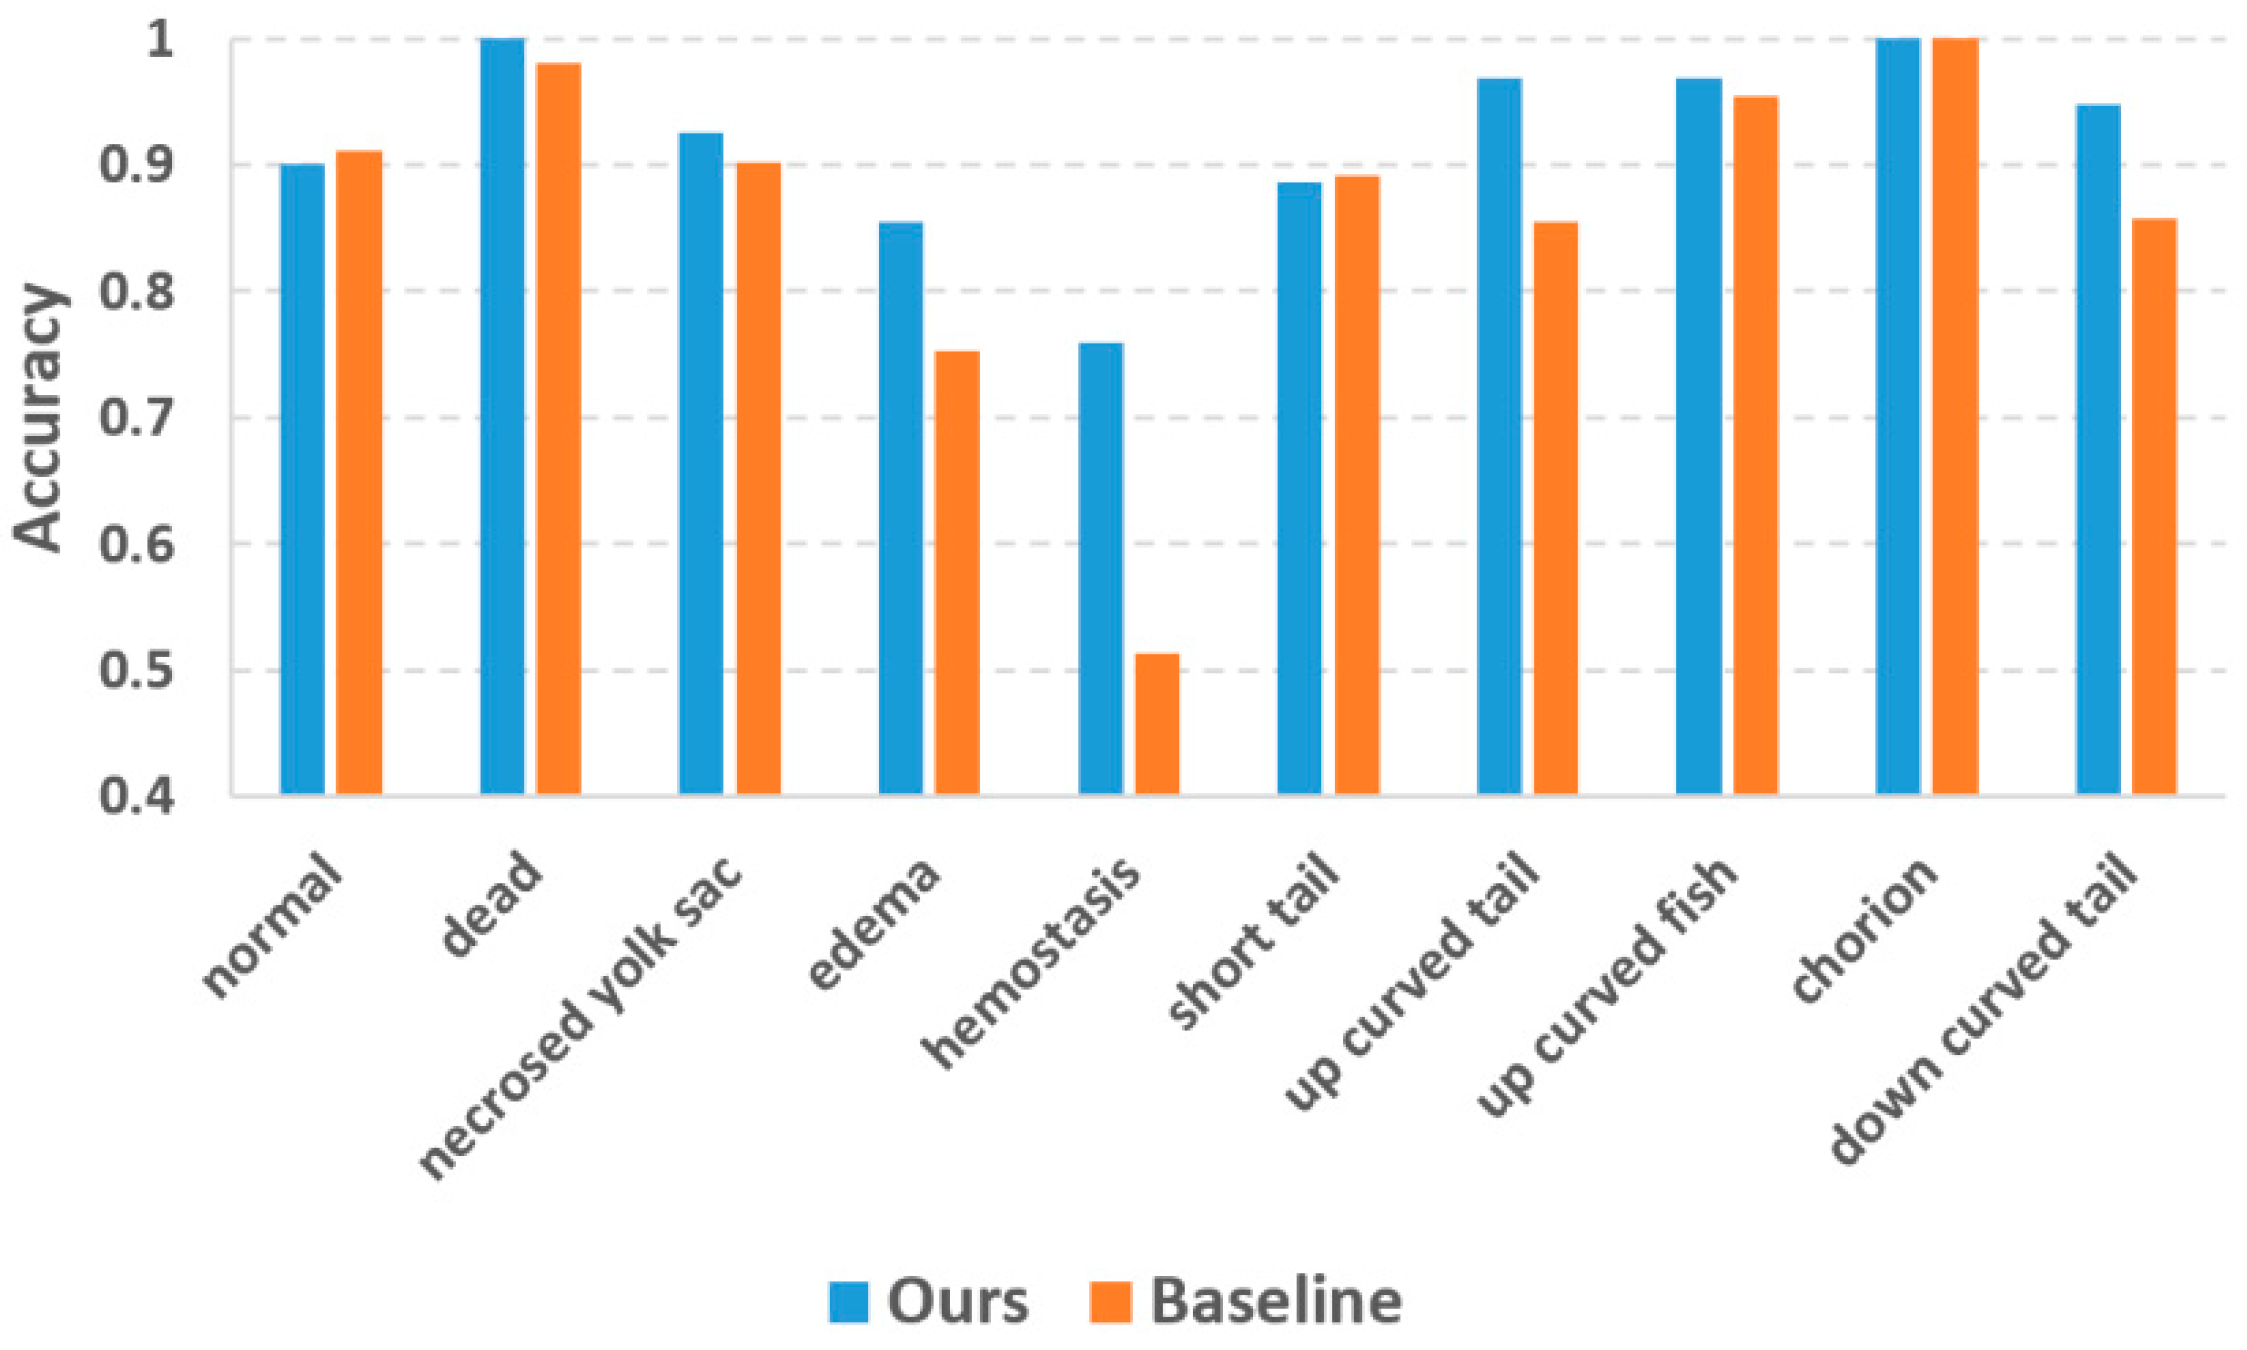
Figure 5 plots the classification accuracies of the two methods. The accuracy values of the baseline method were collected from Jeanray’s original paper [
20]. Our method achieved evident accuracy improvement over the baseline method for most phenotypes. For the phenotypes which are easy to recognize (dead and chorion), our method yielded an accuracy of 1.0 which is quite promising. Jeanray’s method also obtained accuracy over 0.95 for these phenotypes but did not reach 1.0. The biggest improvement is with hemostasis, for which our method obtained an accuracy of 0.73 vs. 0.51 of the baseline method. Normal and short tail are the two phenotypes for which our method yielded slightly lower accuracies than the baseline method, but the differences (0.010 and 0.005 for normal and short tail, respectively) were too small to be considered significant.
3.2. Comparison with the Single-Tier Classification Pipeline
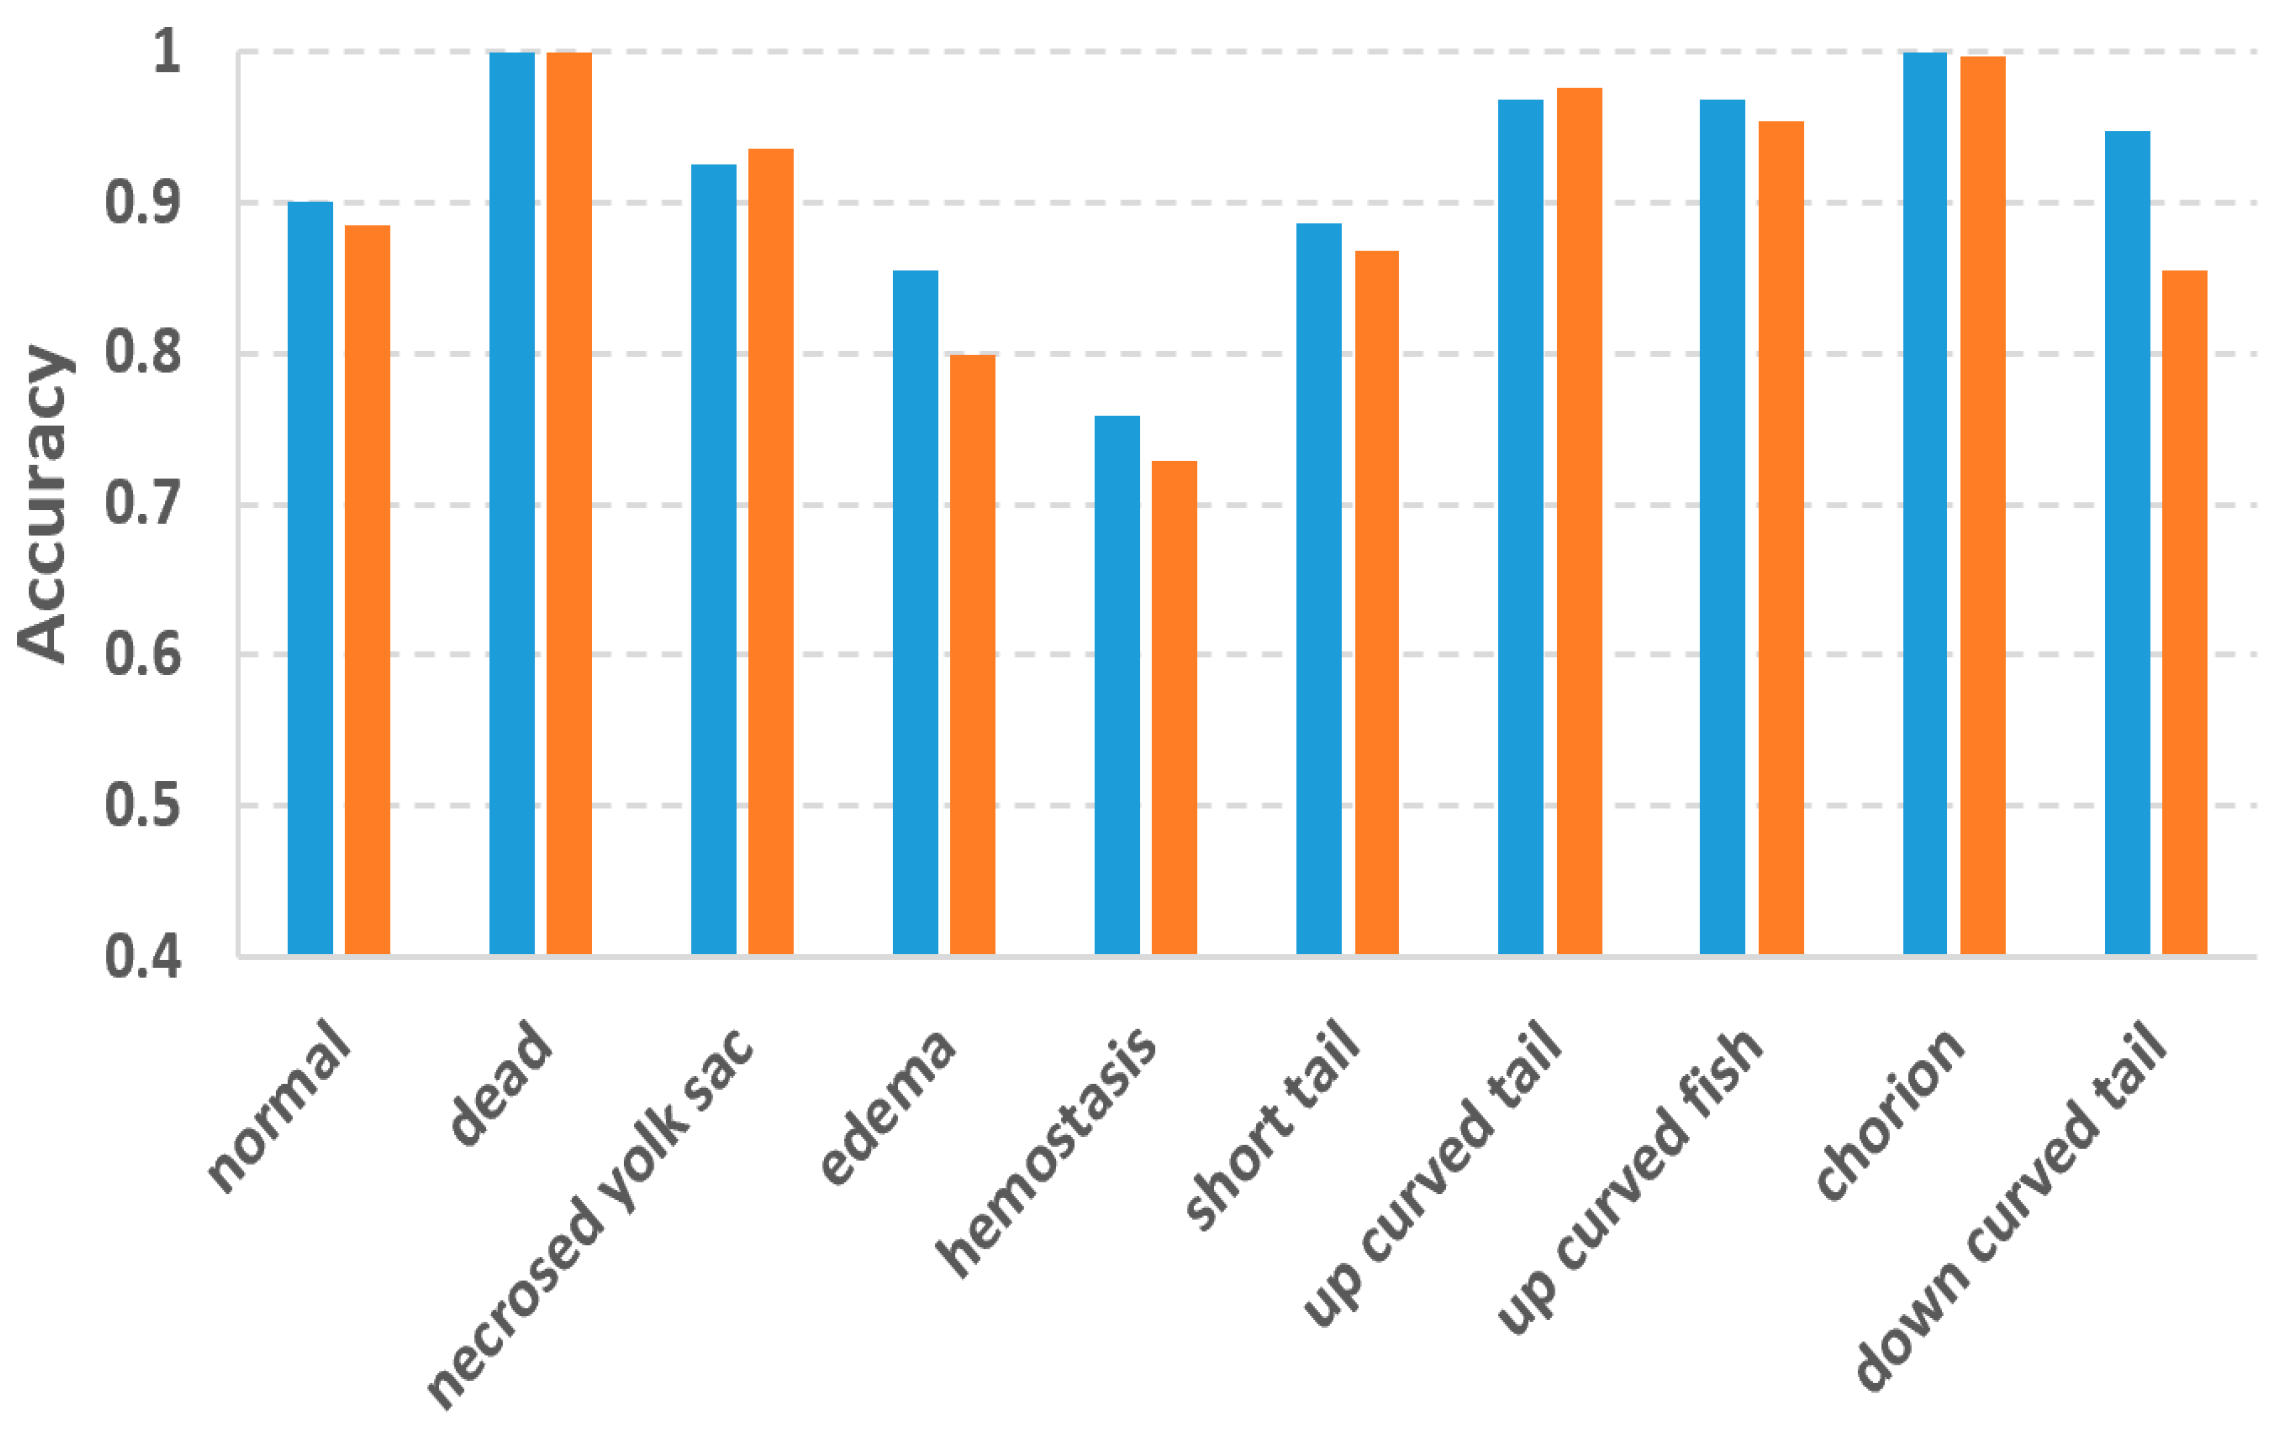
In this study, we used the two-tier pipeline to make the classifiers focus on the fuzzy phenotypes which are difficult to recognize. To evaluate the effectiveness of the two-tier pipeline, we also conducted phenotype classification based on a single-tier pipeline, in which 10 separated binary classifiers were trained for each of the 10 phenotypes. By doing so, each classifier has to recognize one phenotype from 10 phenotypes, which might be more difficult than recognizing one from eight as in the two-tier pipeline.
Figure 6 compares the accuracies of the two-tier vs. single-tier pipelines. It can be observed that although the two-tier pipeline does not outperform the single-tier pipeline for all the phenotypes, and it achieved much better accuracy for those difficult phenotypes including edema, hemostasis and down curved tail whose accuracies were improved by 0.06, 0.03 and 0.09, respectively.
3.3. Comparison with the Classical Convolutional Neural Network (CNN) Model
To validate the advantage of using the Xception network instead of a conventional CNN, we compare our method with an existing study using the classical CNN model [
19]. VGG16 is a widely used CNN model for image classification [
27]. Tyagi et al. fine tuned a pre-trained VGG16 model for zebrafish larvae microscopic image classification [
19]. Their experiments were also based on the same ground-truth dataset from the Jeanray group. In their experiment, the network was trained to classy different combinations of five, eight and all phenotypes, respectively. They aimed to validate the classicization performance for different numbers of target phenotypes. The combination of five phenotypes included hemostasis, necrosed yolk sac, edema, short tail and normal. The combination of eight phenotypes included the normal, dead, down-curved tail, chorion, up-curved tail, short tail, edema and necrosed yolk sac.
To conduct a fair comparison, we followed the same experiment setup of Tyagi et al. [
19] That is, our Xception network was also trained to classify the same combinations of five, eight and all phenotypes, respectively. The averaged classification accuracy of each combination is compared with Tyagi’s accuracy in
Table 3. For all the combinations, the Xception network resulted in better accuracy than the VGG16 network. When more phenotypes are included in the combination, the improvement of accuracy becomes larger. This result means that the Xception network is more suitable for multi-phenotype classification and better suits the multi-label nature of the zebrafish larvae.
Besides the VGG16-based method of Tyagi et al., we further compared our method with transfer learning using three other popular CNN models including AlexNet [
24], VGG19 [
27], and GoogLeNet [
28] which were all pretrained with the ImageNet data. For a fair comparison, these networks were also validated on the combinations of five, eight and all phenotypes, respectively. The validation results are reported in
Table 3 as well. For the five-phenotype combination, VGG19 achieved the best accuracy (0.88) while our Xception-based method yielded suboptimal accuracy (0.86). For both the eight- and all-phenotype combinations, our method was the most accurate.
4. Discussion
In this study, we take advantage of deep learning to classify zebrafish larvae phenotypes from brightfield microscopic images. We aim to solve the classification problems especially for those phenotypes with fuzzy class features. Based on the same training and testing data, Jeanray et al. had already developed a larvae phenotype classification method using the classical machine learning method [
20]. Their method provides a state-of-the-art baseline for our DL-based approach. The experimental results of
Figure 5 reveals that our deep-learning method outperforms the baseline method in terms of classification accuracy. Besides the accuracy improvement, the advantages of the deep-learning method also include the avoidance of designing hand-crafted image features. Jeanray et al. used image edge and sub-window intensity distribution as the image features, but these features may not be optimal for classifying some difficult phenotypes like edema and hemostasis. Our deep-learning approach automatically learns the crucial image features for phenotype classification. The deep-learning approach not only relieves the algorithm developers from the burden of image feature design but also automatically discovers the useful features which the human designers cannot conceive of. As a result, we observe dramatic accuracy improvement for the phenotypes with fuzzy class features, such as edema and hemostasis.
To address the scarce training data problem, we performed augmentation to the training data. We augmented different phenotypes with different scales to compensate for the imbalanced training data. As
Figure 5 reveals, this strategy decreased the inter-class accuracy differences compared to the baseline method using original training data. However, some phenotypes with too few original training samples (e.g., hemostasis) still have relatively lower accuracy than other phenotypes. This is because our augmentation process only implemented image shifting and rotation, its capacity to improve data variability is limited. For a future study, we will introduce more variations into the data augmentation step, such as non-linear image deformation and image contrast variations [
29].
To cope with the problems of fuzzy inter-class differences and multi-label issues, we used the two-tier classification pipeline. Experiment results proved the effectiveness of the two-tier strategy. Accuracy improvements against the single-tier pipeline were observed for the difficult classes like edema, hemostasis and down-curved tail. The improvements for these phenotypes are 0.06, 0.03 and 0.09, respectively. It is worth mentioning that Jeanray et al. also compared the two-tier and single-tier pipelines using their randomized tree classifier [
20]. However, their two-tier pipeline only improved the accuracy of edema and down-curved tail by 0.01 and 0.03, respectively, which are much less than our improvements. For hemostasis, their two-tier pipeline even resulted in a 0.03 decrease in accuracy. It is obvious that the advantage of the two-tier strategy is more obvious for our method, thanks to the superior classification ability of the DL models.
Currently, there are various types of DL models for image classification. We chose Xception as the classifier because of its small hyperparameter scale [
25]. Training a smaller network on scarce annotated data can potentially avoid the overfitting problem because larger networks are more flexible on data fitting and tend to overfit the limited training data. The conventional VGG16 network [
27] has over 138 million parameters which is much more than the 22 M parameters of the Xception network. As we compared our Xception-based approach with the VGG16-based approach [
19], an obvious improvement of classification accuracy was observed. More importantly, the improvement becomes bigger when more phenotypes are involved as the target classes. That means the VGG16 network has imperfect generalization ability for more classes. The Xception network successfully alleviated the overfitting issue without losing the accuracy of classification. Our study has explored an effective way to cope with scarce annotation data for biological image classification.
As we further compare our method with more CNN networks, it seems that deeper network tends to yield more accurate results. An intuitive explanation is that deeper networks are better at learning deep features from the large ImageNet dataset and thus performs better at transfer learning. However, the Xception network that we use is not the deepest, but it yielded the most accurate results for eight- and all-phenotype combination tests. This might be attributed to the residual connections (i.e., the shortcut connections of 1 × 1 convolution in
Figure 3) which does not exist in AlexNet, VGG16, VGG19 or GoogleNet. As demonstrated in the original paper of the Xception network [
25], such a residual connection is essential for increasing the classification accuracy since it improved the convergence performance on a large pretraining dataset and helped the network to learn more distinctive image features for transfer learning.
As a limitation of this study, we only tested our method on a publicly available dataset. However, the appearance of zebrafish larvae microscopic images may vary between institutes, acquisition devices and sample preparation procedures. It is important to test our method with more diverse datasets. Moreover, our method also needs to be implemented in an on-site experimental environment to produce real-time classification results. Fortunately, the Xception model has small file size which can be implemented easily in embedded operating systems.


