1. Introduction
Trace gas detection techniques play an important role in the fields of environment, industry, aerospace, and medical technology [
1,
2,
3,
4,
5]. Various optical sensing methods for atmospheric monitoring have been reported by numerous researchers [
6,
7,
8,
9,
10]. Compared with other optical spectroscopic techniques, photoacoustic spectroscopy (PAS) technology is one of the most effective approaches for trace gas sensing, in which a microphone is employed to detect acoustic signals generated by the modulated optical radiation in a weakly absorbing gas [
11,
12,
13]. PAS technology has many advantages, such as wavelength independence and zero-background signal. However, the wideband-microphone based PAS system is sensitive to environmental noise and gas flow noise due to the low resonance frequency of photoacoustic cell. Quartz-enhanced photoacoustic spectroscopy (QEPAS), a variant of PAS, employs a low-cost and small-size quartz tuning fork (QTF) as a sharply resonant acoustic transducer to sense the weak light-induced sound wave. QEPAS has been widely used for detecting trace gas since its first demonstration in 2002 [
14,
15,
16,
17,
18,
19,
20,
21]. It combines the main merits of conventional PAS with the advantages of a standard QTF which has a high resonance frequency and narrow resonance width, providing a robust, compact and reliable spectrophone. To improve the photoacoustic signal, some architectures of QTF-based spectrophones have been modified and successfully applied to QEPAS system, such as multi-quartz-enhanced photoacoustic spectroscopy sensors (M-QEPAS) [
22], single-tube on-beam QEPAS sensors (SO-QEPAS) [
23], and intracavity QEPAS sensors (I-QEPAS) [
24].
In most QEPAS sensors, commercially available standard QTFs are usually used as acoustic transducer. The 32.7-kHz standard QTF with a quality factor about 10,000 has a spacing of 300 µm between the QTF prongs and a prong length of 3.8 mm. Therefore, in order to pass through the QTF prong spacing without being blocked, the laser beam with a diameter less than 300 µm is required at the center of the QTF gap.
Considering that the photoacoustic signal from QEPAS system is proportional to the number of gas molecules which are excited to a high energy state by absorbing photons from an excitation source in unit time, the inner surface areas of the QTF prongs are underutilized with such a small circular laser spot. A circular laser beam creates a longitudinal (cylindrical) pressure source, whose geometry does not match well the geometry of the tuning fork prongs. In other words, the overlap integral between the excitation source and the inner surface of the prongs is very low. Hence some measures for optical beam shaping can be implemented to improve the area utilization ratio of the QTF prongs’ inner surfaces and create a sound pressure source with a geometry matching more closely to the inner surface of the prongs. To date, three common methods which can transform a circular spot into a strip spot have been reported. The first method employs a Digital Micromirror Device (DMD) which consists of a highly reflective aluminum micromirror array [
25,
26]. By operating with this method, the required light is reflected by the micromirror device and the unnecessary light can be absorbed by a laser absorber. In addition, the direction of its illumination is achieved by controlling the angle of the micromirror by means of electrostatic action. In the second approach, plano-convex cylindrical lenses were equipped to convert a circular beam spot into a strip spot, or change the height of the laser beam without changing the beam width [
27]. However, the laser beam shaped by these two methods has a large central hotspot and faded edge distribution. Especially for laser beams with small size, they have a poor shaping ability. Therefore, more focusing lenses and shaping devices are needed to improve the beam quality. To address these issues, a third method has been proposed, in which a Powell lens is used for spatial beam shaping [
28,
29]. Compared with the former two beam shaping elements, a Powell lens is a more sophisticated optical scribing prism, which can transform the circular laser spot into a straight line with more uniform optical density, better stability and linearity. The relevant principles of Powell lenses are described in the following section.
A distinct advantage of the QEPAS technique is the linear relationship between the sensitivity and the incident laser power, which allows the performance of QEPAS based sensors to benefit from the novel high-power excitation laser source. Up to now, high-power laser and ultra-fast pulse laser have become the future trends with the development of laser techniques, such as high-power laser diodes (LD), light emitting diodes (LED) and high energy pulsed terahertz (THz) lasers. In order to improve the lateral mode and restrict the carriers in both directions parallel and perpendicular to the PN (positive-negative) junction plane so as to enhance the optical gain, the strip structure is manufactured and applied to some high-power lasers resulting in a stripe laser spot [
30]. In the traditional QEPAS system, these stripe spot require a pair of wedge prisms or other complex shaping systems to converge the laser beam into a circular spot with small size to pass through the gap of QTF, resulting in the complexity of the QEPAS system and insufficient utilization of the QTF inner surface.
In this work, we report a QEPAS sensor based on a Powell lens to compare the effect of circular beam and strip beam illuminating the QTF prong spacing. Resulting from the strip laser spot which is shaped by Powell lens to make the inner surface areas of the QTF prongs be fully exploited, a better QEPAS signal can be obtained. In addition, the work verified the feasibility of the combination of the QEPAS technique and the diverging laser sources or light sources with broad emitting stripes, which means that we do not need to waste excessive time and money in circularizing laser beams. This result provides the premise for the application of QEPAS sensors based on novel laser sources with a strip laser beam.
2. Experimental Section
2.1. Beam Shaping for Strip Laser Spot
In order to obtain a uniform strip laser spot, a Powell lens with a prism fan angle of 10° was coupled to the QEPAS sensing system as a beam shaping element. Differing from plano-convex cylindrical lens, Powell lens has a complex two-dimensional aspheric top surface. A slew of spherical aberrations is generated when the laser beam passes through the prism, then the optical path is redistributed which reduces the beam distribution in the center and increases it in the edges, thus forming a uniform strip laser spot. Therefore, the divergent light in the center of the Gaussian beam can be effectively eliminated after beam shaping by the Powell lens.
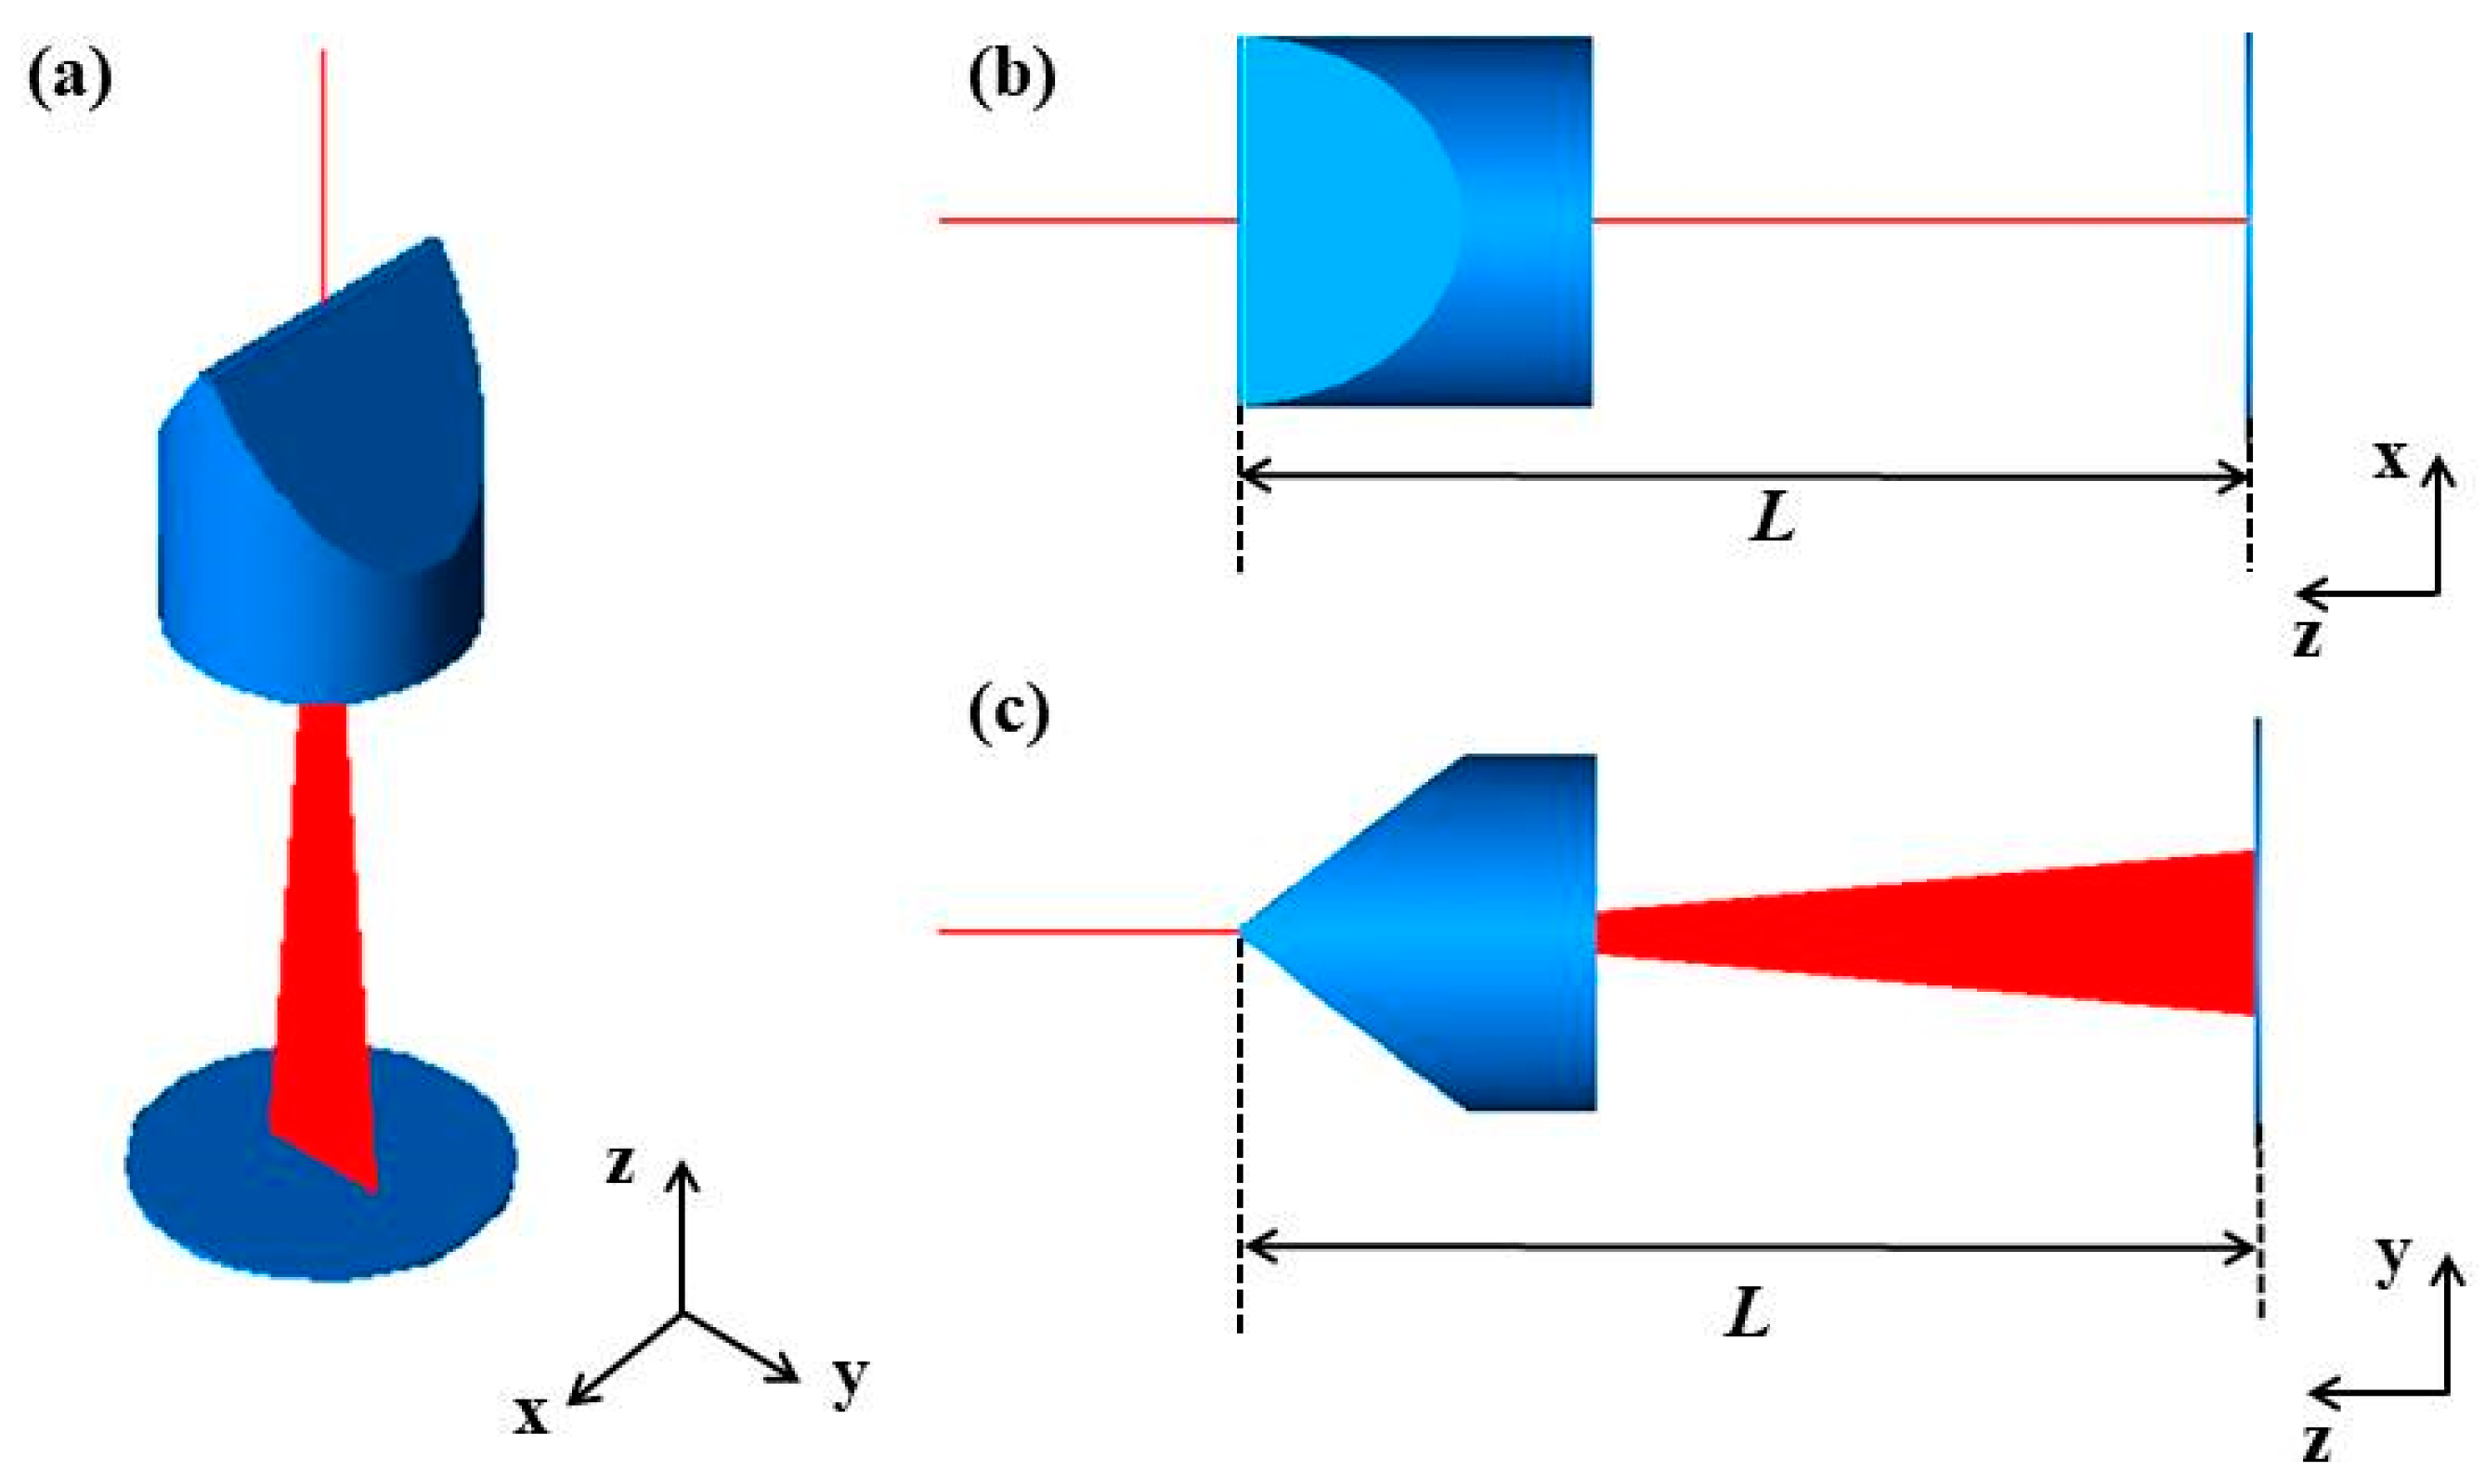
The beam propagation path in a Powell lens is schematically simulated by TRACEPRO software as shown in
Figure 1a–c. When a collimated laser beam passes through the arc-shaped edge at the top of the Powell lens, the incident beam is refracted. The refraction angle is mainly determined by the angle formed by the two prism surfaces. Finally, the second refraction occurs when it passes through the exit surface. The entire outgoing beam forms a fan-shaped light curtain.
In terms of lens structure, such a Powell lens has a cylindrical surface defined by a base curve in the shape of an angle with a rounded apex. The curvature radius of the cylindrical surface thus decreases in the center and increases smoothly towards both ends. As described in the previous papers [
31], the cylindrical surface can be fitted to a base curve by the following Equation:
where c is the curvature constant, r is the radial coordinate in the length direction of the lens, and k is the conic coefficient (the conic coefficient value is less than −1 for hyperbola, −1 for parabola, −1–0 for ellipses, and 0 for spheres). When the curvature radius and the conic coefficient value of the surface change, the curve shape of the partial top surface is different.
In addition, the prism fan angle is also a key parameter of the Powell lens of which the width is a function of the refractive index of material and the angle formed by the two prism surfaces. The fan angle represents the divergence of outgoing beam after passing through Powell lenses with different curvature radius and cone coefficients. As the divergence angle increases, a longer linear effective length can be obtained within a certain working distance. In our experiments, a Powell lens with a divergence angle of 10° was used in order to obtain a stripe spot with appropriate size.
For the purpose of optimal shaping result, a Powell lens with a transmittance of 94% was placed 2 cm behind the fiber collimator. In addition, a strip slit was used to filter the lateral divergent light and the distance
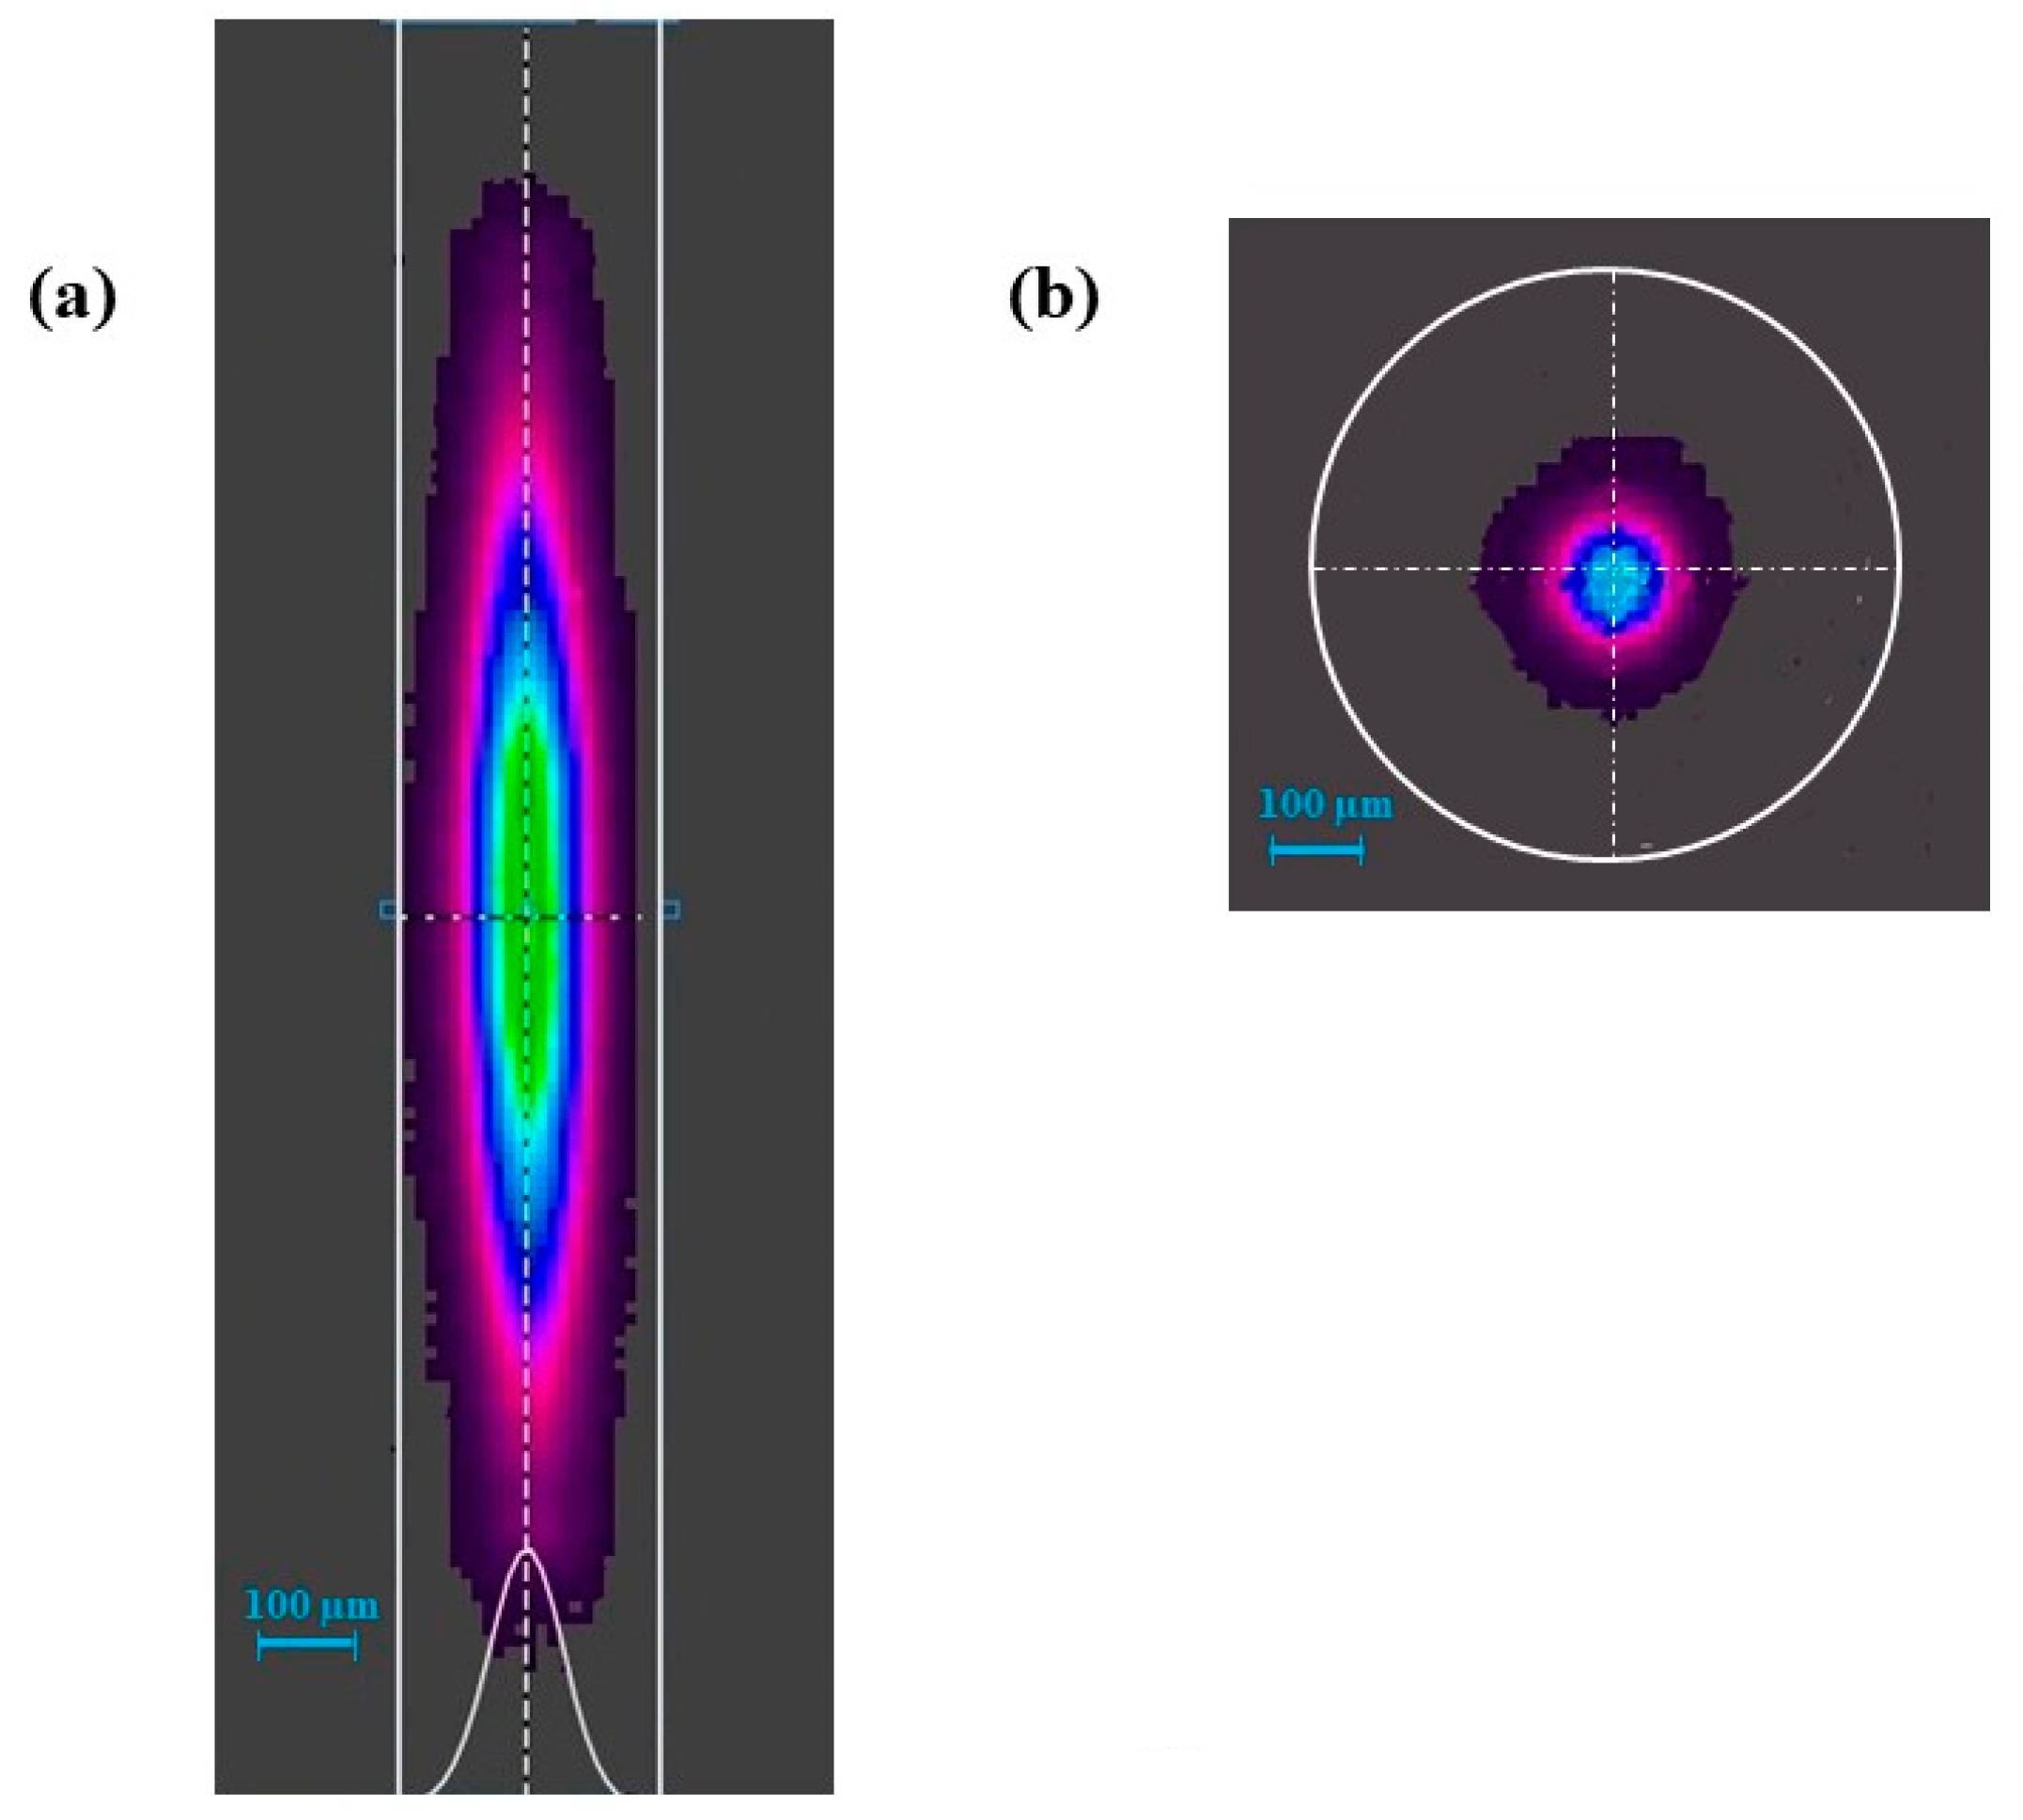
L between the Powell lens and the slit was 5.4 cm. Since the spot diameter of laser beam entering the Powell lens is less than 250 µm, the outgoing laser beam was not a perfect strip laser, but an elliptical beam. As shown in
Figure 2a, the final elliptical spot was observed by a Pyrocam IIIHR Beam Profiling Camera. The major axis length and minor axis length of the elliptical spot was 2.5 mm and 280 µm, hence it could match the prong spacing (300 µm) of a standard QTF. In comparison, the original circular spot observed at the same position which was 8.7 cm from the fiber collimator without beam shaping was shown in
Figure 2b.The diameter of the circular spot is 247 µm which means that the spot area is only 1/10 of the elliptical spot area, resulting in a significant reduction of the excited gas molecules.
2.2. COMSOL Simulation Analysis
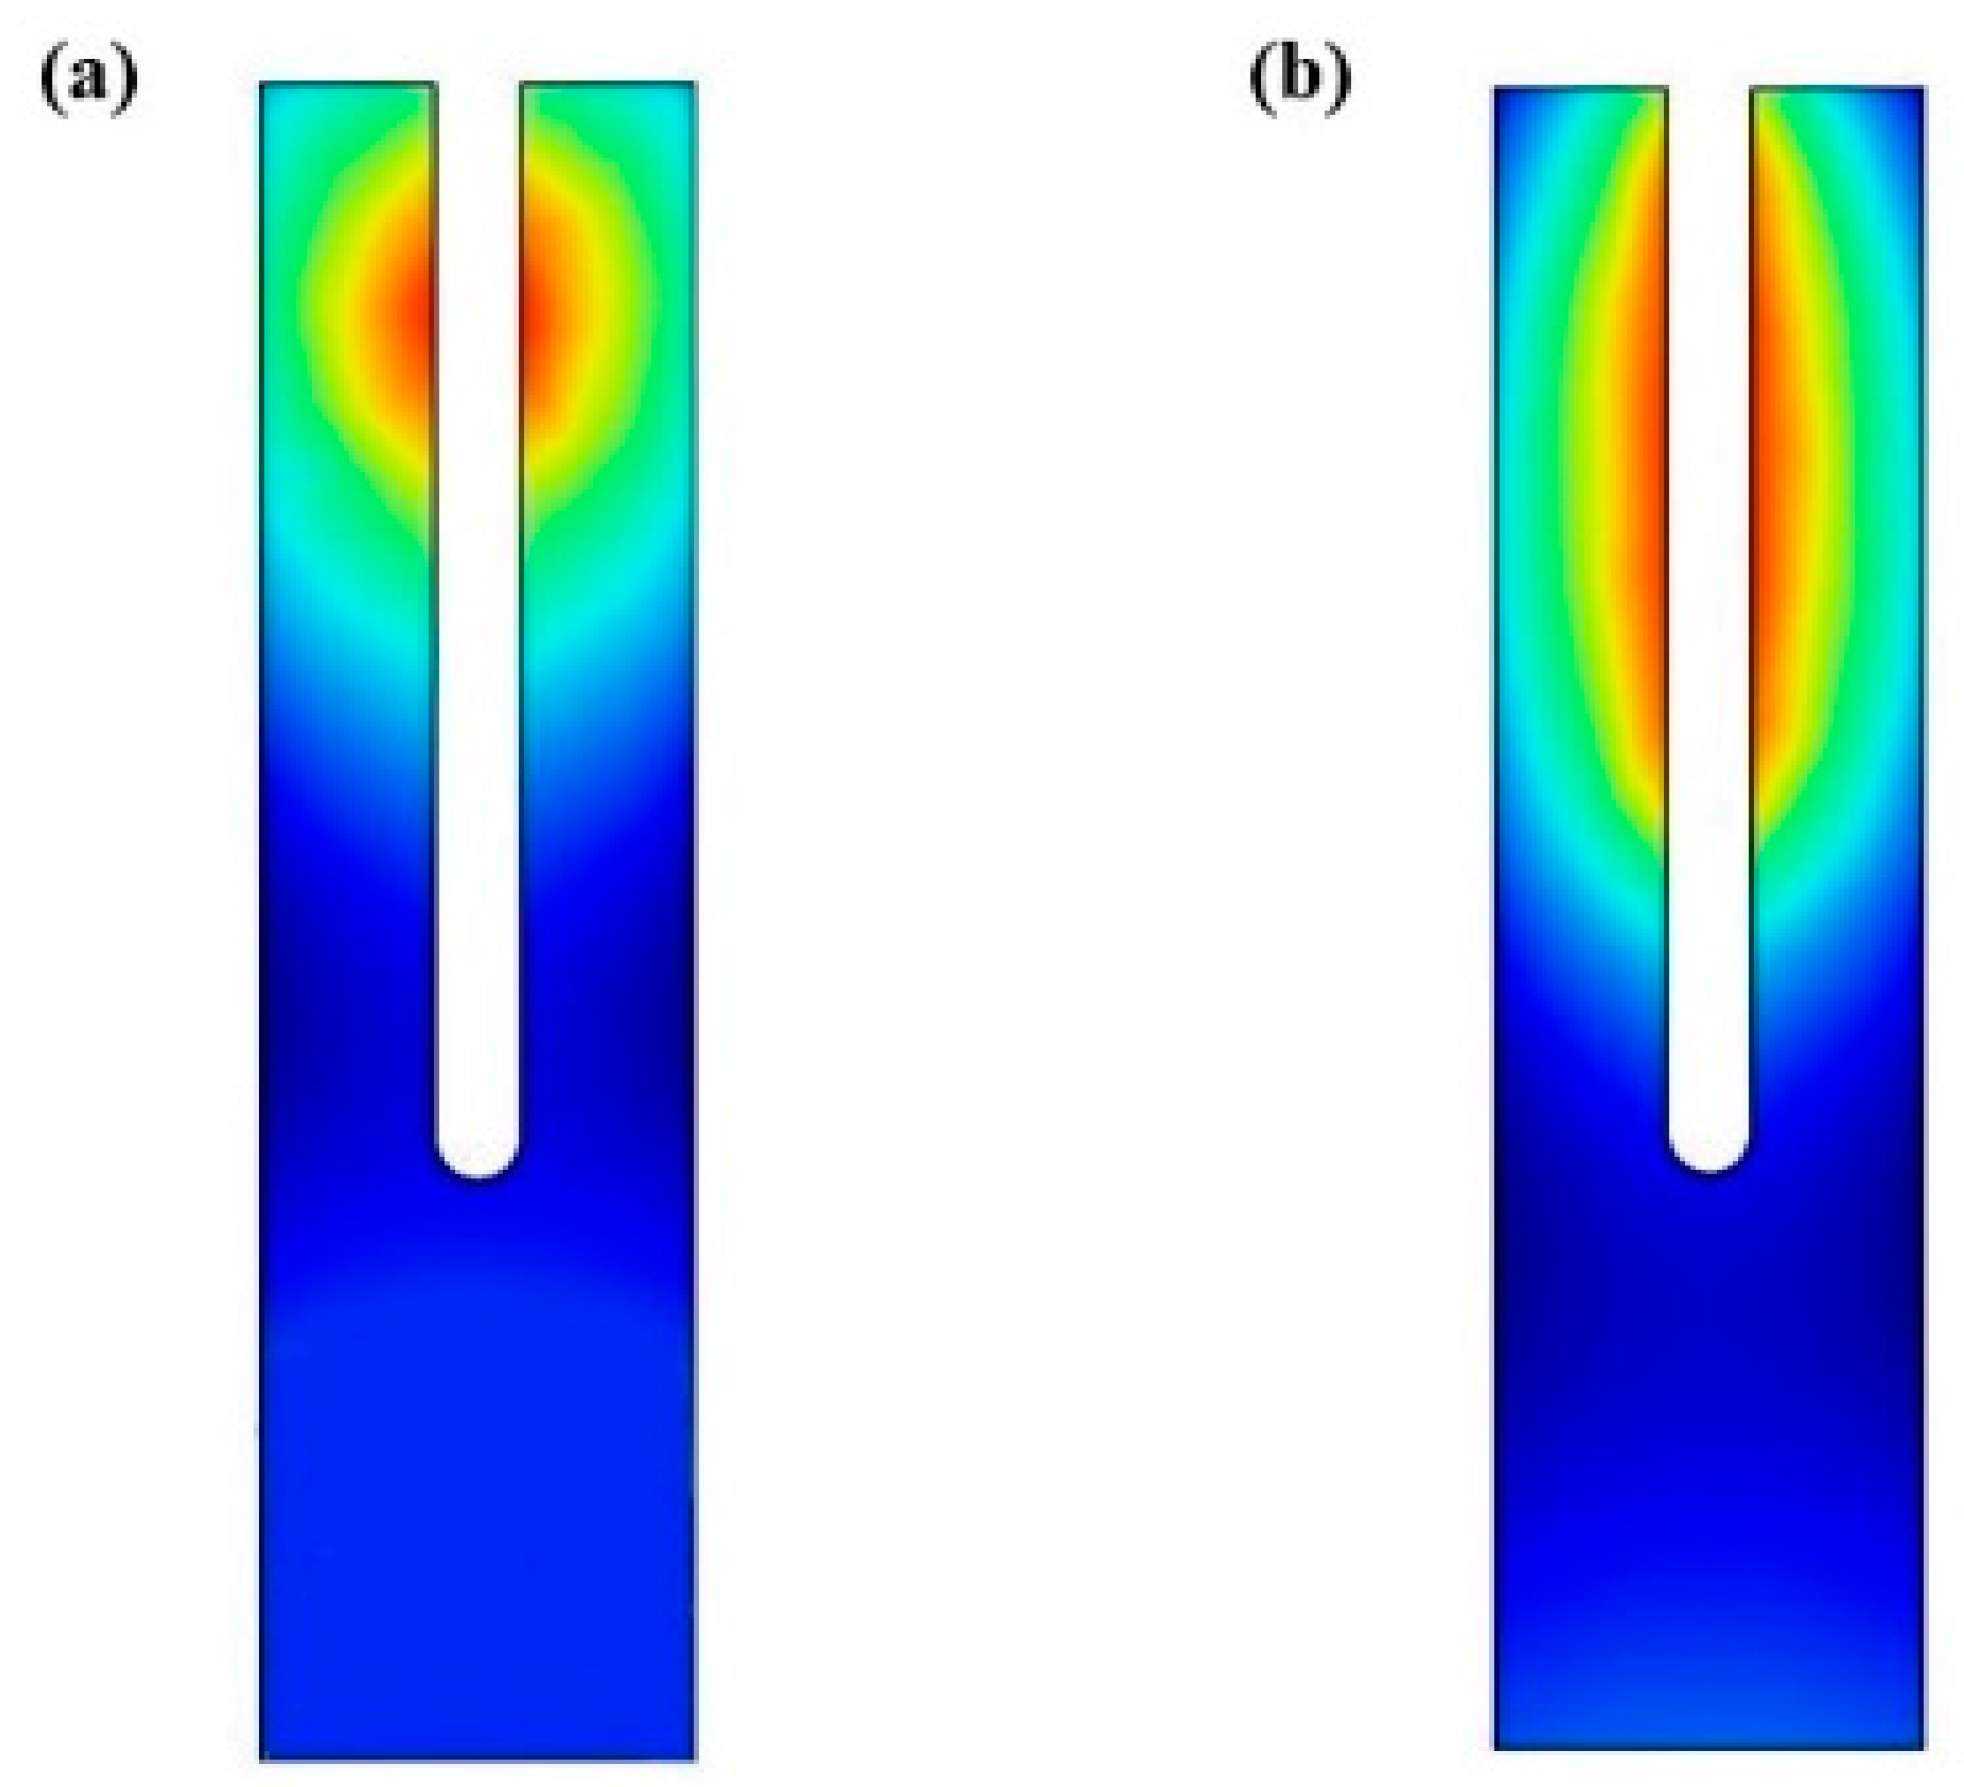
The COMSOL Multiphysics software based on the finite element analysis method (FEM) was used to simulate the response of a QTF to sound waves. The initial pressure distribution on the QTF prongs with the elliptical spot and the circular spot was shown in
Figure 3a,b. As the pressure distribution is a propagating wave, the pressure gradually decreases from the inner surface to the outer surface of the vibrating prongs.
The geometric parameters of QTF model in this simulation are consistent with the standard commercial QTFs which has the prong length of 3.8 mm, width of 0.6 mm, thickness of 0.15 mm, and prong spacing of 0.3 mm. The acoustics module and acoustics solid interaction module was invoked to investigate the sound pressure distribution on the QTF prongs. Quartz LH (1978 IEEE) was selected as the component material of the QTF and the boundary layer of the air domain was a perfectly matched layer. In addition, the QTF bottom end was set as a fixed constraint and the QTF prongs can vibrate freely.
The sound pressure distribution is depicted with different colors, reaching from high pressures (red) to low pressures (blue). For a circular spot, as shown in
Figure 3a, the sound pressure is strongest at the optimal position of which the distance between the center of circular spot and QTF tips is 0.9 mm based on previously reported literature [
32].
The distribution of the sound field on the QTF prongs is well consistent with the expected behavior. The size of the elliptical spot shaped by the Powell lens is larger than the circular spot, resulting in an increasing area of interaction between the acoustic wave and QTF which can be observed in
Figure 3b. Although partial acoustic leakage is inevitable due to the opening structure at the top of QTF prongs, sound pressure has a strong distribution in a strip region on the inner surface of QTF prongs resulting from the relatively large spot size.
3. Experimental Section
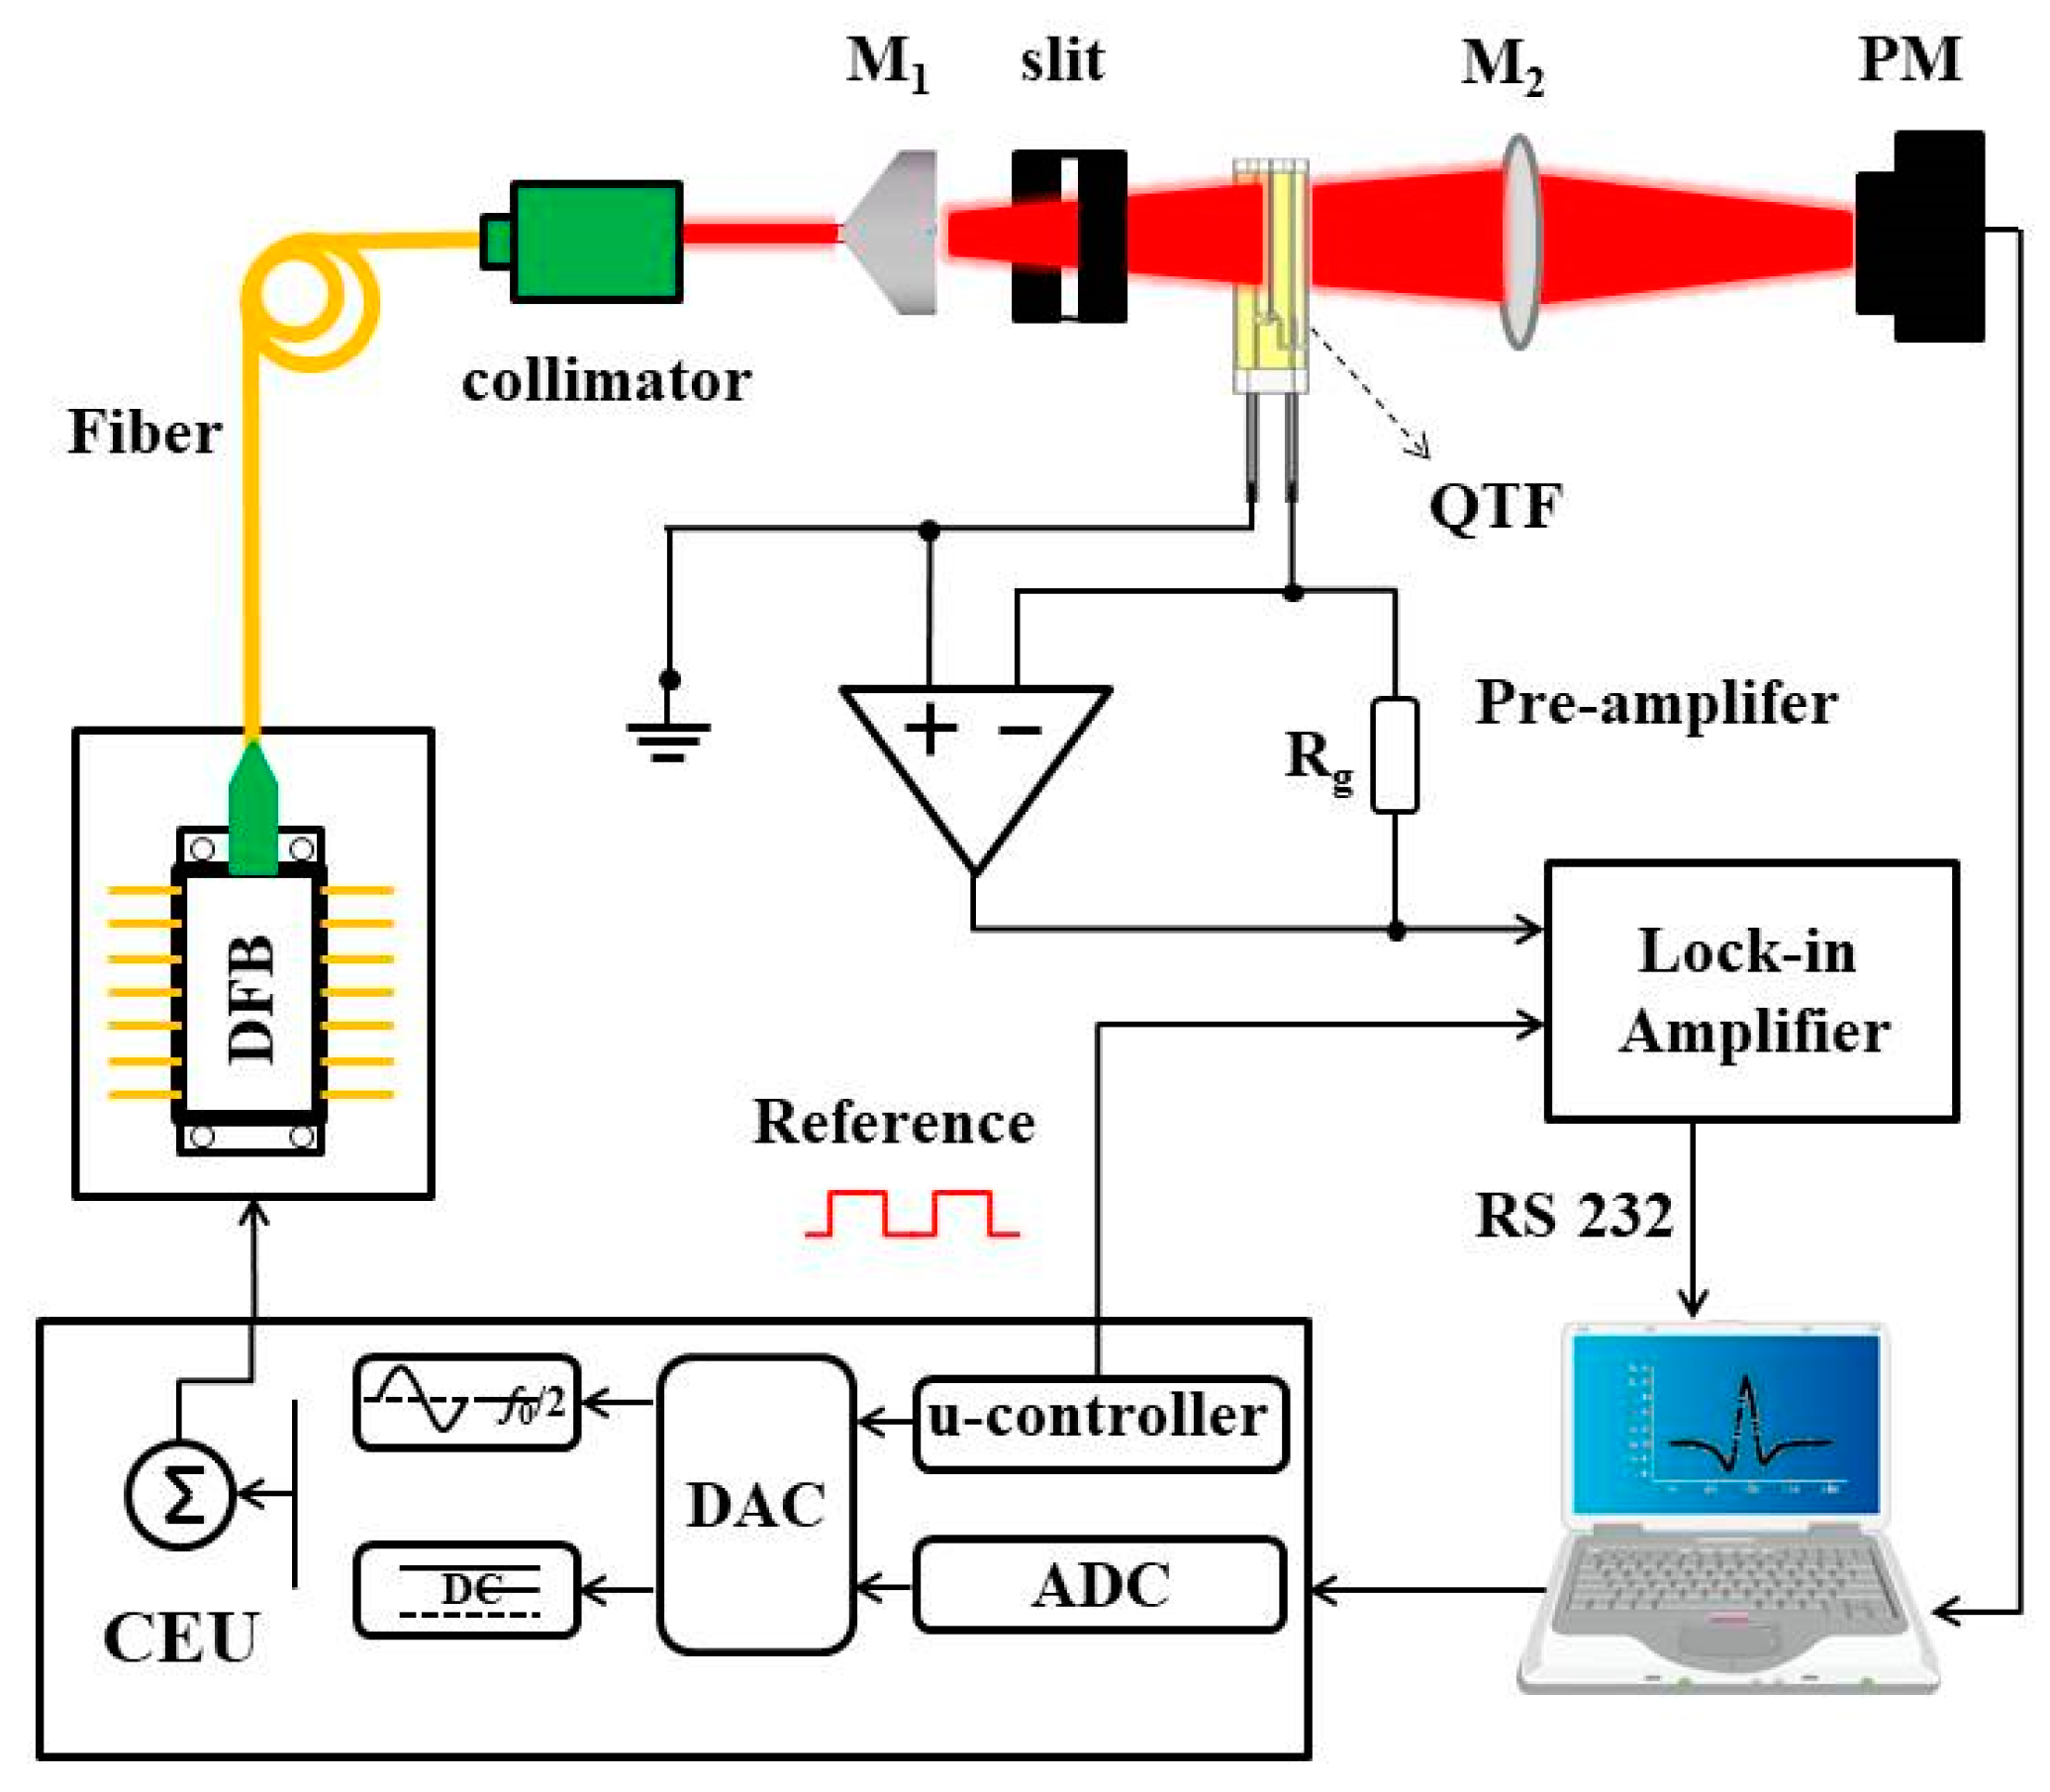
A schematic configuration of the experimental setup is depicted in
Figure 4. A fiber-coupled distributed feedback (DFB) diode laser (WSLS-136813C1424-01) with a center wavelength of 1368 nm was employed as the QEPAS excitation laser source. The temperature and current of the diode laser were controlled to tune the laser central wavelength by means of a customized control electronics unit (CEU). The laser beam was collimated by a fiber-coupled collimator (OZ optics Ltd. Model LPC-01), which produced a parallel beam with 250-µm spot diameter. The circular laser beam was longitudinally expanded to form an elliptical beam by using a Powell lens with a fan angle of 10°, so that most of the inner surface areas of the QTF prongs can be fully utilized. A strip slit was used to filter the lateral divergent laser for avoiding unwanted photothermal noise signal.
The photoacoustic signal was collected and detected by a 32.7-kHz standard QTF. The distance between the QTF and slit was fixed to be 1.3 cm to ensure the match between the elliptical beam spot and the QTF prong spacing. In this paper, 2f wavelength modulation spectroscopy (2f-WMS) detection technique was used to modulate the laser current by adding a high frequency sinusoidal modulation signal (half of the QTF resonance frequency).
The electrical signal generated from the piezoelectric effect of QTF was amplified by a low noise custom trans-impedance amplifier with a 10-MΩ feedback resistor. The signal was then measured and demodulated by a lock-in amplifier (LIA) (Stanford Research Systems, model SR830) in 2f mode with the synchronous reference signal provided by the CEU. For all measurements in this work, the time constant and slope filter of this LIA were 300 ms and 12 dB/oct, resulting in a 0.833-Hz detection bandwidth. The power meter was placed behind the QTF to monitor the laser power and facilitate the beam alignment. Measurement control and data processing was done by LabView software and a PC.
In order to assess the performance of the QEPAS based system, water vapor was selected as the target detection gas. The H
2O concentration in the laboratory environment was measured as 1.324% with a concentration fluctuation below 5% by a humidity detector (Taitan T68T). A H
2O absorption line located at 7306.75 cm
−1 with a line intensity of 1.787 × 10
−20 cm/mol was selected according to the HITRAN database [
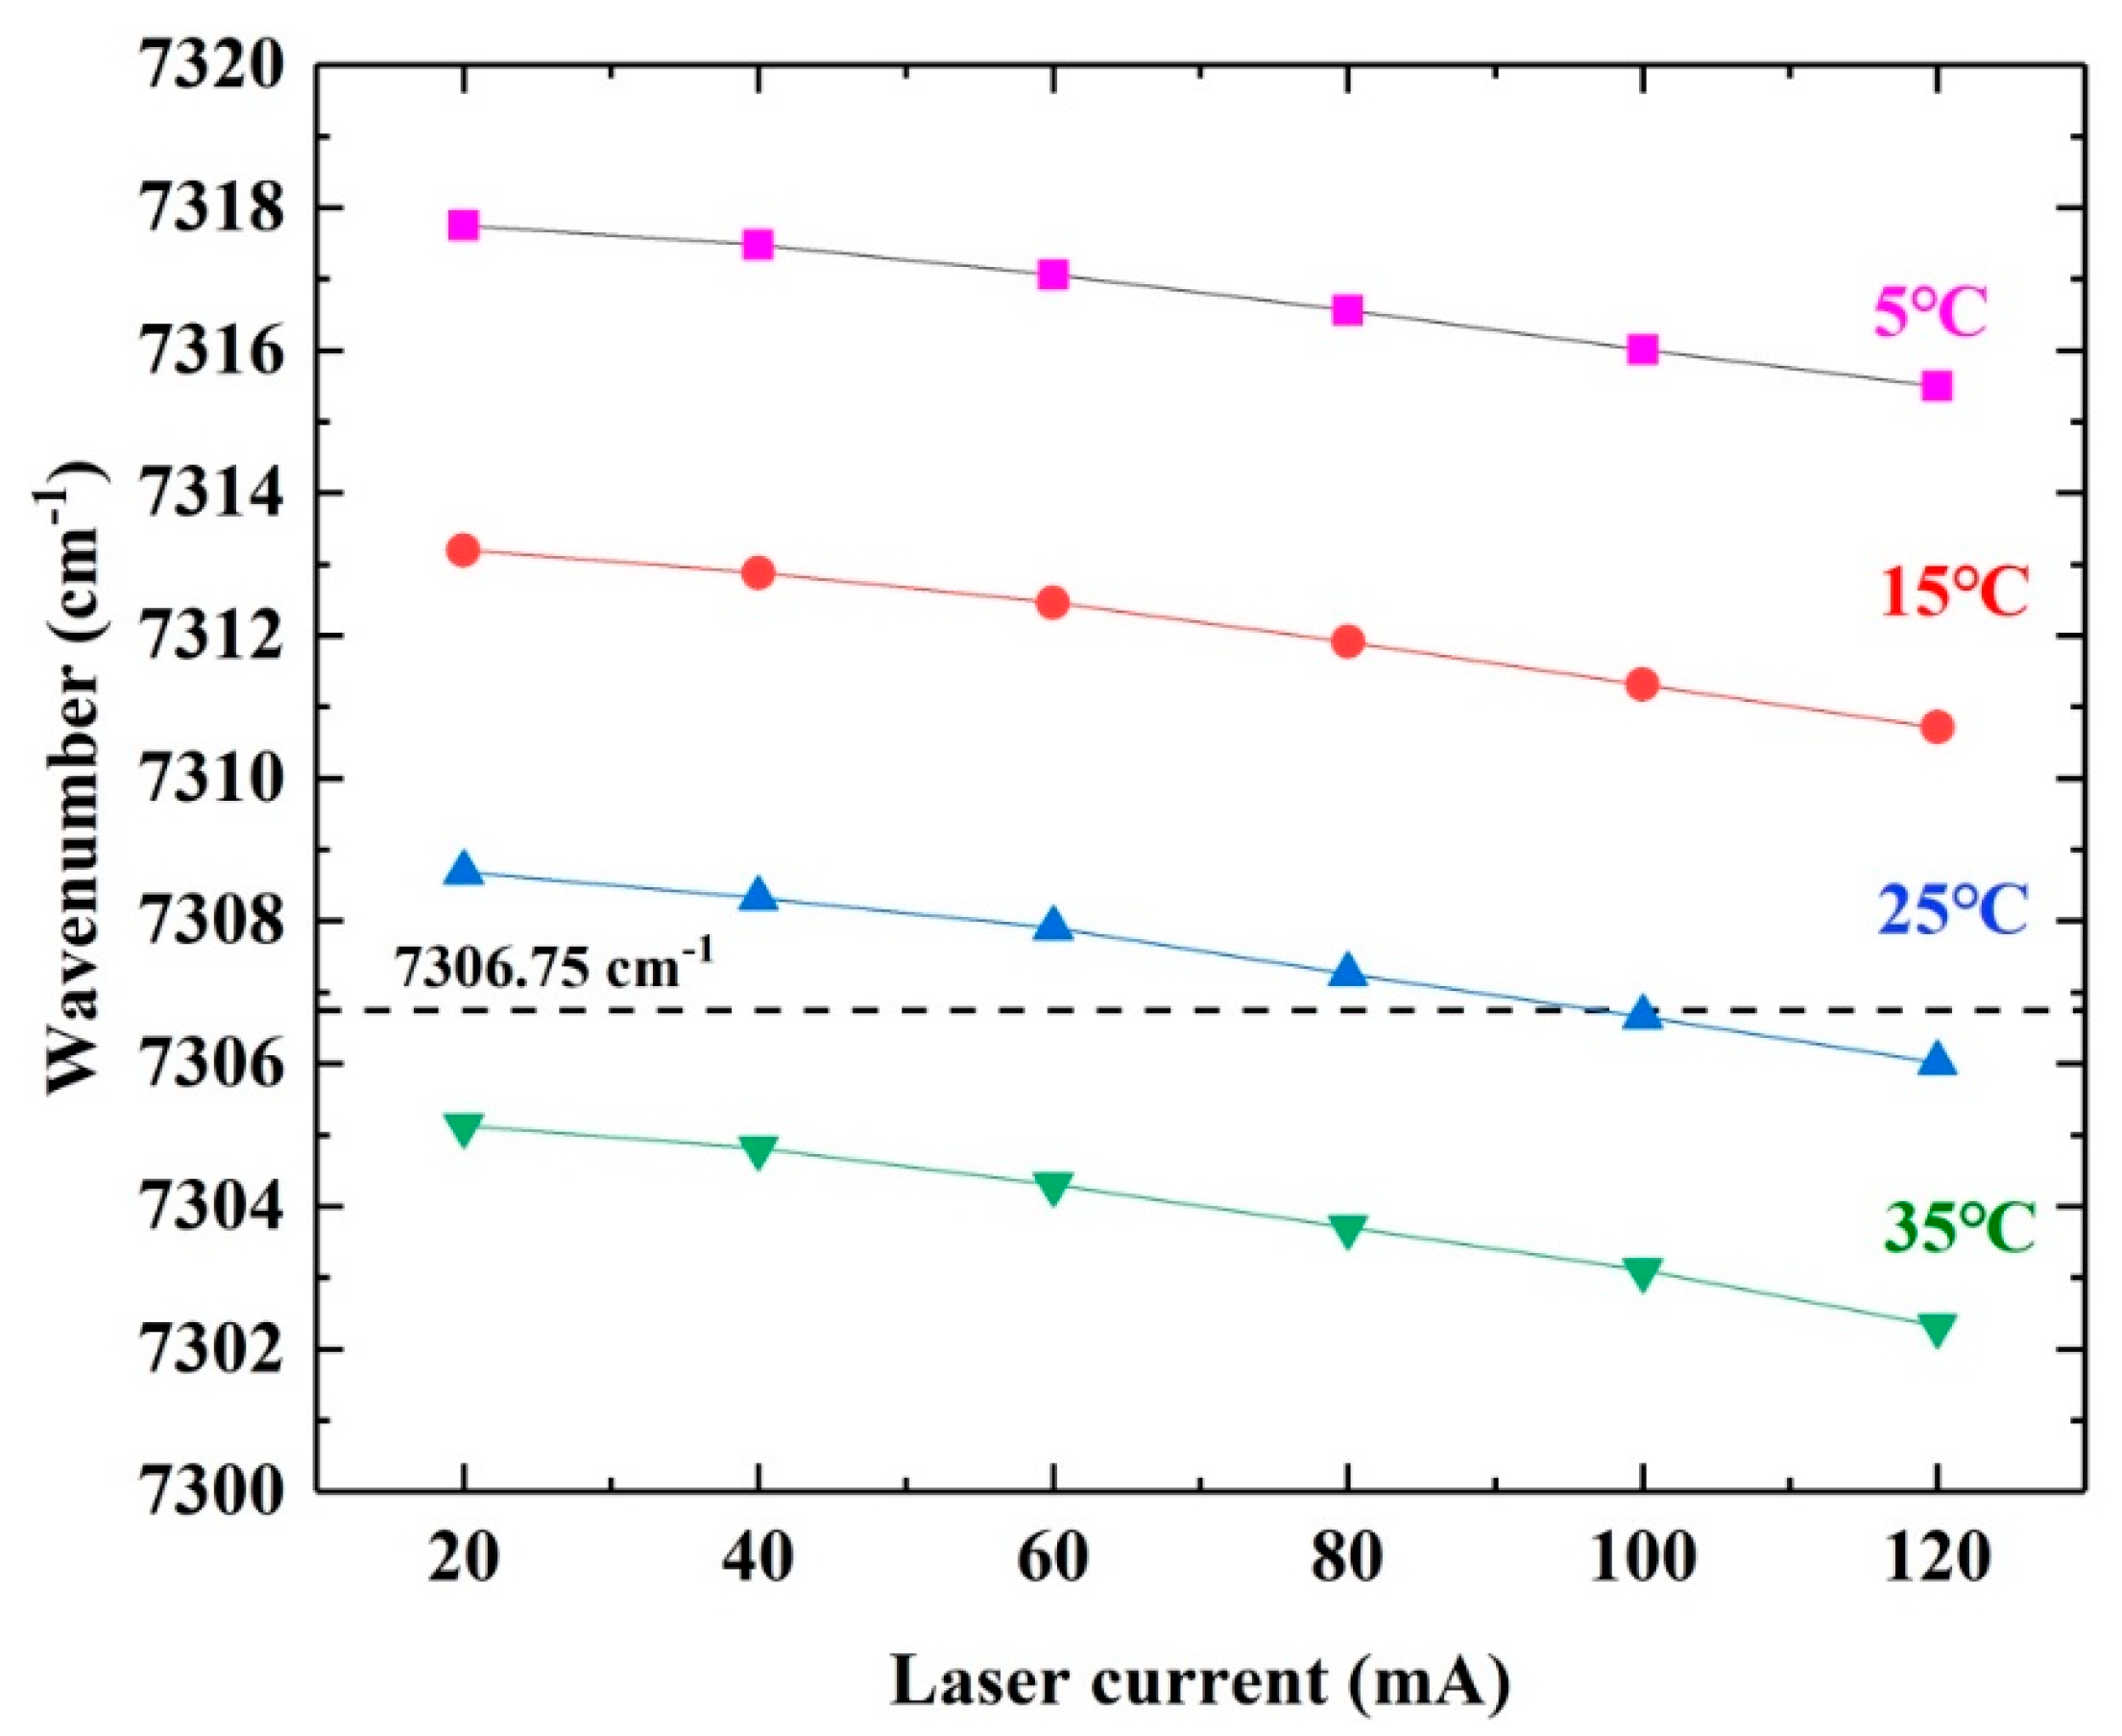
33]. The output wavelength of the DFB diode laser was measured using a Fourier transform infrared (FTIR) spectrometer (Thermo Fisher Scientific Model Nicolet IS50) as shown in
Figure 5. The output wavelength was tuned from 7305 cm
−1 to 7308 cm
−1 by scanning the laser current from 80 mA to 120 mA at the temperature of 25 °C, covering the selected H
2O absorption line which was represented by a dashed black line.
4. Results and Discussion
The H
2O concentration detection was based on a 2
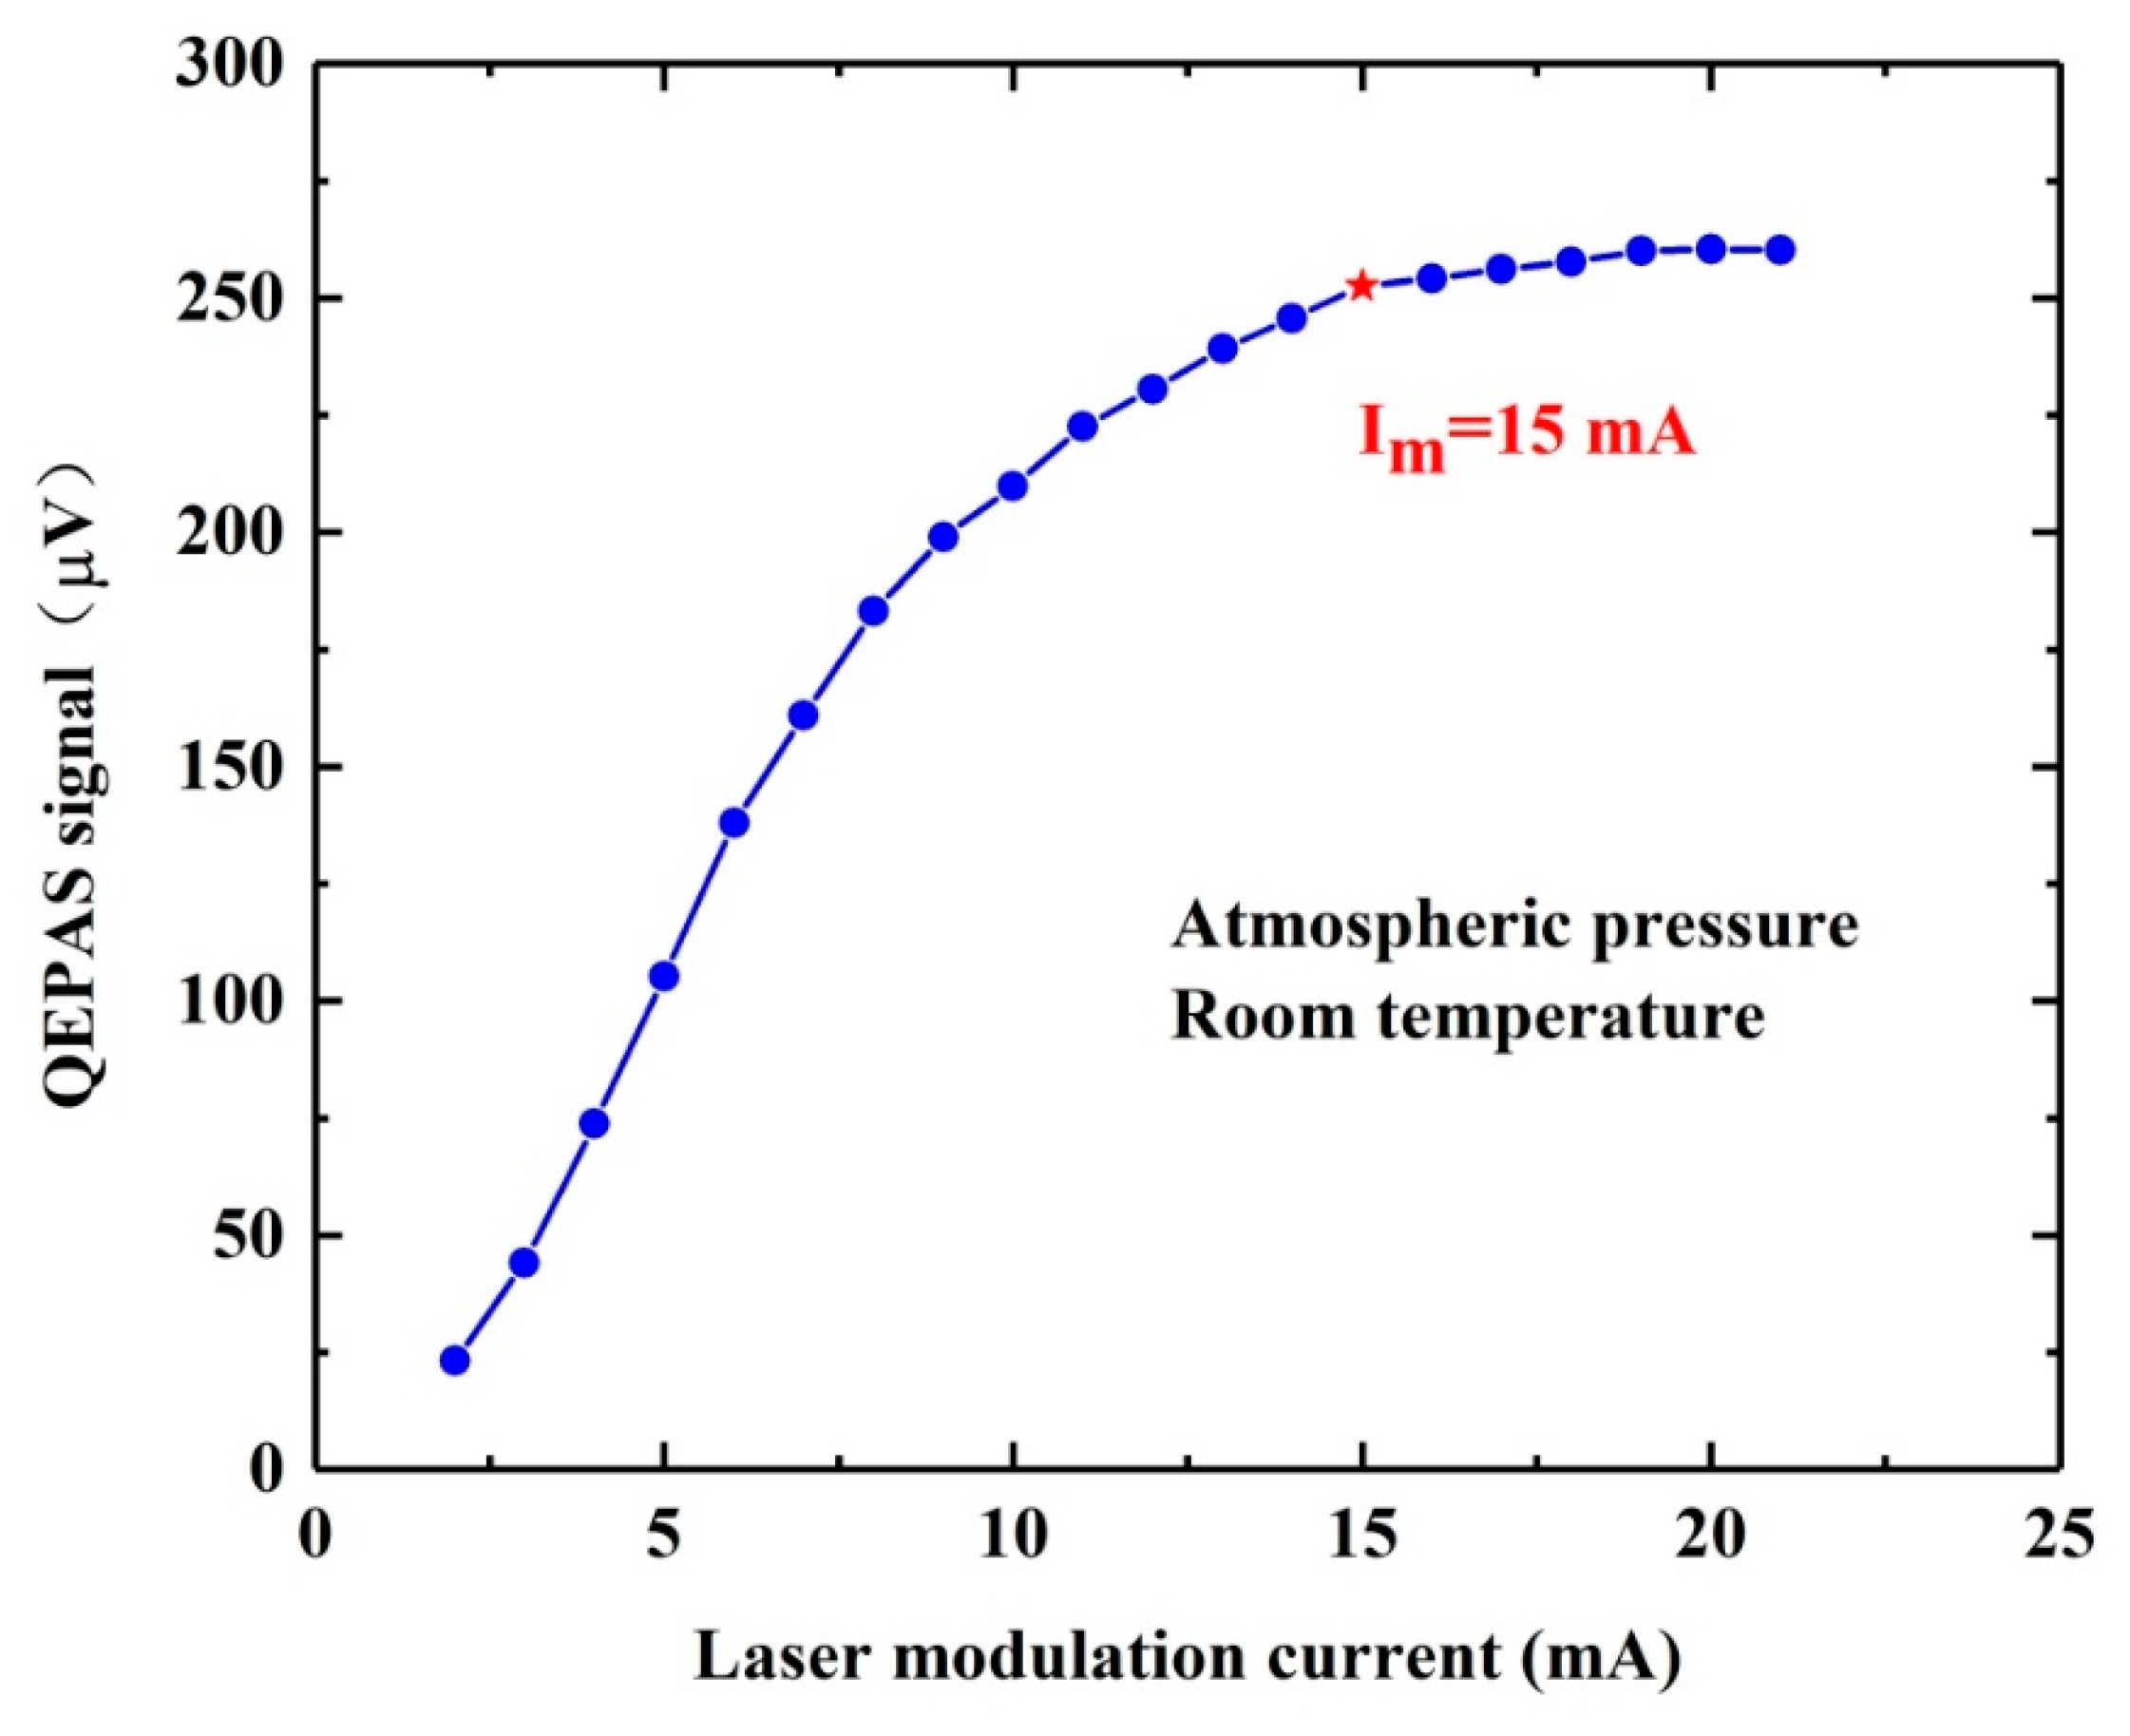
f-WMS approach by modulating and scanning the laser current. In order to obtain the maximum QEPAS signal amplitude, the modulation current of the laser must be optimized. The signal amplitude as a function of modulation current from 2 mA to 21 mA was shown in
Figure 6. The QEPAS signal appeared and increased from 2-mA modulation current at atmospheric pressure and room temperature. When the modulation depth reached 15 mA, an optimum value of the modulation depth, the QEPAS signal amplitude tended to be stable with no significant changes.
In the sensing system, the output power of the elliptical beam converged by the convex lens (M2) was 2.1 mW and the final QEPAS signal amplitude was 253 μV. The optimum signal was obtained by optimizing the vertical position of the elliptical laser beam along the symmetry axis of the QTF prong spacing. We fixed the distance from the center of the elliptical laser to the QTF tips at 1.3 mm. As the distance continues to increase, the beam will illuminate on the bottom of the QTF which can generate a non-negligible photothermal noise. However, when the distance is too small or even negative, the acoustic energy will leak from the top of QTF, resulting in a decreasing QEPAS signal.
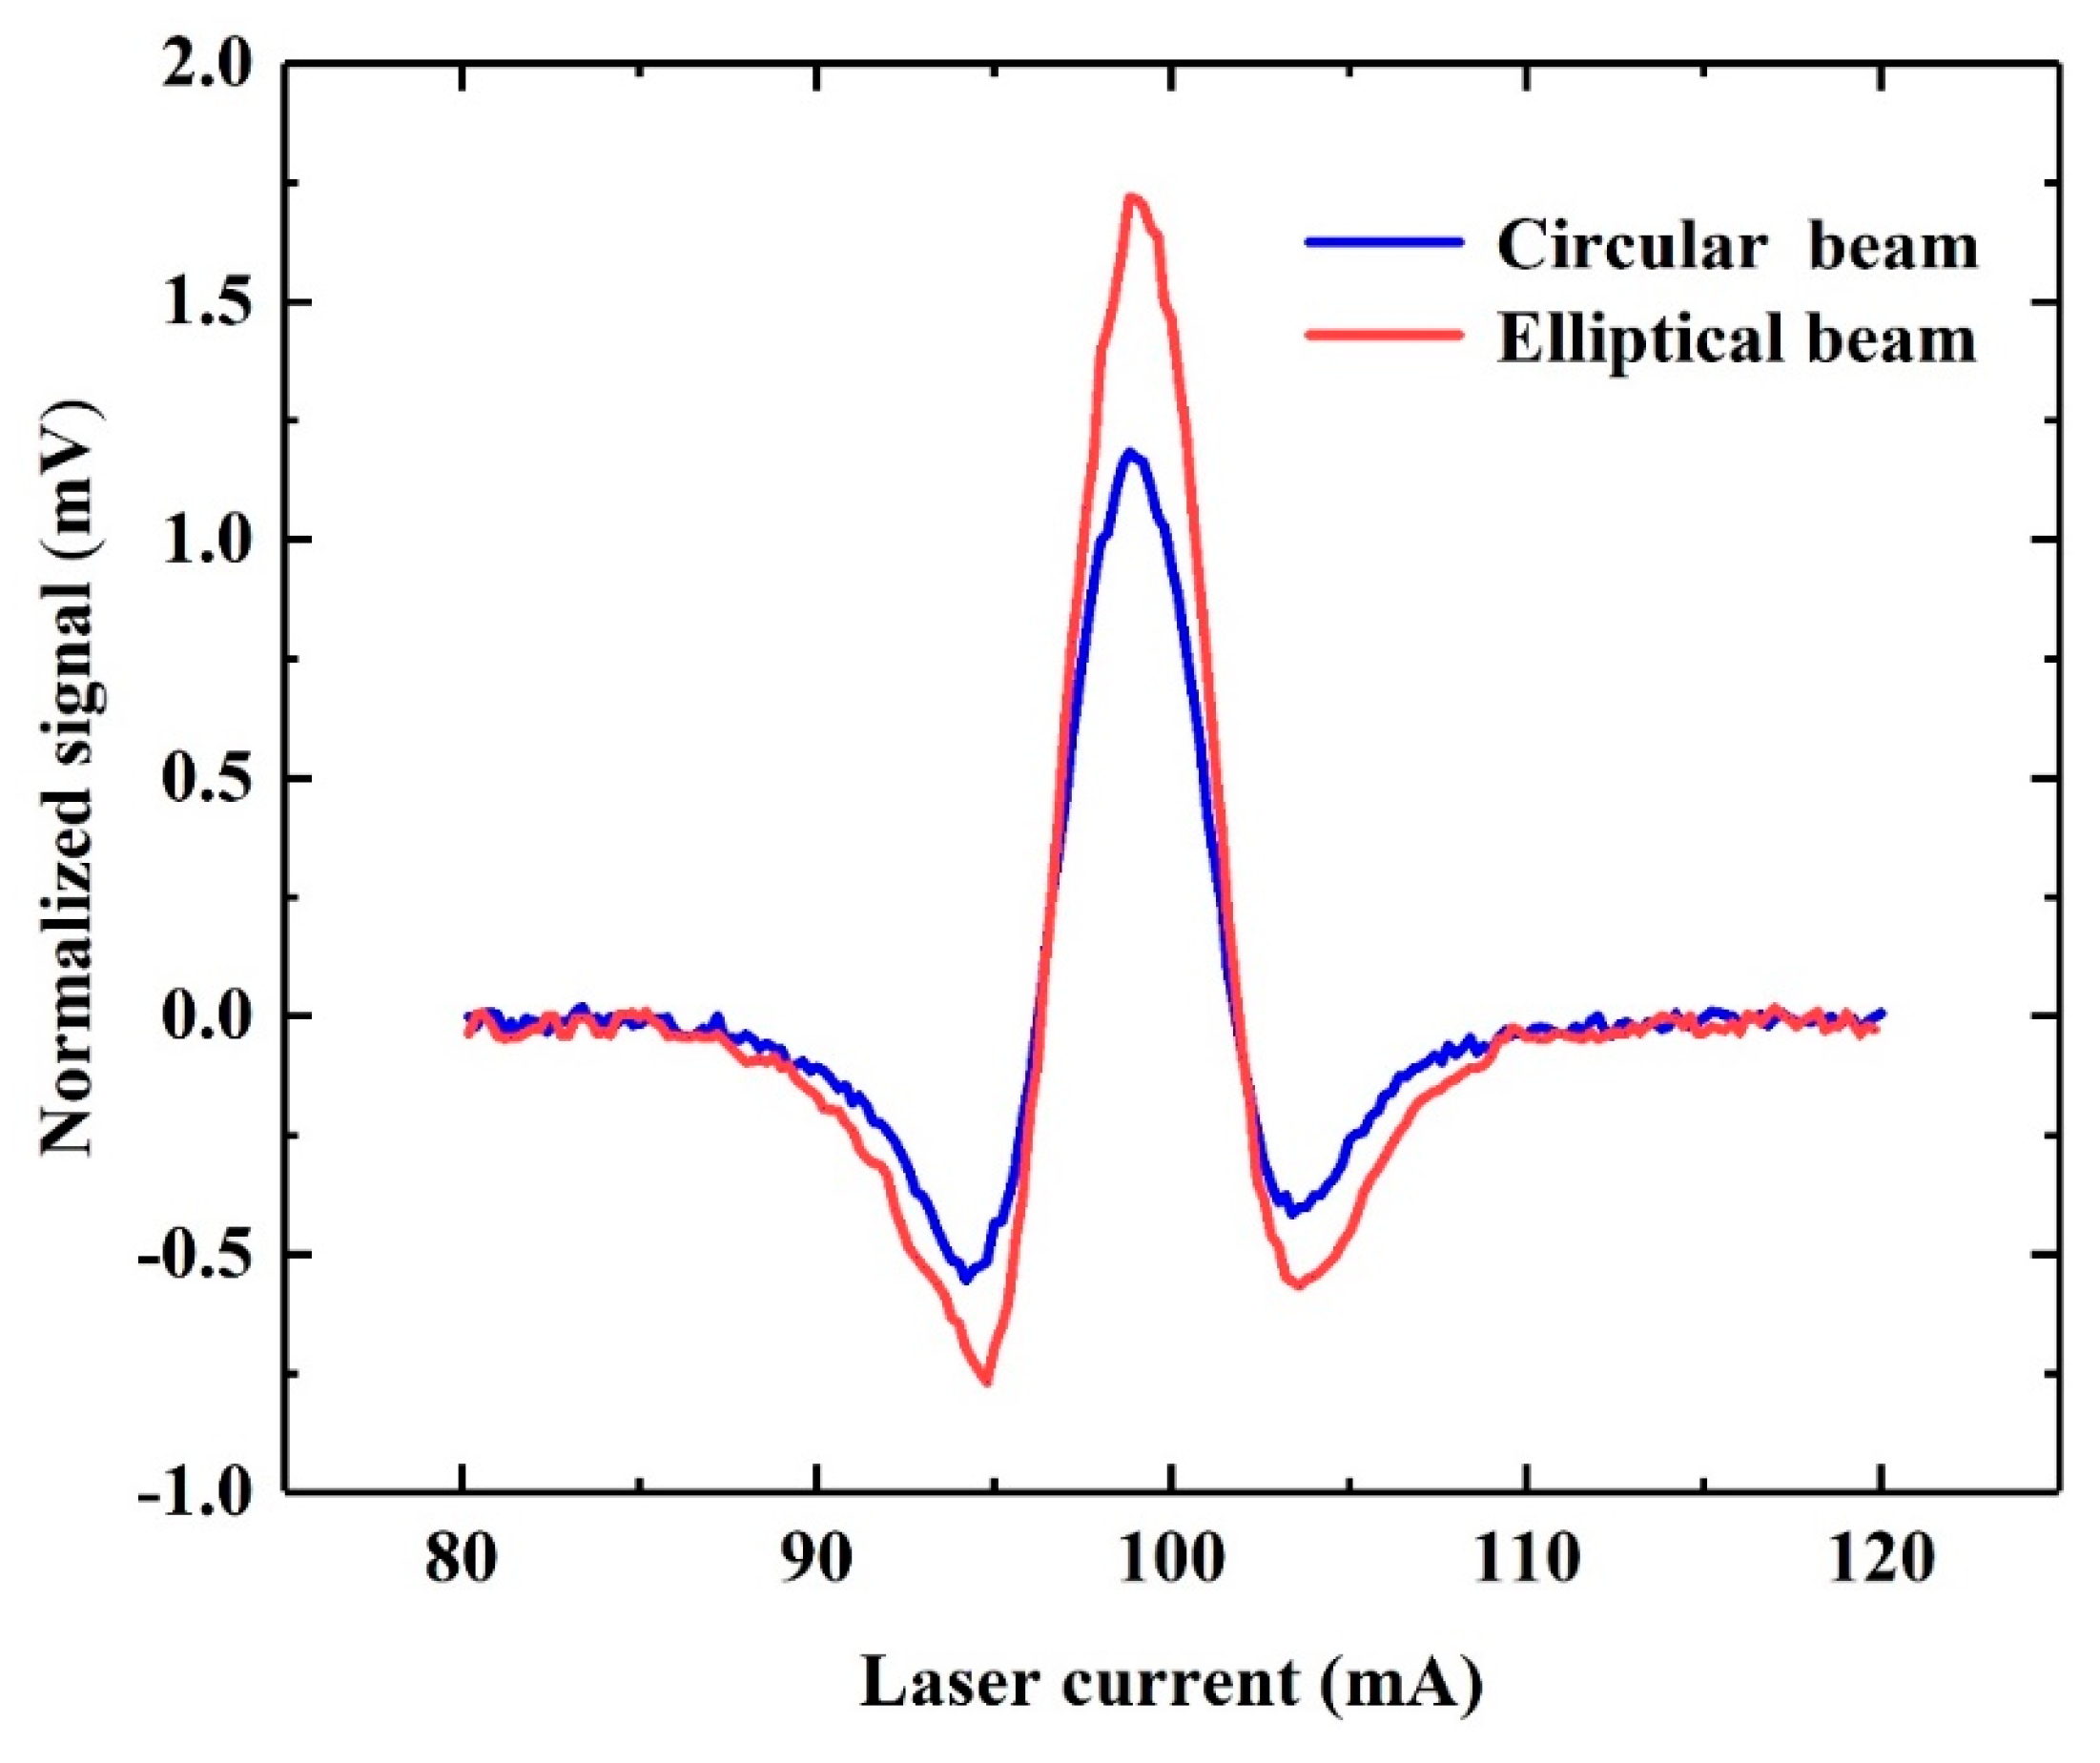
The output power of the circular laser beam before passing through the Powell lens was 14.26 mW and the maximum signal value was 1.183 mV. Compared with the original circular laser beam, the optimum QEPAS signal of the elliptical beam increased by 1.4 times in the case of normalized power, which verified that strip laser beam can better promote the vibration of QTF prongs as shown in
Figure 7.
In this case, although the number of excited gas molecules increases, the vibration amplitude of the different part of the QTF prongs are different, such as the top and bottom of QTF prongs. In fact, when the same external force is applied to every part of the inner surface of the QTF prongs, the displacement of the top part is much greater than that of the bottom part, resulting in a smaller contribution to the signal, so that the QEPAS signal did not increase as expected. In addition, due to the fact that the intensity of elliptical laser beam is Gaussian distribution, the energy is mainly centralized on the center of the laser spot, which is also an important factor in this phenomenon.
In the laboratory environment with 1.324% H2O, the optimum SNR was calculated as 31.6 with the 1σ noise level of 8 µV, resulting in a minimum detection limit (MDL) of 418.6 ppmv. Accordingly, the normalized noise equivalent absorption (NNEA) of 1.51 × 10⁻⁶ cm−1 W/√Hz with a laser power of 2.1 mW was obtained. The NNEA of the QEPAS sensor using the exciting light with an elliptical beam is higher than the traditional QEPAS sensor in which the circular laser beam is used. This is quite understandable as only a bare QTF was used as the photoacoustic detector. Furthermore, the NNEA value can be further reduced by applying micro-resonators to the QEPAS system for an improved sensor performance.
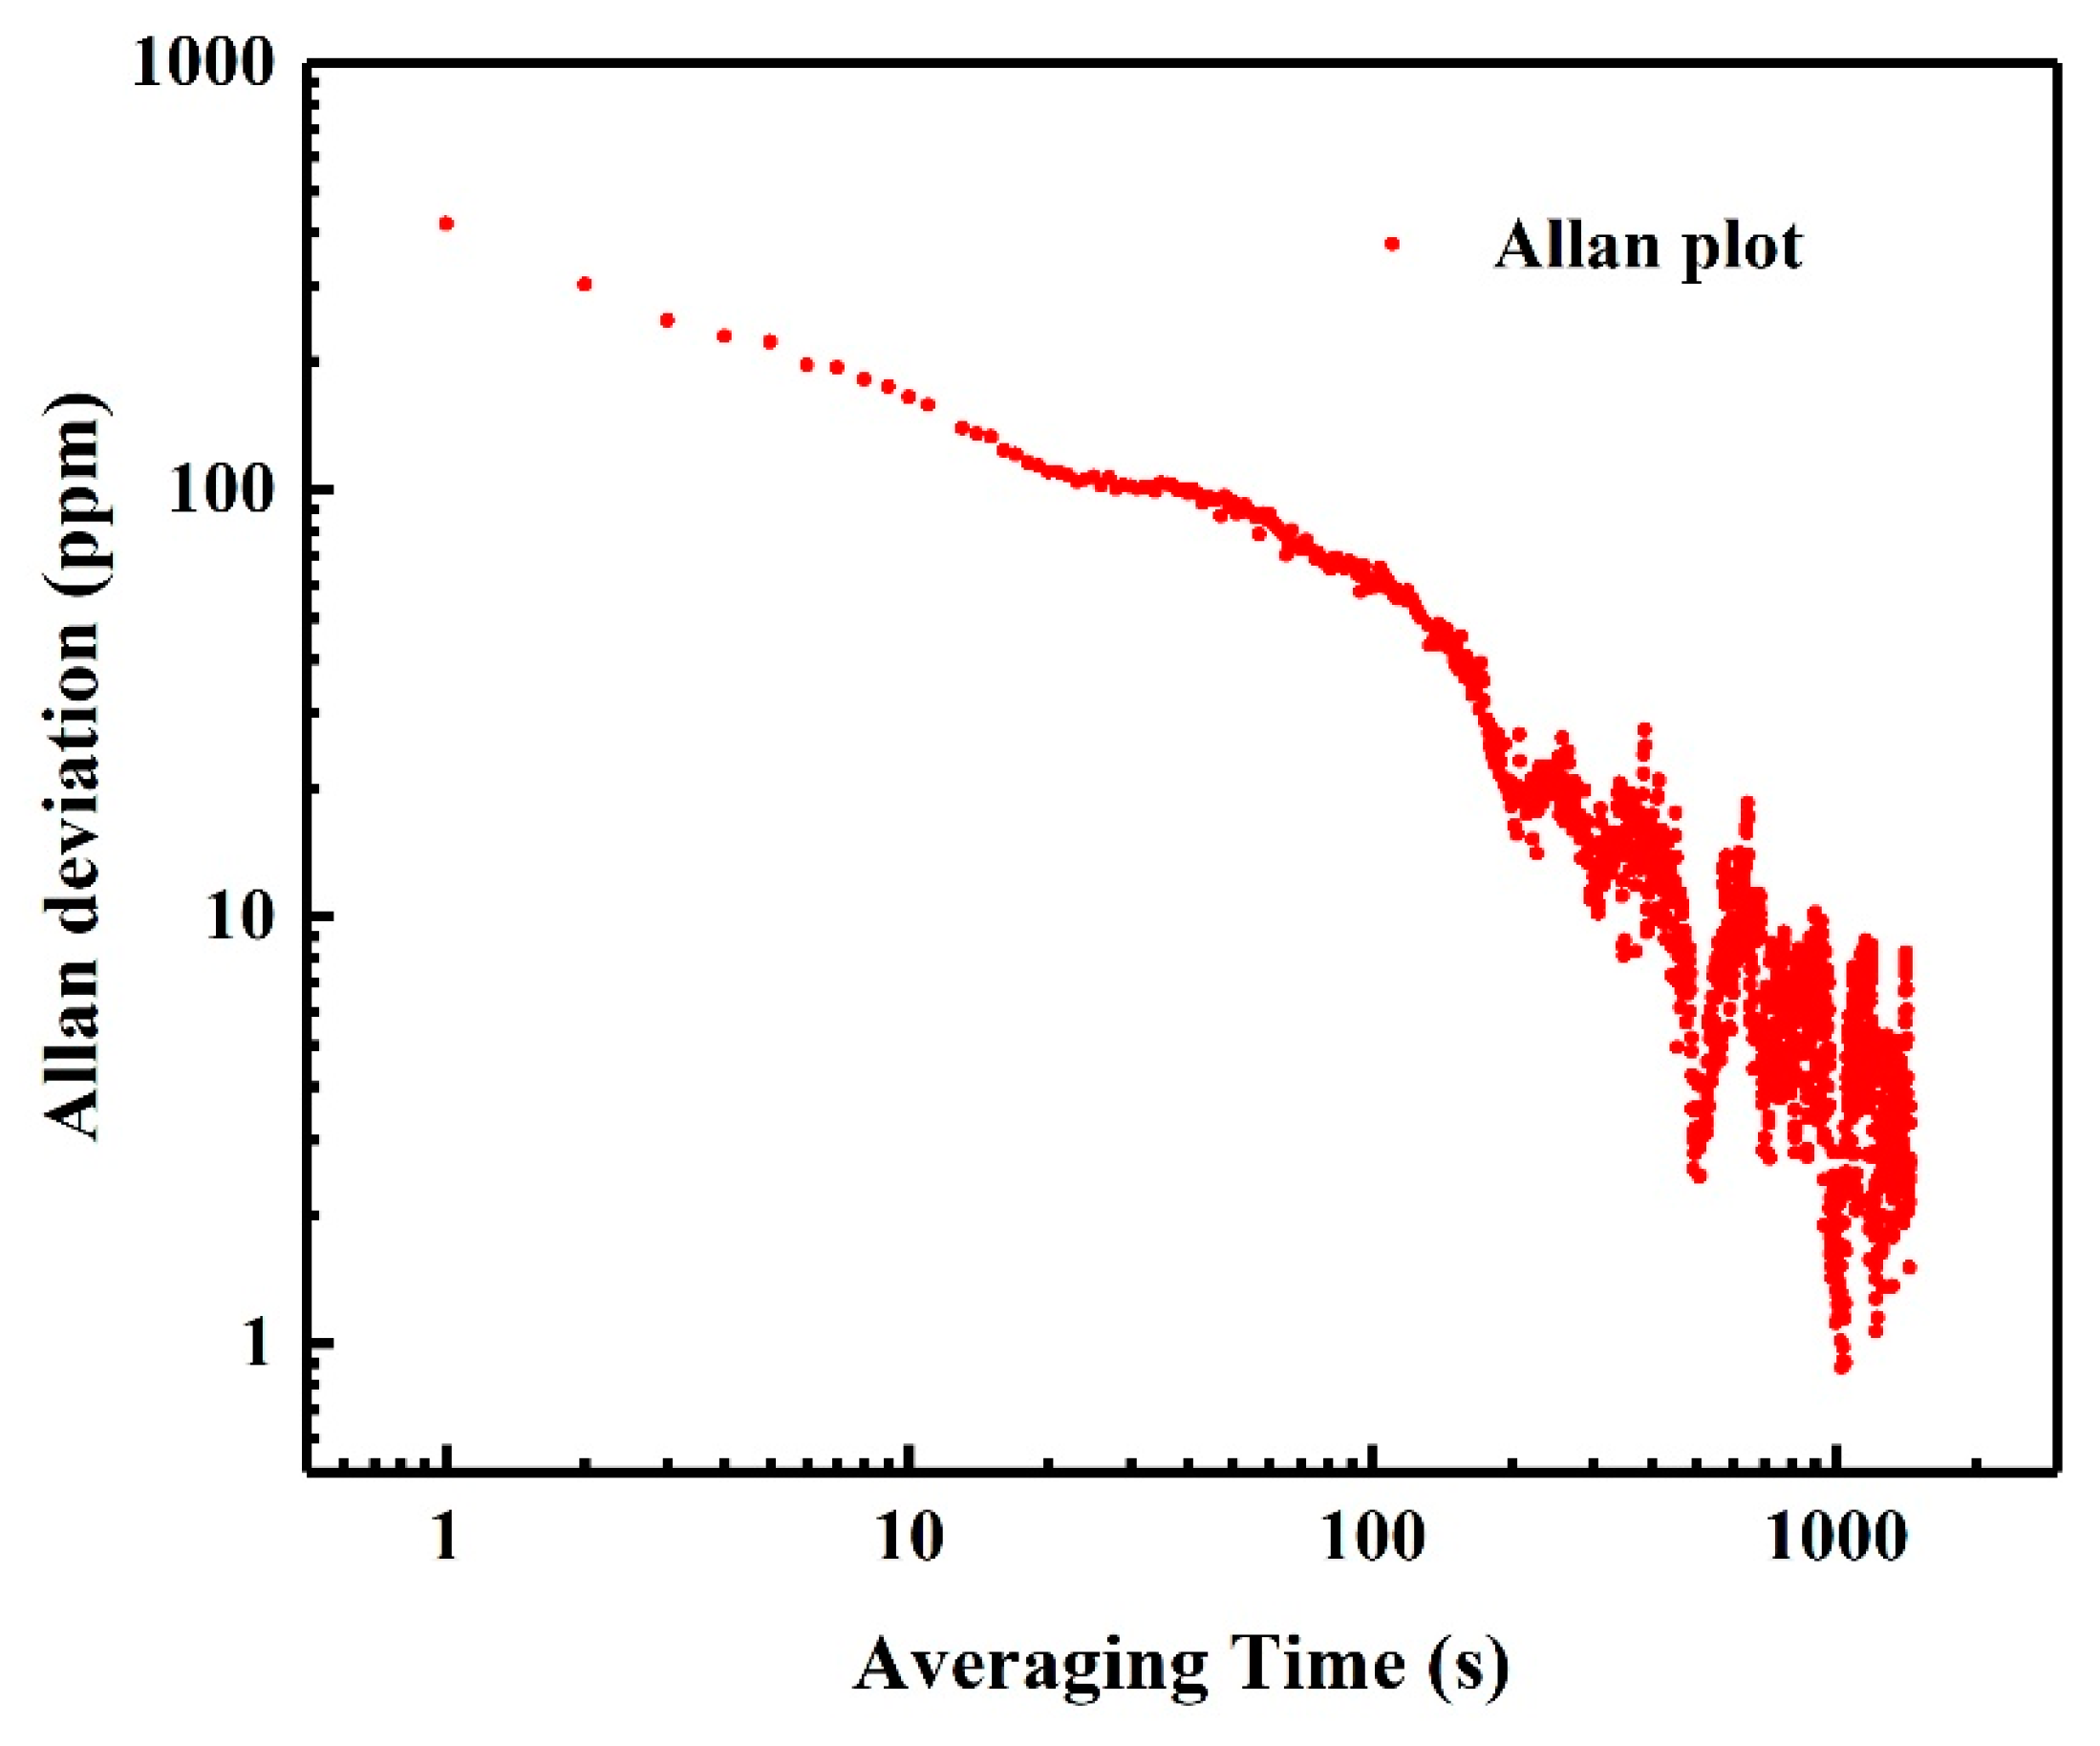
An Allan–Werle deviation analysis for the investigation of the long-term stability of the QEPAS sensor was performed as a function of the lock-in averaging time at atmospheric pressure. From the Allan deviation plot shown in
Figure 8, the sensitivity of the QEPAS based system can be improved by increasing the averaging time, and an optimal detection limit of 16.3 ppm was obtained at the averaging time of 202 s.
5. Conclusions
In summary, we theoretically and experimentally compared the QEPAS performance based on circular and elliptical laser spots. According to the finite element (FEM) analysis software COMSOL, the sound pressure distribution on the QTF prongs from different laser spot was simulated and the experimental results are in excellent agreement with the simulation. In the case of normalized power, the QEPAS signal of the elliptical laser beam was 1.4 times higher than that of the circular beam, which proved that the elliptical spot can interact with more target gas molecules and make the inner surface areas of the QTF prongs fully utilized. The MDL and NNEA of 418.6 ppmv and 1.51 × 10⁻⁶ cm−1 W/√Hz were achieved, respectively. Since higher laser power can further enhance the performance of QEPAS sensors, this work provides an applied prerequisite for the combination of QEPAS system and high-power elliptical laser sources without complex shaping systems. In addition, this technique would be more suited to low-cost, alignment-free QEPAS sensors without microtubes, which are a pain to align, especially in industrial devices.
Author Contributions
Z.S. and S.L. performed the experiments and write the manuscript; H.W. and L.D. reviewed and edited the manuscript. All authors have read and agreed to the published version of the manuscript.
Funding
This research is supported by National Natural Science Foundation of China (NSFC) (61805132, 61622503, 61575113, 11434007), Applied basic research program of Shanxi province (201801D221174); Scientific and Technologial Innovation Programs of Higher Education Institutions in Shanxi(2019L0028); National Key R&D Program of China (2017YFA0304203), Changjiang Scholars and Innovative Research Team in University of Ministry of Education of China (IRT_17R70), 111 project (D18001), Outstanding Innovative Teams of Higher Learning Institutions of Shanxi, Foundation for Selected Young Scientists Studying Abroad, Sanjin Scholar (2017QNSJXZ- 04) and Shanxi “1331KSC”.
Acknowledgments
We thank Biao Li and Tingting Wei for valuable discussions.
Conflicts of Interest
The authors declare no conflict of interest.
References
- Curl, R.F.; Capasso, F.; Gmachl, C.; Kosterev, A.A.; McManus, B.; Lewicki, R.; Pusharsky, M.; Wysocki, G.; Tittel, F.K. Quantum cascade lasers in chemical physics. Chem. Phys. Lett. 2010, 487, 1–18. [Google Scholar] [CrossRef]
- Kosterev, A.A.; Wysocki, G.; Bakhirkin, Y.; So, S.; Lewicki, R.; Tittel, F.K.; Curl, R.F. Application of quantum cascade lasers to trace gas analysis. Appl. Phys. B 2008, 90, 165–176. [Google Scholar] [CrossRef]
- Patimisco, P.; Sampaolo, A.; Giglio, M.; Mackowiak, V.; Rossmadl, H.; Gross, B.; Tittel, F.K.; Spagnolo, V. Octupole electrode pattern for tuning forks vibrating at the first overtone mode in quartz-enhanced photoacoustic spectroscopy. Opt. Lett. 2018, 43, 1854–1857. [Google Scholar] [CrossRef] [PubMed]
- Wu, H.; Dong, L.; Yin, X.; Sampaolo, A.; Patimisco, P.; Ma, W.; Zhang, L.; Yin, W.; Xiao, L.; Spagnolo, V.; et al. Atmospheric CH4 measurement near a landfill using an ICL-based QEPAS sensor with V-T relaxation self-calibration. Sens. Actuators B Chem. 2019, 297, 126753. [Google Scholar] [CrossRef]
- McCurdy, M.R.; Bakhirkin, Y.; Wysocki, G.; Lewicki, R.; Tittel, F.K. Recent advances of laser-spectroscopy-based techniques for applications in breath analysis. Breath Res. 2007, 1, 014001. [Google Scholar] [CrossRef] [Green Version]
- Cao, Y.; Sanchez, N.P.; Jiang, W.Z.; Griffin, R.J.; Xie, F.; Hughes, L.C.; Zah, C.; Tittel, F.K. Simultaneous atmospheric nitrous oxide, methane and water vapor detection with a single continuous wave quantum cascade laser. Opt. Express 2015, 23, 2121–2132. [Google Scholar] [CrossRef] [Green Version]
- Wu, H.; Sampaolo, A.; Dong, L.; Patimisco, P.; Liu, X.; Zheng, H.; Yin, X.; Ma, W.; Zhang, L.; Yin, W.; et al. Quartz enhanced photoacoustic H2S gas sensor based on a fiber-amplifier source and a custom tuning fork with large prong spacing. Appl. Phys. Lett. 2015, 107, 111104. [Google Scholar] [CrossRef] [Green Version]
- Cui, R.; Dong, L.; Wu, H.; Li, S.; Zhang, L.; Ma, W.; Yin, W.; Xiao, L.; Jia, S.; Tittel, F.K. Highly sensitive and selective CO sensor using a 2.33 μm diode laser and wavelength modulation spectroscopy. Opt. Express 2018, 26, 24318–24328. [Google Scholar] [CrossRef] [Green Version]
- Patimisco, P.; Sampaolo, A.; Bidaux, Y.; Bismuto, A.; Scott, M.; Jiang, J.; Muller, A.; Faist, J.; Tittel, F.K.; Spagnolo, V. Purely wavelength- and amplitude-modulated quartz-enhanced photoacoustic spectroscopy. Opt. Express 2016, 24, 25943–25954. [Google Scholar] [CrossRef]
- Jin, W.; Ho, H.; Cao, Y.; Ju, J.; Qi, L. Gas detection with micro-and nano-engineered optical fibers. Opt. Fiber Technol. 2013, 19, 741–759. [Google Scholar] [CrossRef] [Green Version]
- Pan, Y.; Dong, L.; Wu, H.; Ma, W.; Zhang, L.; Yin, W.; Xiao, L.; Jia, S.; Tittel, F.K. Cavity-enhanced photoacoustic sensor based on a whispering-gallery-mode diode laser. Atmos. Meas. Tech. 2019, 12, 1905–1911. [Google Scholar] [CrossRef] [Green Version]
- Elia, A.; Lugara, P.M.; Di Franco, C.; Spagnolo, V. Photoacoustic techniques for trace gas sensing based on semiconductor laser sources. Sensors 2009, 9, 9616–9628. [Google Scholar] [CrossRef] [PubMed] [Green Version]
- Yin, X.; Dong, L.; Wu, H.; Zheng, H.; Ma, W.; Zhang, L.; Yin, W.; Jia, S.; Tittel, F.K. Sub-ppb nitrogen dioxide detection with a large linear dynamic range by use of a differential photoacoustic cell and a 3.5 W blue multimode diode laser. Sens. Actuators B 2017, 247, 329–335. [Google Scholar] [CrossRef] [Green Version]
- Kosterev, A.A.; Bakhirkin, Y.A.; Curl, R.F.; Tittel, F.K. Quartz-enhanced photoacoustic spectroscopy. Opt. Lett. 2002, 27, 1902–1904. [Google Scholar] [CrossRef] [Green Version]
- Wu, H.; Yin, X.; Dong, L.; Jia, Z.; Zhang, Z.; Liu, F.; Ma, W.; Zhang, L.; Yin, W.; Xiao, L.; et al. Ppb-level nitric oxide photoacoustic sensor based on a mid-IR quantum cascade laser operating at 52 °C. Sens. Actuators B Chem. 2019, 290, 426–433. [Google Scholar] [CrossRef]
- Jahjah, M.; Ren, W.; Stefański, P.; Lewicki, R.; Zhang, J.W.; Jiang, W.Z.; Jan Tarka, J.; Tittel, F.K. A compact QCL based methane and nitrous oxide sensor for environmental and medical applications. Analyst 2014, 139, 2065–2069. [Google Scholar] [CrossRef]
- Wu, H.; Dong, L.; Zheng, H.; Liu, X.; Yin, X.; Ma, W.; Zhang, L.; Yin, W.; Jia, S.; Tittel, F.K. Enhanced near-infrared QEPAS sensor for sub-ppm level H2S detection by means of a fiber amplified 1582 nm DFB laser. Sens. Actuator B Chem. 2015, 221, 666–672. [Google Scholar] [CrossRef] [Green Version]
- Wu, H.; Dong, L.; Zheng, H.; Yu, Y.; Ma, W.; Zhang, L.; Yin, W.; Xiao, L.; Jia, S.; Tittel, F.K. Beat frequency quartz-enhanced photoacoustic spectroscopy for fast and calibration-free continuous trace-gas monitoring. Nat. Commun. 2017, 8, 15331. [Google Scholar] [CrossRef] [Green Version]
- Li, S.; Dong, L.; Wu, H.; Sampaolo, A.; Patimisco, P.; Spagnolo, V.; Tittel, F.K. Ppb-level quartz-enhanced photoacoustic detection of carbon monoxide exploiting a surface grooved tuning fork. Anal. Chem. 2019, 91, 5834–5840. [Google Scholar] [CrossRef]
- Dong, L.; Wu, H.; Zheng, H.; Liu, Y.; Liu, X.; Jiang, W.; Zhang, L.; Ma, W.; Ren, W.; Yin, W.; et al. Double acoustic micro-resonator quartz-enhanced photoacoustic spectroscopy. Opt. Lett. 2014, 39, 2479–2482. [Google Scholar] [CrossRef]
- Liu, K.; Guo, X.; Yi, H.; Chen, W.; Zhang, W.; Gao, X. Off-beam quartz-enhanced photoacoustic spectroscopy. Opt. Lett. 2009, 34, 1594–1596. [Google Scholar] [CrossRef] [PubMed]
- Ma, Y.; Yu, X.; Yu, G.; Li, X.; Zhang, J.; Chen, D.; Sun, R.; Tittel, F.K. Multi-quartz-enhanced photoacoustic spectroscopy. Appl. Phys. Lett. 2015, 107, 021106. [Google Scholar] [CrossRef] [Green Version]
- Zheng, H.; Dong, L.; Sampaolo, A.; Wu, H.; Patimisco, P.; Yin, X.; Ma, W.; Zhang, L.; Yin, W.; Spagnolo, V.; et al. Single-tube on-beam quartz-enhanced photoacoustic spectroscopy. Opt. Lett. 2016, 41, 978–981. [Google Scholar] [CrossRef] [PubMed]
- Borri, S.; Patimisco, P.; Galli, I.; Mazzotti, D.; Giusfredi, G.; Akikusa, N.; Yamanishi, M.; Scamarcio, G.; De Natale, P.; Spagnolo, V. Intracavity quartz-enhanced photoacoustic sensor. Appl. Phys. Lett. 2014, 104, 091114. [Google Scholar] [CrossRef]
- Kuang, C.; Ma, Y.; Zhou, R.; Lee, J.; Barbastathis, G.; Dasari, R.R.; Yaqoob, Z.; So, P.T. Digital micromirror device-based laser-illumination Fourier ptychographic microscopy. Opt. Express 2015, 23, 26999–27010. [Google Scholar] [CrossRef]
- Lerner, V.; Shwa, D.; Drori, Y.; Katz, N. Shaping Laguerre–Gaussian laser modes with binary gratings using a digital micromirror device. Opt. Lett. 2012, 37, 4826–4828. [Google Scholar] [CrossRef] [Green Version]
- Ganeev, R.A.; Naik, P.A.; Singhal, H.; Chakera, J.A.; Kumar, M.; Joshi, M.P.; Srivastava, A.K.; Gupta, P.D. High-order harmonic generation in carbon-nanotube-containing plasma plumes. Phys. Rev. 2011, 83, 013820. [Google Scholar] [CrossRef]
- Cai, F.; Tang, R.; Wang, S.; He, S. A compact line-detection spectrometer with a Powell lens. Optik 2018, 155, 267–272. [Google Scholar] [CrossRef]
- Christensen, K.A.; Morris, M.D. Hyperspectral Raman Microscopic Imaging Using Powell Lens Line Illumination. Appl. Spectrosc. 1998, 52, 1145–1147. [Google Scholar] [CrossRef]
- Yu, N.; Blanchard, R.; Fan, J.; Capasso, F.; Edamura, T.; Yamanishi, M.; Kan, H. Small divergence edge-emitting semiconductor lasers with two-dimensional plasmonic collimators. Appl. Phys. Lett. 2008, 93, 181101. [Google Scholar] [CrossRef]
- Ma, Z.; Guo, T.; Zhang, T.; Wang, W.; Chen, H.; Zhang, X.; Yuan, W. Compact Powell-Lens-Based Low-Coherence Correlation Interrogation System for Fiber-Optic Fabry-Perot Sensors. IEEE Photon. J. 2019, 11, 71002111. [Google Scholar] [CrossRef]
- Dong, L.; Kosterev, A.A.; Thomazy, D.; Tittel, F.K. QEPAS spectrophones: Design, optimization, and performance. Appl. Phys. B 2010, 100, 627–635. [Google Scholar] [CrossRef]
- The HITRAN Database. Available online: http://www.hitran.com (accessed on 9 December 2019).
© 2020 by the authors. Licensee MDPI, Basel, Switzerland. This article is an open access article distributed under the terms and conditions of the Creative Commons Attribution (CC BY) license (http://creativecommons.org/licenses/by/4.0/).


