Article

Investigation of Airborne Molecular Contamination in Cleanroom Air Environment through Portable Soft X-Ray Radiolysis Detector

1
School of Civil and Environmental Engineering, Pusan National University, Busan 46241, Korea
2
Department of Mechanical Engineering, University of Minnesota, Minneapolis, MN 55455, USA
3
School of Science and Engineering, the Chinese University of Hong Kong, Shenzhen, Guangdong 518172, China
*
Author to whom correspondence should be addressed.
Appl. Sci. 2020, 10(3), 978; https://doi.org/10.3390/app10030978
Submission received: 10 December 2019 / Revised: 26 January 2020 / Accepted: 27 January 2020 / Published: 3 February 2020
(This article belongs to the Special Issue Air Pollution II)

Abstract

:
Airborne molecular contamination (AMC) represents a wide range of gaseous contaminants in the cleanroom air environment. It is difficult to monitor AMC in the cleanroom air using conventional methods in real-time due to its ultra-low concentrations, such as part-per-billion or -trillion (ppb or ppt). In this study, AMC in the real university cleanroom air environment was investigated to figure out hot spots through portable soft X-ray radiolysis detector, which converts gaseous AMC into nanoparticles (gas-to-particle conversion) under the soft X-ray irradiation. A soft X-ray was connected to a clean stainless steel chamber to convert the introduced AMC into nanoparticles, and the size distributions of nanoparticles were measured through a scanning mobility particle sizer, which consists of a differential mobility analyzer and a condensation particle counter. By converting the size distribution information into total particle volume concentrations, equivalent AMC concentrations can be calculated using an appropriate calibration curve between AMC and the total particle volume concentration. The volume concentration of nanoparticles were converted into an equivalent sulfur dioxide (SO2, a major acidic AMC in the cleanroom air) concentration by a calibration curve between SO2 and the particle volume concentrations. AMC levels at different locations in the cleanroom at the University of Minnesota were measured by the soft X-ray-assisted AMC detector, and revealed that several tenth-order of pptV (lower than 15 pptV) in terms of the equivalent SO2 concentration existed in the cleanroom air environment.

1. Introduction

Airborne molecular contamination (AMC) represents a wide range of gaseous contaminants in the cleanroom air environment at part-per-billion or -trillion (ppb or ppt) levels [1,2]. When AMC is exposed to ultraviolet light sources of lithography tools (e.g., extreme ultraviolet lithography, EUVL), it can form particle and haze contamination on wafers and photomasks during semiconductor manufacturing processes, thus increasing defects of the products [3,4,5,6]. Therefore, detecting and controlling AMC have been big issues for enhancing the product yield in the semiconductor industry. However, it is difficult to detect due to its extremely low concentration of AMC in the cleanroom air [7,8]. Even though gaseous contaminants generally have been captured using porous media [9,10,11], such as activated carbons, through adsorption, it is difficult to remove AMC totally from the air, and the unfiltered AMC can cause the secondary contamination problems (e.g., particles or haze) in the semiconductor manufacturing processes [12]. In addition, different physicochemical properties of various AMC require multiple gas filter layers for different kinds of AMC, which increases maintenance cost for the semiconductor manufacturing.
Conventional methods for quantifying AMC in the cleanroom air are mostly conducted by sampling AMC in the cleanroom air and analyzing the samples at off-site laboratories using precise instruments [1,13,14,15]. Due to the ultra-low concentration of AMC, certain sampling-time periods (e.g., hours to days) are normally required to get enough AMC concentration higher than the lower detection limits of the analysis instruments. In this case, we may lose the critical time for taking care of AMC in emergency cases due to the time difference between the sampling and analysis. In other words, the analyzed data show average values in the past, which cannot represent real-time data. This makes it difficult to find the locations where AMC is dominantly originated or the AMC concentration is higher than surrounding (called as hot spots) in the cleanroom immediately. If a portable method for determining the concentration of AMC in the cleanroom air in real-time is available, the AMC problems would be mitigated substantially. AMCs in the cleanroom should be more than a species such as sulfate, nitrate, ammonia, condensable organics, dopants, etc. For analyzing the chemical compositions of AMCs, expensive instruments are required. Although the instruments, such as proton transfer reaction-mass spectroscopy (PTR-MS) [16,17] for organic AMCs, are ready in the cleanroom for monitoring, it is difficult to move them and detect hot spots in real-time.
Kim and his colleagues have developed a detection method for AMC, which deploys a gas-to-particle conversion under the soft X-ray irradiation (soft X-ray radiolysis) and tested its feasibility to detect the ultra-low gaseous air pollutants in the lab. Then, the method was applied to different kinds of AMC-related issues, including evaluating the gas filtration performance of granular activated carbons [7,8,11]. Although the method has been deployed in the previous laboratory experiments with fixed positions, it can be used to determine the real-time AMC concentration in the cleanroom as well by configuring a portable system using the method, because the method was originally designed to detect AMC hot spots in the cleanroom in real-time, which was difficult to conduct by conventional techniques before.
In this study, we investigated AMC levels in the cleanroom air environment deploying a portable soft X-ray radiolysis detector, which consists of a soft X-ray radiolysis chamber and a scanning mobility particle sizer (SMPS, a combination of a nano differential mobility analyzer (nano DMA) and an ultra- condensation particle sizer (UCPC), Model 3936N76, TSI Inc., Minneapolis, MN, USA). The measurements were conducted at different sub-locations in a cleanroom at the University of Minnesota, MN, USA.

2. Materials and Methods

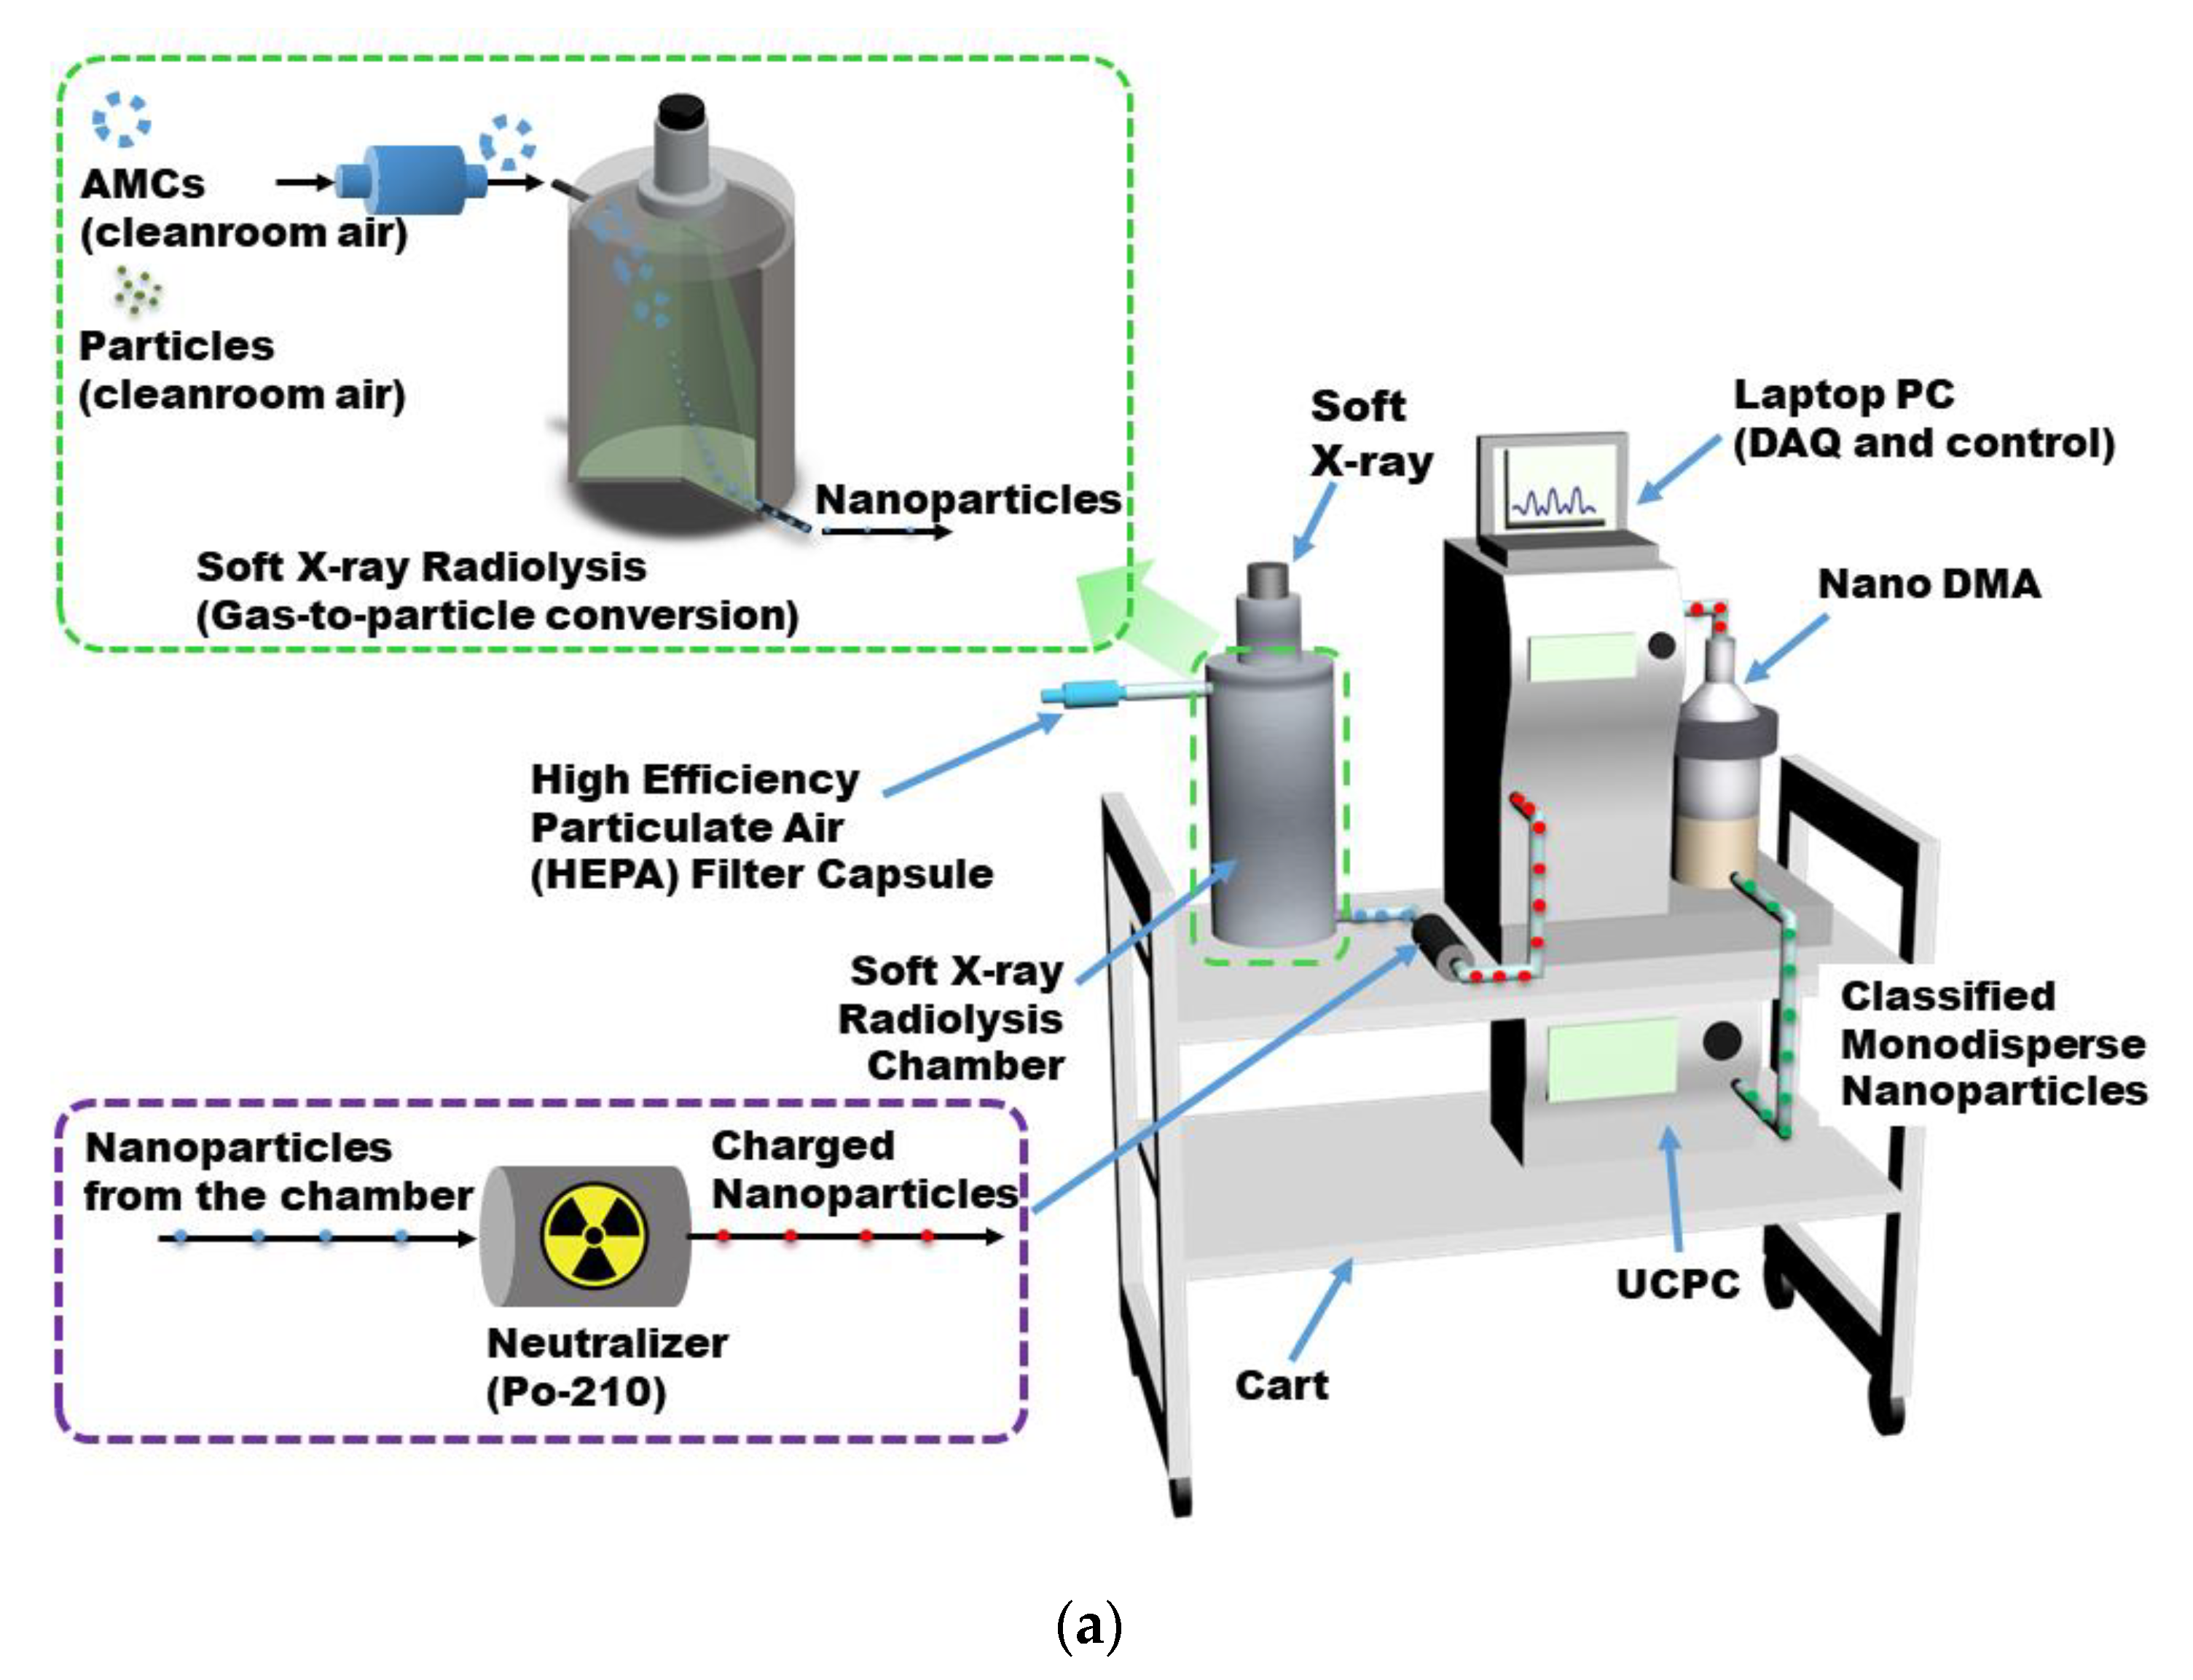
2.1. Portable AMC Detector Deploying Soft X-Ray Radiolysis

Figure 1a shows a schematic diagram of the portable detector for AMC in the cleanroom air deploying soft X-ray radiolysis [7,8,11]. A cylindrical stainless steel chamber was prepared for converting AMC into nanoparticles under soft X-ray irradiation (soft X-ray radiolysis chamber) and sealed using a copper gasket to prevent airborne contaminants in the cleanroom air from entering the chamber. The dimension of the chamber was Φ 127 mm × 203 mm (5 in × 8 in) and the bulk residence time of AMC in the chamber was 100 s at 1.5 L per minute (LPM). The inner surface of the chamber was electro-polished and baked at 200 °C before the measurements in the cleanroom for minimizing background signals caused by outgassing from the chamber wall. A soft X-ray emitter (SXN-10F, Sunje Ltd., Busan, Republic of Korea) was installed to the top of the chamber and irradiated soft X-ray inside the soft X-ray chamber through a Kapton film window, which allows only soft X-ray to penetrate through it. A small-size high-efficient particulate air (HEPA) filter capsule was connected to the inlet of the soft X-ray radiolysis chamber for removing the error caused by primary particulate contaminants in the cleanroom air and monitoring only gaseous AMC. In the soft X-ray chamber, AMC coming from the cleanroom air was converted into nanoparticles through the soft X-ray radiolysis. The nanoparticles synthesized in the chamber were charged with a Boltzmann distribution by a neutralizer (Po-210) and then transported to the SMPS for measuring the size distributions of the synthesized nanoparticles. The aerosol inlet and sheath flow rates for the SMPS were set at 1.5 and 15 LPM, respectively. In addition, the scan and the retrace times were set at 120 and 15 s, respectively). Based on the SMPS setting, the number size distribution of nanoparticles synthesized in the soft X-ray radiolysis chamber was measured from 2.5 to 65 nm. To make a portable detector for investigating AMC hot spots in the cleanroom, the components of the AMC detection method were organized on a portable cart with three stages as shown in Figure 1a. Due to the size of the cart, the UCPC was stored below the nano DMA and the tubing length between two instruments was kept as short as possible to minimize the particle loss between them. A small-sized laptop PC on the electrostatic classifier (Model 3082, TSI Inc., Minneapolis, MN, USA) was deployed for controlling the SMPS and acquiring measured data.

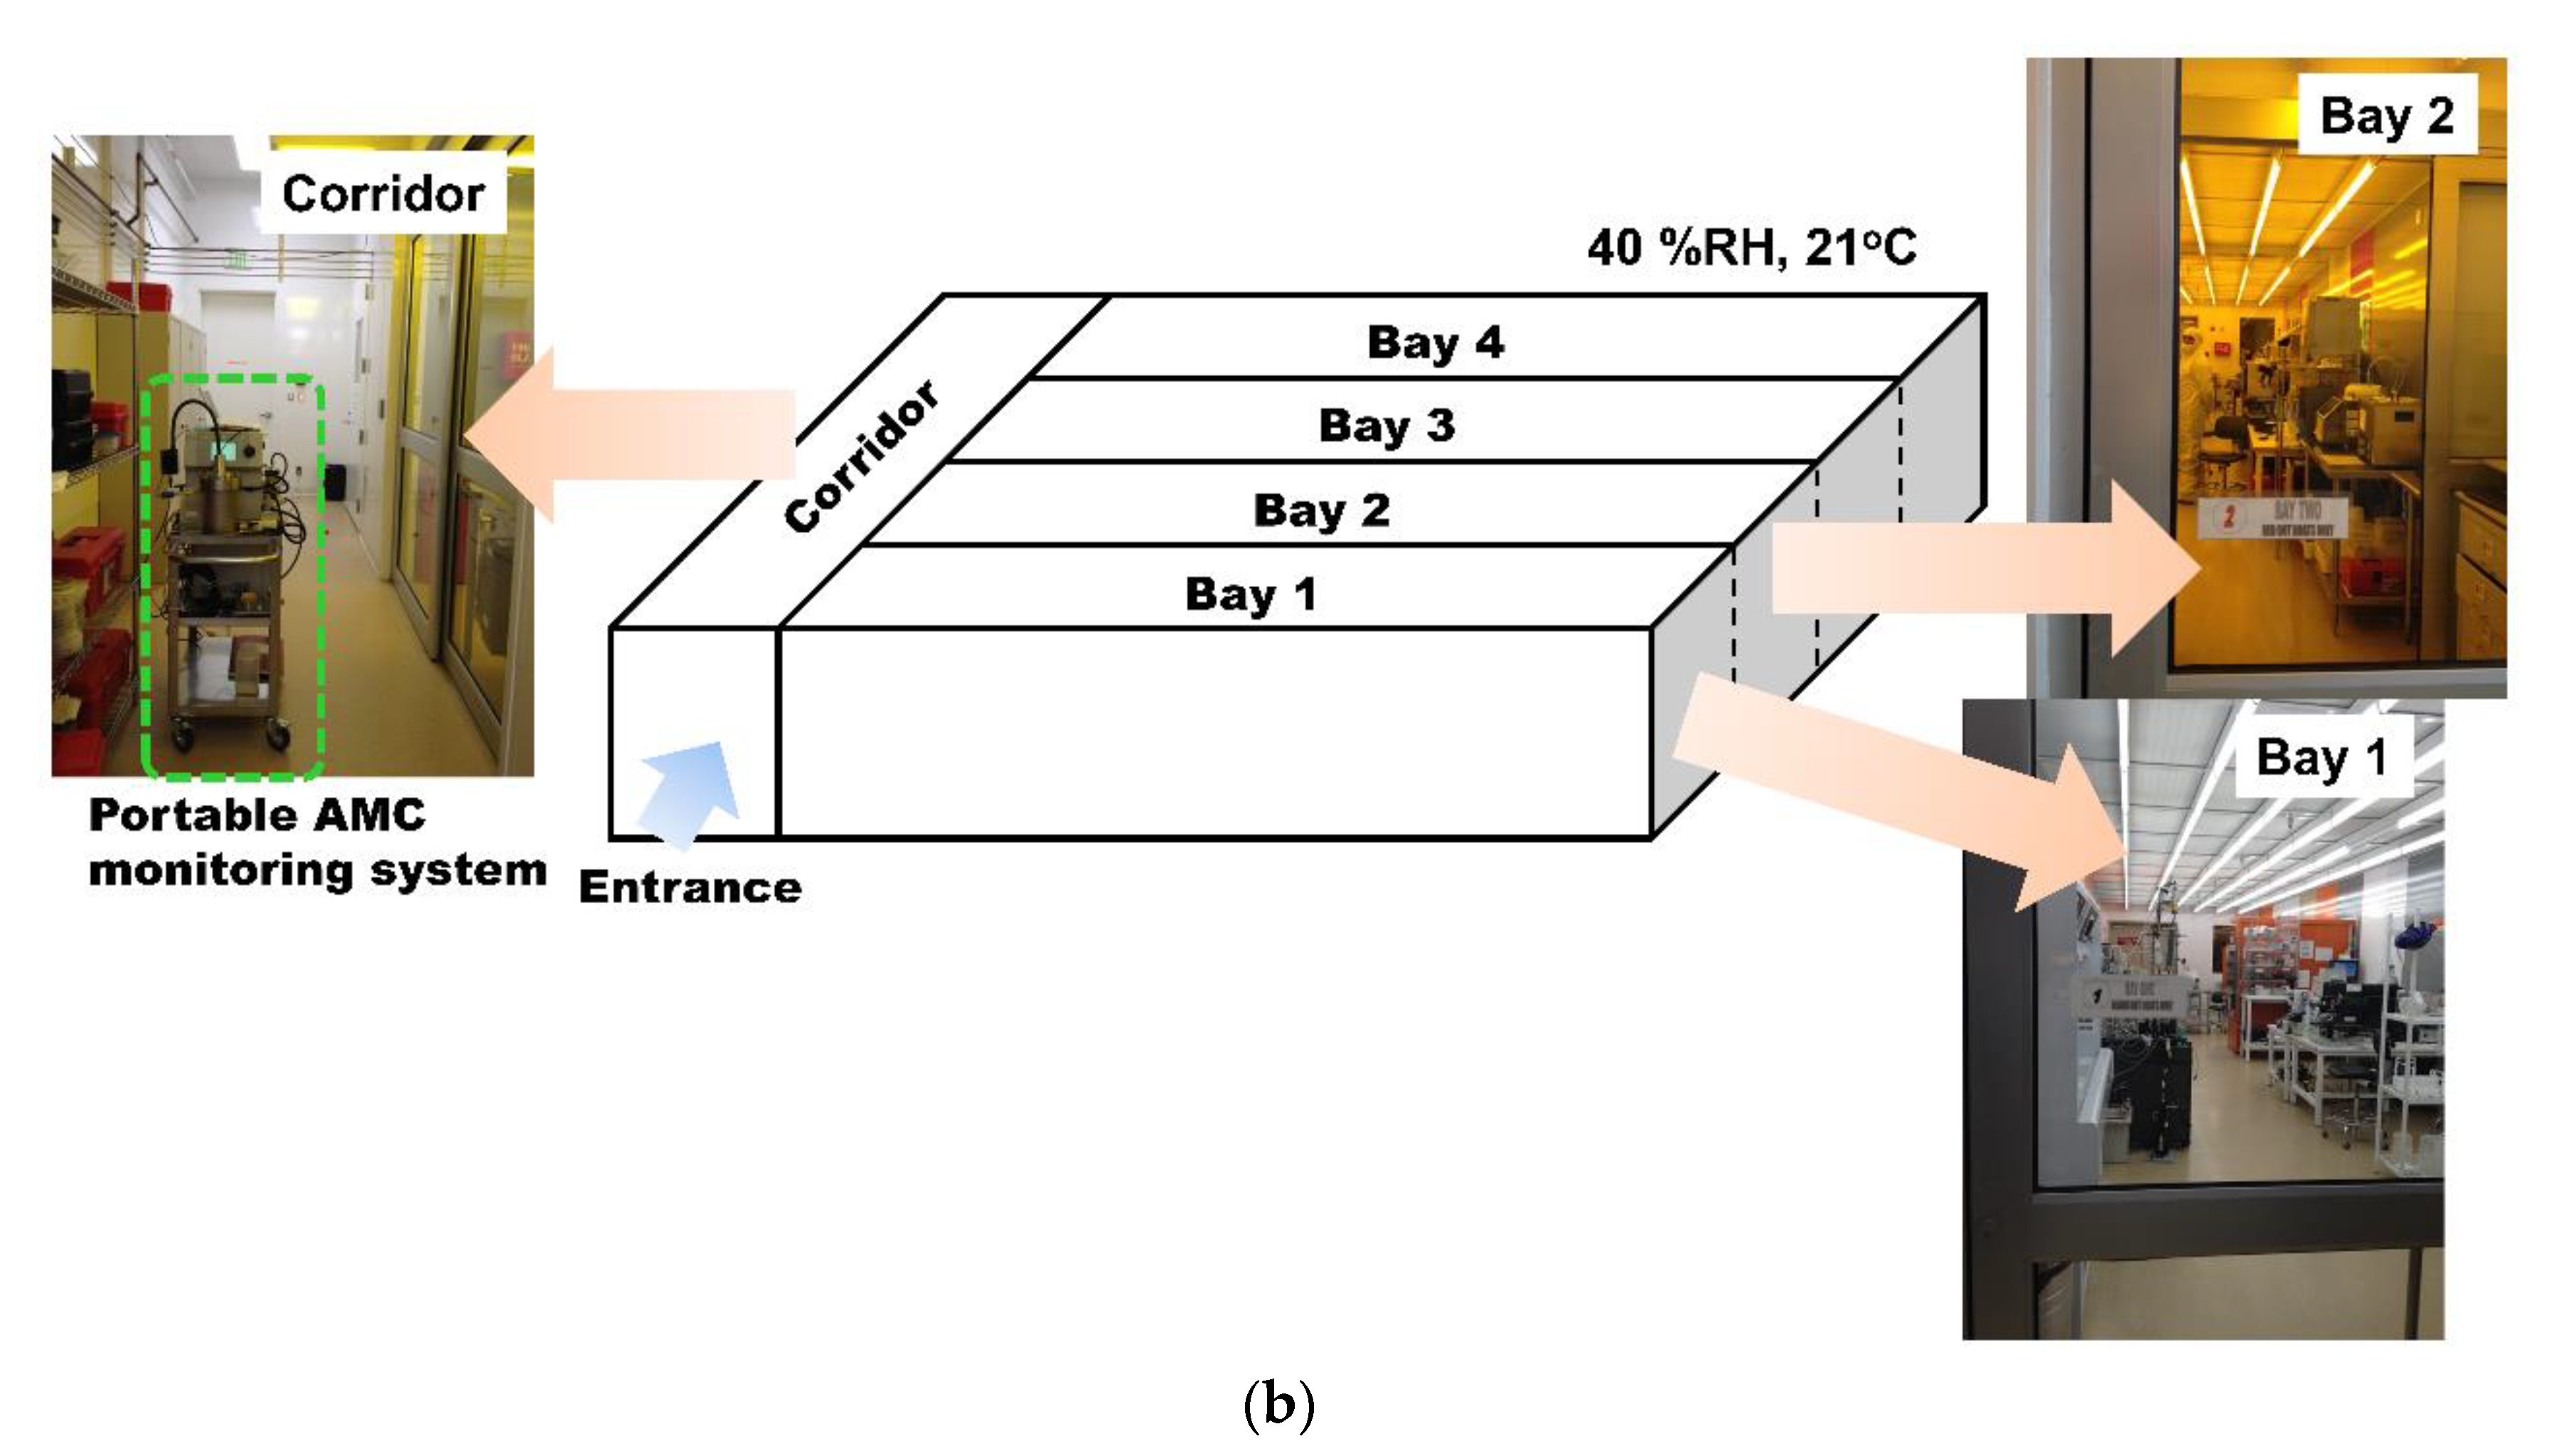
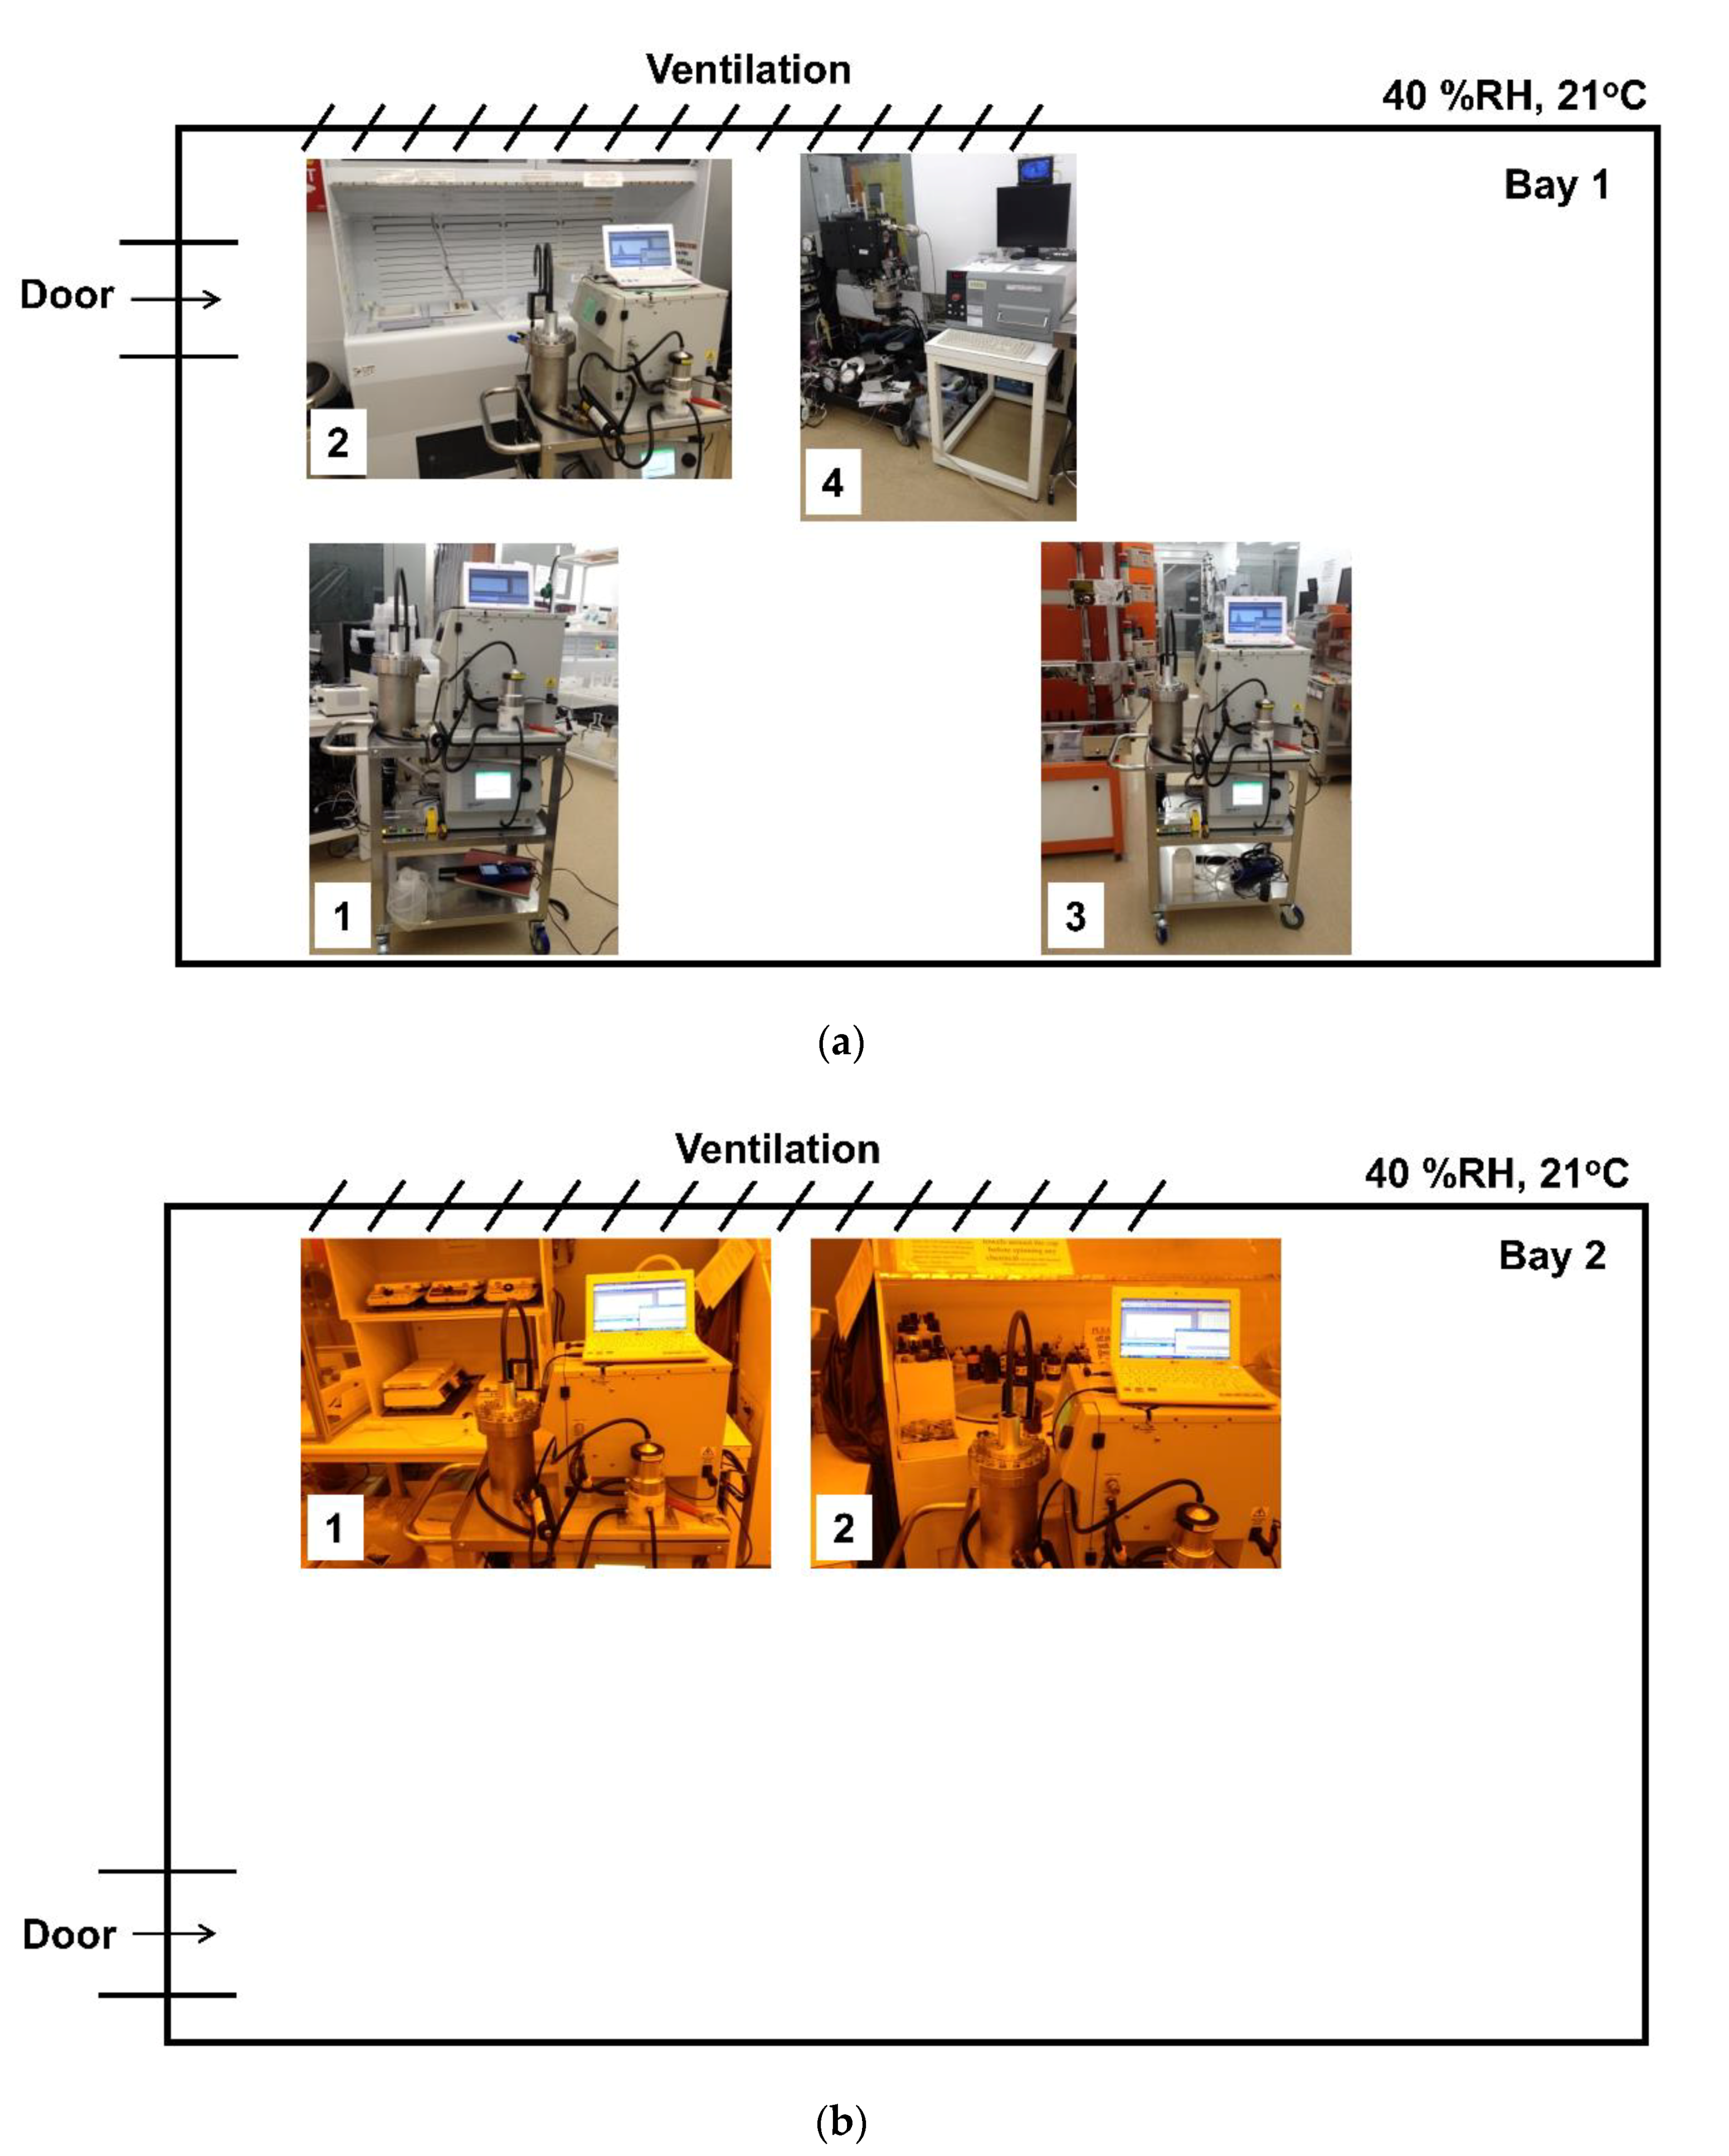
2.2. AMC Monitoring Sites in A Cleanroom at the University of Minnesota

Figure 2 depicts the different monitoring sites in a cleanroom at the University of Minnesota for the measurements of AMCs through the portable soft X-ray radiolysis detector. The cleanroom air was well conditioned at 40% relative humidity (RH), 21 °C and consisted of 4 different bays with a common corridor as shown in Figure 2a. Among the bays, Bay 1 and 2 had different facilities used for semiconductor manufacturing processes. Bay 1 had a wet bench, chemical vapor deposition (CVD) furnace, and some analysis instruments including microscopes, and Bay 2 mainly had instruments for photoresists (PR) coating processes. Therefore, Bay 2 equipped yellow lamps, instead of normal cold cathode fluorescent ones installed in Bay 1. Bay 3 and 4 were used for the cleanroom utility and post processing of semiconductor products. In this study, the portable AMC monitoring system was operated in Bay 1 and Bay 2, where main semiconductor manufacturing processes were conducted and most personnel worked in. The several sub-locations for the AMC measurements in Bay 1 and 2 are shown in Figure 2a,b, where AMC can be emitted and suspended in the cleanroom air environment, such as an ellipsometer (Bay1-1), a wet-bench (Bay1-2), a CVD furnace (Bay1-3), and a nanoparticle deposition system (Bay1-4) in Bay 1; PR drying station (Bay2-1) and spincoater (Bay2-2) in Bay 2. Bay 1 may have acidic and basic AMCs from the wet bench and CVD furnace as well as personnel working with the analysis instruments, but Bay 2 was expected to have organic AMCs from the PR processes [18,19,20]. In addition, 2 sub-locations of the common corridor were also monitored (Corridor-1: at the entrance of the cleanroom, Corridor-2: at the opposite end of the corridor).

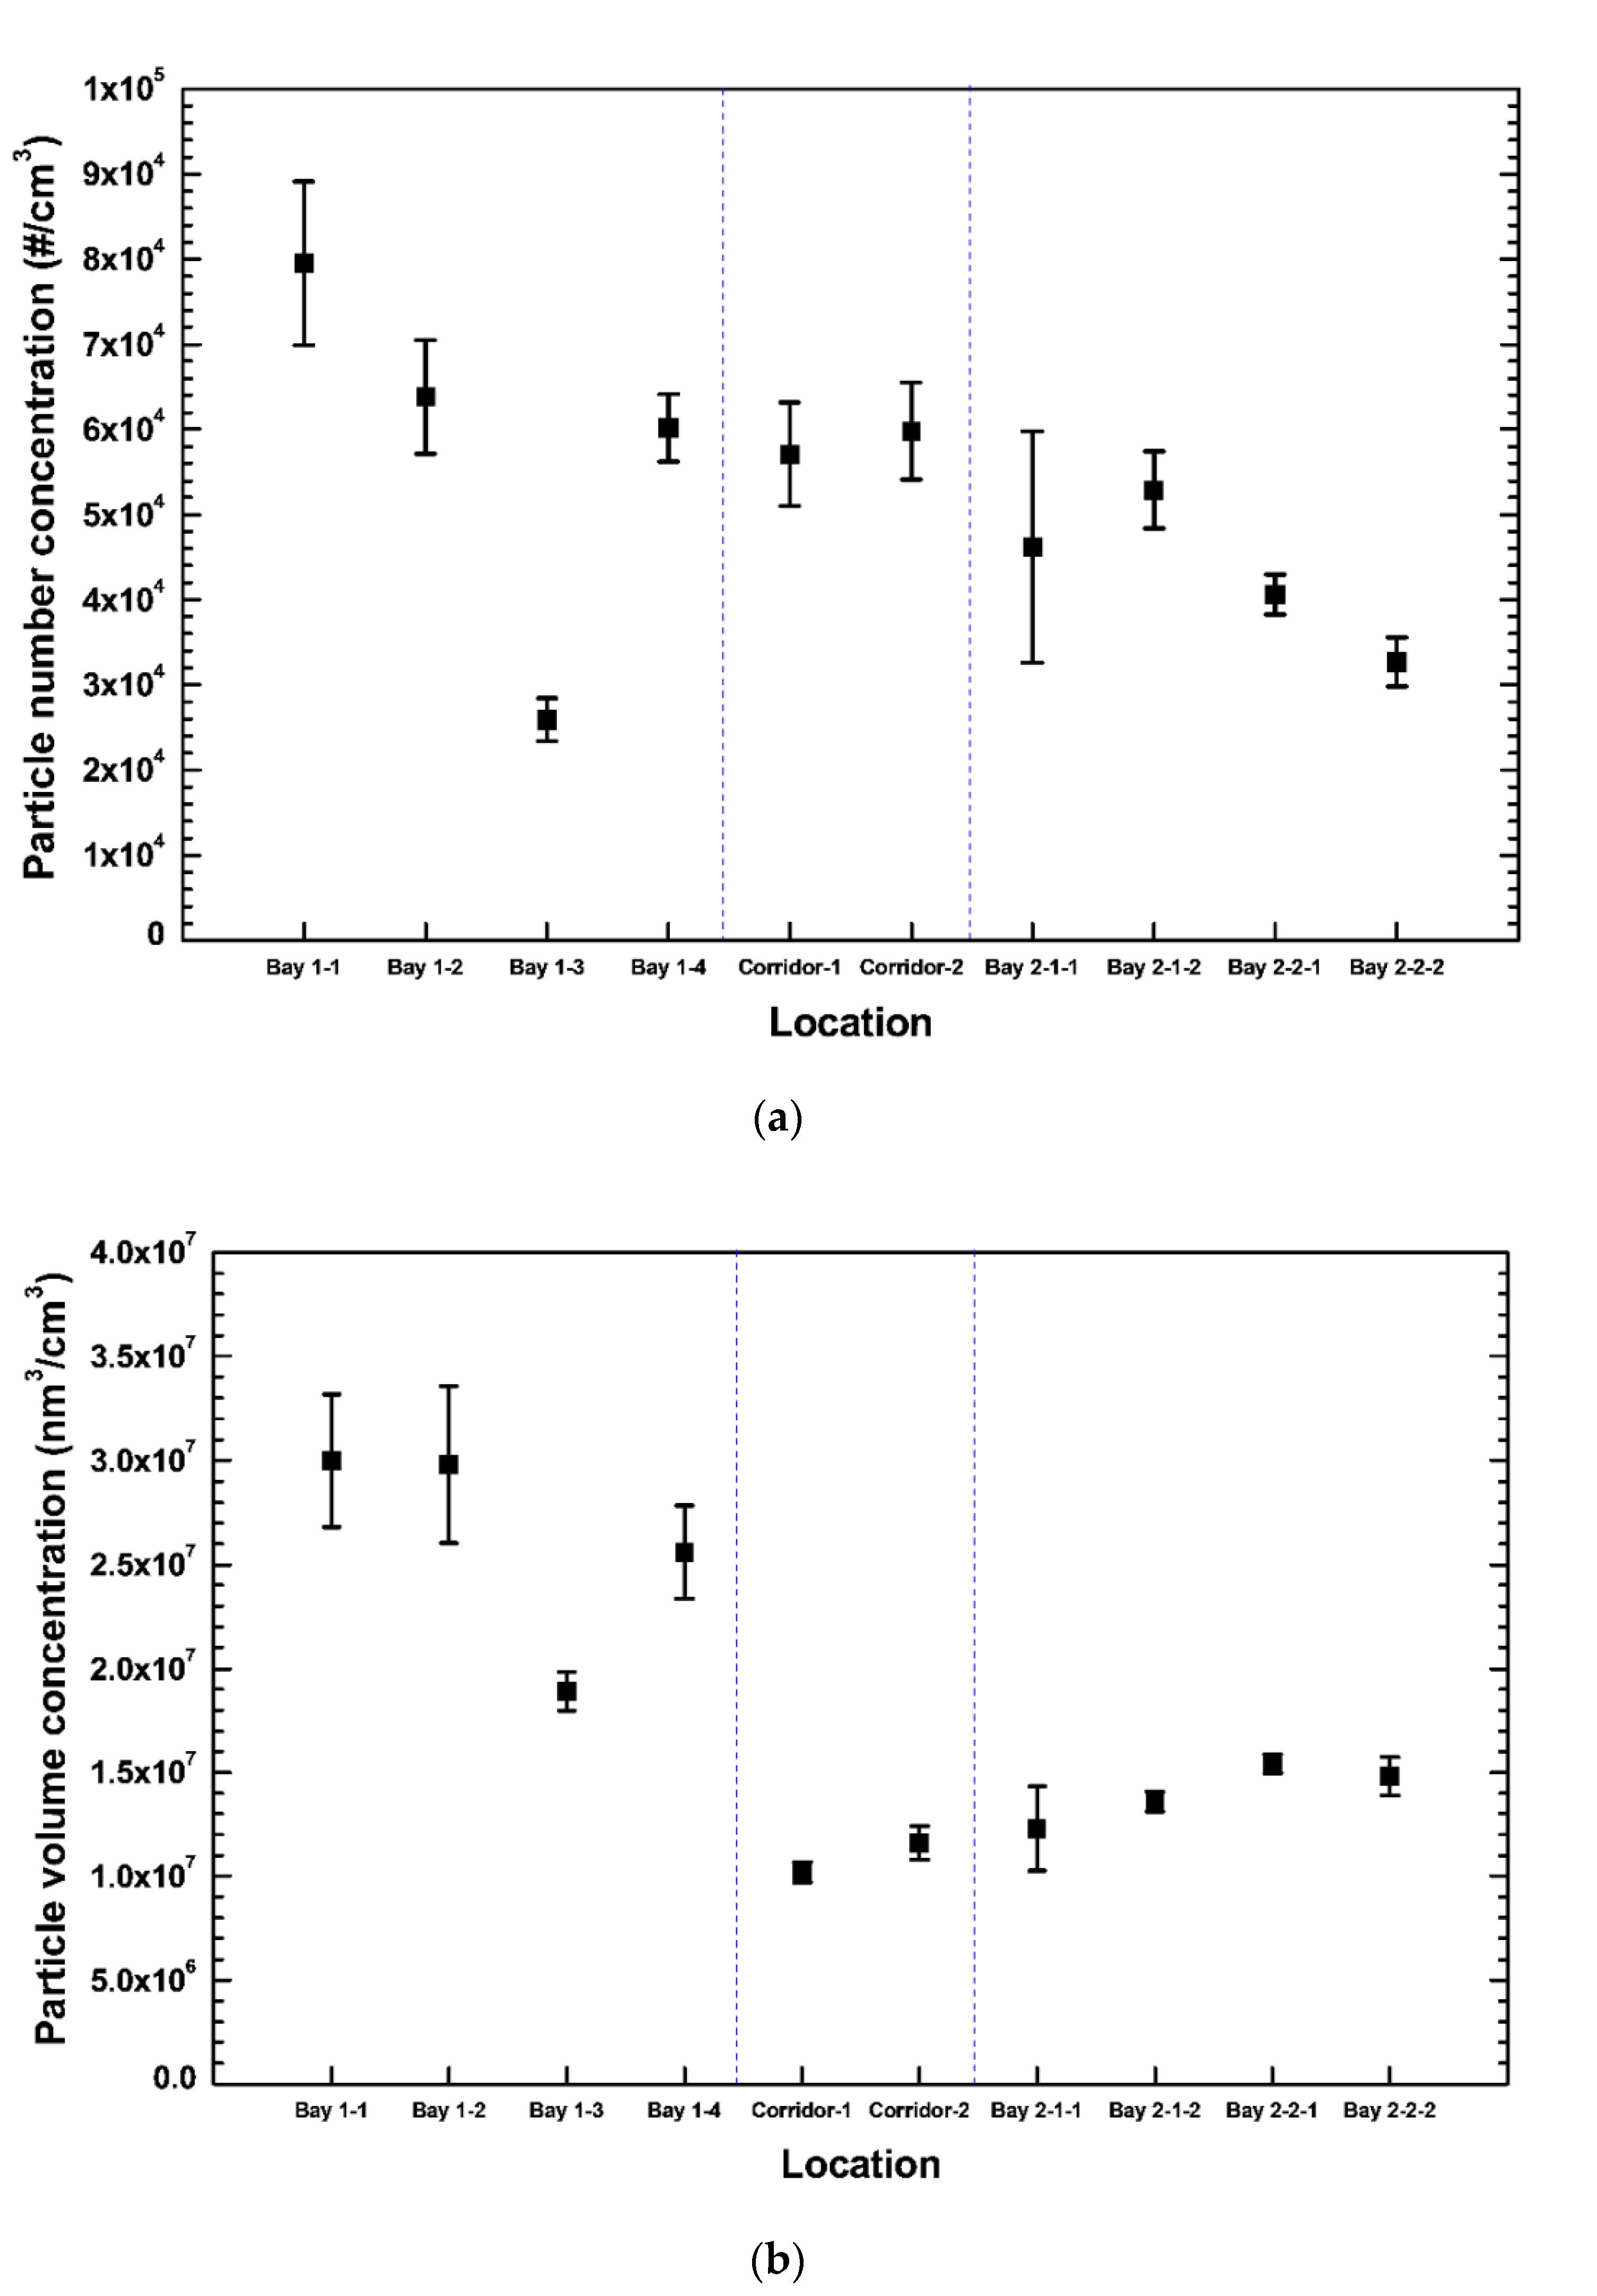
2.3. Estimation of AMC from the Measured Size Distributions of Nanoparticles Synthesized through Soft X-Ray Radiolysis

AMC in the cleanroom air is measured in terms of number size distributions of nanoparticles by the SMPS of the portable AMC detector. To compare the relative AMC levels at different sub-locations in the cleanroom, total particle number concentration (Np,total) was calculated for each sub-location in the cleanroom by integrating the measured number size distributions. Total particle volume concentration (Vp,total) was also calculated by converting the number size distributions into volume ones and integrating the volume size distributions. In addition to Np,total and Vp,total, AMC concentration can be estimated using calibration curves between AMC and the particulate properties [7,8]. Due to soft X-ray radiolysis being a mass- (or volume-) based gas-to-particle conversion, Vp,total is appropriate for calculating equivalent AMC concentrations in the air. In this study, the equivalent AMC concentration was obtained in terms of the sulfur dioxide (SO2) (ppbV) from Vp,total (nm3/cm3) of the nanoparticles through an equation obtained by Kim and his colleagues [7] as
[ S O 2 ] = 4.452 × 10 10 [ V p , t o t a l ] 7.162 × 10 19 [ V p , t o t a l ] 2 + 1.006 × 10 27 [ V p , t o t a l ] 3
Even though the cleanroom air can contain various kinds of gaseous compounds in addition to SO2, we use the calibration curve for SO2 because SO2 is one of the major contributors to secondary particle formation [21,22,23] through gas-to-particle conversion under irradiation, and can infiltrate into the cleanroom after passing through particle filters. Later, more precise and systematic analyses will be conducted for investigating the chemical composition of AMCs converted into nanoparticles through soft X-ray radiolysis and developing better calibration curves to estimate the AMC concentration in the cleanroom air environment.

3. Results and Discussion

Figure 3a shows Np,total and Vp,total calculated from the number distributions of particles measured by the portable AMC monitoring system at different sub-locations in the university’s cleanroom. All the Np,total are less than 1 × 10⁵/cm3, which represents very low AMC concentration in the cleanroom air, compared to that for 1 ppb SO2 reported in our previous publication [7]. Based on the results in Figure 3a, most sub-locations in Bay 1 generally show more AMC concentrations in terms of Np,total than other locations (Corridor and Bay 2). However, Bay 1-3 has the lowest Np,total than all other sub-locations, which can be understood that the sub-location, Bay 1-3, was the cleanest one in the cleanroom during the measurements. An open door next to Bay 1-3 for entering to the utility area with lower air pressure than Bay 1 might cause the lowest value.
Figure 3b depicts Vp,total calculated from the volume distributions of particles converted from the measured number distributions of particles. In this case, Bay 1-3 shows higher value than the sub-locations in Corridor and Bay 2, even though it was still the cleanest one in Bay 1 in terms of Vp,total. This difference of the trends in the relative AMC concentrations among the sub-locations between Np,total and Vp,total was caused by the particle size converted from AMC. Although the total number concentration for Bay 1-3 was lower than those for the sub-locations in Corridor and Bay 2, the sizes of particles converted from AMC through the soft X-ray radiolysis in Bay 1-3 were larger than those in Corridor and Bay 2. As the soft X-ray radiolysis is a gas-to-particle conversion, which is a mass- (or volume-) based conversion, using Vp,total (the density for the particles are unknown) in Figure 3b is more appropriate for estimating AMC concentration in the cleanroom air [7].
Figure 4 represents the equivalent SO2 concentrations corresponding to Vp,total in Figure 3b, which were calculated through the Equation (1) and all of them are lower than 15 pptV. Interestingly, Bay 2 for PR processing shows lower concentration than Bay 1. Even though many chemicals were used in Bay 2 areas, the total number concentrations of nanoparticles converted from AMC in the cleanroom air were not exceeding those measured in Bay 1. This can be explained that the air with AMC was well-evacuated, thus reducing Np,total and Vp,total in Figure 3a,b. Especially, the difference between Bay 1 and 2 was more apparent in terms of Vp,total, because the size of the nanoparticles converted from the AMC in Bay 2 was smaller than Bay 1. This might be achieved by the hood system for the PR processes, which was well equipped and operated. If the chemical properties of AMC in Bay 2 were all organics and Bay 1 had more acidic and basic AMCs than Bay 2, the conversion rates from the organic AMCs in Bay 2 could be slower than AMCs in Bay 1. Then, the particle or haze formation problems could be lower in Bay 2 than Bay 1, even though Bay 2 had more AMC sources. We developed this portable AMC monitoring system for determining AMC hot spots in real-time, and analyzing the chemical composition of the AMC was out of the scope of this study. In addition, one of the main issues of AMC is gas-to-particle or haze conversion due to photochemical processes with UV in the lithography processes. Therefore, AMCs, which cause the particle and surface contamination, were more concerning in this research. Calculating the equivalent SO2 concentration can be a facile method to estimate the AMC concentration levels in the cleanroom air. As shown in Figure 4, the AMC concentration in the cleanroom air was very rare, as low as 15 pptV equivalent SO2 concentration. The cleanroom seemed to be well maintained with the hood system for evacuating the AMC that originated from the materials used in the semiconductor manufacturing processes and personnel working in the cleanroom. Even though the cleanroom did not show high AMC concentration, the portable AMC monitoring system could measure AMC in the cleanroom air in real-time, i.e., different AMC concentrations at different locations.

4. Conclusions

We investigated the AMC levels at different sub-locations in the cleanroom air environment through a portable AMC detector deploying soft X-ray radiolysis, which consists of (1) soft X-ray chamber for converting AMC into nanoparticles and (2) SMPS for measuring the size distribution of the converted nanoparticles. The portable AMC detector showed different AMC concentrations at the different sub-locations in the cleanroom. By calculating the equivalent SO2 concentration (one of the major AMCs), we could determine the AMC level roughly in the cleanroom air, even though the concentration was as low as 15 pptV SO2. This study showed that the portable soft X-ray radiolysis-assisted AMC detector was a good candidate for determining AMC hot spots in real-time, which can help the semiconductor industry increase the production yield by tackling AMC issues in the semiconductor manufacturing processes promptly. Further research for upgrading this technique is required for quantifying multiple AMCs other than SO2 and developing a cheap and battery-operated hand-held AMC monitor through soft X-ray radiolysis in cleanrooms.

Author Contributions

Conceptualization, C.K. and D.Y.H.P.; methodology, C.K.; validation, C.K.; formal analysis, C.K. and K.C.; investigation, C.K.; data curation, C.K. and K.C.; writing—original draft preparation, C.K. and K.C.; writing—review and editing, C.K. and D.Y.H.P.; visualization, C.K. and K.C.; supervision, C.K. and D.Y.H.P.; project administration, C.K. and D.Y.H.P.; funding acquisition, C.K. All authors have read and agreed to the published version of the manuscript.

Funding

This work was supported by a 2-year Research Grant of Pusan National University.

Conflicts of Interest

The authors declare no conflict of interest.

References

  1. Den, W.; Bai, H.; Kang, Y. Organic Airborne Molecular Contamination in Semiconductor Fabrication Clean Rooms. J. Electrochem. Soc. 2006, 153, G149. [Google Scholar] [CrossRef]
  2. Weineck, G.; Zastera, D.; Dallas, A.J. AMC Control in Photolithography: The Past Decade in Review. Proc. SPIE 2010, 7638, 76383H. [Google Scholar]
  3. Lobert, J.M.; Srivastava, R.; Belanger, F. Airborne molecular contamination: Formation, impact, measurement and removal of nitrous acid (HNO2). In Proceedings of the 29th Annual SEMI Advanced Semiconductor Manufacturing Conference (ASMC), Saratoga Springs, NY, USA, 30 April–3 May 2018; IEEE: New York, NY, USA, 2018; pp. 180–185. [Google Scholar]
  4. Otto, M. Airborne molecular contamination: Quality criterion for laser and optical components. Proc. SPIE 2015, 9346, 93460F. [Google Scholar]
  5. Daly, J.G. Contamination and UV lasers: Lessons learned. Proc. SPIE 2015, 9573, 95730C. [Google Scholar]
  6. Chuang, T.S.; Chang, L.M. To mitigate airborne molecular contamination through ultra-pure air system. Build. Environ. 2013, 59, 153–163. [Google Scholar] [CrossRef] [Green Version]
  7. Kim, C.; Zuo, Z.; Finger, H.; Haep, S.; Asbach, C.; Fissan, H.; Pui, D.Y.H. Soft X-ray-assisted detection method for airborne molecular contaminations (AMCs). J. Nanopart. Res. 2015, 17, 126. [Google Scholar] [CrossRef]
  8. Kim, C.; Sul, Y.T.; Pui, D.Y.H. Real-time and online screening method for materials emitting volatile organic compounds. J. Nanopart. Res. 2016, 18, 282. [Google Scholar] [CrossRef]
  9. Kim, C.; Pui, D.Y.H. Experimental study on the filtration efficiency of activated carbons for 3-30 nm particles. Carbon 2015, 93, 226–229. [Google Scholar] [CrossRef]
  10. Kim, C.; Kang, S.; Pui, D.Y.H. Removal of airborne sub-3 nm particles using fibrous filters and granular activated carbons. Carbon 2016, 104, 125–132. [Google Scholar] [CrossRef]
  11. Kim, C.; Lee, H.; Juelfs, A.; Haynes, C.L.; Pui, D.Y.H. The effect of filtered nanoparticles on gas filtration efficiency of granular activated carbons. Carbon 2017, 121, 63–71. [Google Scholar] [CrossRef]
  12. Kim, C.; Chen, S.-C.; Zhou, J.; Cao, J.; Pui, D.Y.H. Measurements of outgassing from PM2.5 collected in Xi’an, China through Soft X-ray radiolysis. IEEE Trans. Semicond. Manuf. 2019, 32, 259–266. [Google Scholar] [CrossRef]
  13. Licciardello, A.; Puglisi, O.; Pignataro, S. Effect of organic contaminants on the oxidation kinetics of silicon at room temperature. Appl. Phys. Lett. 1986, 48, 41–43. [Google Scholar] [CrossRef]
  14. Schueler, B.W. Microscope imaging by time-of-flight secondary ion mass spectrometry. Microsc. Microanal. Microstruct. 1992, 3, 119–139. [Google Scholar] [CrossRef]
  15. Blake, R.S.; Monks, P.S.; Ellis, A.M. Proton-transfer reaction mass spectrometry. Chem. Rev. 2009, 109, 861–896. [Google Scholar] [CrossRef]
  16. Lindinger, W.; Jordan, A. Proton-transfer-reaction mass spectrometry (PTR–MS): On-line monitoring of volatile organic compounds at pptv levels. Chem. Soc. Rev. 1998, 27, 347. [Google Scholar] [CrossRef]
  17. Jordan, A.; Haidacher, S.; Hanel, G.; Hartungen, E.; Herbig, J.; Märk, L.; Schottkowsky, R.; Seehauser, H.; Sulzer, P.; Märk, T.D. An online ultra-high sensitivity Proton-transfer-reaction mass-spectrometer combined with switchable reagent ion capability (PTR + SRI − MS). Int. J. Mass Spectrom. 2009, 286, 32–38. [Google Scholar] [CrossRef]
  18. Hinsberg, W.D.; MacDonald, S.A.; Clecak, N.J.; Snyder, C.D. Airborne Contamination of a Chemically Amplified Resist. 2. Effect of Polymer Film Properties on Contamination Rate. Chem. Mater. 1994, 6, 481–488. [Google Scholar] [CrossRef]
  19. Hada, H.; Watanabe, T.; Kinoshita, H.; Komano, H. Outgassing Analysis in EUV Resist. J. Photopolym. Sci. Technol. 2005, 18, 475–480. [Google Scholar] [CrossRef] [Green Version]
  20. Kobayashi, S.; Santillan, J.J.; Oizumi, H.; Itani, T. EUV resist outgassing release characterization and analysis. Microelectron. Eng. 2009, 86, 479–482. [Google Scholar] [CrossRef]
  21. Kirkby, J.; Curtius, J.; Almeida, J.; Dunne, E.; Duplissy, J.; Ehrhart, S.; Franchin, A.; Gagné, S.; Ickes, L.; Kürten, A.; et al. Role of sulphuric acid, ammonia and galactic cosmic rays in atmospheric aerosol nucleation. Nature 2011, 476, 429–433. [Google Scholar] [CrossRef]
  22. Wood, W.P.; Castleman, A.W.J.; Tang, I.N. Mechanisms of aerosol formation from SO2. J. Aerosol Sci. 1975, 6, 367–374. [Google Scholar] [CrossRef]
  23. Lehtipalo, K.; Yan, C.; Dada, L.; Bianchi, F.; Xiao, M.; Wagner, R.; Stolzenburg, D.; Ahonen, L.R.; Amorim, A.; Baccarini, A.; et al. Multicomponent new particle formation from sulfuric acid, ammonia, and biogenic vapors. Sci. Adv. 2018, 4, eaau5363. [Google Scholar] [CrossRef] [PubMed] [Green Version]
Figure 1. (a) Schematic diagram of the portable detector for airborne molecular contamination (AMC) deploying Soft X-ray Radiolysis, and (b) the configuration of the cleanroom at the University of Minnesota.
Applsci 10 00978 g001aApplsci 10 00978 g001b
Figure 2. Details of the sub-locations as the monitoring sites for AMC in (a) Bay 1 and (b) 2 of the cleanroom at the University of Minnesota. The cleanroom air was well conditioned at 40% relative humidity (RH), 21 °C.
Applsci 10 00978 g002
Figure 3. (a) Total particle number and (b) volume concentrations measured at different sub-locations in the cleanroom at the University of Minnesota by the portable AMC detector through soft X-ray radiolysis.
Applsci 10 00978 g003
Figure 4. Equivalent SO2 concentrations calculated from the total particle volume concentrations through the calibration curve between SO2 and the total particle volume concentrations.
Applsci 10 00978 g004

