Abstract
Lithium-ion batteries (LIBs) are now used in electric vehicles (EVs), and the electrolyte is one of the major components governing the performance of LIBs. The patent count-based method or patent indicator was used to understand the development status of the specific technology field. However, these approaches cannot provide a complete picture to realize the technology development. Therefore, the goal of this work is to develop a holistic approach to identify technological development trends. The top six patent assignees are first selected by an issued patent counts analysis, including Ube, Mitsubishi Chem., Panasonic, Sony, LG Chem., and Samsung SDI. The “modified” Ernst indicators are applied to reflect different innovation strategies among these patent assignees. The forward-citation analysis and technology-function matrix show that using mixed lithium salts and organic solvents with novel additives compounds are the developing trends to improve the performance of LIBs. The multi-dimensional scaling shows technological similarities among these six companies. The developed approaches can be used to obtain a better overview for electrolyte technology and be also applicable to other technological fields.
1. Introduction
Rechargeable lithium-ion batteries (LIBs) have been widely used in electronic devices due to the high power capacity, high energy density, long cycle life, etc., and they are now being used in electric vehicles (EVs). Safety and the driving range of EVs are possibly prime concerns for the regulatory authorities and consumers. Among the most important parts of batteries, the electrolyte is one of the main factors to affect the safety, cost, and capacity of LIBs. An electrolyte solution is composed of at least three essential constituents: lithium salt, additives, and a solvent or a mixture of solvents. These three parts interact with each other electrochemically and solid electrolyte interface (SEI) film formed during the initial charging and discharging cycles [1,2,3,4]. The formation mechanism of the SEI layer is complicated and not well understood yet, but the formation of the SEI layer takes place on the anode surface. The stable interfacial chemistry between the electrode and electrolyte is generally believed to be tightly associated with the performance of the electrochemical devices.
In order to discover the appropriate electrolyte composition of LIBs for EVs, understanding the development trends in the patent database is a useful method. Based on the information through exploring the development trends, companies/organizations can manage their R&D resources and strategies [5]. According to the report of the World Intellectual Property Organization (WIPO), 90–95% of the world’s inventions can be found in patents. Furthermore, if patent documents are employed to assist research and development (R&D), the time for research can be shortened by up to 60%, and the cost can be lowered as much as 40% [6]. Patent analysis refers to the process of using patent search techniques to retrieve patent information relevant to the subject of study, so as to transform the huge and trivial patent data into systematic and valuable technological information [7,8,9]. Patent analysis is useful in predicting technology on the basis of information retrieved as it conceives patents as the original source of information and commercial value. Furthermore, the patent analysis produces numerical results to discover important technological fields. Wagner et al. conducted a patent analysis to give an overview of the patent landscape within the field of LIBs [10]. They used annual patent counts to analyze research trends of LIBs’ component from the 1990~2010 years. Golembiewski et al. took the patent families counts as data to analyze the R&D activities of batteries from the 2000~2011 years [11]. Pilkington et al. also used patent counts to analyze development status in the electric vehicles industry from the 1977~2000 years [12]. These authors use the change of annual patent counts to discover the development situation in a specific technology. The results can help people gain skill in the art of understanding the relationship between the period of time of concern and patent activities. However, it would be rather difficult to see the patent assignees’ R&D strategies merely by a patent count analysis. Moreover, the interpretation of the development trends and the hidden intelligence behind the patent count analysis becomes still subjective.
Using the patent indicator is another way for a patent analysis. H. Ernst used several patent indicators to analyze the patenting behavior of 50 business firms within the German mechanical engineering industry in 1995 [13]. These indicators included the counts of international patent applications, the rate of valid patents and patent citation counts. The result showed that a high indicator value is positively related to company profit performance. In 1998, H. Ernst further created new indicators to analyze the German, European and Japanese mechanical engineering companies to provide insights for strategic R&D planning [14]. These indicators include the relative patent position (RPP), technology attractiveness, etc. These indicators are used to transform patent counts to meaningful information, which help people skill in the art to realize the R&D strategies of companies in a specific industry.
In addition to the static patent count-based method, patent citation has been frequently considered as the fundamental core for various analysis techniques. Yuan et al. reviewed several journal papers and found that a citation can be used to forecast technology development [15]. Patent citation analysis can be used to predict the diffusion speed of various technologies and to further point out valuable technology [16]. Yang et al. suggested that citation counts are strongly associated with the technological merits of the patent [17]. Therefore, citation can provide significant information about the potency of the corresponding inventions and their impacts and relevance on the subsequent technological development. Multi-dimensional scaling (MDS) is a way of visualizing the level of similarity of individual cases of a data set [18] and is another useful indicator, which can be used to identify the technology type among different patent assignees [19,20]. The degree of technological similarity among several patent assignees can be clearly explored by the MDS technique. However, none of individual analysis methods in previous literatures can provide a complete picture in discussing the development status, even forecasting technological trends. Therefore, the goal of this study is to develop a methodology to obtain a better overview of technologies.
2. Methodology
2.1. Patent Information
The analysis started by selecting “lithium”, “battery”, and “electrolyte” as keywords in the abstract field with the Boolean operator “AND” for patents published during the time period of 2005–2015. The retrieved bibliometric information included patent numbers, title, filing date, publication date, names of inventors, and assignees and their nationalities, CPC codes, backward and forward citation. The CPC codes were further used to categorize these electrolyte-related patents into three groups concerned in the study, namely H01M10/0567 (additives), H01M10/0568 (lithium salts), and H01M10/0569 (solvents). The data retrieved were organized by the use of “Derwent Innovation” system (Clarivate Analytics Corporate) and collected from the five largest intellectual property offices (IP5), namely the European Patent Office (EPO), the Japan Patent Office (JPO), the Korean Intellectual Property Office (KIPO), the National Intellectual Property Administration of the People’s Republic of China (CNIPA or previously known as SIPO), and the United States Patent and Trademark Office (USPTO). Furthermore, corporation patent classification (CPC) was used to identify the technology category. The subsidiary and merged companies were consolidated and treated as the same assignee for analysis. All the data were collected from 2005 to 2015 and analyzed from 2016.
It is worth mentioning that the nature and legal implication between the patent application and issued patent are very different. Compared with the methods based on the counts of patent applications, analysis using issued patents seems to be able to reflect the actual technological novelty and advancement. Consequently, issued patent counts are used in the patent indicators.
2.2. Patent Indicators
2.2.1. RGR and RDGR as a Combined Indicator
The issued patent counts were used in relative growth rate (RGR) and relative development growth rate (RDGR) in the study. The following Equations (1) and (2) show RGR and RDGR definition:
The RGR equation is the ratio of the average growth rate for one specific electrolyte technology to all electrolyte technologies. When RGR value is greater than 1, it means that the average growth rate of one specific technology is higher than all technologies in ten years. It further indicates that one company shows great innovation strength in specific technology. Therefore, the RGR value is understood as “innovation strength” of one specific technology. The RDGR equation is the ratio of the average growth rate of one specific technology for the second 5-years to the first 5-years. The RDGR value is greater than 1, which represents that the average growth rate of the second 5-years is higher than the first 5-years. It further implies that the innovation in specific technology is a high priority to the patent assignee. That also indicates that the specific technology is prioritized over others for the patent assignee. RDGR can be thus understood as “innovation potentiality” of one specific technology. RGR and RDGR are combined as a new indicator and used to discover and compare R&D strategies among selected patent assignees.
2.2.2. RPP and RPA as a Combined Indicator
Relative patent position (RPP) is combined with revealed patent advantage (RPA) as a new indicator in the study. RPP means the ratio of a specific technique for a company to the leader one (which owns the most patent counts). It represents the “innovation leadership” of the company. It further indicates the “innovation ability” of the company. The RPP is defined in Equation (3):
When the value is 1, it means that the company is the leader in the specific technology field of interest and shows superior innovation ability to others. The difference of the RPP value to 1 indicates the relative difference in innovation ability between a specific company and the leader.
The revealed patent advantage (RPA) indicator was created by Schmoch [21] in 1995. Schmoch used RPA to fairly compare the technological advantages among companies of different sizes, since each company has different commercial strategies to develop its own technology. When one company has a higher RPA value, it means that it has better “innovation advantage” than others in the specific technological field. It further represents the company’s specific technology is more important. In this study, the RPA is defined in Equation (4):
where i represents the one specific technological field in three considered electrolyte technologies, j represents the one specific company. Pij is the issued patent counts of the company j in the technological field i. Hence, is the company j issued patent counts in three technological fields, and is all company granted patent counts in technique field i. is the sum of all granted patents by all company in all technological fields. The introduction of the logarithm leads to an asymmetric range of values and a neutral point 0, the tangents hyperbolics to a limitation to the boundaries of ±100.
The RPP value suggests the innovation ability and RPA represents an innovation advantage. RPP and RPA can be combined into a new indicator to compare innovation activity of a patent assignee, whereby the relationship between innovation ability and advantage is expected to provide additional insights to the patenting strategies of the companies of concern.
2.2.3. Citation Indicators
There are two kinds of citation: backward and forward. Backward citations refer to prior documents cited by this patent. Forward citations are later patents that cite this patent of interest. If the patent A has higher forward citation counts, it means that later patent documents cite patent A many times. It further indicates that patent A contains significant innovative technology and might enjoy a larger technological impact than others. Therefore, the forward citation is used in the study. After recording the data of each patent, all patents are ranked by forward citation counts. Furthermore, technological development trend can be discovered from the top patents with high forward citation counts.
2.2.4. Technology-Function Matrix
Japanese Patent Office (JPO) provides FI and F-term information classified by experts and the unique classification information offers a different hierarchical structure and viewpoints towards a certain technological field. FI and F-term information can be retrieved by the Derwent Innovation search system and the information is used to construct the Technology-function matrix (TFM). F-term “5H029” is known to be related to the LIB materials and technologies. The FI classification of LIBs’ electrolyte is H01M10/0567 (additives), H01M10/0568 (lithium salts), and H01M10/0569 (solvents). Herein, the viewpoint code “AJ” and its subgroups under the F-term 5H029 were selected as the purposes or effects, whereby viewpoint codes AM (electrolyte solutions or electrolyte materials), DJ (characteristics of elements or forms of batteries), EJ (materials of elements, excluding active substances and electrolyte solutions) and HJ (specific numerical limitation, size, or scope) were decided as the different technology means. By constructing a matrix of technology means vs. functional effects, it is expected to provide an overview of the distribution of patents in each technology category.
2.2.5. Text Mining Analysis—Multidimensional Scaling (MDS)
Text mining analysis was implemented using NetMiner (from CYRAM, www.cyram.com) to extract technological terms with high frequency from the patent claims and generate the semantic network map of these words. These terms were further artificially classified as technologies related to lithium salts, organic solvents, and additives. Furthermore, each point is described in the X–Y coordinate diagram to visualize their similarity or dissimilarity of electrolyte technology, depending their relative distances among all points. The X and Y values of technologies were calculated by the MDS method.
3. Results
The total issued patents of 4598 counts were retrieved during the period of 2005 and 2015. Among them, 2406 patents were contributed by the top six patent assignees shown in Table 1. These top six assignees with the highest patent counts contributed to more than 50% of the total patents and were thought to be representative enough for the analysis. The top six leaders included four Japanese companies: Ube Industries Ltd. (Ube), Mitsubishi Chemical Holdings Corp. (Mitsubishi Chem.), Panasonic Corp. (Panasonic), and Sony Corp. (Sony), and two South Korean firms: LG Chemical Ltd. (LG Chem.) and Samsung SDI Co Ltd. (Samsung SDI). The two Korean companies had the highest counts of issued patents and the fact demonstrated their active roles worldwide. The result also, to a large degree, agreed well with the current status of the corresponding LIB electrolyte industry.

Table 1.
Patent counts of top six patent assignees.
3.1. RGR and RDGR Combination Indicator
Figure 1 shows the RGR and RDGR results, where the dark color bar presents RGR and the light color bar shows RDGR. As mentioned above, the RGR value can be interpreted as the “innovation strength” of the specific technology and the RDGR value as the “innovation potentiality”. By combining RGR and RDGR, this indicator is a strong visualization approach to identify the R&D strategies in specific technology among several companies during 2005–2015. The modified RGR and RDGR indicator based on issued patents and can show the actual competitiveness of patent assignees in the field of electrolyte, whereas the patent application count-based method, previous Ernst’ indicator, shows the research efforts invested.
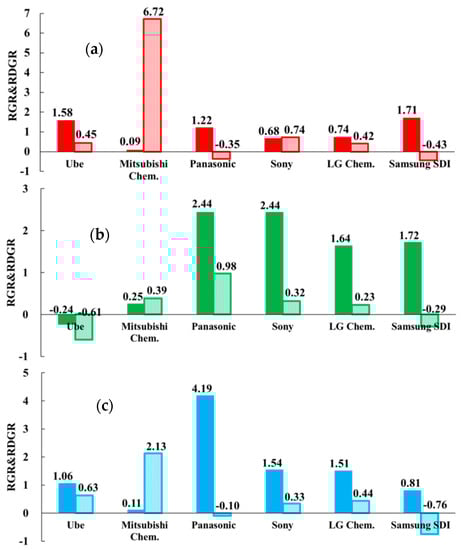
Figure 1.
Relative growth rate (RGR) and relative development growth rate (RDGR) of six selected companies in the fields of LIB’s electrolyte technologies: (a) H01M10/0567 (additives), (b) H01M10/0568 (lithium salts), and (c) H01M10/0569 (solvents).
Figure 1a shows the calculated RGR and RDGR values of six companies in the CPC code H01M10/0567, namely “additives”. Ube, Panasonic, and Samsung SDI showed greater than 1 for the RGR value, indicating that they had better innovation strength in developing additives than other companies. However, the negative RDGR values of Samsung SDI and Panasonic represented less innovation potentiality in the latter 5 years. In particular, Mitsubishi Chem. had an RGR value close to 0, which indicates less active development in additives or the relevant patenting activity was less notable when compared to other R&D activities within the enterprise. However, Mitsubishi Chem. showed a much higher RDGR value, 6.72, which means the average growth rate of issued patents were about six times in the second 5 years. It also represents that the company’s innovation in additives was more effective. Sony and LG Chem. had lower innovation strength in additives technology, which results in less innovation potentiality.
Figure 1b illustrates that the patenting activities of Panasonic, Sony, LG Chem., and Samsung SDI show great innovation strength with a greater RGR value. It means that they obtained considerable numbers of patents related to lithium salts technology. However, they were less active, and less progress was shown in the latter 5 years with RDGR less than l. Especially, Samsung SDI shows a negative RDGR value, which means the company was granted less patents in the second 5 years from the major patent offices. Ube shows delayed innovation strength and potentiality with negative RGR and RDGR values. It indicates that Ube was not specialized and interested in the development of lithium salts. Mitsubishi Chem.’s innovation strength was lower than Panasonic, Sony, LG Chem., and Samsung SDI and had average innovation potentiality in lithium salts.
In Figure 1c, Ube, Panasonic, Sony, and LG Chem. show better innovation strength in solvent technology. Especially, Panasonic outperformed others with an RGR value greater than 4, which means that Panasonic was great in the development for solvents. Nevertheless, they obtained fewer patents in the second 5 years and show less potentiality for innovation with a RDGR value less than 1. In particular, Mitsubishi Chem. had shown increasing interests and progress in solvent technology, as the company was the only one among six major assignees with a positive and high RDGR value. Comparatively, Samsung SDI had lower innovation strength and shows the weak potentiality in solvents technology.
With another viewpoint for Figure 1a–c, six patent assignees had totally different patenting strategies in the technological fields of electrolyte compositions. For example, in the Japanese companies, Ube is specialized in additives, Panasonic shows leadership in solvents and lithium salts, and Sony shows a strong presence in lithium salts. In addition, in the Korean firms, LG Chem. performed well in lithium salts and Samsung SDI outperformed in additives and lithium salts. However, the innovations from most companies seem to decrease because of low RDGR values. Mitsubishi Chem. is a company whose patenting history and strategies were different to others. It is to note that the company was featured with lower innovation strength (RGR value), but much higher innovation potentiality (RDGR value). It means that Mitsubishi Chem. obtained more patents, especially relating to additives and solvents technology in the latter 5 years. As shown in Table 1, Samsung SDI not only had the largest patents among six competitors, but also had enjoyed a leading position in additives and lithium salts. However, it was also the only company that had negative RDGR values in three technology fields of interests.
3.2. RPP and RPA Combination Indicator
If one takes the calculated RPP and RPA values of a company as its X–Y coordinate, it clearly shows that the innovation ability (i.e., RPP) and innovation advantage (i.e., RPA) among several patent assignees can be easily compared. Maps in Figure 2a–c show different coordination values of six patent assignees’ with respect to three technology fields of interests.
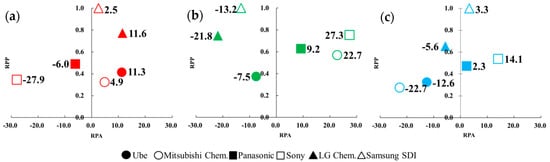
Figure 2.
Revealed patent advantage (RPA) and relative patent position (RPP) analysis of six companies based on three technological fields: (a) H01M10/0567 (additives), (b) H01M10/0568 (lithium salts), and (c) H01M10/0569 (solvents). For the purpose of clarity, only their RPA values were noted for easier comparison.
Figure 2a shows that LG Chem. and Samsung SDI had much higher innovation leadership and better innovation advantage than the Japanese ones in the additives technology. It means that two Korean companies have shown great innovation ability in receiving their patents and led other competitors. Apparently, this is expected to be closely related to the patenting activity and invested R&D resources. It also represents the development of additives technology is more important for Korean companies. Although four Japanese firms had a lower patent position, Ube and Mitsubishi Chem. show the same great innovation advantage as Korean patent assignees for developing additives. Figure 2b illustrates the patenting activities of Sony, Mitsubishi Chem., and Panasonic demonstrate a much better innovation advantage with a higher leading position in lithium salts technology. It further indicates that their lithium salts technologies were significant. It is worth mentioning that Samsung SDI and LG Chem. had a higher innovation leadership but shows a weaker innovation advantage than Japan. Figure 2c depicts that in the Japanese companies, Sony and Panasonic had a better advantage in organic solvents. It means that the organic solvents technology of Sony and Panasonic were considerable. Samsung SDI also had higher innovation leadership and a better innovation advantage in organic solvents technology.
With another point of view for Figure 2a–c, it can be discovered that six patent assignees had different patenting performance in developing electrolyte materials. For example, Ube and LG Chem. show a better advantage in additives, Mitsubishi Chem. and Sony were good at lithium salts, and Sony and Samsung SDI outperformed in solvents. Especially Sony had both better innovation advantages in technology of lithium slats and solvents among the six patent assignees. It is interesting to note that the Korean companies had a higher leading position in the three considered technologies than Japanese ones. This result was the same as the issued patent count analysis, which shows Samsung SDI and LG Chem. had more dominant positions than the Japanese companies. It is worth mentioning that one company with a higher leadership did not always show better innovation. Samsung SDI, for example, had the most patents in lithium salts technology and did not show a better innovation advantage than other firms. In contrast, one company with a lower patent position did not necessarily show a worse technology advantage. Sony is an example with a lower patent position but better innovation advantage in lithium salts technology.
3.3. The Forward-Citation Information
Citation counts were analyzed using the Derwent Innovation System. As aforementioned, high forward citation counts indicate that the patents of interest might have greater technological innovation or impact than others. Forward citation analysis is thus believed to be helpful in shedding light in the technological development. In this study, electrolyte compositions disclosed in these patents could be explored, as they were more frequently referred by the successive inventions that were considered more by competitors in the LIBs industry. Figure 3 illustrates that the top 10 patents were owed by Mitsubishi Chem. (4), Panasonic (3), Samsung SDI (2), and LG Chem. (1). Among these patents, seven patents were from the Japanese companies, Mitsubishi Chem. and Panasonic. It further means that Mitsubishi Chem.’s invention had a more prominent impact on the following inventions. The top 10 patents with high forward-citation counts were considered, and patent information were extracted and summarized in support information. Patent numbers, assignee name, forward citation counts, and electrolyte composition were described there.
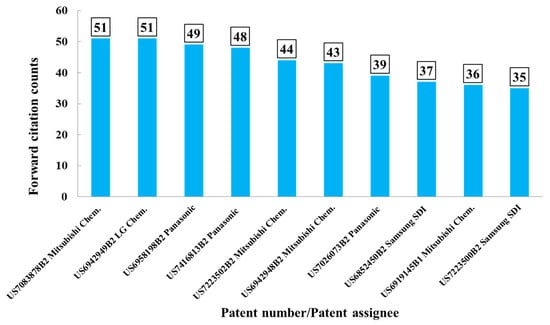
Figure 3.
Top 10 patents with high forward-citation counts.
There were two patents with the highest patent citation counts. One was US7083878B2 (published on 1 August 2006) by Mitsubishi Chem. An objective of the invention is to reduce the gas generation, while providing the battery with high capacity, excellent storage, charging/discharging, and cycling performance. The electrolyte compositions include mixed lithium salts, mixed organics solvent, and a least one additive compounds. The mixed lithium salts system was selected from (1) inorganic salts, e.g., LiPF6, LiBF4; (2) lithium salt, e.g., lithium cyclic 1,2-ethanedisulfonylimide, lithium cyclic 1,3-propanedisulfonylimide; (3) organic salts, e.g., LiN(CF3SO2)2, LiN(C2F5SO2)2, LiCF3SO3. The mixed organic solvents comprised of four types of carbonates, e.g., ethylene carbonate (EC), propylene carbonate (PC), and vinylene carbonate (VC) were widely used. Additives, e.g., cyclohexylbenzene, t-butylbenzene, t-amylbenzene, diphenyl ether, and dibenzofuran are used to prevent overcharge. The other patent was US6942949B2 (published on 13 September 2005) by LG Chem. Inorganic salts, e.g., LiPF6, LiClO4, and organic salts e.g., LiN(CF3SO2)2 are used together. EC, PC, and other carbonates (e.g., EMC, DEC, DMC) are also used as a mixed solvents system. The electrolyte solutions were similar to the aforementioned patent US7083878B2 with the difference in the additive, where 1,5-hexadiene, cyclohexene, and 4-vinylcyclohexene were used to be first oxidized at the cathode at a potential range over 4.3 V vs. Li/Li+ to form a passivation layer on the cathode material. With these additives in the electrolyte, the negative effects, such as structural deformation of the cathode or excess consumption of the electrolyte caused by overcharge could be prevented. More compositional information in the electrolyte disclosed by these two patents can be referred to Table 2. Complete information about the top 10 patents with high forward-citation counts can be found in Table S1 in the Supplementary Materials.
Table 2.
Patent information extracted from two patents with the highest forward citation number.
Among these patents, the invention of US6852450B2 is about a lithium-sulfur battery. Samsung used an additive in the gas form, e.g., CO2, SO2, and N2O to improve the cycle life with the forming of a SEI film on the surface of a negative electrode. From the above discussion, lithium inorganic/organic salts and carbonate solvents are believed still to be commonly uses in LIBs. Novel additive compounds are still an important factor to improve/enhance the performance of LIBs.
3.4. Technology-Function Matrix
Figure 4 illustrates the technology-function matrix, where X-axis is the function and Y-axis is the technology categories. A bubble graph is a great tool used to visualize the analysis results. The size of the bubble corresponds to patent counts: the larger the bubble, the higher the patent counts. By using the technology-function matrix analysis, the large bubble can be easily and quickly discovered. Moreover, the technology and function paid attention more by patent assignees can be explored. Furthermore, some large bubble also presents the percentage pie chart of patent assignees who lead in innovating technology. Therefore, the technology-function matrix is a useful tool that visualizes the developing trends.
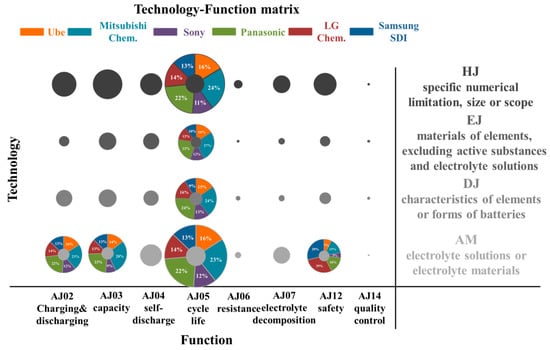
Figure 4.
Bubble chart of the technology-function matrix.
Figure 4 shows that the largest bubble locates at AM (electrolyte solutions or electrolyte materials) and AJ05 (cycle life or cycle characteristics). It means that six patent assignees focused more on developing electrolyte materials to improve the cycle characteristics of LIBs. It also indicates that electrolyte composition was a significant impact on cycle life performance. Another much bigger bubble was at HJ (specific numerical limitation, size or scope) and AJ05. It represents that six patent assignees also considered the component ratio in the electrolyte. These patent assignees are also considered in developing battery elements (EJ and DJ), ex: anode, cathode, or separator materials to enhance the performance of cycle characteristics. Charging and discharging characteristics (AJ02), capacitive characteristics (AJ03), and safety security or explosion proofing (AJ12) are also important issues concerned by them.
The percentage numbers in the AM-AJ05 bubbles also show that Japanese assignees have more than 70% of the patents and Mitsubishi Chem. and Panasonic owned more issued patent counts. Korean firms seem to emphasize more on safety issues (AJ12) while developing electrolyte material. Table 3 shows the representative patents of them with the highest forward-citation counts in the USPTO database. It is interesting to note that Mitsubishi Chem., Panasonic, LG Chem., and Samsung SDI all used the similarly mixed lithium salts and mixed organic solvents systems. The most different part in the electrolyte is the selection of additives. Mitsubishi Chem. (US7083878B2) used overcharge preventing agents, such as cyclohexylbenzene, t-butylbenzene, and t-amylbenzene, to improve cycle characteristics after storage at high temperature. Panasonic (US6958198B2) mixes the fluorine-containing compound, e.g., fluoroalkyl(C2-C20)carboxylic acids, with the carbonate and sulfur compound to provide LIBs in excellent cycle life. Samsung SDI (US7205073B2) combines the anisole compound, ex: 3-fluoroanisole, sulfone-based compound, and poly(ester)(metha)acrylate, to improve the safety of LIBs. LG Chem. (US7745056B2) uses a chelating agent, e.g., NTA (nitrilotriacetic acid), to enhance the safety of LIBs.
Table 3.
Information of representative patents.
3.5. Multi-Dimensional Scaling (MDS)
MDS is a great visualization tool to discover technology similarity. By observing the calculated point position in the X–Y coordinate diagram, it is clear and convenient to explore the similarity/dissimilarity of specific technology among several companies. For example, if the LiPF6 or lithium hexafluorophosphate is disclosed one time in the claim, and the term is classified to lithium salts technology once. It is interesting to note that several compounds, for example, carbonate, lactone, ester, can be seen either as organic solvents or additives depending on the required amount in the electrolyte. Therefore, organic solvents and additives are organized in the same figure. Figure 5a,b illustrates the MDS results of lithium salts and organic solvents and additives. Six colors are used to represent six patent assignees. The bubble and the number next to it shows that the occurrence frequency of words related to specific technology appears in the claims of all issued patents from one company.
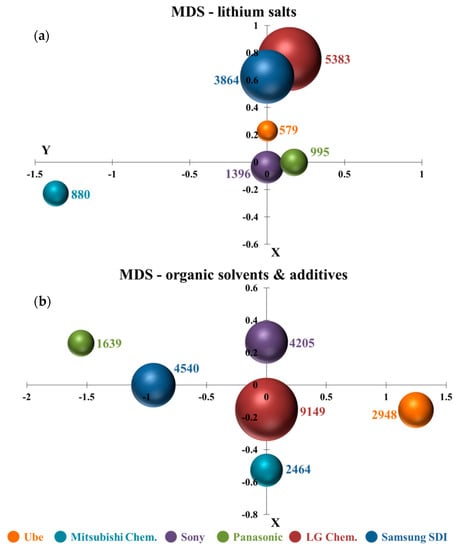
Figure 5.
Multi-dimensional scaling analysis (MDS): (a) H01M10/0568 (lithium salts) and (b) H01M10/0567 and 0569 (organic solvents and additives).
LG Chem. and Samsung SDI had much closer positions in Figure 5a. It means that there are many similarities in their lithium salts technologies. The points of Ube, Panasonic, and Sony were also close to each other. It also indicates that their inventions in lithium salts are somewhat similar. The result could be relevant to the results in the citation analysis, where inorganic salts, e.g., LiPF6, LiClO4, and lithium sulfonamide organic salts such as LiN(CF3SO2)2, were commonly used together in all the top 10 patents. Interestingly, Mitsubishi Chem. was far away from other patent assignees, showing that Mitsubishi Chem.’s lithium salts technology was more specialized. Referring to the finding in the citation-based method, novel lithium cyclic disulfonylimide compounds were to mix with other lithium salts. This lithium salt was different from other companies’ usage. Figure 5b shows that the points of six patent assignees were independent in the X–Y coordinate diagram. It means that their organic solvents and additives technologies were dissimilarities. It further indicates that they developed different organic solvents and additives materials. The result could be identified in the support information of the citation analysis, which shows that patent assignees developed different additives compounds or mixed various organic solvents in the electrolyte.
It is worth noting that the bubble sizes of LG Chem. were the largest in both Figure 5a,b. It represents that the appearing frequency of technological terms relating to electrolyte compositions in LG Chem.’s patents was significantly higher than other patent assignees. It is also interesting to discover that the LG Chem. took the center position and the other five patent assignees were around it in organic solvents and additives technologies. It could indicate that the other five companies had referred to LG Chem.’s patents and there existed a certain degree of similarity in their developed new organic solvents and additives materials.
4. Discussion
4.1. Technological Innovation
Our findings demonstrated that all patent assignees developed the electrolytic solution using the mixed lithium salts, mixed solvents, and at least one additive compound. LiPF6, LiBF4, LiClO4, etc. were widely used as inorganic salts, and LiN(CF3SO2)2, LiN(C2F5SO2)2, LiCF3SO3, etc. were organic salts. For the mixed solvents system, EC, PC, VC, and other carbonate are the most common examples. In addition to carbonates, there have been some other solvents used by leading companies in the preparation of liquid electrolyte for LIBs such as the lactone compound, e.g., γ-butyrolactone, γ-valerolactone, α-acetyl-γ-butyrolactone. It is interesting to mention that patent assignees used most of the same lithium salts and organic solvents. We believed that various compositions of electrolytes with additives, in addition to the combinations of lithium salts and solvents, were developed from these companies with emphasis on the battery cycle life, as the technology-function matrix analysis suggests where HJ-AJ05 (specific numerical limitation, size, or scope in combination with cycle life) was also the bigger bubble in the matrix.
Additive compounds were much more different and complicated in all considered patents. Vinylene carbonate, vinyl ethylene carbonate, and other carbonate compounds were the most commonly used. Besides these carbonate compounds, for example, Mitsubishi Chem. (US7416813B2 and US6942948B2) used sulfonic compounds, such as 1, 2, 3-propanetriol trimethanesulfonate or with sultone and acid anhydride, to provide a battery of high capacity that is excellent in storage, load, cycle, and charging and discharging characteristics and that reduces gas generation. Panasonic (US6958198B2) mixed carbonate with the fluorine-containing compound, e.g., fluoroalkyl (C2-C20) carboxylic acids and sulfur compound, e.g., ethylene sulfite to uniformly “wet” the electrode material, to provide LIBs with excellent cycle life, storage characteristics, and high rate discharge performance. Samsung SDI (US7223500B2) developed an additive system that includes a carbonate-based compound, sulfone-based compound, and anisole-based compound, to inhibit the generation of gas inside the battery. We thought that additives technology is vital in the electrolyte composition.
From the above findings, we believed that using various combinations of typical lithium salts with organic solvents, and developing novel additive compounds were the developing trend of the LIBs industry.
4.2. Contribution to Research
Before starting a new technology development, monitoring and analyzing the competitors’ related patents is usually recommended. To discover the development status of competitors, however, there is little previous literature to give any information about doing a patent analysis effectively. Herein, this paper provided a set of patent indicators to analyze the specific technology field, and these indicators could help people skilled in the art of exploring the development status clearly and easily. This contribution is most important for managing the technology development. Especially, new combination indicators, RGR and RDGR and RPP and RPA, are introduced to discover their R&D strategies and technology advantage. Furthermore, the technology-function matrix and citation indicator adopt different analytical principles and may offer different aspects in the exploring development trend. Finally, people can use an MDS analysis to find out the technology similarity among assignees of interest. All these results can be integrated into the patent landscape analysis and to avoid patent infringement. Based on this information, R&D resources, strategies, planning, and administration can be managed more effectively.
4.3. Contribution to the LIBs Industry
Our findings demonstrated that development trends from the patents with high forward citation were similar in the main lithium salts and organic solvents. The most noteworthy part is the development of additives. Patent assignees used various additive compounds to improve multiple characteristics of LIBs. Therefore, developing new additives to fulfill different purposes is vital. In addition, the use of electrolyte additives is seen as one of the most economic and effective methods to enhance LIBs performance [22]. Wagner et al. [10] also showed that additives had the largest counts of patent documents during 2006-2010. Our findings also demonstrated that additives, such as the carbonate compound, e.g., vinylene carbonate, vinylethylene carbonate can be used to mix with the (1) aromatic compound, e.g., substituted-benzene, (2) fluorine-containing compound, e.g., fluoroalkyl (C2-C20) carboxylic acids, (3) sulfur compound, e.g., ethylene sulfite, (4) anisole compound, e.g., 3-fluoroanisole, (5) sulfone compound, e.g., methyl sulfone, and (6) chelating agent, e.g., ethylene diamine tetraacetic acid (EDTA), to enhance/improve LIBs performance. Therefore, we believed that additives covered a broader range than lithium salts and organic solvents in terms of chemical compounds and possible functionalities. Furthermore, this might be an easier way to make batteries different from other existing electrolyte formulations from the viewpoint of applications.
In addition, the additive compound should satisfy the diverse functional requirements for better battery performance. These major functional requirements include characteristics of the charge and discharge, capacity, cycle life, and safety that are mainly considered by the top patent assignees.
5. Conclusions
Several patent indicators were used to analyze the patent activity of the top patent assignees in the LIBs’ electrolyte technology in the study. Total issued patent counts were used to identify technology leaders in the world, and they were Ube, Mitsubishi Chem., Panasonic, Sony, LG Chem., and Samsung SDI. There were two “modified” Ernst patent indicators that were introduced the first time. One was the RGR and RDGR indicator that successfully illustrated that Japanese and Korean assignees had totally different R&D strategies. For Japanese firms, Ube was good at additives, Panasonic focused more on solvents, and Sony showed more activities in lithium salts. For the Koreans companies, LG Chem. and Samsung SDI both performed well in lithium salts. Unlike the other five patent assignees, Mitsubishi Chem. outperformed innovation potentiality in developing additives and organic solvents technology. The other indicator, RPP and RPA was great in showing that Japanese and Korean companies had completely different innovation behavior in all electrolyte technologies. Samsung SDI with higher leadership did not always show a better innovation advantage. In contrast, Sony had a lower patent position but showed a better technology advantage in lithium salts and organic solvents. It is believed that these two indicators can effectively reflect the actual innovation activity of assignees in the LIBs industry.
Inorganic salts, e.g., LiPF6, LiBF4, LiClO4 and organic ones, e.g., LiN(CF3SO2)2, LiN(C2F5SO2)2, LiCF3SO3 were the most common examples to be used together. The organic solvent, such as EC, PC, VC, and other carbonate compounds were also widely mixed together in the electrolyte. In addition, developing novel additive compounds to improve the performance of LIBs was the most common strategy for the six patent assignees. Using a carbonate compound, e.g., vinylene carbonate, vinylethylene carbonate, with a substituted aromatic-derived compound, e.g., substituted-benzene, or anisole, sulfur-derived compound, e.g., sulfite, sulfonate, sultone, or fluorine-containing carboxylic acids are examples of promising additives to enhance the efficiency of LIBs. Therefore, discovering the appropriate amount of lithium salts and organic solvents with developing an additive compound to fulfill diverse purposes is highly demanded to improve features like cycle life, safety, etc. In addition to the technical advances pursued by these leading companies, the work also suggests a holistic approach based on the patent count and different indicators that could be also extended to other technological fields.
Supplementary Materials
The following are available online at https://www.mdpi.com/2076-3417/10/3/952/s1.
Author Contributions
M.-T.L. and W.-N.S. both generated the ideas, designed the work, collected and analyzed the data, and wrote the paper. W.-N.S. provided resources and tools for analysis and supervised the work. All authors have read and agreed to the published version of the manuscript.
Funding
This work is financially supported by the Ministry of Science and Technology (108-2627-M-011 -001 -).
Acknowledgments
The research facility and support from Ministry of Economic Affairs-Intellectual Property Office and National Taiwan University of Science and Technology are also acknowledged.
Conflicts of Interest
The authors declare no conflict of interest.
References
- Tasaki, K.; Goldberg, A.; Lian, J.-J.; Walker, M.; Timmons, A.; Harris, S.J. Solubility of Lithium Salts Formed on the Lithium-Ion Battery Negative Electrode Surface in Organic Solvents. J. Electrochem. Soc. 2009, 156, A1019–A1027. [Google Scholar] [CrossRef]
- Wang, X.J.; Lee, H.S.; Li, H.; Yang, X.Q.; Huang, X.J. The effects of substituting groups in cyclic carbonates for stable SEI formation on graphite anode of lithium batteries. Electrochem. Commun. 2010, 12, 386–389. [Google Scholar] [CrossRef]
- Yan, J.; Zhang, J.; Su, Y.-C.; Zhang, X.-G.; Xia, B.-J. A novel perspective on the formation of the solid electrolyte interphase on the graphite electrode for lithium-ion batteries. Electrochim. Acta 2010, 55, 1785–1794. [Google Scholar] [CrossRef]
- Wang, F.-M.; Yu, M.-H.; Hsiao, Y.-J.; Tsai, Y.; Hwang, B.-J.; Wang, Y.-Y.; Wan, C. Aging Effects to Solid Electrolyte Interface (SEI) Membrane Formation and the Performance Analysis of Lithium Ion Batteries. Int. J. Electrochem. Sci. 2011, 6, 1014–1026. [Google Scholar]
- Wang, M.-Y.; Chang, D.-S.; Kao, C.-H. Identifying Technology Trends for R&D Planning Using TRIZ and Text Mining. RD Manag. 2010, 40, 491–509. [Google Scholar]
- Qu, Z.; Zhang, S.; Zhang, C. Patent research in the field of library and information science: Less useful or difficult to explore? Scientometrics 2017, 111, 205–217. [Google Scholar] [CrossRef]
- Glanzel, W.; Meyer, M. Patent cited in the scientific literature: An exploratory study of ‘reverse’ citation relations. Scientometrics 2003, 58, 415–428. [Google Scholar] [CrossRef]
- Meyer, M. Tracing knowledge flows in innovation systems. Scientometrics 2002, 54, 193–212. [Google Scholar] [CrossRef]
- Narin, F. Patent Bibliomatrics. Scientometrics 1994, 30, 147–155. [Google Scholar] [CrossRef]
- Wagner, R.; Preschitschek, N.; Passerini, S.; Leker, J.; Winter, M. Current research trends and prospects among the various materials and designs used in lithium-based batteries. J. Appl. Electrochem. 2013, 43, 481–496. [Google Scholar] [CrossRef]
- Golembiewski, B.; Vom Stein, N.; Sick, N.; Wiemhöfer, H.-D. Identifying trends in battery technologies with regard to electric mobility: Evidence from patenting activities along and across the battery value chain. J. Clean. Prod. 2015, 87, 800–810. [Google Scholar] [CrossRef]
- Pilkington, A.; Dyerson, R.; Tissier, O. The electric vehicle: Patent data as indicators of technological development. World Pat. Inf. 2002, 24, 5–12. [Google Scholar] [CrossRef]
- Ernst, H. Patenting strategies in the German mechanical engineering industry and their relationship to company performance. Technovation 1995, 15, 225–240. [Google Scholar] [CrossRef]
- Ernst, H. Patent portfolios for strategic R&D planning. J. Eng. Technol. Manag. 1998, 15, 279–308. [Google Scholar]
- Yuan, M.S.; Liang, C.C. The Study of Development of Patent Indexes. J. Libr. Inf. Sci. 2009, 35, 88–106. [Google Scholar]
- Altuntas, S.; Dereli, T.; Kusiak, A. Forecasting technology success based on patent data. Technol. Forecast. Soc. Chang. 2015, 96, 202–214. [Google Scholar] [CrossRef]
- Yang, G.-C.; Li, G.; Li, C.-Y.; Zhao, Y.-H.; Zhang, J.; Liu, T.; Chen, D.-Z.; Huang, M.-H. Using the comprehensive patent citation network (CPC) to evaluate patent value. Scientometrics 2015, 105, 1319–1346. [Google Scholar] [CrossRef]
- HansjoKrg, K.; Joachim, M.B. Data visualization by multidimensional scaling: A deterministic annealing approach. Pattern Recognit. 2000, 33, 651–669. [Google Scholar]
- Lo, S.C. Patent coupling analysis of primary organizations in genetic engineering research. Scientometrics 2007, 74, 143–151. [Google Scholar] [CrossRef][Green Version]
- Mohammadi, E. Knowledge mapping of the Iranian nanoscience and technology: A text mining approach. Scientometrics 2012, 92, 593–608. [Google Scholar] [CrossRef]
- Schmoch, U. Evaluation of technological strategies of companies by means of MDS maps. Eval. Res. Innov. 1995, 10, 426–440. [Google Scholar]
- Zhang, S.S. A review on electrolyte additives for lithium-ion batteries. J. Power Sources 2006, 162, 1379–1394. [Google Scholar] [CrossRef]


© 2020 by the authors. Licensee MDPI, Basel, Switzerland. This article is an open access article distributed under the terms and conditions of the Creative Commons Attribution (CC BY) license (http://creativecommons.org/licenses/by/4.0/).