Abstract
The popularity of social networks provides people with many conveniences, but their rapid growth has also attracted many attackers. In recent years, the malicious behavior of social network spammers has seriously threatened the information security of ordinary users. To reduce this threat, many researchers have mined the behavior characteristics of spammers and have obtained good results by applying machine learning algorithms to identify spammers in social networks. However, most of these studies overlook class imbalance situations that exist in real world data. In this paper, we propose a heterogeneous stacking-based ensemble learning framework to ameliorate the impact of class imbalance on spam detection in social networks. The proposed framework consists of two main components, a base module and a combining module. In the base module, we adopt six different base classifiers and utilize this classifier diversity to construct new ensemble input members. In the combination module, we introduce cost sensitive learning into deep neural network training. By setting different costs for misclassification and dynamically adjusting the weights of the prediction results of the base classifiers, we can integrate the input members and aggregate the classification results. The experimental results show that our framework effectively improves the spam detection rate on imbalanced datasets.
1. Introduction
With the emergence of social networks, information patterns and service modes have also changed significantly. Social networks provide a communication platform by which users can establish, expand, and maintain various interpersonal relationships. Popular applications such as Twitter, Facebook, Weibo, etc. are all social networks. However, the rapid expansion in the number of users of social networks has also brought about a significant increase in the number of attacks [1]. Spammers distribute false advertising, pornography, phishing, and other malicious information via social networks. These malicious behaviors result in privacy disclosures, destroy normal network order, threaten social network reputation systems, and increase network loads, which cause significant harm to normal users. Currently, spammers in social networks have diverse, complex, and intelligent characteristics. A comparison with traditional spam spread by e-mail shows that social network spam is more deceptive, more difficult to identify, and poses a greater threat to ordinary users. Considering deception as an example, the click-through rate of spam pages on Twitter is 0.13%, whereas with the click-through rate of e-mail spam ranges from only 0.0003% to 0.0006% [2]. Therefore, spam detection in social network platforms is important and valuable to many aspects of network environment security, including user privacy protection, public opinion analysis, etc.
To maintain social network security by detecting spam, early researchers have used blacklists and crowdsourced information to detect and filter abnormal accounts [2,3]. However, it has been shown that more than 90% of users click a malicious link before it is blocked by blacklisting [4]. Simultaneously, these methods are time-consuming because of the need for personal participation in active information recognition. To provide better detection methods, many scholars have proposed graph analysis-based methods [5,6,7] which extract features from social graph structures using node similarity based on following and follower relationships. However, attackers can forge the connection relationship of spammers by using artificial intelligence technology to imitate the social relationships of normal users, making it difficult to detect such malicious accounts effectively [1]. The current research focuses on machine learning methods, which train machine learning models by extracting content and behavior characteristics and other related information [8,9,10]. These methods are based on data mining and analysis of large numbers of data samples. Thus, the data processing quality directly affects the detection effect.
However, most of the previous research of spam detection in social networks has focused on feature extraction, which improves classification performance by combining various features or extracting more features of social network accounts to train classifiers, but overlooks the class imbalance problem in real-world data [11]. From management science to engineering, imbalanced learning is a wide range of research fields [12,13]. As shown in Figure 1, class imbalance means that the number of samples in different categories varies greatly; the majority class (non-spam) has much more samples than the minority class (spam) when a class imbalance problem occurs in the training data, the algorithm typically provides classification results biased toward the majority class due to the increasing prior probability.
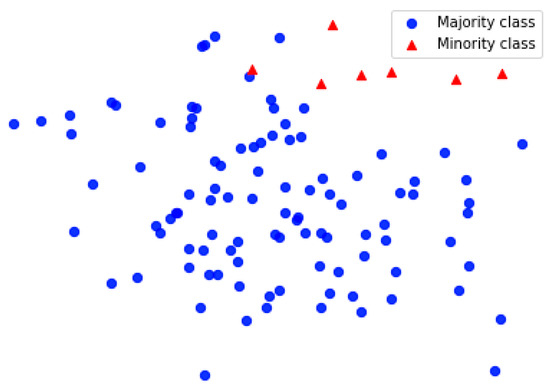
Figure 1.
Class imbalance distribution.
In binary classification problems, we often encounter serious imbalances in the proportions of positive and negative samples; such imbalances can reach 50:1. If a classifier is trained to make predictions directly on such imbalanced data, the recall rate of the minority class is extremely low. This is because the traditional classifiers aim to reduce the overall classification accuracy by treating all samples equally, which results in a higher classification accuracy for the majority class and a lower classification accuracy for the minority class. For example, in a case where the class ratio is 50:1 positive to negative samples, classifier accuracy can reach 98% even if all the negative samples are misclassified as positive samples; however, the true identification rate for the negative samples is zero. In addition, as long as the majority class can be correctly identified, even if the minority class is largely misclassified, the accuracy metric still obtains a high score, which misleads assessments. As a result, instances belonging to a minority class are more likely to be misclassified than those belonging to a majority class. This undesirable effect makes it very difficult to predict different classes accurately.
One study found that the proportion of spam on Twitter is approximately 3.75% [14], and approximately 8.7% of the accounts on Facebook are fake accounts created by attackers [1]. In another study, Grier et al. [2] found that approximately 5% of tweets are spam. On the Microblogging platform, approximately 10% of users are spammers [15]. Liu et al. [11] reported that when the class imbalance ratio (IR) in the Twitter dataset increases from two to 20, the spam detection rate drops by 33%, and the error rate for non-spam drops by 5% because traditional classifiers are biased toward the non-spam class. When faced with class imbalance problems, it is difficult to obtain satisfactory classification performances using traditional classification methods [16,17].
In this paper, we propose a two-level heterogeneous stacking-based ensemble learning framework to address the problem of class imbalance of spam detection in social networks.
First, the framework utilizes various machine learning algorithms as base classifiers to automatically extract effective features from the original data. These prediction results are combined into metadata with new features, forming the input data to the next learning stage. Then, a deep neural network (DNN) is used as a metaclassifier to capture the deep information hidden in the output of the basic classifiers. In addition, we set the misclassification costs based on cost- sensitive methods to improve the classification performance. Finally, we compare the proposed method with existing methods. The experimental results show that our method effectively improves the classification performance on data with imbalanced classes.
The remainder of this paper is organized as follows: In Section 2, we provide an overview of the related works; in Section 3, we present the process of the proposed approach in detail; in Section 4, we report an experiment using a real-world dataset to demonstrate the validity and robustness of our method; and in Section 5, we conclude the paper and suggests future work directions.
2. Related Works
This section reviews the related works from the following two aspects: Spam detection approaches and the class imbalance problem.
2.1. Spam Detection Approaches
At present, spam detection is one of the most important challenges for online social network security. Various types of spam detection methods exist, including crowdsourcing technology, graph-based techniques, and machine learning techniques. Among these, machine learning currently plays an important role in spam detection in social networks.
Supervised machine learning algorithms are the most common methods used for spam detection. Almaatouq et al. [8] trained six different classifiers using content, behavior, and network structure features and, then, compared their classification performances. Zheng et al. [18] first labeled samples as spam or non-spam and, then, proposed a classification algorithm based on support vector machines to detect spammers in Weibo. Recently, many scholars have combined deep learning methods to mine contextual features at the tweet level. Kudugunta and Ferrara [19] designed a deep neural network method that considered context based on the long-term short-term memory (LSTM) architecture, which uses context features extracted from user metadata to detect spambots at the tweet level. Due to the large numbers of social network users, the work of labeling the massive amounts of posted data is complex and error prone which is not applicable in practical applications.
In contrast to supervised machine learning, unsupervised machine learning does not rely on labeled data; instead, it uses unlabeled data to build a learning model. Lee and Kim [20] used an aggregate hierarchical clustering method to cluster Twitter users that does not need to wait for occurrences of malicious behavior; it can detect malicious accounts when the account is created. In view of the emerging group spam behavior, Cresci et al. [21] proposed a method similar to a clustering algorithm. They generated a corresponding "digital DNA" signature by encoding strings with user behavior information and used those to determine the spam similarity between account subgroup sequences. Chavoshi et al. [22] built an unsupervised tool named DeBot by comparing the account time series extracted from the Twitter flow API to find spambots that send tweets synchronously. Unsupervised machine learning methods do not need a large set of labeled data, but their accuracy is usually low as compared with supervised machine learning methods.
Semi-supervised learning is a learning method that combines supervised learning with unsupervised learning. Li et al. [23] proposed a semi-supervised feature selection method based on Laplace score to detect spammers on Twitter. Gong et al. [24] applied the semi-supervised learning to Sybil detection. This method classifies nodes together with information from directed messages and known node labels. Chen et al. [25] fused comprehensive clues explored from multiple views to identify spammers and predicted unlabeled instances iteratively based on a small number of labeled instances in a semi-supervised manner.
Previous studies have shown single classifiers are rarely superior to ensemble learning methods on any problem. Ensemble learning achieves better classification performances by training multiple classifiers and, consequently, it usually performs better than single classifiers (also known as base classifiers) [26]. Ensemble learning includes both homogeneous and heterogeneous ensemble learning algorithms. Homogeneous ensemble learning relies on multiple classifier instances of a single type, while heterogeneous ensemble learning uses a variety of different base classifiers to achieve better performance. For example, Tang et al. [17] proposed an ensemble method using three CS-SVMs with different parameters as base classifiers, combined with resampling technology, and achieved good performances for microblog spam detection. Madisetty et al. [27] developed an ensemble method involving five CNNs and a feature-based model; the metaclassifier used a multilayer neural network and achieved a good performance on Twitter. Thus, we chose heterogeneous ensemble learning as the basic framework of spam detection.
2.2. Class Imbalance Problem
Whether in academia or industry, imbalanced learning has attracted increasing attention. In the real world, this class imbalance problem exists in many application fields, such as anomaly detection, credit card fraud detection, and fault diagnosis, etc.
Many researchers have made efforts to solve the class imbalance problem and have achieved various results. These studies are classified into two main categories. One category functions on data level. These methods create balanced datasets by reducing the majority class (undersampling) or increasing the minority class (oversampling). The most famous resampling method is SMOTE [28]. By analyzing the characteristics and distribution of the minority class, SMOTE generates new samples and adds them to the dataset. Although SMOTE increases the number of minority class samples and improves the classification performance, it takes extra time to generate new samples and the procedure can generate noise [11]. The undersampling method generates a balanced dataset by reducing the sampling rate of other class samples. However, the undersampling method causes information loss, and therefore some studies use a hybrid sampling method. Liu et al. [29] proposed a novel method named fuzzy logic-based oversampling (FOS) to achieve a class imbalanced distribution through an information decomposition algorithm based on fuzzy logic [30] and, then, combined this method with random undersampling and random oversampling and utilized ensemble learning to conduct spam detection on Twitter [11].
Another way to deal with the class imbalance problem is from the algorithm perspective. Algorithm-level solutions do not cause changes in data distribution, and therefore they are suitable for multiple types of imbalanced datasets [31]. The typical algorithm-level method is cost-sensitive learning. Cost-sensitive learning optimizes an algorithm by considering the cost differences in distinct misclassification situations and assigns costs to the corresponding types, allowing the algorithm to achieve better performances on class imbalanced data [31]. Cost-sensitive learning is popular for addressing unknown varying costs in class imbalance problems at the algorithm level. MetaCost [32] is a reweighting algorithm proposed by P. Domings in which the basic idea is to use the Bayes risk theory to reweight instances in the training dataset based on the optimal cost classification. The AdaCost algorithm [33] is an improvement to the AdaBoost classification algorithm; it obtains the cost-sensitive classification by reweighting. WSNN [34] is a class imbalance method that uses cost as a weight distributed to the minority classes to improve the final classification accuracy. Wang et al. [35] embedded the cost information into a modified cross entropy loss function during prediction to solve the imbalance and skewness challenge in hospital readmission prediction. Zhang et al. [36] proposed an evolutionary cost sensitive deep belief network (ECS-DBN) for imbalanced classification, which optimizes the misclassification cost based on the training data by using adaptive differential evolution. Liu et al. [37] decomposed the F-measure optimization into a series of cost-sensitive classification problems, and investigated the cost-sensitive feature selection by generating and assigning different costs to each class.
3. Problem Description and Methodology
In this section, first, we describe the problem of class imbalance on spam detection in social networks. Then, we provide a heterogeneous stacking-based ensemble learning framework to solve the problem.
3.1. Formulation of The Problem
We first introduce the problem of classification with class imbalance in spam detection on social networks and, then, extend it to cost-sensitive learning.
Assume that given a dataset with data samples, represents the -th sample instance belonging to the input space, and indicates the label of and belongs to the label set . The goal of classification is to train a classifier to minimize the expected error of the classifier on the training set.
However, class imbalance is a common problem in many classification applications. Because a conventional classifier uses the same cost to classify all the considered classes, it is highly susceptible to skewed class distributions. In spam detection on social networks, Liu et al. [11] found that the true positive rate (spam detection rate) of the positive class decreased significantly (by 33% on average) when the class imbalance rate (IR) rose from 2 to 20. In particular, when the class imbalance rate is 20, the average detection rate dropped to 34%, which means that spam detection misses more than 66% of spam.
To solve the class imbalance problem, we use cost-sensitive learning in our ensemble learning framework. Cost-sensitive learning extends conventional classification techniques to the classification of imbalanced data by assigning different costs to each class, which punishes each class of errors differently based on the assigned costs. The training goal after applying the cost-sensitive learning is to find a classifier that minimizes the expected risk.
3.2. The Proposed Ensemble Learning Framework
In this subsection, we describe the proposed heterogeneous stacking-based ensemble learning framework for spam detection in social networks. The existing empirical results have shown that ensemble learning tends to perform better when there are significant differences among the ensemble models, and the stacked model composed of several learning stages is the most popular ensemble learning approach. Thus, to solve the class imbalance problem in spam detection, we propose a novel framework that has a two-level structure, i.e., a base module and a combining module. Our proposed framework is shown in Figure 2, which illustrates the process to stack models using the base and combining modules.
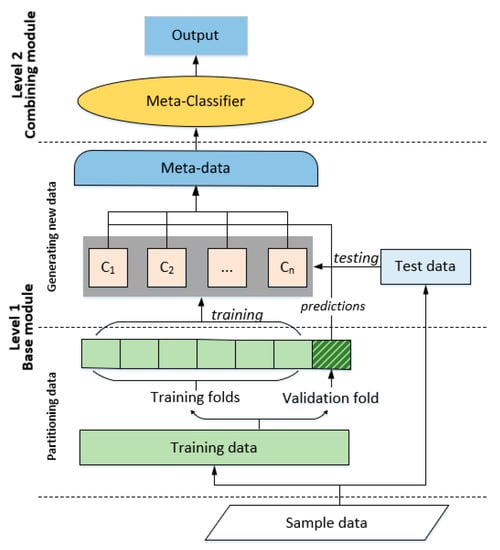
Figure 2.
Heterogeneous stacking-based ensemble learning framework.
3.2.1. Base Module
In our framework, the task of the base module is to utilize the training set to train the base classifiers, then, the metadata generated by these basic classifiers is used to train the metaclassifier.
In heterogeneous stacking-based ensemble learning, selection of the base classifier is crucial to model performance because each classifier has its own advantages. It is generally believed that measuring the diversity of the underlying individual classifiers is a key factor in good integration. To obtain discriminatory metadata for classification, the base classifiers should be as diverse and as complementary as possible. The goal of this paper is to solve the spam problem detection for social networks, which is regarded as a binary classification problem. Therefore, we employ the following six different base classifiers to form the base module of our framework: The support vector machine (SVM) [38], CART [39], Gaussian Naive Bayes (GNB) [40], K-nearest neighbors (KNN) [41], random forest (RF) [42], and linear regression (LR) [43]. All these algorithms are good for solving various binary classification problems from their own point of view.
This stacked ensemble learning approach uses the prediction results of the base classifiers as the input of the combining module. However, we cannot directly use the complete dataset to train and test the base classifiers and send the prediction results to the combining module for training. Because the potential model would have "seen" the test set, a risk of overfitting exists when the same data is input for prediction, which tends to have a large impact on model validation.
The metadata generation methods of the stacking model include bootstrap, bagging, and cross-validation. As shown in Figure 2, in this study, we selected the -fold cross-validation method.
First, we partition the original dataset into a training set and a test set . During the -fold cross-validation procedure, is split into disjoint subsets of the same size; each subset is called a fold and maintains the same class scale as the original dataset. Each cross-validation consists of executing the training phase on and the testing phase on . We take one classifier as an example, where represents the number of base classifiers. At the training stage, we use one subset as a validation set and use the remaining subsets as training sets. We repeat this procedure times, and all the prediction results on the validation sets are merged into a prediction matrix . At the test stage, we apply to generate a classification matrix. After repeating this procedure times, we obtain classification matrices and average them by rows to generate a matrix . The above entire procedure is repeated for the classifiers, and all the prediction matrices are combined into a new training set , and all the are averaged to obtain a new test set . Through this method, the generated metadata can be guaranteed to be test results rather than results obtained by overfitting the training samples. In our method, the number of fold () is chosen as 10, which is considering the size of the real dataset and combined with other research experience.
In the base module of this framework, we first train the different base classifiers to generate metadata with new features. Then, we input the resulting metadata to the combination module to train the metaclassifier.
3.2.2. Combining Module
Under the concept of stack generalization, the output of the ensemble serves as the inputs to the metaclassifier, which learns a mapping between the metadata and the real class labels [44]. Metaclassifier selection is also important in ensemble learning, and appropriate data-combining strategies can improve the final classification capabilities. In this paper, we apply a cost-sensitive learning-improved deep neural network (DNN) as a metaclassifier for class imbalance tasks.
DNN models have strong learning ability and can extract higher-level features via their deep network structures. Therefore, using a DNN in the ensemble strategy has unique advantages for finding hidden information in metadata. Although DNNs have been successfully applied in many fields because of their powerful data mining ability, few studies have used a DNN to solve typical class imbalance problems in the social networking spam detection field.
As shown in Figure 3, the DNN model consists of an input layer, hidden layer(s), and an output layer. The input layer accepts information from the external world into the network. The hidden layer(s) extract multilevel input features to partition the different types of data linearly. Each hidden layer has a set of parameters , where is a fully connected weight matrix, and is a bias vector. The output layer is responsible for computing and transmitting information from the network to the outside world.
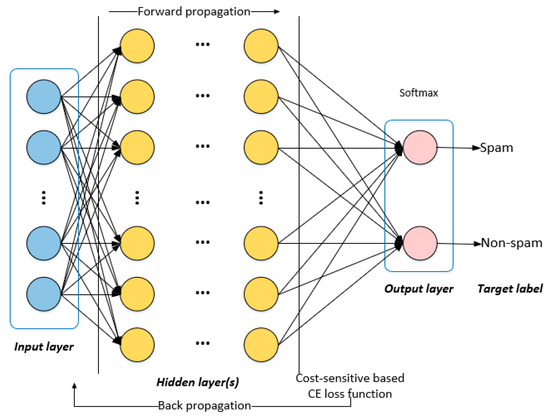
Figure 3.
Schematic of the deep neuron networks.
The DNN process includes two phases, forward propagation and backpropagation (BP). Forward propagation transmits the input signal to the output layer and produces classification error. BP iteratively adjusts the weight and offsets of the hidden layer(s) to the output layer and the weight and offset of the input layer to the hidden layer(s).
Given a fully connected DNN with hidden layers, as shown in Figure 3, during forward propagation, for an input feature vector , the hidden layers of the DNN describe a complex feature transform function by computing:
where and , respectively, represent the weight matrix and bias vector in each hidden layer denoted as , is the input feature vector from the previous layer, and denotes an activation function, which can be tanh or sigmoid.
Because the problem of spam identification is a binary classification problem, the output layer has two neurons, and the SoftMax algorithm is used between the hidden layer and the output layer after feature conversion. In the output layer, the -th neuron is responsible for estimating the probability that a given sample x belongs to class j:
where and bias represent the weights and bias of the -th neuron in the output layer, respectively.
Under class imbalance, the goal of the standard machine learning method is to minimize the number of false predictions, but because the loss function uses the same misclassification cost for all the considered classes, it is highly susceptible to skewed class distributions [45]. This occurs because under class imbalance, the loss function is easily minimized by focusing on the majority class and largely ignoring (or in extreme cases even completely ignoring) the minority class. To solve the class imbalance problem of spam detection on social networks, we formalize it as a cost-sensitive classification problem. It assumes that an asymmetric misclassification cost exists between classes, defined in the form of a cost matrix, as shown in Table 1.

Table 1.
Cost matrix for binary classification.
The typical form of cost sensitive learning is to use a cost matrix such as the one shown in Table 1. A cost is used to denote the cost of misclassifying an instance belonging to class p into a different class q. In spam detection, we regard spam as positive samples and non-spam as negative samples. Therefore, the misclassification cost belonging to the minority class is higher than that belonging to the majority class . Using feedback from the base classifier performances, we use the misclassification ratio of the minority class in the base modules as the misclassification cost of the positive samples and set the misclassification cost of the majority class to one. The diagonal elements of the cost matrix, such as and , represent correct predictions, and the misclassification cost is equal to zero [32].
According to the minimum expected cost principle, the goal of cost sensitive classification is to train the classifier so that it classifies training samples into the class that has the minimum expected cost. Therefore, the classifier we are training provides a class decision for a sample. The expected risk with a sample and as the output classification can be expressed as follows:
where represents the posterior probability that a given sample x will be classified as class q in a dataset of K classes.
On the basis of the Bayesian decision theory, an ideal classifier makes a final decision by calculating the expected risk of each sample classification and predicts the label that achieves the minimum expected risk:
For a sample and its corresponding label , the empirical risk can be expressed as:
where represents a loss function, such as mean square error (MSE) or the cross-entropy loss function, and N is the total number of data samples.
As described in Section 3, the goal of cost-sensitive learning is to minimize the overall cost of the training dataset (e.g., the Bayesian conditional risk). The misclassification cost can be regarded as a penalty factor introduced during the classifier training process (or in some cases in the forecasting step) to improve the importance of classes that are difficult to classify (such as the spam class). By imposing larger penalties for errors on a given class, we force the classifier training process (intended to minimize overall cost) to focus on instances from the given distribution.
In this study, we use cost-sensitive modified cross entropy as the loss function during classifier training. This paper mainly focuses on spam detection, and therefore we pay more attention to the spam class than to the non-spam class. Thus, should be larger than , forcing the error classification cost for spam samples to be higher. The overall error of the cost-sensitive DNN can be formulized as follows:
The backpropagation algorithm is the most common method for optimizing the DNN parameters and is essentially a gradient descent function. We optimize the loss minimization and parameters through backpropagation using the minibatch stochastic gradient descent method. Jiang et al. [46] reported that introducing costs into cross-entropy (CE) losses affects the output but does not change the gradient formulas.
4. Experiments
This paper focuses mainly on the performance of heterogeneous stacking-based ensemble learning methods in imbalanced data problems of spam detection on social networks. For comparison purposes, we perform extensive experiments on a real dataset and conduct performance comparisons between other algorithms used in social network spam detection and our proposed algorithm. Therefore, in this section, we first describe the dataset in detail. Section 4.2 describes the metrics used to assess the results, and we report the experimental design in Section 4.3. Section 4.4 provides a discussion of the experimental results.
4.1. Experimental Dataset
These experiments were conducted using the dataset collected by Chen et al. [47], which contains 600 million tweets of which 6.5 million are malicious tweets. This dataset was made available to other researchers studying spam detection. In the dataset, tweets containing malicious URLs were defined as twitter spam.
Each tweet in the dataset is represented as a feature vector that contains user-based features and tweet-based features. The 12 lightweight statistical features that can be extracted directly from tweets are shown in Table 2. Among them, the first six features are user-based features, and the remainder are tweet-based features.
Table 2.
Twitter spam dataset.
4.2. Evaluation Metrics
The most common metrics used to measure classification performances are accuracy, precision, recall, and the F1-score. In class imbalance problems, because the accuracy rate does not reflect the overall situation, we employ the true positive rate (TPR), false positive rate (FPR), precision, F1-score, and G-mean to measure the performance of the proposed spam detection method. We apply a confusion matrix to calculate these indicators.
As shown in Table 3, each row represents a class while each column represents the predicted class. TP, FP, FN and TN represent true positives, false positives, false negatives, and true negatives, respectively. The performance measures can be calculated as follows:
Table 3.
Confusion matrix.
- True positive rate (TPR)
The true positive rate is known as recall rate, which indicates the ratio of the correct classification of positive samples.
- False positive rate (FPR)
The false positive rate indicates the ratio that classifies the negative samples into positive samples. In this paper, FPR represents the proportion of classifying a majority class into a minority class.
- Precision
Precision represents the ratio of correctly predicted positive samples to total predicted positive samples.
- F1-score
The F1-score is a weighted average of precision and recall. It is an important performance metric to evaluate the overall performance of our method.
- G-mean
G-mean measure is to evaluate the degree of inductive bias according to the ratio of positive precision to negative precision. The higher G-mean represents that the classifier has better classification performance in both majority and minority classes.
- Kappa
Kappa is an important index to measure the classification performance on imbalanced datasets, which represents the proportion of error reduction between classification and completely random classification. It measures the consistency between classifier and target distribution hypothesis.
where
4.3. Experimental Protocol
To facilitate the experiment, we first normalize all the datasets and, then, randomly select a corresponding proportion of spam and non-spam samples from the dataset according to different class imbalance ratios as experimental datasets. Finally, for each selected experimental dataset, we randomly select 50% of the samples of each class as training data and use the rest for testing.
As described in Section 3.2, to ensure the diversity of ensemble learning, six different base classifiers constitute the base module. To improve the performance and achieve better classification results, all the optimal parameters for all the base classifiers are determined via a grid search based on 10-fold cross-validation.
In the combining module, we determine the final structure of the network through experiments. The number of DNN layers is selected from {2,3,4,5}, and the number of nodes in hidden layers is selected from {16,32,64,128}. Following the experimental protocol, the classification performance reaches top when we use three hidden layers in the DNN, with 64 hidden units in the first hidden layer, 32 hidden units in the second layer, and 16 hidden units in the last layer. We adopt a sigmoid function as the activation function for the hidden layer. We also use dropout to avoid overfitting.
4.4. Results and Discussion
In spam detection in social networks, although the number of spam items is small, their threats and impacts can be substantial. Therefore, under class imbalance, it is more important to classify the minority class accurately than the majority class. The main purposes of this experiment are to compare the proposed method with existing spam classification methods on imbalanced datasets to determine which detects spammers most accurately and to verify the effectiveness and robustness of the proposed method when dealing with similar imbalance problems.
Each experiment is repeated 10 times and, then, the average values are calculated and used in the comparisons to verify the robustness of the proposed method.
4.4.1. Comparisons with Base Classifiers
In this section, we compare the proposed method with four conventional machine learning algorithms. For simplicity, all the conventional algorithms use their default parameters. We adopt a class imbalance ratio of 10 as an example. The classification results are given in Table 4 in terms of TPR, FPR, precision, F1-score, G-mean, and Kappa on the test data.
Table 4.
Classification results of different machine learning methods.
From Table 4, we can see that the class imbalance problem strongly affects the performances of the conventional machine learning algorithms. For example, the TPR value of the SVM algorithm is only 0.10, which indicates that a large number of spam samples (the minority class) are misclassified as non-spam (the majority class). This also causes the G-mean value of SVM to be only 0.31 and the Kappa value of SVM to be 0.16. Although the GNB method achieves a performance of 0.91, its false positive rate reaches 0.81. Therefore, its precision, F1-score and Kappa values, are the lowest. These results show that a large number of non-spam samples are misclassified as spam samples.
Figure 4 presents the classification performance of each method in terms of TPR, FPR, precision, F1-score, G-mean, and Kappa. The histogram chart illustrates that only the CART method and our method have stable metrics; the other methods have large fluctuations. For example, the precision of SVM is 0.77, but its TPR is 0.10, F1-score is 0.18, and its Kappa is 0.16, which means that the method is highly influenced by the majority class, and the classification results tend toward non-spam. The TPR, precision, F1-score, and Kappa of CART method show stable performance within the range 0.50–0.57, but these values are lower than those of our approach.
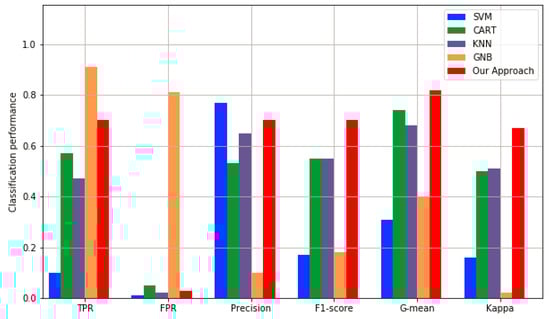
Figure 4.
Spam detection performance compared with different machine learning algorithms.
4.4.2. Comparisons with Class Imbalance Methods
On the basis of the comparisons in the previous section of our proposed algorithm with conventional machine learning algorithms, we further compare our algorithm with more advanced algorithms regarding their abilities to solve the class imbalance problem. Section 2.2 mentions that ensemble learning can effectively improve the performance when faced with class imbalance problems. Therefore, we add ensemble learning algorithms that use majority voting as an ensemble strategy to the comparison. CSDNN is an algorithm based on cost sensitivity learning as discussed in Section 3.2, while AdaCost, MetaCost, and WSNN are all improved algorithms based on cost sensitive learning. Table 5 presents a comparison of the above algorithms in terms of TPR, FPR, precision, F1-score, and Kappa.
Table 5.
Classification results of different class imbalance methods.
As shown in Table 5, the performances of these improved methods are significantly better than those of the conventional machine learning algorithms. For example, the TPR value in Table 5 fluctuates less than that in Table 4 and the mean value is higher. The same phenomenon occurs for G-mean, with an average of 0.78 in this experiment, but an average of 0.59 in the previous experiment. These results show that the methods in this experiment provide improvements when faced with class imbalance problems.
Figure 5 intuitively illustrates an experimental comparison between our proposed method and the improved methods. Considering the MetaCost method as an example, the TPR of this method is 0.69, which is very close to the 0.70 achieved by our method, but its accuracy, F1-score, and Kappa are 0.3, 0.19, and 0.22 lower than those of our method. This phenomenon indicates that although the method obtains a better positive sample recognition rate, it also misclassifies a large number of negative samples. In the same way, the ensemble learning method achieved good results in this group of experiments, but its accuracy and F1-score are 7% and 4% lower than that of our method, and its Kappa is 5% lower. Therefore, our method yields good performances as compared with those of other improved methods.
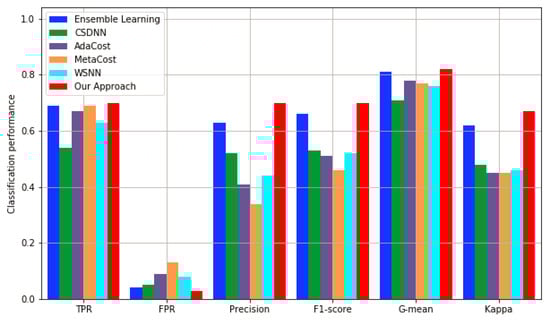
Figure 5.
The performance of our proposed method is compared with class imbalance methods.
In addition, it is worth noting that CSDNN, AdaCost, MetaCost, and our method are all improved by cost-sensitive learning, but our method adopts the integrated learning framework based on stacking, and the data processing of the basic module effectively improves the classification performance of the overall algorithm.
4.4.3. Comparisons with Varying Class Imbalance Rates
To verify the robustness of our method, we conducted experiments under five different class imbalance rates. According to the results of the previous two experiments, CART and ensemble learning are the next-best methods to our approach. Therefore, this section compares the performance of the proposed method with these two methods under different class imbalance rates. In this work, we define the class imbalance rate as follows:
where and are the number of samples belonging to the majority and minority classes, respectively. Figure 6 compares the average F1-score results of three different methods at different class imbalance rates (i.e., IR equals 2, 6, 10, 14, and 18).
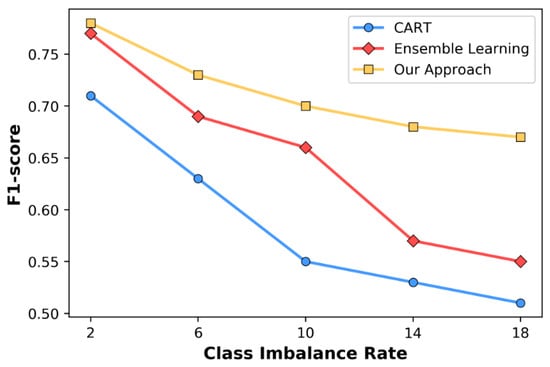
Figure 6.
F1-score results in comparison with different class imbalance rates.
As shown in Figure 6, as the class imbalance rate increases, the F1-score of these three methods gradually decreases. For the ensemble learning method, when IR = 2, its F1 result is 77%, but its F1 value drops to approximately 55% as the IR increases to 18, causing an overall decline of 22%. The second method, CART, fell by 20%, i.e., from 71% to 51%. Our method also shows a downward trend as the imbalance rate increases from 78% when IR = 2 to 67% with IR = 18, but compared with the other methods, this downward trend is relatively gentle. For example, our method achieves the best F1 value (78% when IR = 2). As IR increases to 10, our result is 70%, the result of ensemble learning is 66%, and CART falls to 55%. When the class imbalance rate increases to 18, the F1-score of our method is 67%, which is only 3% lower than when IR = 10, but CART and ensemble learning methods are 4% and 11% lower, respectively. Finally, the comparison shows that our method maintains relatively stable overall performances with different class imbalance rates, and therefore it shows better robustness.
5. Conclusions
In this paper, we proposed a spam detection framework for social networks. Considering the class imbalance problem in spam detection, the heterogeneous stacking-based ensemble framework was designed to balance the training process of base classifiers and metaclassifier at the data and algorithm levels, respectively. First, we used six different learning methods as base classifiers to improve the learning effect of the base module. Then, we applied a cost-sensitive learning improved deep neural network to implement the ensemble strategy. The strategy of training the meta-classifier with the individual errors of classifiers from the previous stage to detect any biased behavior reduced the impact of imbalanced class distributions on classification performances.
We verified the validity of our method on the real spam dataset of Twitter. The experimental results show that the proposed method can handle class imbalance well and obtains the best classification performance among compared approaches.
In the future, we plan to mine deeper hidden feature representations, as well as test classifiers trained with different dataset features to further improve the spam detection performance on social networks.
Author Contributions
Conceptualization, C.Z.; methodology, C.Z.; software, X.L. and Y.C.; writing—original draft, C.Z.; writing—review and editing, Y.X. and Y.Y. All authors have read and agreed to the published version of the manuscript.
Funding
This research was funded by the “National Key R&D Program of China under grant 2017YFB0802300”, the “Major Scientific and Technological Special Project of Guizhou Province (20183001)”, and the “Foundation of Guizhou Provincial Key Laboratory of Public Big Data (2018BDKFJJ008, 2018BDKFJJ020, 2018BDKFJJ021)”.
Conflicts of Interest
The authors declare no conflict of interest.
References
- Adewole, K.S.; Anuar, N.B.; Kamsin, A.; Varathan, K.D.; Razak, S.A. Malicious accounts: Dark of the social networks. J. Netw. Comput. Appl. 2017, 79, 41–67. [Google Scholar] [CrossRef]
- Grier, C.; Thomas, K.; Paxson, V.; Zhang, M. @spam: the underground on 140 characters or less. In Proceedings of the 17th ACM conference on Computer and communications security - CCS ’10; ACM Press: Chicago, IL, USA, 2010; p. 27. [Google Scholar]
- Wang, G.; Mohanlal, M.; Wilson, C.; Wang, X.; Metzger, M.; Zheng, H.; Zhao, B.Y. Social turing tests: Crowdsourcing sybil detection. In Proceedings of the 20th Network & Distributed System Security Symposium (NDSS); The Internet Society: San Diego, CA, USA, 2013. [Google Scholar]
- Thomas, K.; Grier, C.; Ma, J.; Paxson, V.; Song, D. Design and Evaluation of a Real-Time URL Spam Filtering Service. In Proceedings of the 2011 IEEE Symposium on Security and Privacy; IEEE: Oakland, CA, USA, 2011; pp. 447–462. [Google Scholar]
- Ghosh, S.; Viswanath, B.; Kooti, F.; Sharma, N.K.; Korlam, G.; Benevenuto, F.; Ganguly, N.; Gummadi, K.P. Understanding and combating link farming in the twitter social network. In Proceedings of the 21st international conference on World Wide Web - WWW ’12; ACM Press: Lyon, France, 2012; p. 61. [Google Scholar]
- Yang, Z.; Xue, J.; Yang, X.; Wang, X.; Dai, Y. VoteTrust: Leveraging Friend Invitation Graph to Defend against Social Network Sybils. IEEE Trans. Dependable Secure Comput. 2016, 13, 488–501. [Google Scholar] [CrossRef]
- Ahmed, F.; Abulaish, M. An MCL-Based Approach for Spam Profile Detection in Online Social Networks. In Proceedings of the 2012 IEEE 11th International Conference on Trust, Security and Privacy in Computing and Communications; IEEE: Liverpool, UK, 2012; pp. 602–608. [Google Scholar]
- Almaatouq, A.; Shmueli, E.; Nouh, M.; Alabdulkareem, A.; Singh, V.K.; Alsaleh, M.; Alarifi, A.; Alfaris, A.; Pentland, A. ‘Sandy’ If it looks like a spammer and behaves like a spammer, it must be a spammer: analysis and detection of microblogging spam accounts. Int. J. Inf. Secur. 2016, 15, 475–491. [Google Scholar] [CrossRef]
- İş, H.; Tuncer, T. Interaction-Based Behavioral Analysis of Twitter Social Network Accounts. Appl. Sci. 2019, 9, 4448. [Google Scholar] [CrossRef]
- Hussain, N.; Turab Mirza, H.; Rasool, G.; Hussain, I.; Kaleem, M. Spam Review Detection Techniques: A Systematic Literature Review. Appl. Sci. 2019, 9, 987. [Google Scholar] [CrossRef]
- Liu, S.; Wang, Y.; Zhang, J.; Chen, C.; Xiang, Y. Addressing the class imbalance problem in Twitter spam detection using ensemble learning. Comput. Secur. 2017, 69, 35–49. [Google Scholar] [CrossRef]
- Haixiang, G.; Yijing, L.; Shang, J.; Mingyun, G.; Yuanyue, H.; Bing, G. Learning from class-imbalanced data: Review of methods and applications. Expert Syst. Appl. 2017, 73, 220–239. [Google Scholar] [CrossRef]
- Zhou, P.; Hu, X.; Li, P.; Wu, X. Online feature selection for high-dimensional class-imbalanced data. Knowl.-Based Syst. 2017, 136, 187–199. [Google Scholar] [CrossRef]
- Twitter Study. Available online: http://pearanalytics.com/wp-content/uploads/2012/12/Twitter-Study-August-2009.pdf (accessed on 27 October 2019).
- Jin, Z.; Li, Q.; Zeng, D.; Wang, L. Filtering spam in Weibo using ensemble imbalanced classification and knowledge expansion. In Proceedings of the 2015 IEEE International Conference on Intelligence and Security Informatics (ISI); IEEE: Baltimore, MD, USA, 2015; pp. 132–134. [Google Scholar]
- Yu, L.; Zhou, R.; Tang, L.; Chen, R. A DBN-based resampling SVM ensemble learning paradigm for credit classification with imbalanced data. Appl. Soft Comput. 2018, 69, 192–202. [Google Scholar] [CrossRef]
- Tang, W.; Ding, Z.; Zhou, M. A Spammer Identification Method for Class Imbalanced Weibo Datasets. IEEE Access 2019, 7, 29193–29201. [Google Scholar] [CrossRef]
- Zheng, X.; Zeng, Z.; Chen, Z.; Yu, Y.; Rong, C. Detecting spammers on social networks. Neurocomputing 2015, 159, 27–34. [Google Scholar] [CrossRef]
- Kudugunta, S.; Ferrara, E. Deep neural networks for bot detection. Inf. Sci. 2018, 467, 312–322. [Google Scholar] [CrossRef]
- Lee, S.; Kim, J. WarningBird: A Near Real-Time Detection System for Suspicious URLs in Twitter Stream. IEEE Trans. Dependable Secure Comput. 2013, 10, 183–195. [Google Scholar] [CrossRef]
- Cresci, S.; Di Pietro, R.; Petrocchi, M.; Spognardi, A.; Tesconi, M. DNA-Inspired Online Behavioral Modeling and Its Application to Spambot Detection. IEEE Intell. Syst. 2016, 31, 58–64. [Google Scholar] [CrossRef]
- Chavoshi, N.; Hamooni, H.; Mueen, A. DeBot: Twitter Bot Detection via Warped Correlation. In Proceedings of the 2016 IEEE 16th International Conference on Data Mining (ICDM); IEEE: Barcelona, Spain, 2016; pp. 817–822. [Google Scholar]
- Li, W.; Gao, M.; Rong, W.; Wen, J.; Xiong, Q.; Ling, B. LSSL-SSD: Social Spammer Detection with Laplacian Score and Semi-supervised Learning. In Knowledge Science, Engineering and Management; Lehner, F., Fteimi, N., Eds.; Springer International Publishing: Cham, Germany, 2016; Volume 9983, pp. 439–450. [Google Scholar]
- Gong, N.Z.; Frank, M.; Mittal, P. SybilBelief: A Semi-Supervised Learning Approach for Structure-Based Sybil Detection. IEEE Trans. Inf. Forensics Secur. 2014, 9, 976–987. [Google Scholar] [CrossRef]
- Chen, H.; Liu, J.; Lv, Y.; Li, M.H.; Liu, M.; Zheng, Q. Semi-Supervised Clue Fusion for Spammer Detection in Sina Weibo. Inf. Fusion 2018, 44, 22–32. [Google Scholar] [CrossRef]
- Dietterich, T.G. Ensemble Methods in Machine Learning. In Multiple Classifier Systems; Springer: Berlin, Heidelberg, 2000; Volume 1857, pp. 1–15. [Google Scholar]
- Madisetty, S.; Desarkar, M.S. A Neural Network-Based Ensemble Approach for Spam Detection in Twitter. IEEE Trans. Comput. Soc. Syst. 2018, 5, 973–984. [Google Scholar] [CrossRef]
- Chawla, N.V.; Bowyer, K.W.; Hall, L.O.; Kegelmeyer, W.P. SMOTE: Synthetic Minority Over-sampling Technique. J. Artif. Intell. Res. 2002, 16, 321–357. [Google Scholar] [CrossRef]
- Liu, S.; Zhang, J.; Xiang, Y.; Zhou, W. Fuzzy-Based Information Decomposition for Incomplete and Imbalanced Data Learning. IEEE Trans. Fuzzy Syst. 2017, 25, 1476–1490. [Google Scholar] [CrossRef]
- Liu, S.; Zhang, J.; Wang, Y.; Xiang, Y. Fuzzy-based feature and instance recovery. In Proceedings of the Asian Conference on Intelligent Information and Database Systems. ACIIDS 2016; Springer: Berlin, Heidelberg, 2016; pp. 605–615. [Google Scholar]
- He, H.; Garcia, E.A. Learning from Imbalanced Data. IEEE Trans. Knowl. Data Eng. 2009, 21, 1263–1284. [Google Scholar]
- Domingos, P. MetaCost: A general method for making classifiers cost-sensitive. In Proceedings of the fifth ACM SIGKDD International Conference on Knowledge Discovery and Data Mining- KDD ’99; ACM Press: San Diego, CA, US, 1999; pp. 155–164. [Google Scholar]
- Fan, W.; Stolfo, S.J.; Zhang, J.; Chan, P.K. AdaCost: Misclassification Cost-sensitive Boosting. Icml 1999, 99, 97–105. [Google Scholar]
- Sze-To, A.; Wong, A.K.C. A Weight-Selection Strategy on Training Deep Neural Networks for Imbalanced Classification. In Image Analysis and Recognition; Karray, F., Campilho, A., Cheriet, F., Eds.; Springer International Publishing: Cham, Australia, 2017. [Google Scholar]
- Wang, H.; Cui, Z.; Chen, Y.; Avidan, M.; Abdallah, A.B.; Kronzer, A. Predicting Hospital Readmission via Cost-Sensitive Deep Learning. IEEE/ACM Trans. Comput. Biol. Bioinform. 2018, 15, 1968–1978. [Google Scholar] [CrossRef] [PubMed]
- Zhang, C.; Tan, K.C.; Li, H.; Hong, G.S. A Cost-Sensitive Deep Belief Network for Imbalanced Classification. IEEE Trans. Neural Netw. Learn. Syst. 2019, 30, 109–122. [Google Scholar] [CrossRef] [PubMed]
- Liu, M.; Xu, C.; Luo, Y.; Xu, C.; Wen, Y.; Tao, D. Cost-Sensitive Feature Selection by Optimizing F-Measures. IEEE Trans. Image Process. 2018, 27, 1323–1335. [Google Scholar] [CrossRef]
- Chang, C.-C.; Lin, C.-J. LIBSVM: A library for support vector machines. ACM Trans. Intell. Syst. Technol. TIST 2011, 2, 27. [Google Scholar] [CrossRef]
- Shalev-Shwartz, S.; Ben-David, S. Understanding Machine Learning: From Theory to Algorithms; Cambridge University Press: Cambridge, UK, 2014; pp. 250–257. [Google Scholar]
- John, G.H.; Langley, P. Estimating continuous distributions in Bayesian classifiers. In Proceedings of the Eleventh Conference on Uncertainty in Artificial Intelligence; Morgan Kaufmann Publishers: San Mateo, CA, USA, 1995; pp. 338–345. [Google Scholar]
- Aha, D.W.; Kibler, D.; Albert, M.K. Instance-based learning algorithms. Mach. Learn. 1991, 6, 37–66. [Google Scholar] [CrossRef]
- Breiman, L. Random Forests. Mach. Learn. 2001, 45, 5–32. [Google Scholar] [CrossRef]
- Wright, R.E. Logistic regression. In Reading and Understanding Multivariate Statistics; American Psychological Association: Washington, DC, USA, 1995; pp. 217–244. [Google Scholar]
- Wolpert, D.H. Stacked generalization. Neural Netw. 1992, 5, 241–259. [Google Scholar] [CrossRef]
- Aburomman, A.A.; Ibne Reaz, M.B. A novel SVM-kNN-PSO ensemble method for intrusion detection system. Appl. Soft Comput. 2016, 38, 360–372. [Google Scholar] [CrossRef]
- Jiang, X.; Pan, S.; Long, G.; Chang, J.; Jiang, J.; Zhang, C. Cost-sensitive Hybrid Neural Networks for Heterogeneous and Imbalanced Data. In Proceedings of the 2018 International Joint Conference on Neural Networks (IJCNN); IEEE: Rio de Janeiro, Brazil, 2018; pp. 1–8. [Google Scholar]
- Chen, C.; Zhang, J.; Chen, X.; Xiang, Y.; Zhou, W. 6 million spam tweets: A large ground truth for timely Twitter spam detection. In Proceedings of the 2015 IEEE International Conference on Communications (ICC); IEEE: London, UK, 2015; pp. 7065–7070. [Google Scholar]
© 2020 by the authors. Licensee MDPI, Basel, Switzerland. This article is an open access article distributed under the terms and conditions of the Creative Commons Attribution (CC BY) license (http://creativecommons.org/licenses/by/4.0/).