Next Article in Journal
The Transformation by Catalysis of Prebiotic Chemical Systems to Useful Biochemicals: A Perspective Based on IR Spectroscopy of the Primary Chemicals: I. The Synthesis of Peptides by the Condensation of Amino Acids
Next Article in Special Issue
Darcy–Boussinesq Model of Cilia-Assisted Transport of a Non-Newtonian Magneto-Biofluid with Chemical Reactions
Previous Article in Journal
Symbiotic Organism Search Algorithm with Multi-Group Quantum-Behavior Communication Scheme Applied in Wireless Sensor Networks
Previous Article in Special Issue
On the Cattaneo–Christov Heat Flux Model and OHAM Analysis for Three Different Types of Nanofluids
 
 
Erratum published on 22 January 2021, see Appl. Sci. 2021, 11(3), 978.
Article

A Study on Flow Characteristics and Flow Uniformity for the Efficient Design of a Flow Frame in a Redox Flow Battery

1
Department of Mechanical Engineering, Ajou University, Suwon 16499, Korea
2
Lotte Chemical Research Institute, Daejeon 34110, Korea
*
Author to whom correspondence should be addressed.
Appl. Sci. 2020, 10(3), 929; https://doi.org/10.3390/app10030929
Submission received: 25 November 2019 / Revised: 2 January 2020 / Accepted: 25 January 2020 / Published: 31 January 2020
(This article belongs to the Special Issue Computational Fluid Mechanics and Heat Transfer)

Abstract

:
As global environmental problems are worsening, the efficiency of storage systems for renewable energy are gaining importance. The redox flow battery (RFB), a promising energy storage system (ESS), is a device that generates or stores electricity through reduction–oxidation reactions between active materials constituting electrolytes. Herein, we proposed a flow frame design that reduces flow resistance in the flow path and causes uniform flow distribution in the electrode to develop an efficient redox flow battery. Through computational fluid dynamics (CFD) and experimental verification, we investigated the flow characteristics and flow uniformity inside the conventional redox flow battery cell. An analysis of the flow characteristics of the conventional flow frame revealed a non-uniform distribution of the flow discharged to the electrodes, owing to the complex (branched) flow path geometry of the inlet channel. To address this problem, we proposed a new flow frame design that removed and integrated bifurcations in the flow path. This new design significantly improved flow uniformity parameters, such as the symmetry coefficient ( C s y m ), variability range coefficient ( R i ), and maximum flow rate deviation ( D m ). Ultimately, we decreased the pressure drop by 15.3% by reducing the number of flow path bifurcations and chevron repositioning.

Graphical Abstract

1. Introduction

With the increasing severity of environmental problems worldwide, renewable energy resources are becoming more critical. However, based on the natural environment, renewable energy exhibits severe output fluctuations [1], which hinders normal energy supply. To address this problem, studies on energy storage systems (ESSs) have been conducted worldwide. ESSs are classified into physical and electrochemical energy storage devices based on their application. As one of the electrochemical energy storage devices, redox flow batteries (RFBs) generate or store electricity through redox reactions between the active materials constituting the electrolytes. They are classified into various types according to the electrolytes, and their output characteristics are determined by the redox reactions of each electrolyte. Moreover, RFBs can be designed for specific applications, because the size of the stack that determines their output and the size of the electrolyte tanks that determine their capacity are independent of each other; they are suitable for medium- and large-energy storage devices [2].
Large capacity batteries for the MegaWatt class currently engaged for ESS include the lead–acid battery, NaS battery, lithium battery, and RFBs. Among them, the RFB is more recyclable and environmentally friendly than the equivalent lead–acid battery. In addition, The RFB has the advantage of a large capacity, safety, and reliability over the lithium battery. The redox couple used in the RFB includes various chemical species such as vanadium, bromine–polysulfide, and zinc–bromine. The Zn/Br is highly efficient, as it has a higher standard electrode potential of about 1.8 V compared with that of the vanadium (1.4 V) and the bromine–polysulfide (1.5 V) [3,4].
One of the key technologies of the flow frame manufacturing process, the flow path design, significantly affects the overall system efficiency of RFBs [5]. When developing the flow frame for RFBs, two aspects improve the output and efficiency of the batteries, namely: the output of RFBs is maximized by increasing the active surface area through the flow path design (inducing uniform flow of the electrolytes that pass through the electrodes), and the pressure drop is minimized, reducing the power consumptions of the pumps used in RFBs [6]. Electrolyte flow uniformity is important in order to ensure the performance of the redox cells. If the flow is reversed or the velocity is negligible in any part of the redox battery, the overall efficiency of the redox battery will decrease [7].
Previous studies on the improvement of RFB efficiency are as follows. Escudero-González et al. [8,9] defined an equation for evaluating electrolyte nonuniformity by analyzing the RFB flow characteristics, and proposed a cell design that minimized nonuniformity using the commercial code. This code was verified by comparisons with experimental pressure drops for various flow rates. Ma et al. [10] analyzed the capacity and system efficiency of vanadium RFBs, according to the flow rate of the electrolytes, and Reed et al. [11] analyzed the electrical efficiency and pressure drop according to the electrode type, in addition to analyzing the capacity and pressure drop of the batteries according to the electrolyte flow rate. Messaggi et al. [12] performed experimental and numerical studies to check the uniform distribution of electrolytes on the porous electrodes of vanadium. This work describes the development and experimental validation of a three dimensional computational fluid dynamics (CFD) model for a vanadium RFB in a half-cell configuration. Bortolin et al. [13] introduced a method including several performance indicators, by using CFD simulation to determine the pressure drop and flow distribution of membrane electrode assembly (MEA).
Although many studies have been conducted on this subject, most of them use vanadium electrolytes, and few have considered the Zn/Br RFB, which has the aforementioned advantage over vanadium. In the Zn/Br RFB, however, zinc may deposit at the anode during the charge and discharge process [14]. This bromide complex of zinc interferes with the flow, and thus the pressure drop increases. This also causes a non-uniform flow into the electrode. In order to have flow uniformity and a low-pressure loss, the improvement of the flow frame design is necessary along with the crush of the oily bromide complex. In this study, the internal flow characteristics of a Zn/Br RFB were numerically and experimentally analyzed. Based on the results, we proposed a new flow frame for maximizing the electrolyte uniformity and minimizing the internal pressure drop to improve the battery’s output and efficiency. To verify the commercial code, we performed a cell visualization experiment and a pressure drop experiment for various flow rate conditions, and compared the experimental results with the numerical results.

2. Materials and Methods

2.1. Governing Equations

The flow through the RFB was numerically analyzed using a commercial CFD code, ANSYS Fluent. The governing equations considered herein include the continuity and momentum equations for incompressible flow. These equations are shown as Equations (1) and (2) below.
( ρ v ) = 0
t ( ρ v ) + ( ρ v v ) = p + ( τ ¯ ) ,
where ρ is the density, v is the velocity, and p is the static pressure. τ is the stress tensor, which can be expressed as Equation (3).
τ ¯ = μ [ ( v + v T ) 2 3 v I ]
here, μ is the viscosity coefficient and I is the unit tensor. The pressure-based method and the SIMPLE algorithm, which are suitable for low-velocity incompressible flow analysis, were used in the numerical method herein. For the discretization of space, the second-order upwind was used to obtain the solutions in space.
In addition, the electrode and spacer structures in the RFB were simulated using a porous media model [15]. The porous media model adds the source term ( S ) into the momentum equation. These equations are shown as Equation (4) below.
S = μ η v + R i k 1 2 ρ | v | v ,
where η is the permeability of viscous fluid and R i k is the inertia loss resistance in any direction.
Additionally, the volume of fluid (VOF) model was used for the flow visualizations [16]. The VOF model is a multiphase flow model that predicts fluid behavior through the interfacial tracking of two or more unmixed fluids. The continuity equation for the phase q of the fluid is as shown in Equation (5), and Equation (6) is calculated for each control volume.
1 ρ q [ t ( α q ρ q ) + ( α q ρ q v q ) = p = 1 n ( m ˙ p q m ˙ q p ) ]
q = 1 n α q = 1 ,
where m ˙ p q and m ˙ q p denote the mass transfers between phases (p and q), respectively, depending on the mass transfer direction.

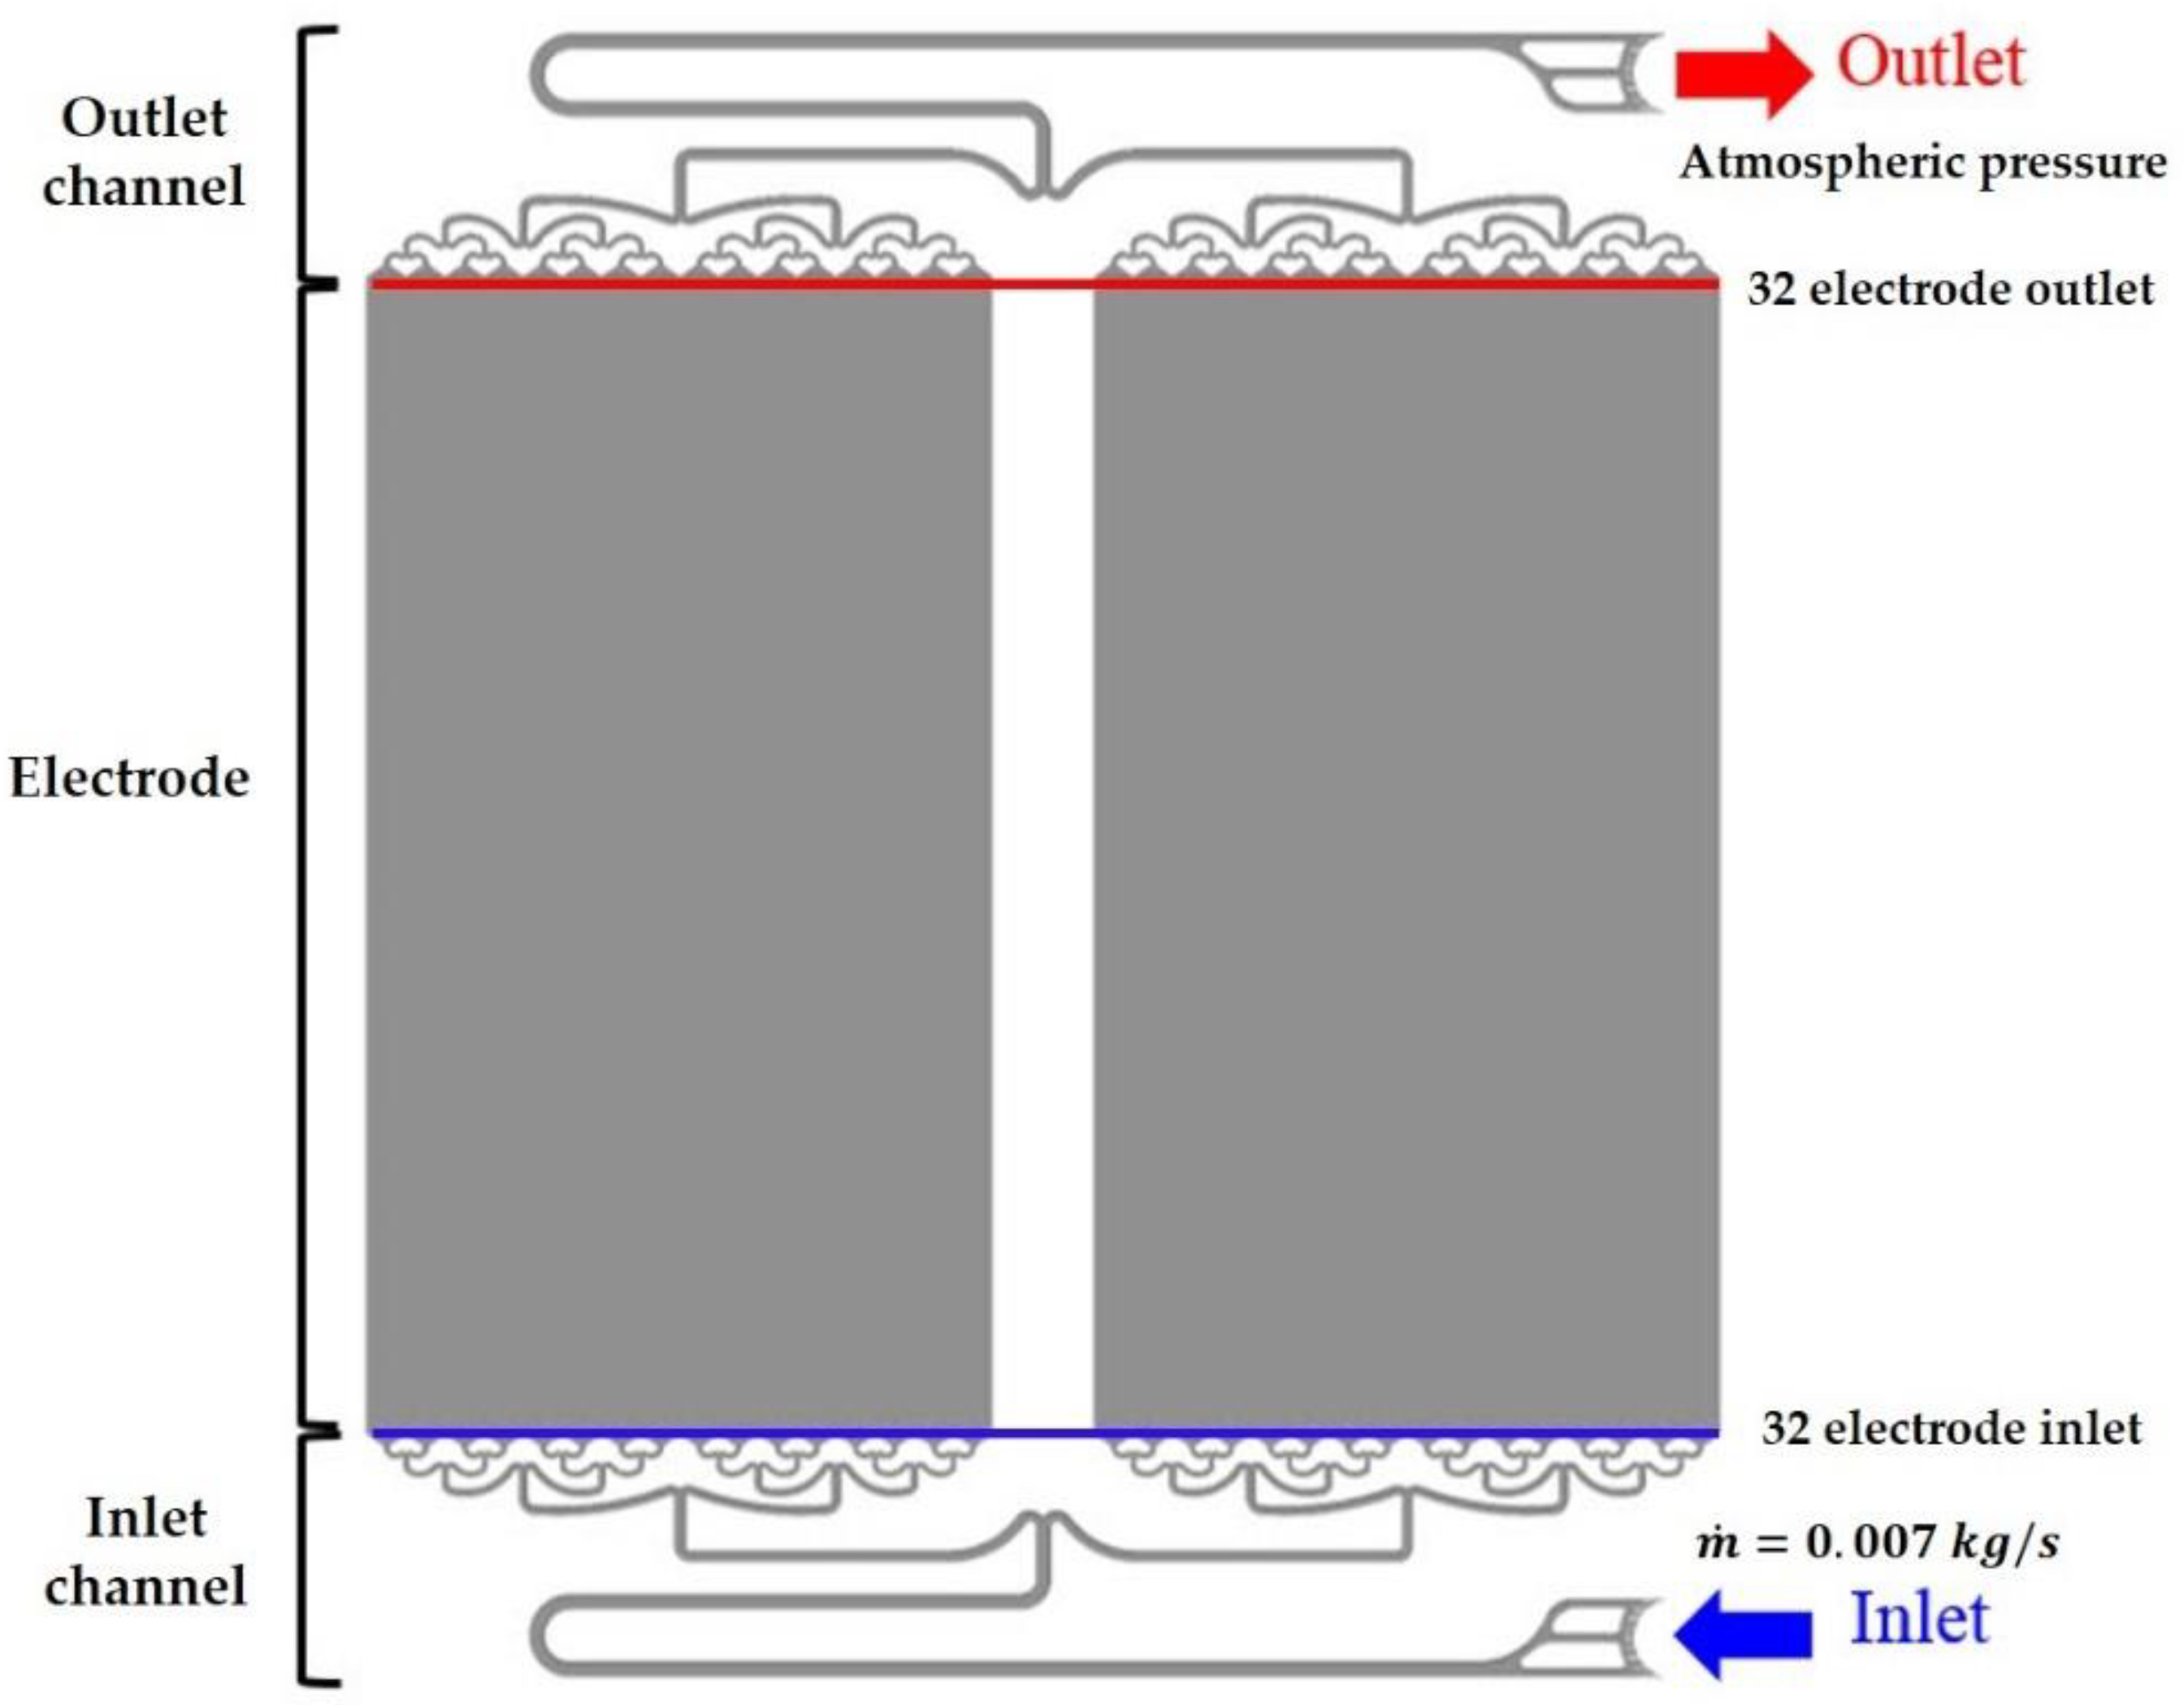
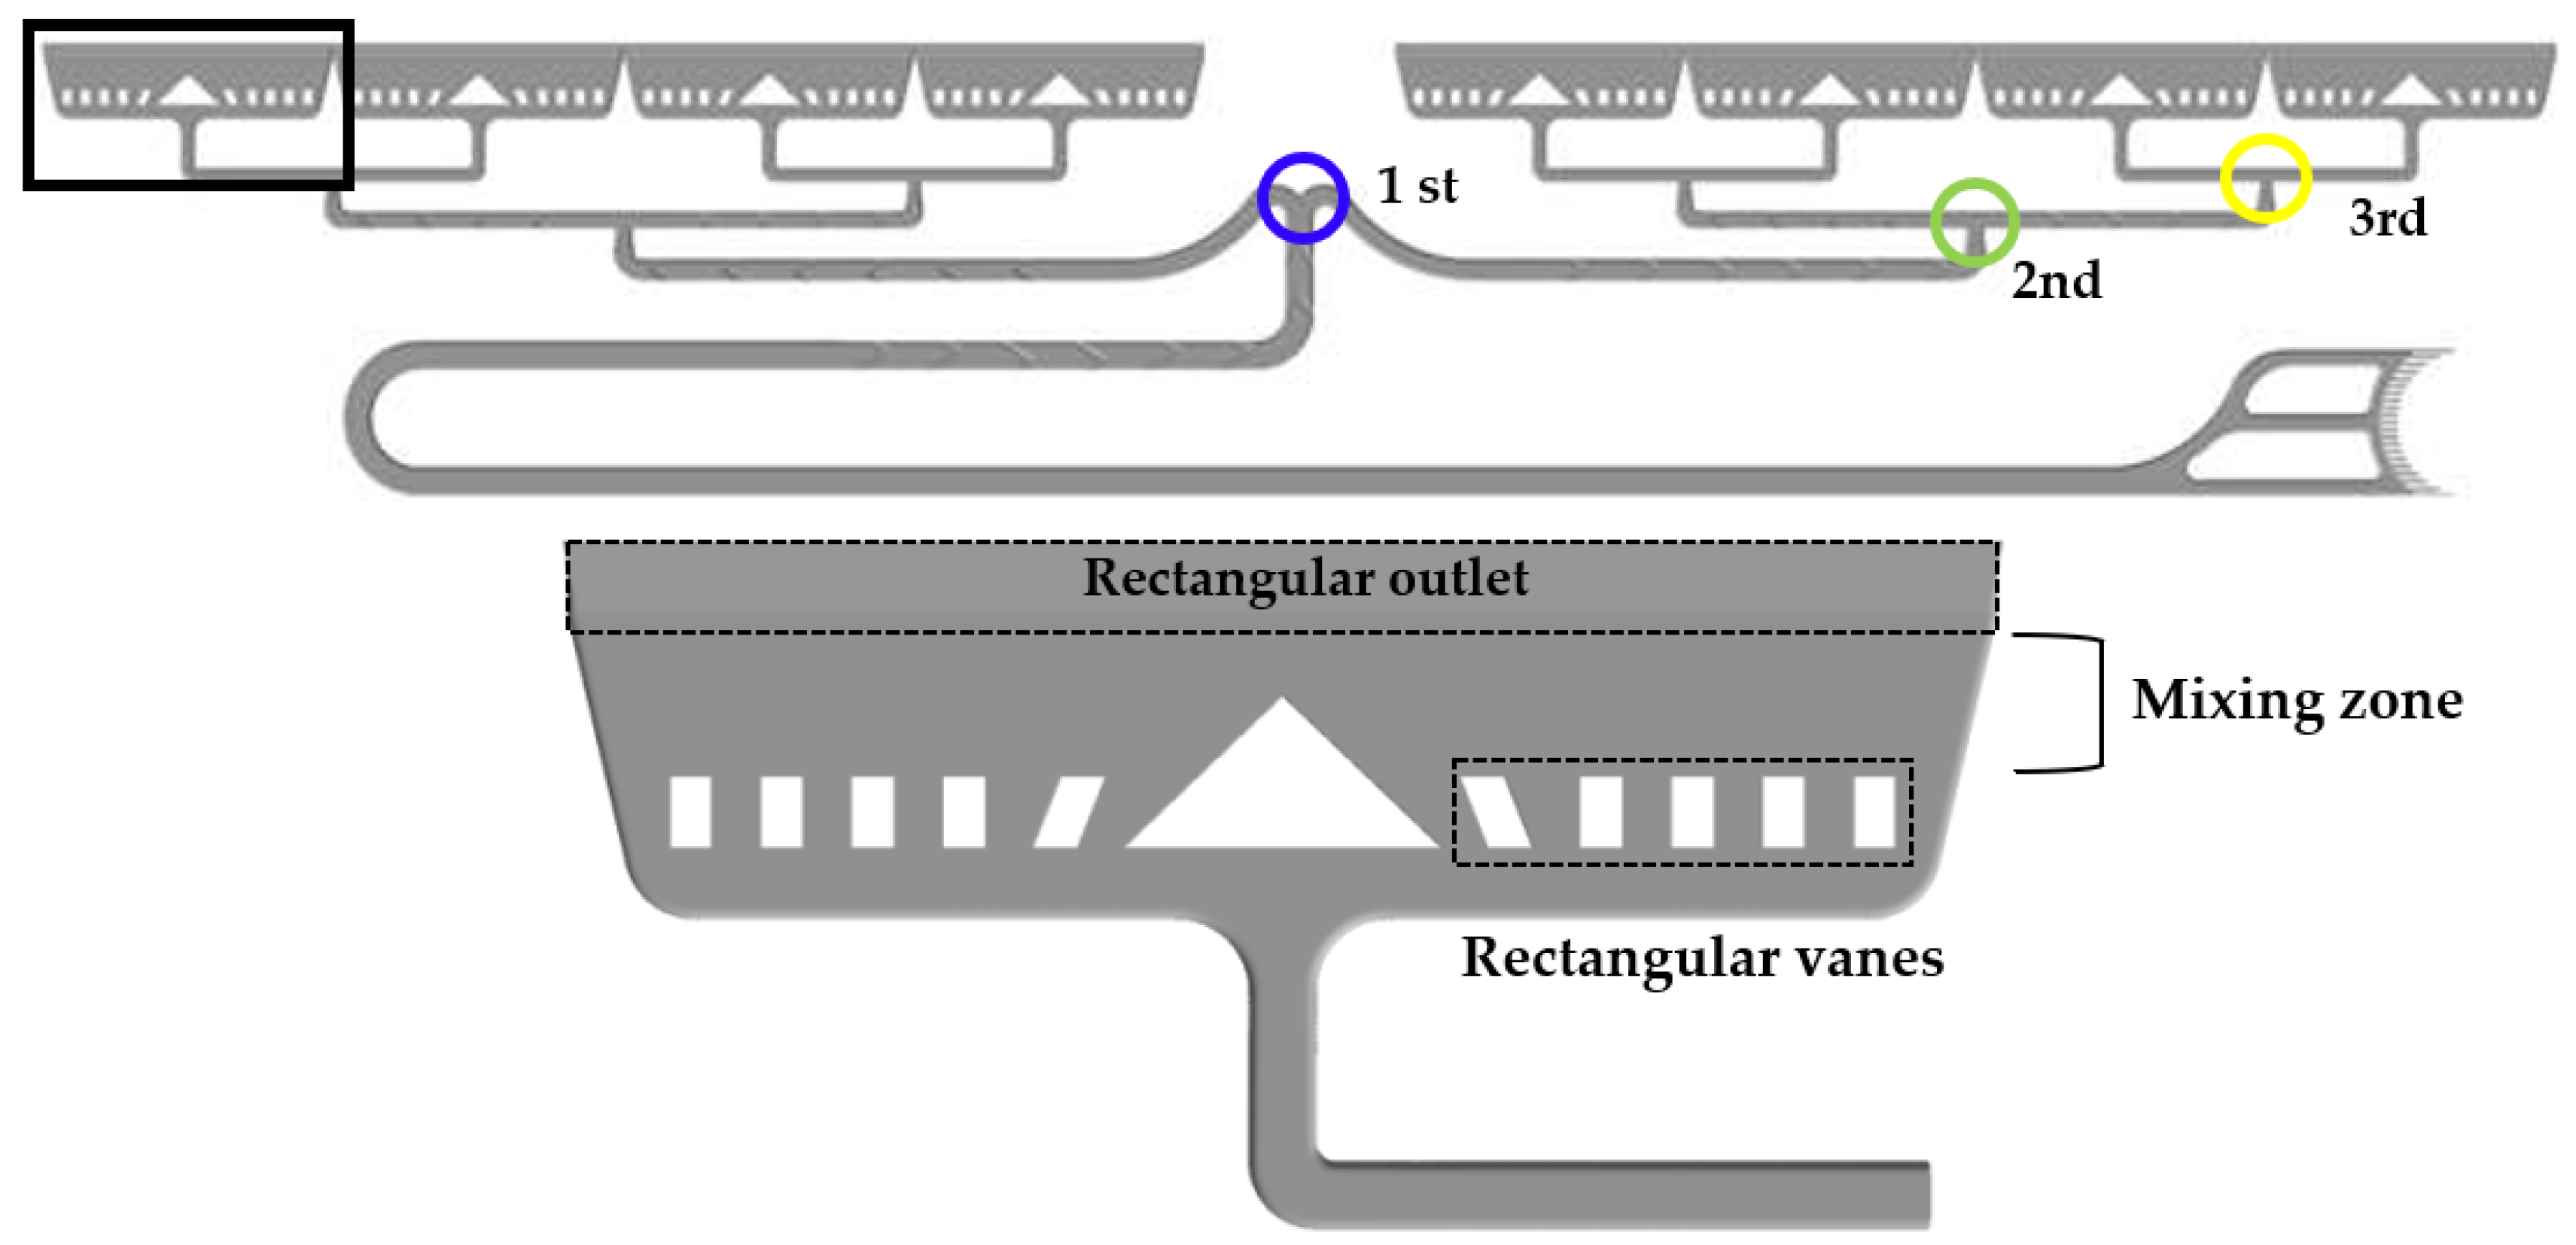
2.2. Computational Domain and Boundary Conditions

Nathan et al. [17] designed the conventional flow frame used in this study, comprising of vertically symmetrical flow channels and an electrode, as shown in Figure 1. The flow frame comprises an inlet channel, an electrode, and an outlet channel. Each channel has bifurcations at five stages. At the last stage of the inlet channel, the solution flows into the electrode through the 32 electrode inlets.
The commercial software, ANSYS Fluent, was used for the flow analysis; an incompressible laminar flow (maximum Re <1300) was considered for all of the sections. Using a three-dimensional unstructured grid system, we constructed the flow channels with tetrahedral grids and the electrode with hexahedral grids. The operating flow rate of the RFB was 18 LPM(Liter per minute) based on 60 cells. Based on a single cell, the 0.3 LPM electrolyte was introduced at the inlet with a specified mass flow inlet condition, and atmospheric conditions were applied at the outlet (Table 1). For the anolyte, an oily bromide complex with a higher density and viscosity than the conventional electrolyte was formed. Herein, for convenience, we conducted an analysis based on an SOC (State of charge) of 0%, for which the oily bromide complex was not formed. The density and viscosity of the Zn/Br solution were 1402 kg / m 3 and 0.00216 kg / m s , respectively [18].

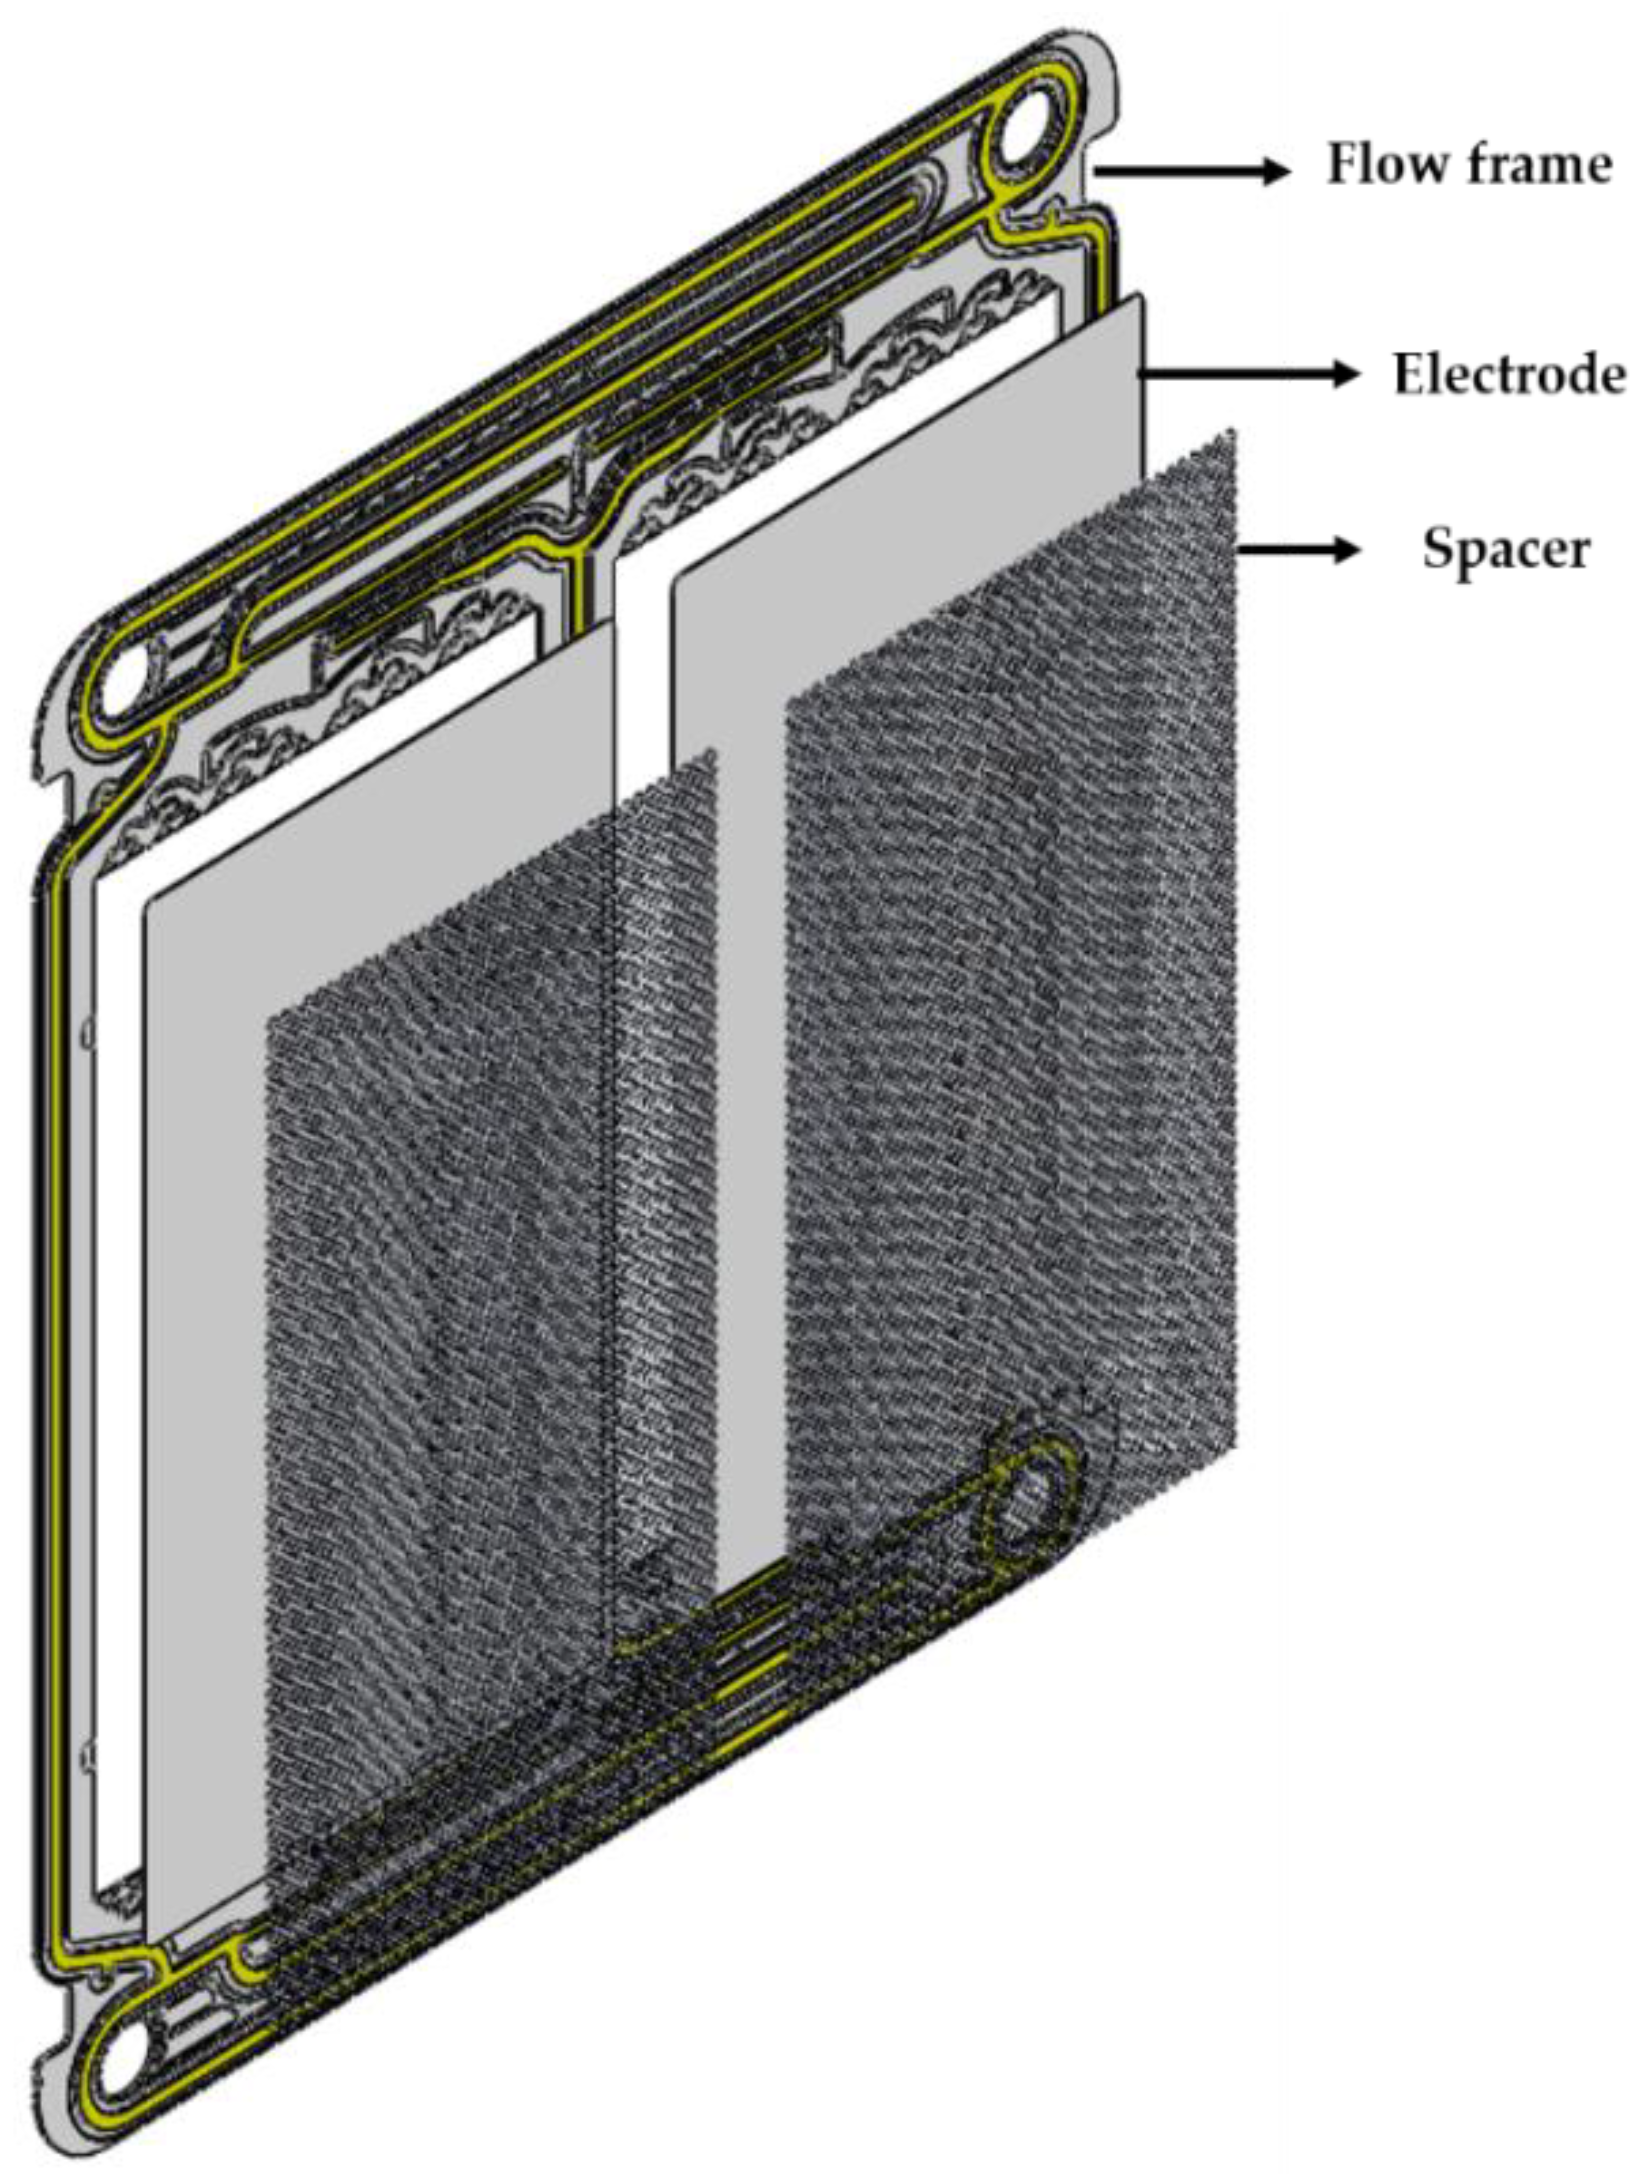
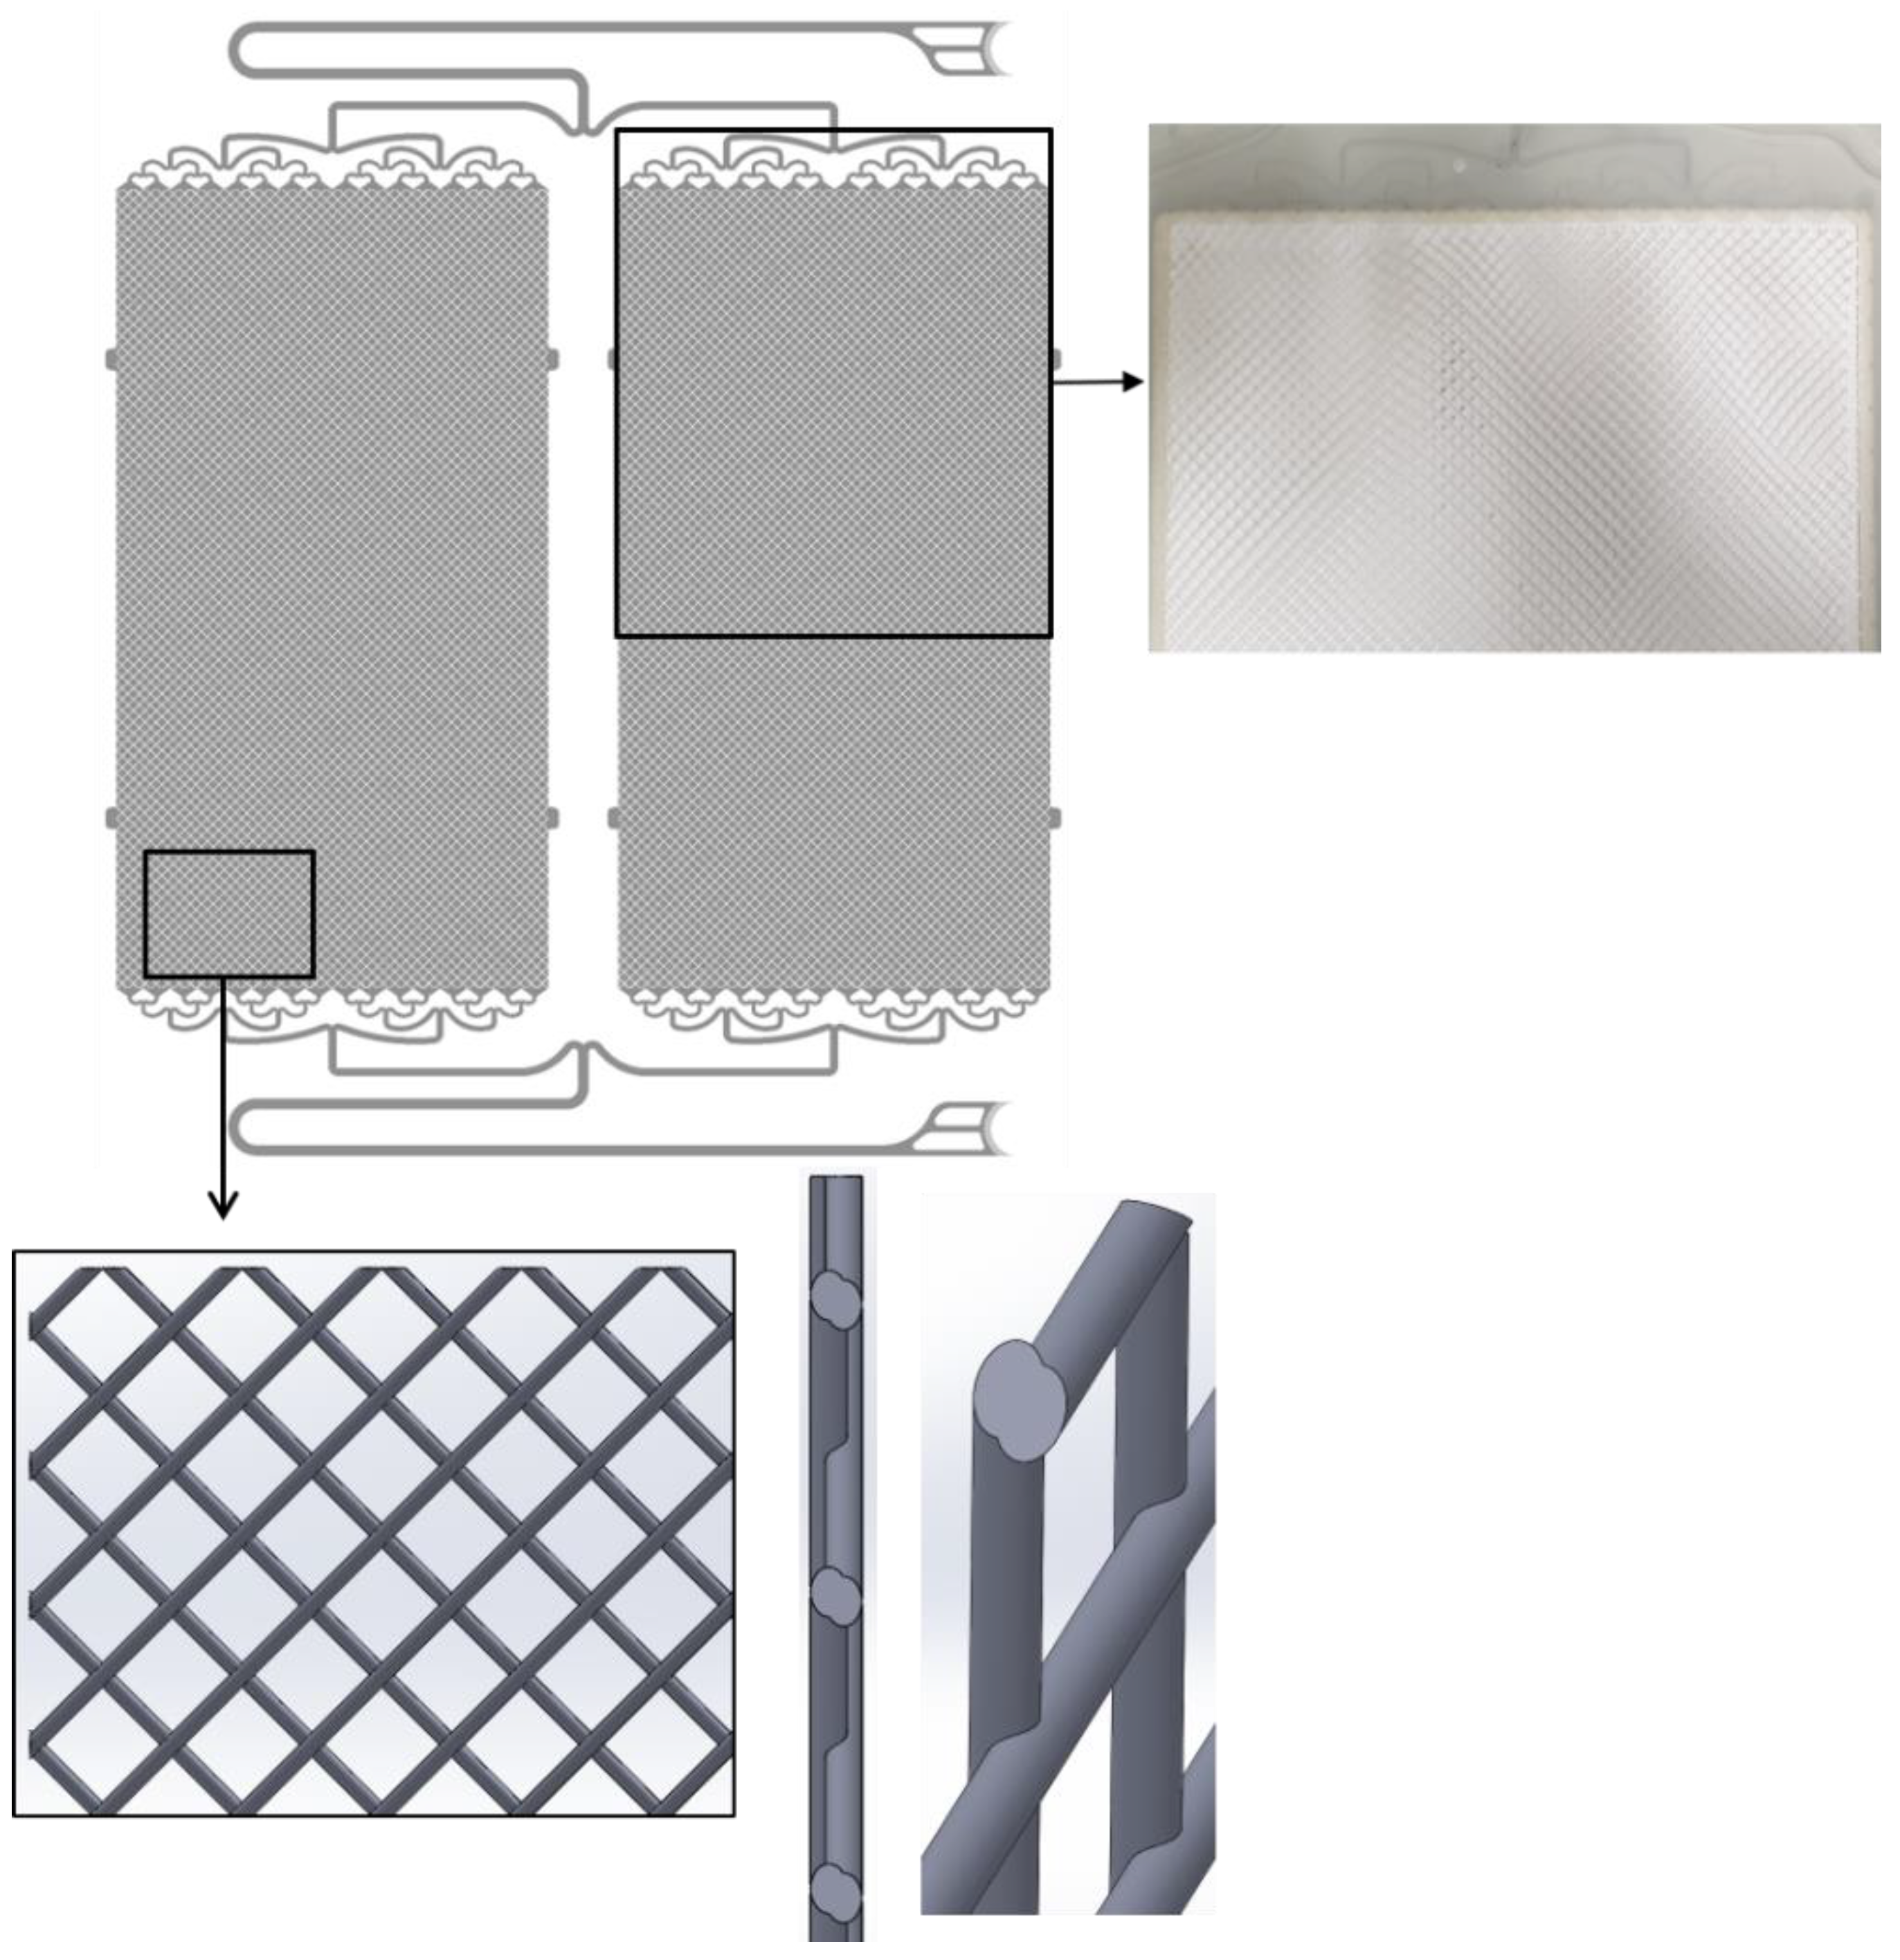
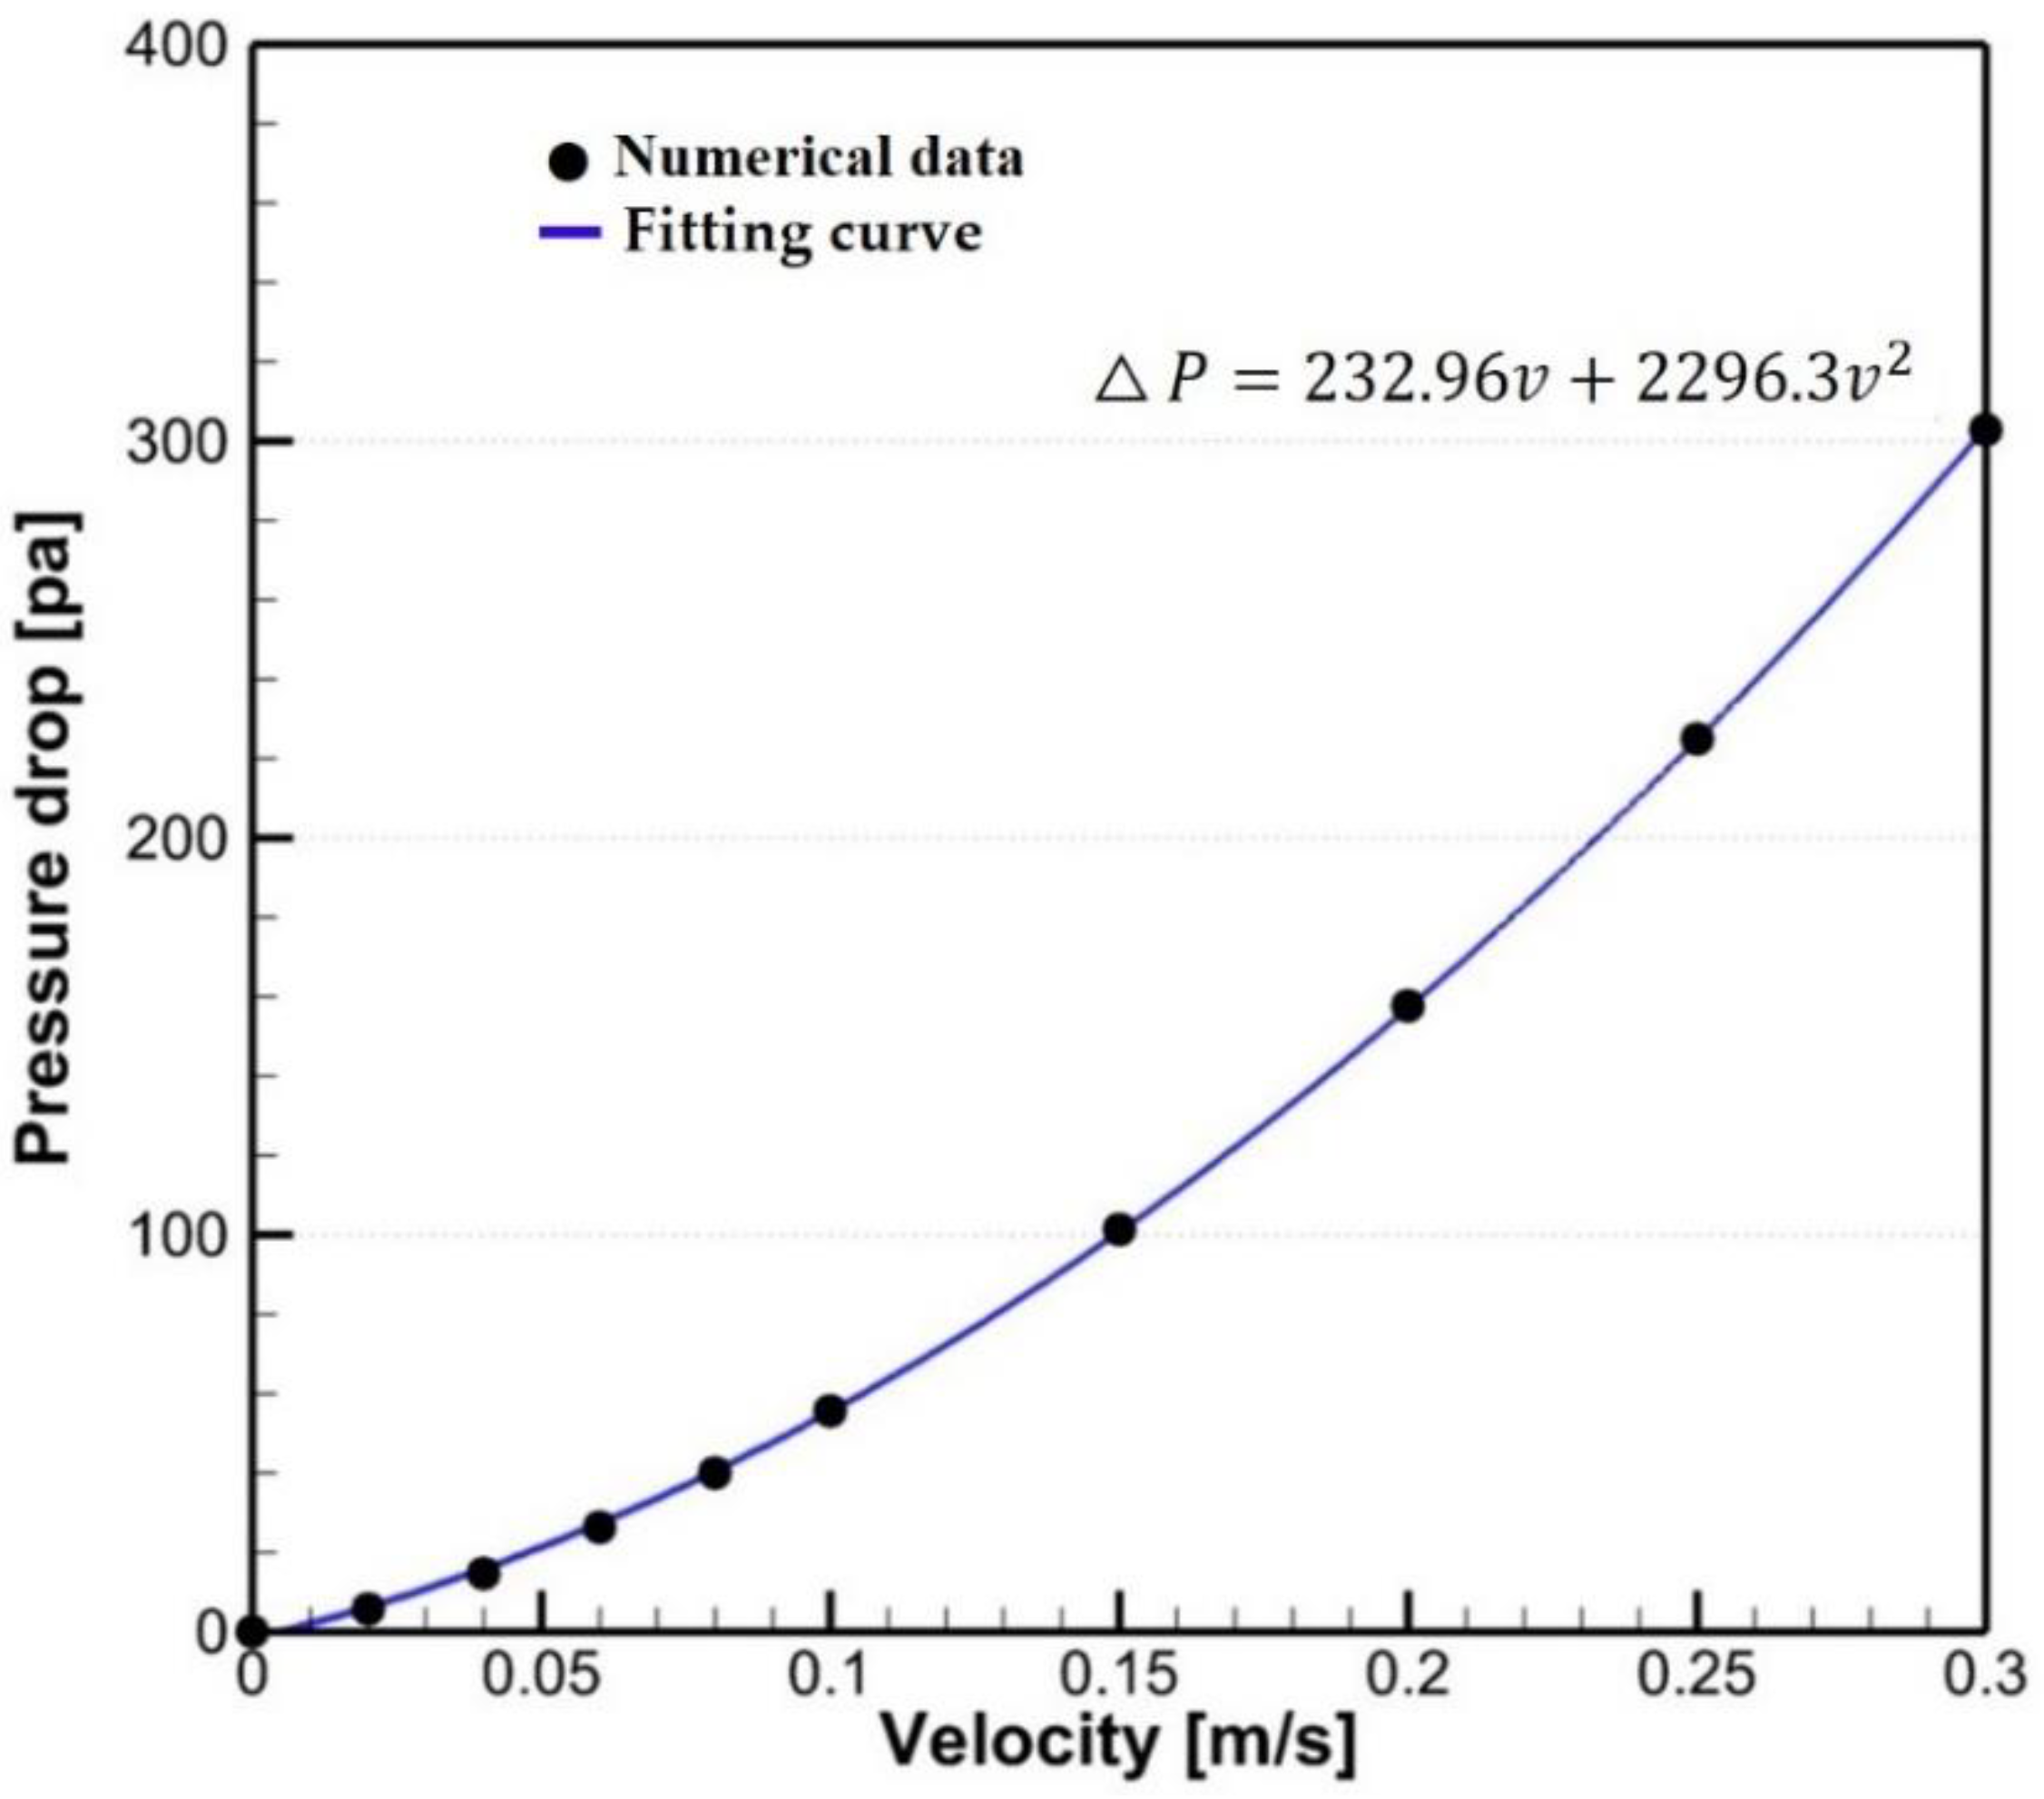
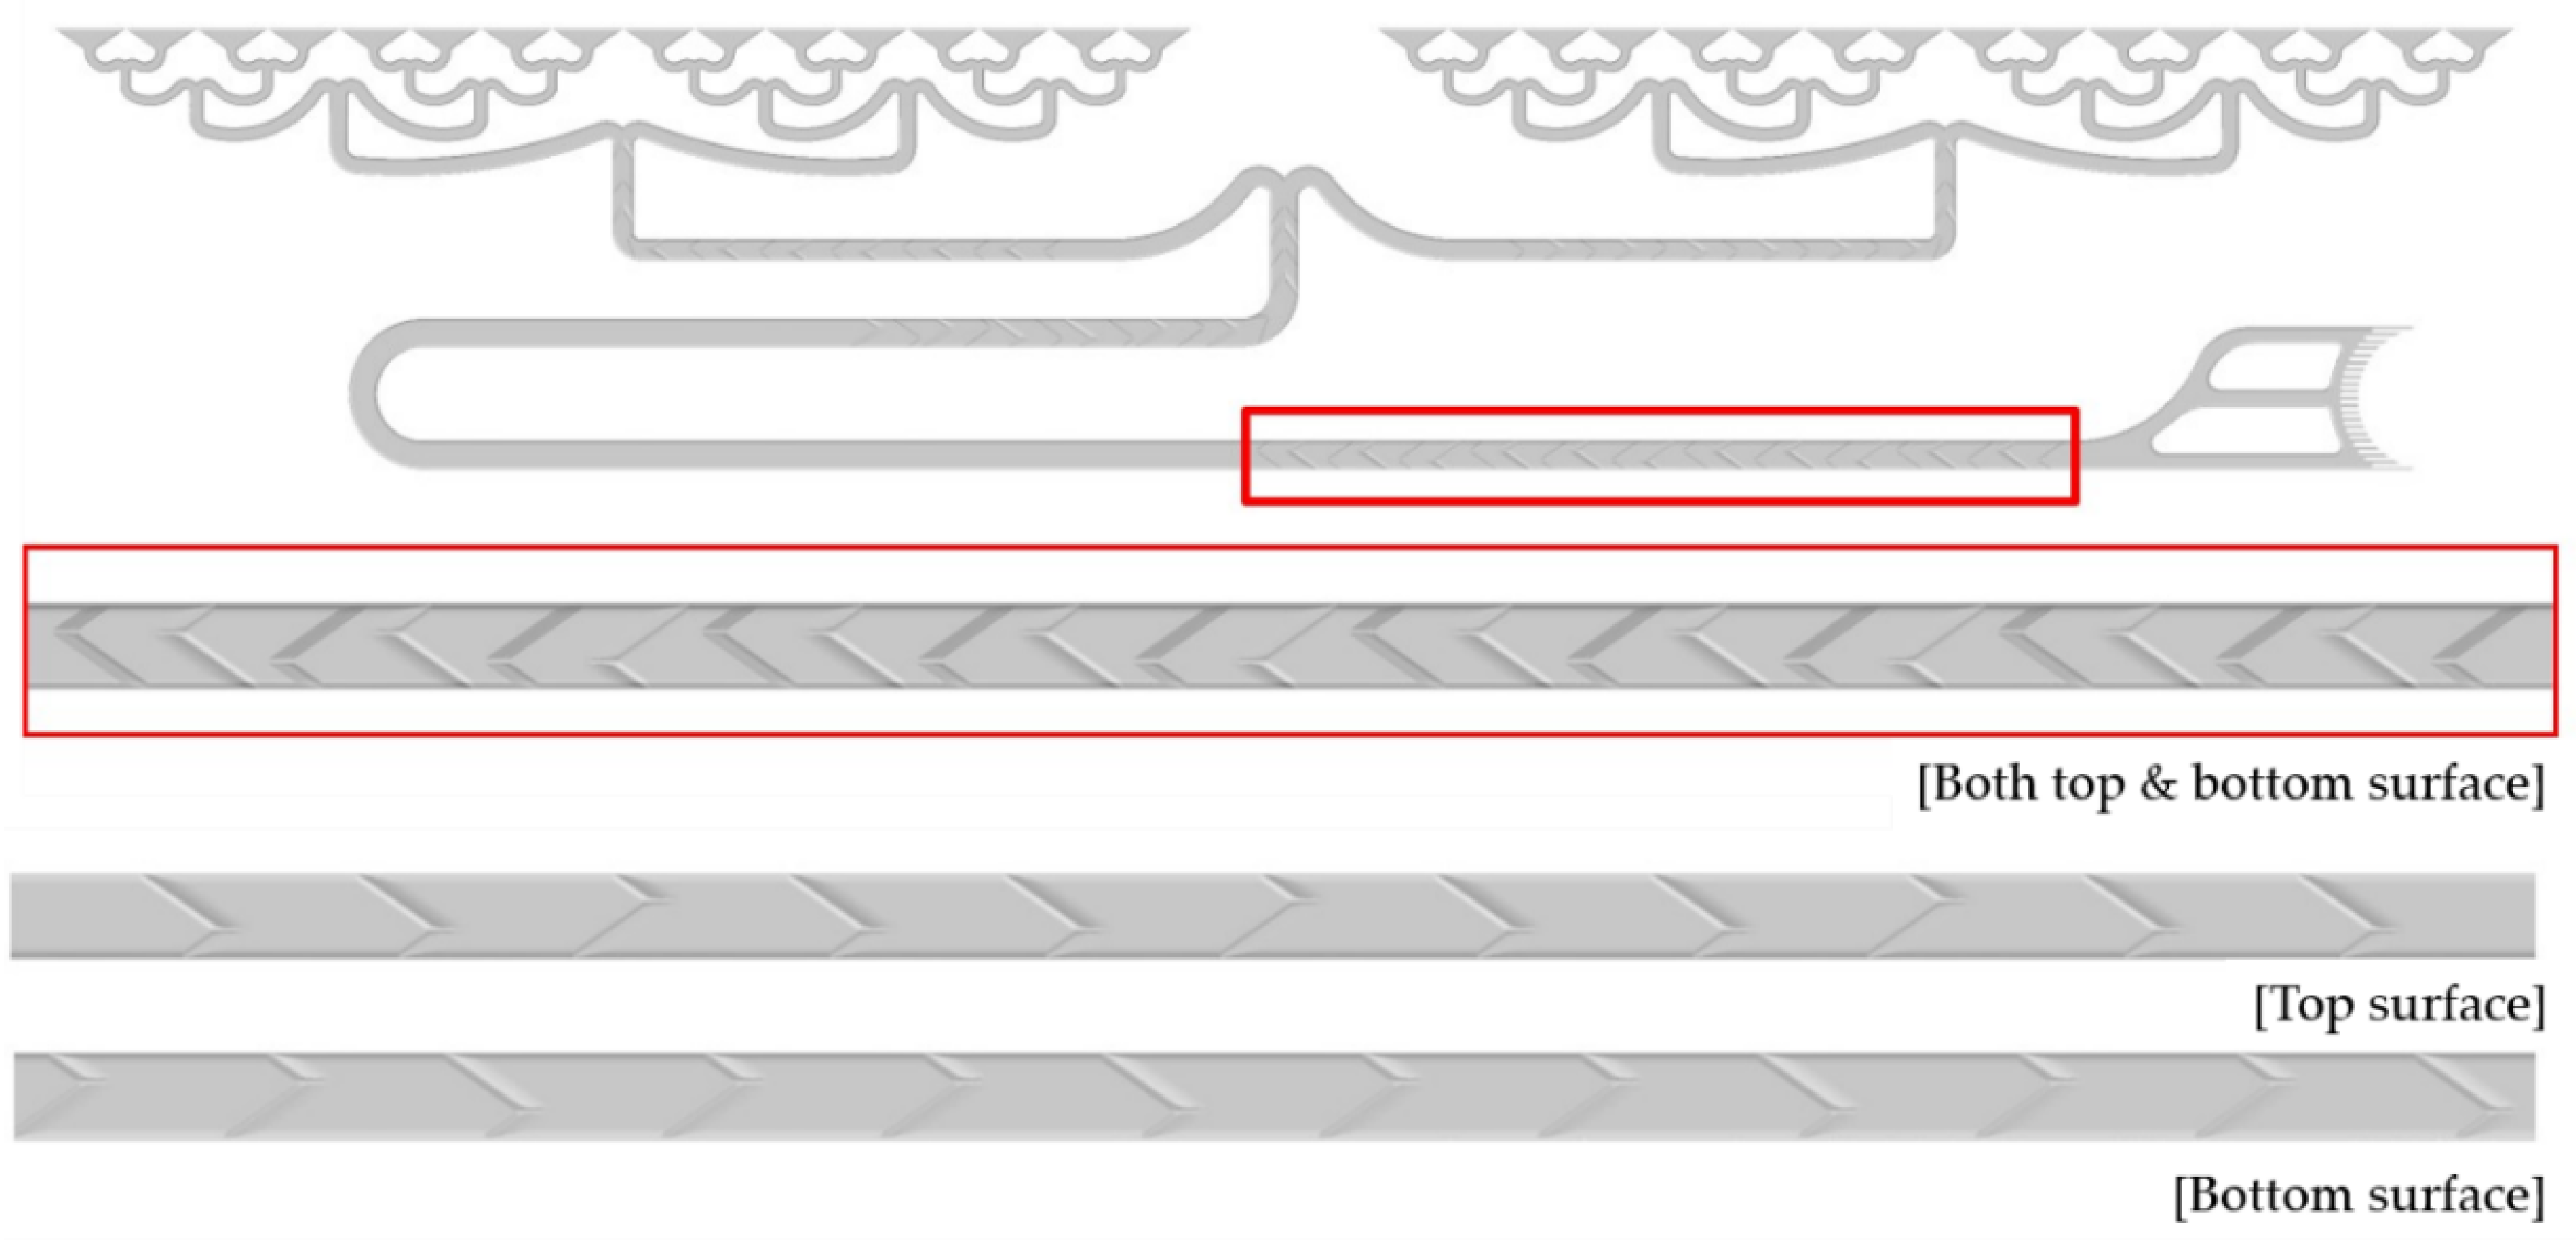
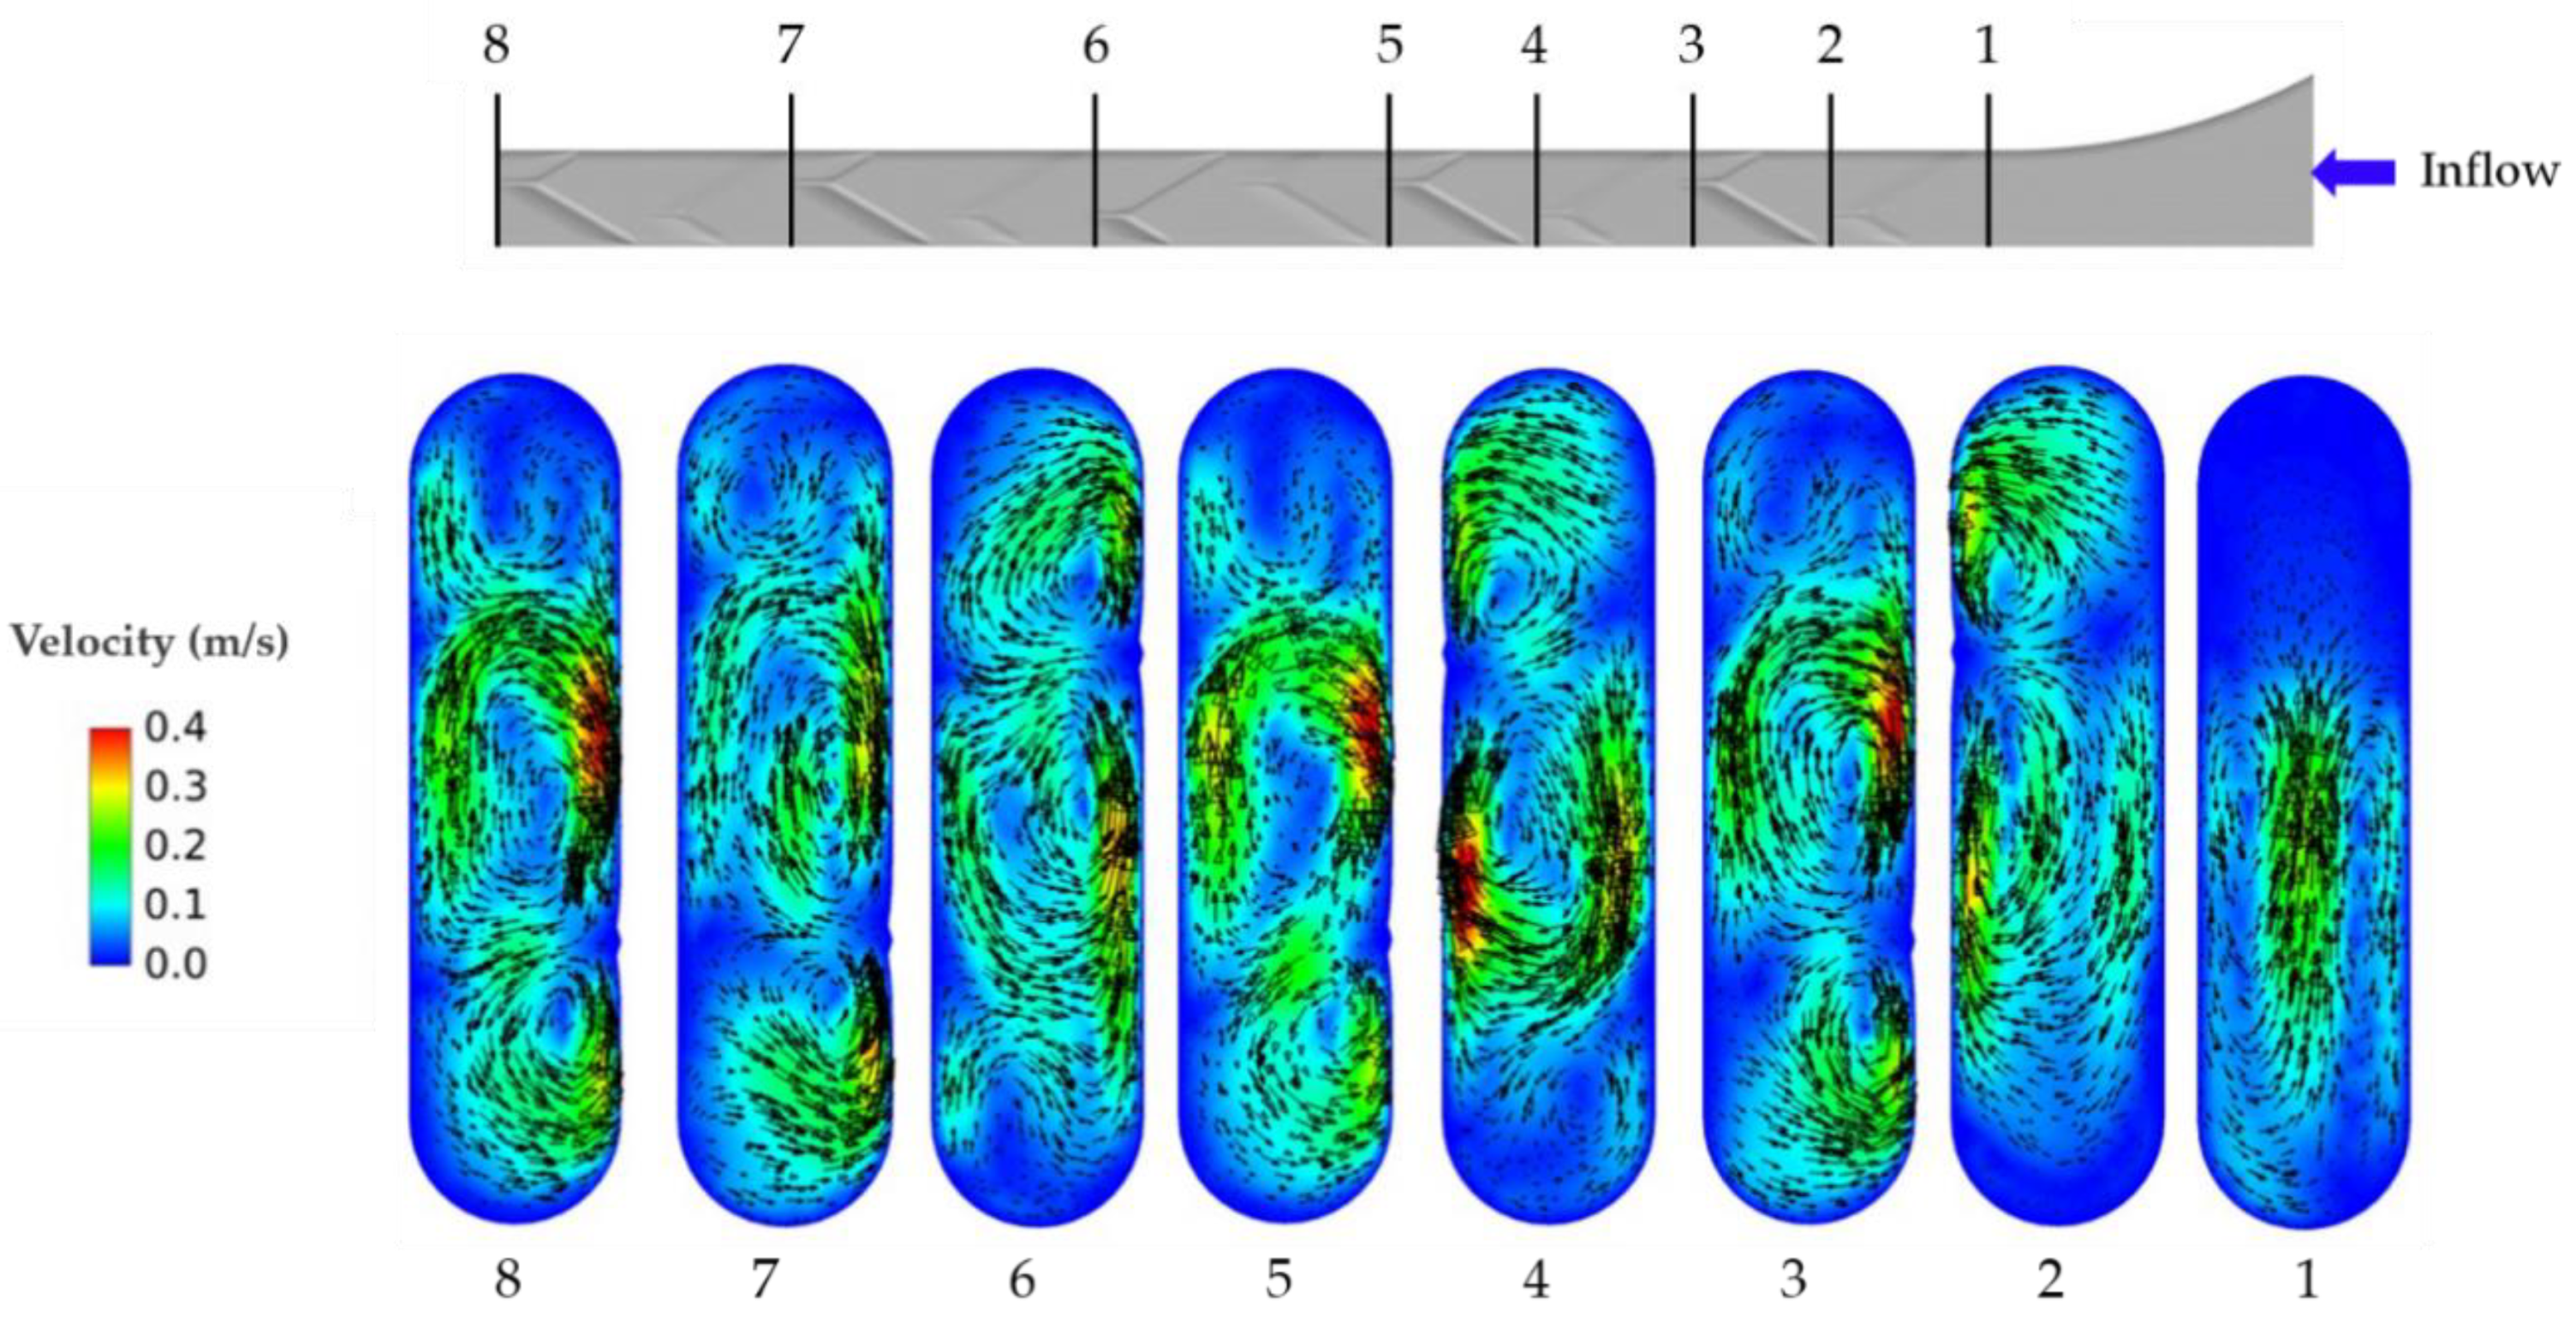
2.3. Porous Modeling of the Spacer

The Zn/Br flow battery is comprised of a flow frame, electrode, and spacer, as shown in Figure 2. The spacer located between the electrodes of the RFB is constructed in a mesh form for securing the space between the anode and cathode, as shown in Figure 3. To model the spacer as a porous medium, we calculated the pressure drop for the actual spacer geometry using computational fluid dynamics (CFD). The calculated pressure drop fits a quadratic function for velocities up to 0.3 m/s, as shown in Figure 4.
The pressure drops in the porous medium spacer were modeled using Equation (7) [15]. In Equation (7), the viscosity resistance 1 / α and inertial resistance C 2 were calculated (Table 2).
Δ P y = μ α v   Δ n y + C 2 1 2 ρ v 2   Δ n y
here, Δ n y is the porous medium thickness in the y-direction.

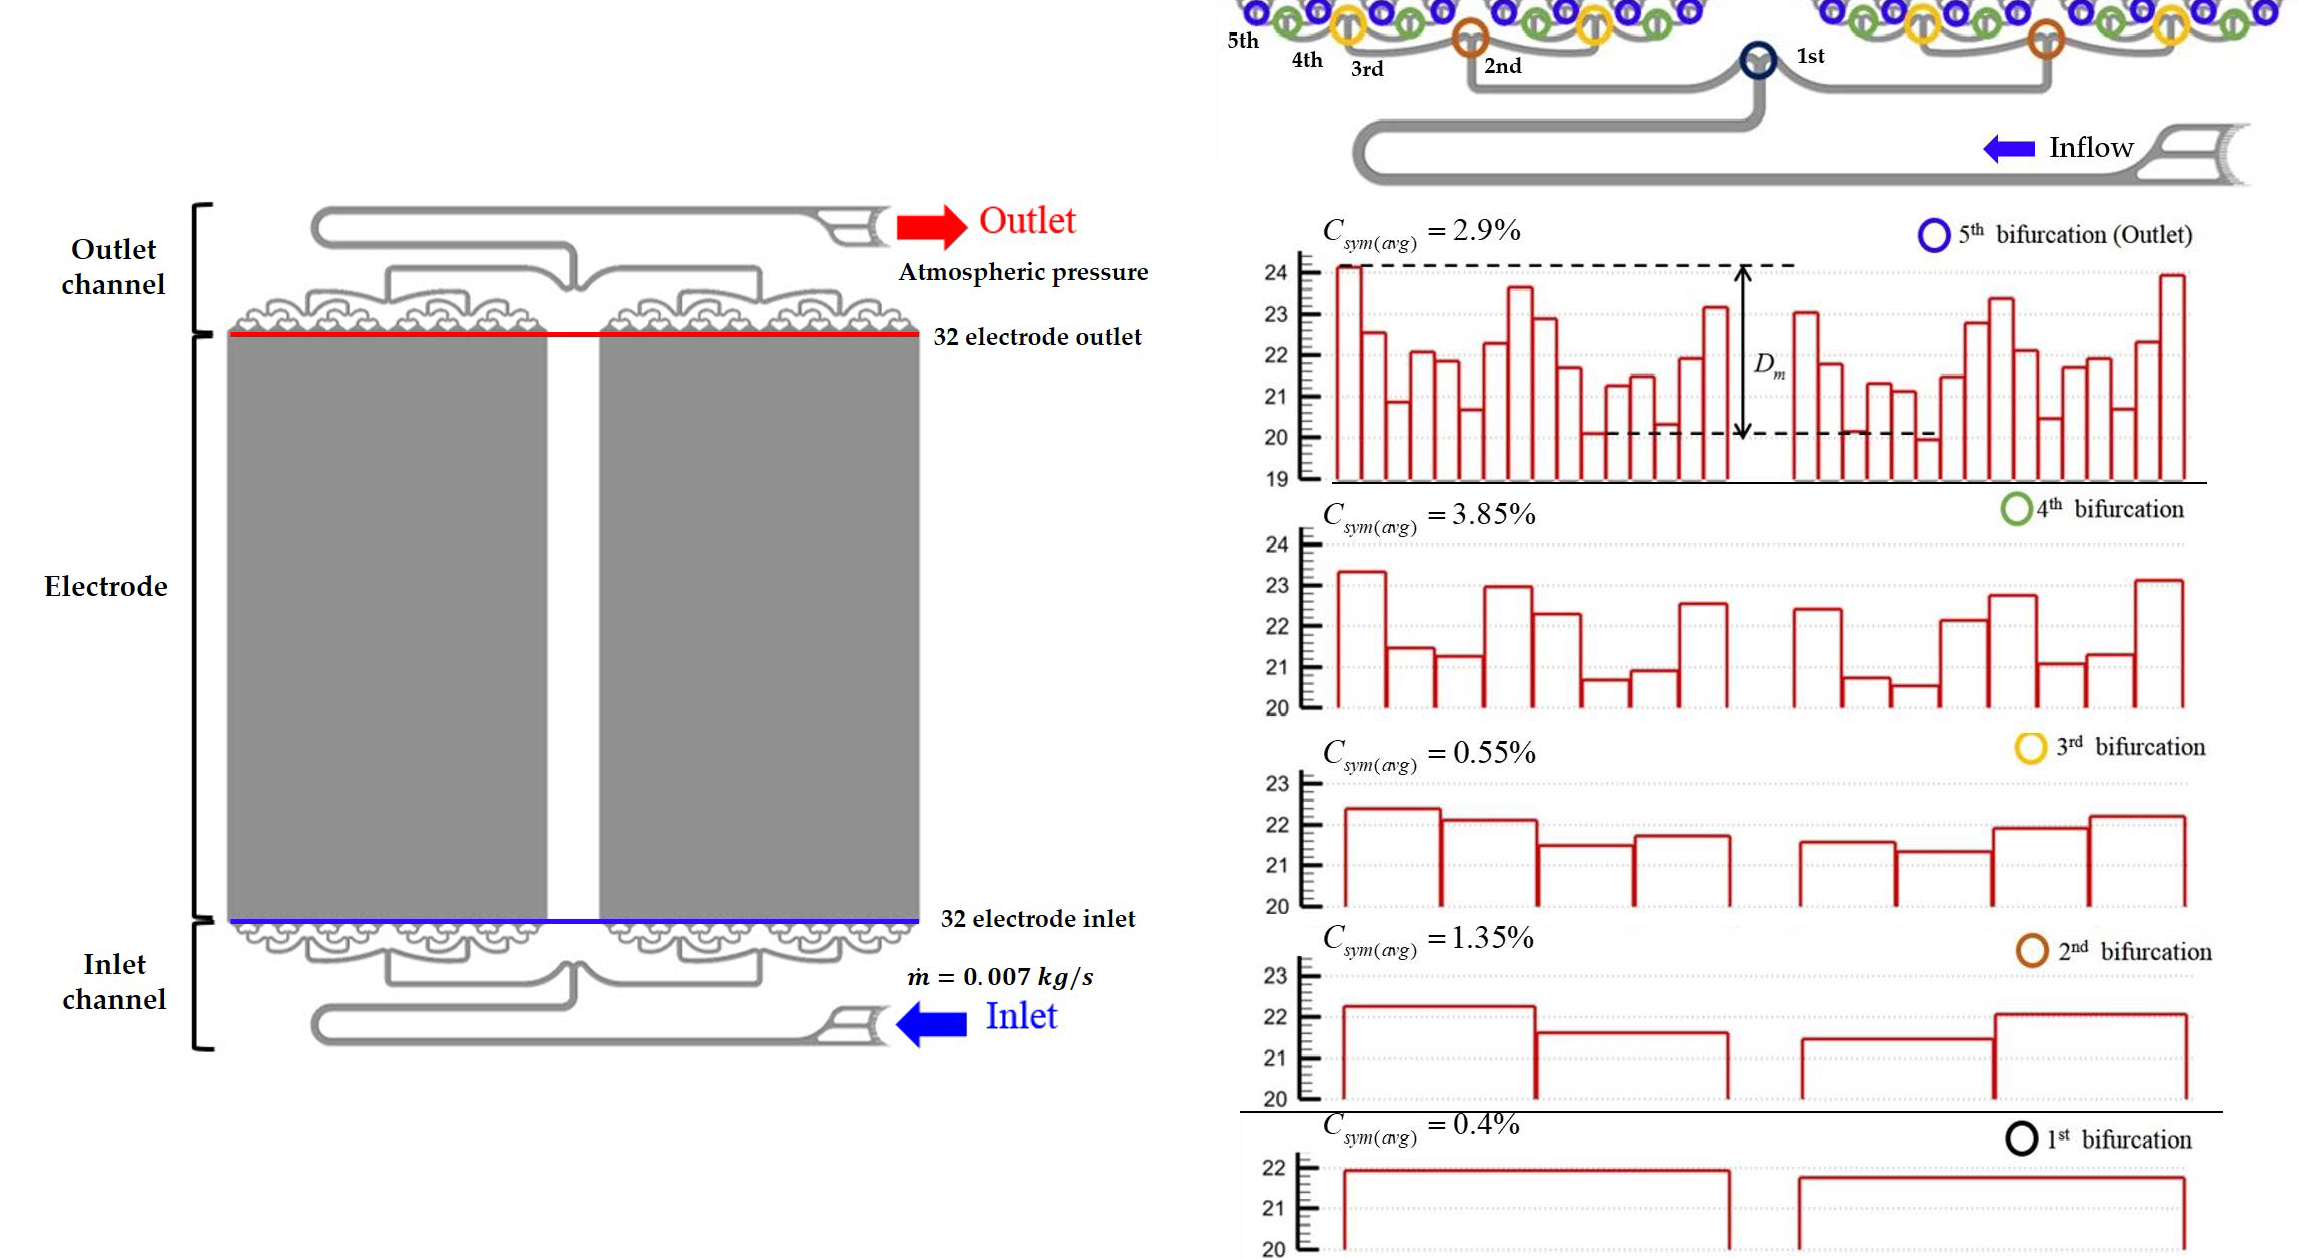
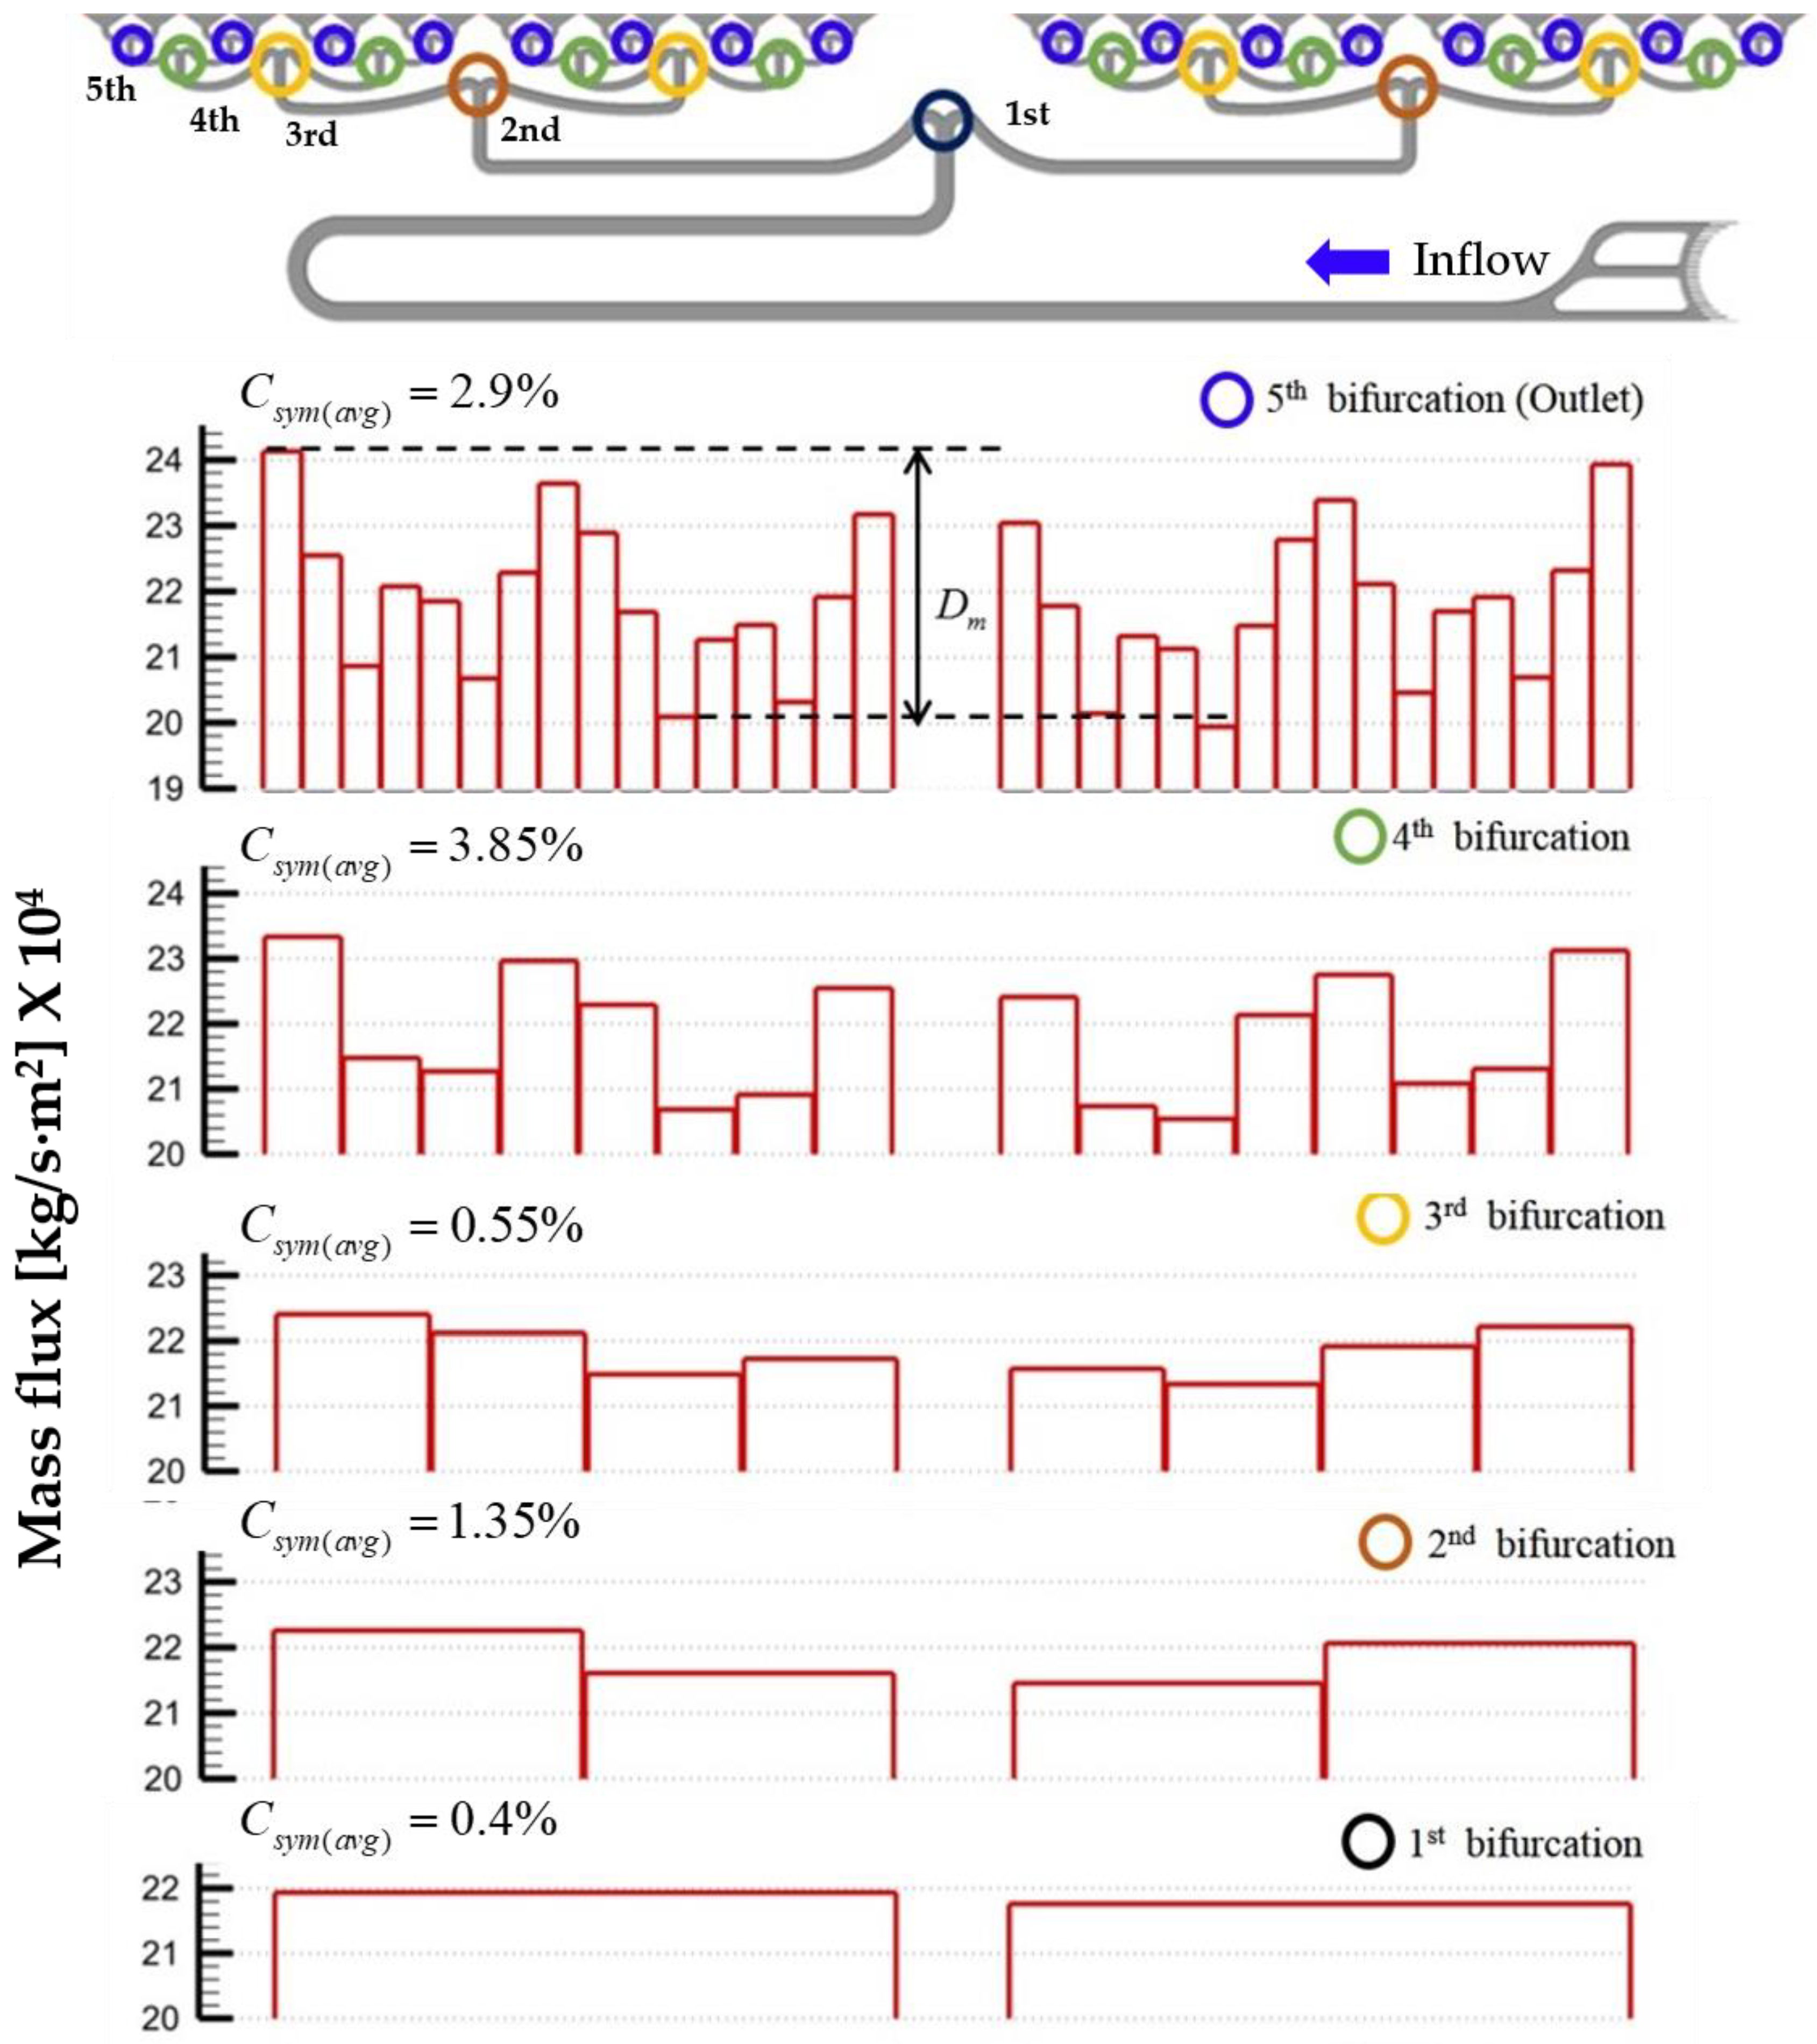
2.4. Design Parameters for Flow Uniformity

We evaluated the flow uniformity of the RFB based on the following parameters: the symmetry coefficient ( C s y m ), variability range coefficient ( R i ), and maximum flow rate deviation ( D m ). These parameters are shown in Equations (8)–(10), respectively [9].
C s y m [ % ] = | J x > 0 | | J x < 0 | | J x > 0 | + | J x < 0 | × 100
R i [ m / s ] = v max v min
D m [ % ] = m ˙ max m ˙ min m ˙ a v g × 100
where J is the mass flux, v is the velocity of the electrolyte solution entering the electrode through the inlet channel, and m ˙ is the mass flow rate. The symmetry coefficient ( C s y m ) represents the difference between the left and right mass fluxes at each bifurcation, and the variability range coefficient ( R i ) is the difference between the maximum and minimum velocities of the solution when it is discharged to the electrode from the inlet channel. As this difference increases, the nonuniformity of the electrolyte solution introduced to the electrode increases. The maximum flow rate deviation ( D m ) represents the maximum flow rate difference across the 32 electrode inlets of the inlet channel.

2.5. Experimental Setup

To verify the numerical results, the pressure drop and flow visualization results were experimentally obtained in the single cell of the RFB for various flow rates. The experimental setup was constructed as shown in Figure 5, and the specifications of the devices used for the experiment are listed in Table 3. In the experiment, water was used as the working fluid, and the pressure drop for each flow rate was measured three times.

3. Results and Discussion

3.1. Numerical Software Validation

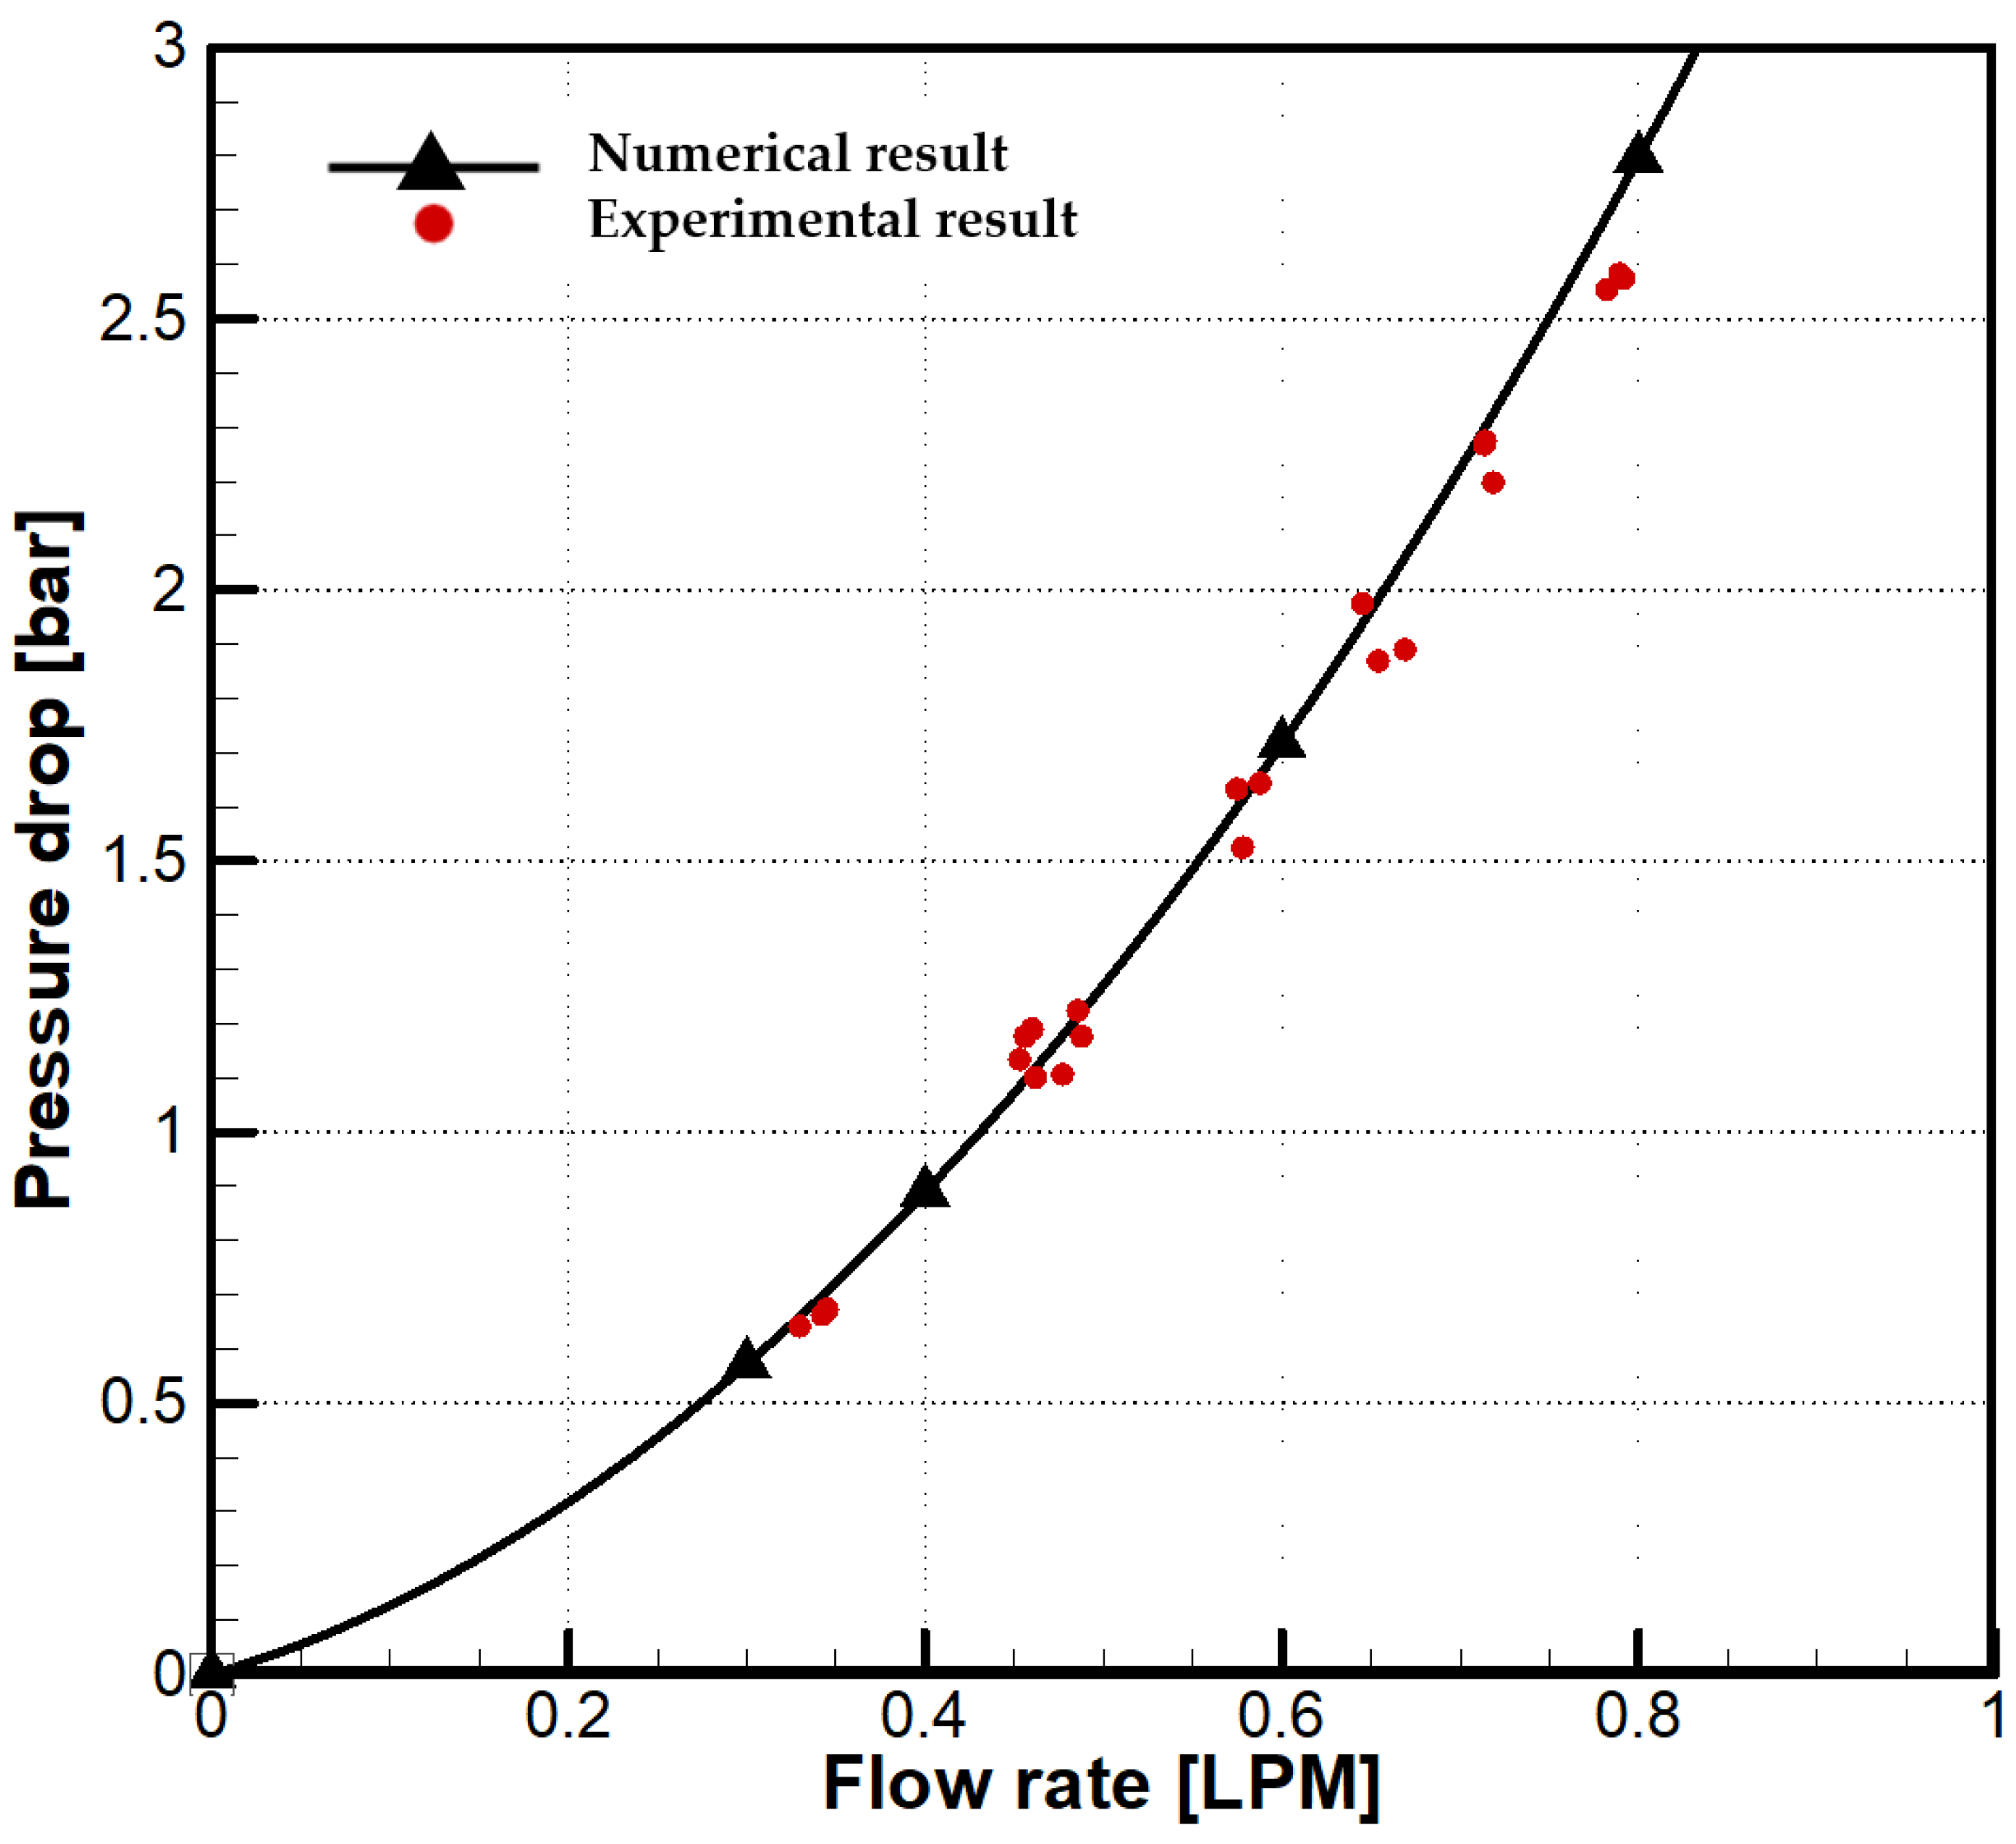
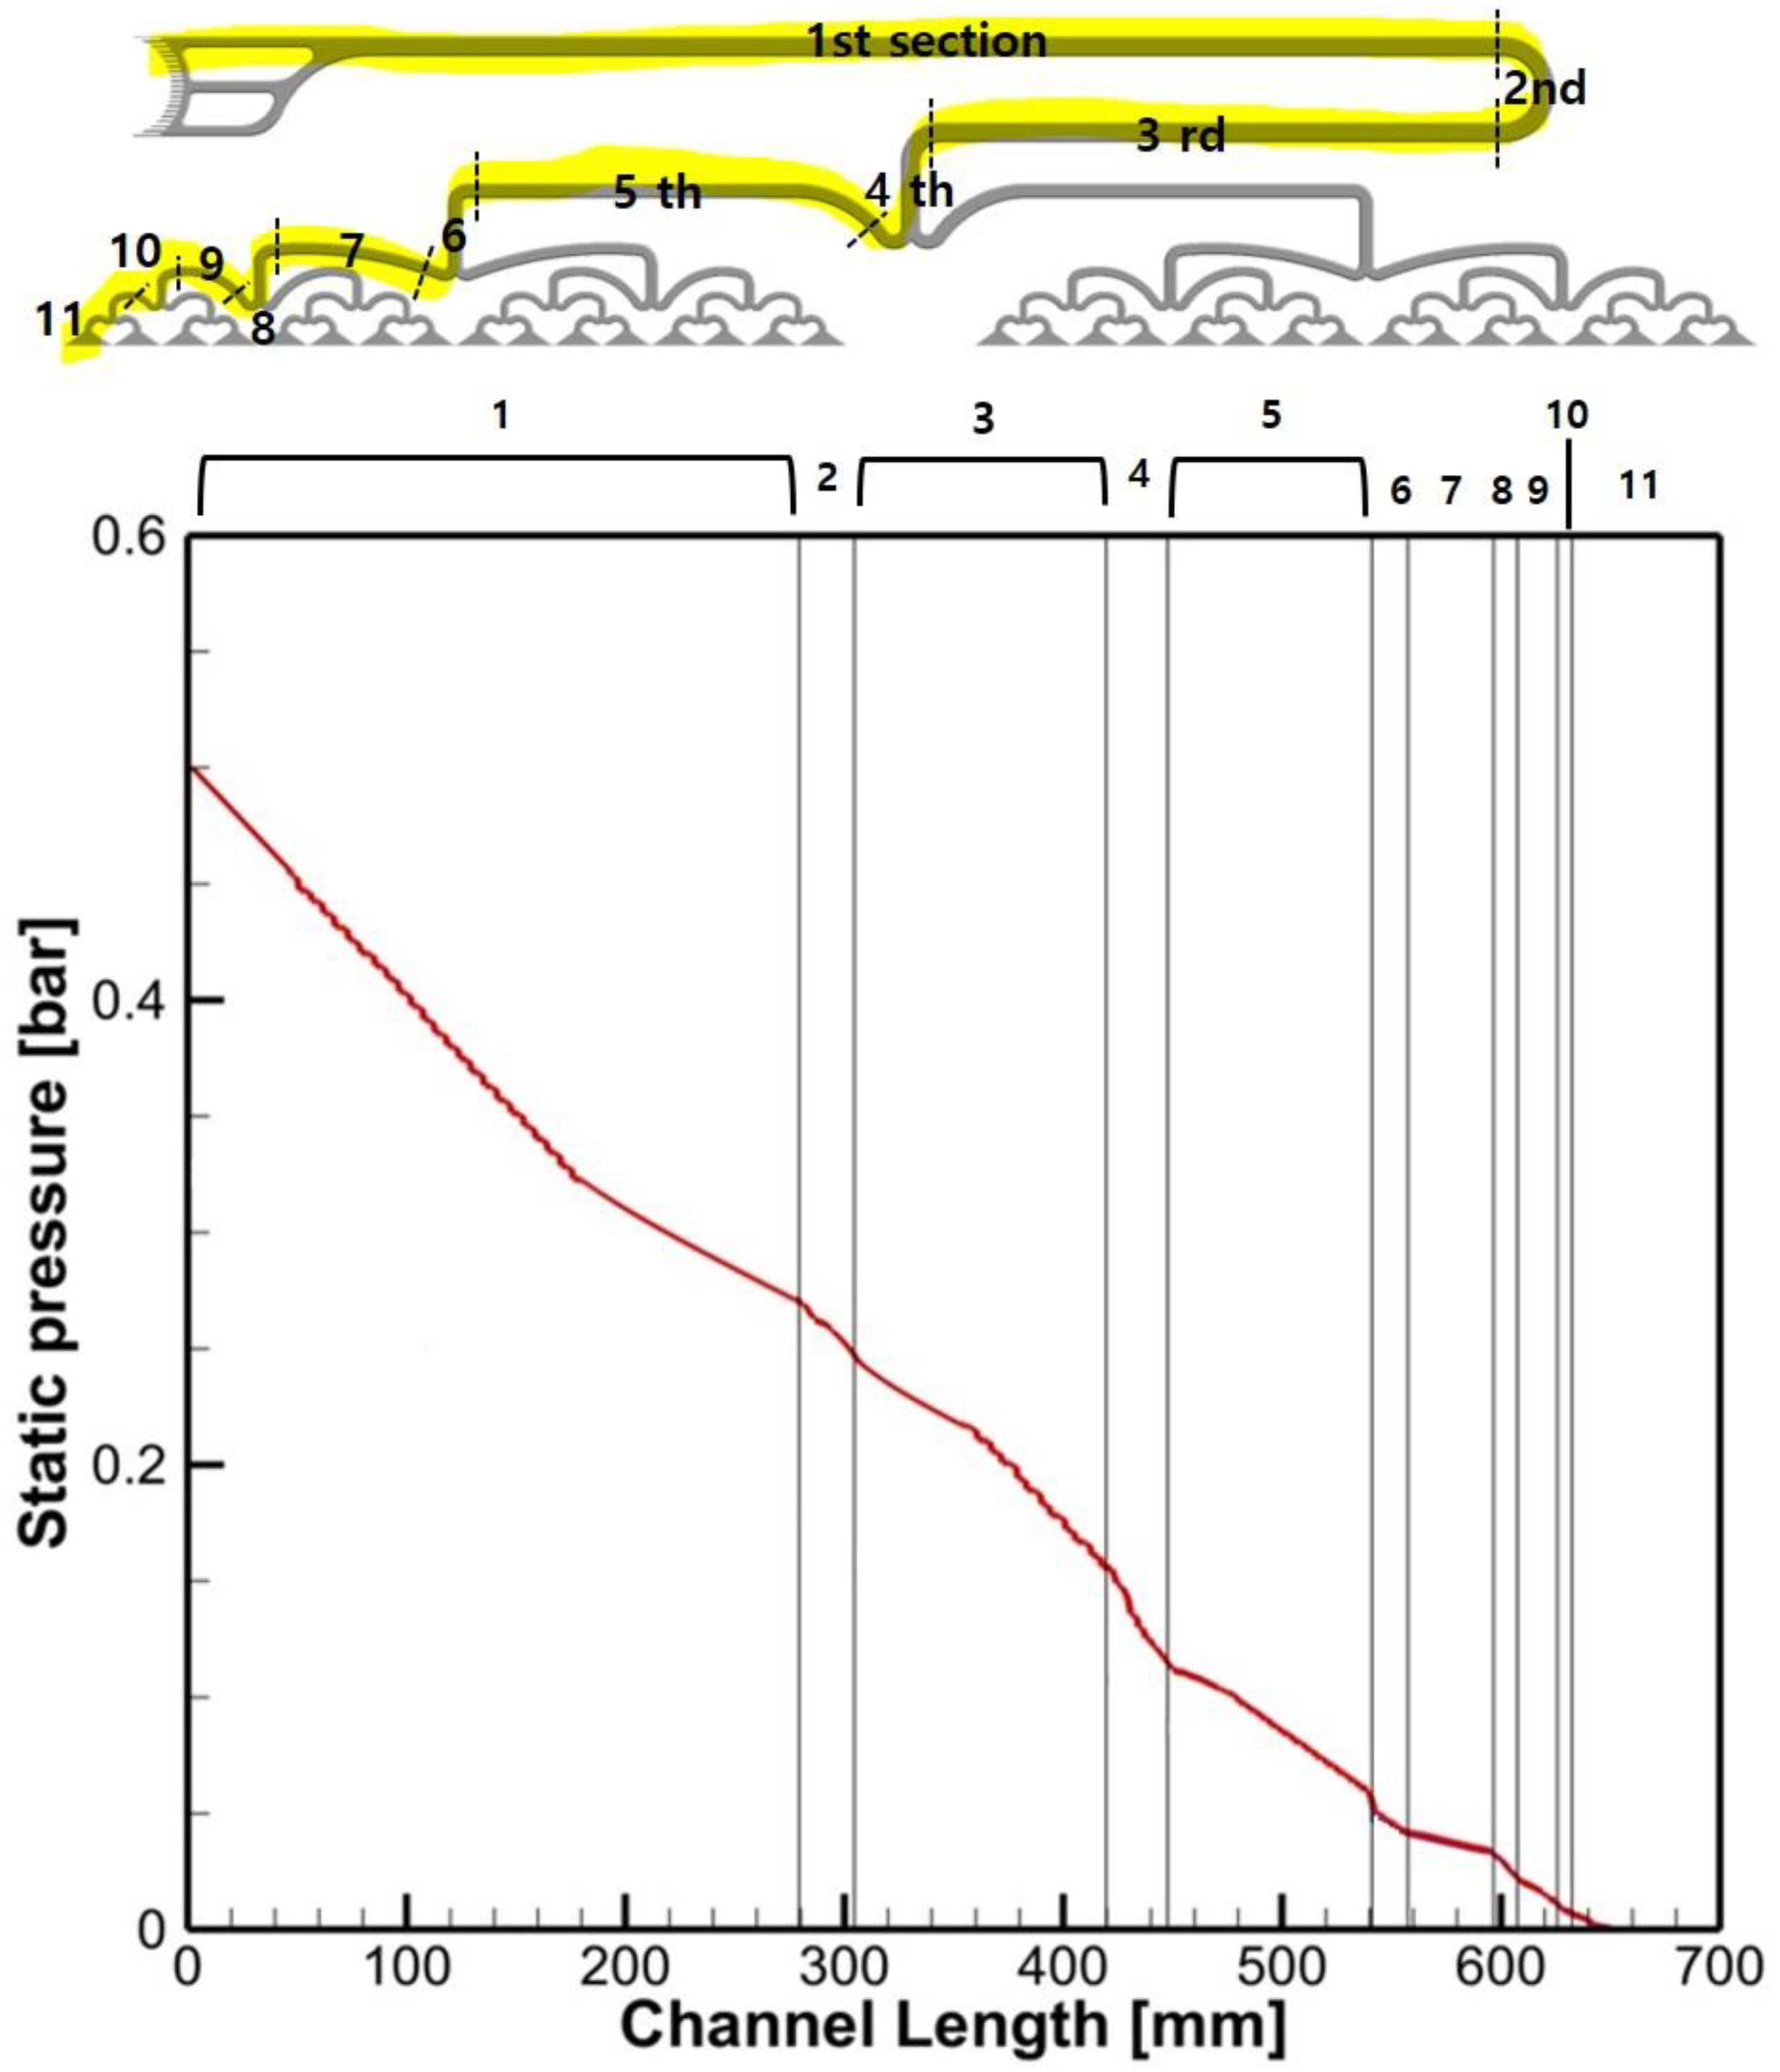
3.1.1. Comparison of Pressure Drop with Experimental Results

The experimental results on the pressure drop of the RFB single cell for various flow rates were compared with those of the numerical analysis to verify the currently used code. In the numerical analysis, the pressure drop curves were derived based on the analysis results for the flow rates of 0.3, 0.4, 0.6, and 0.8 LPM. Figure 6 shows the experimental and numerical results, wherein both results are in good agreement, as the maximum error is approximately 5.5%.

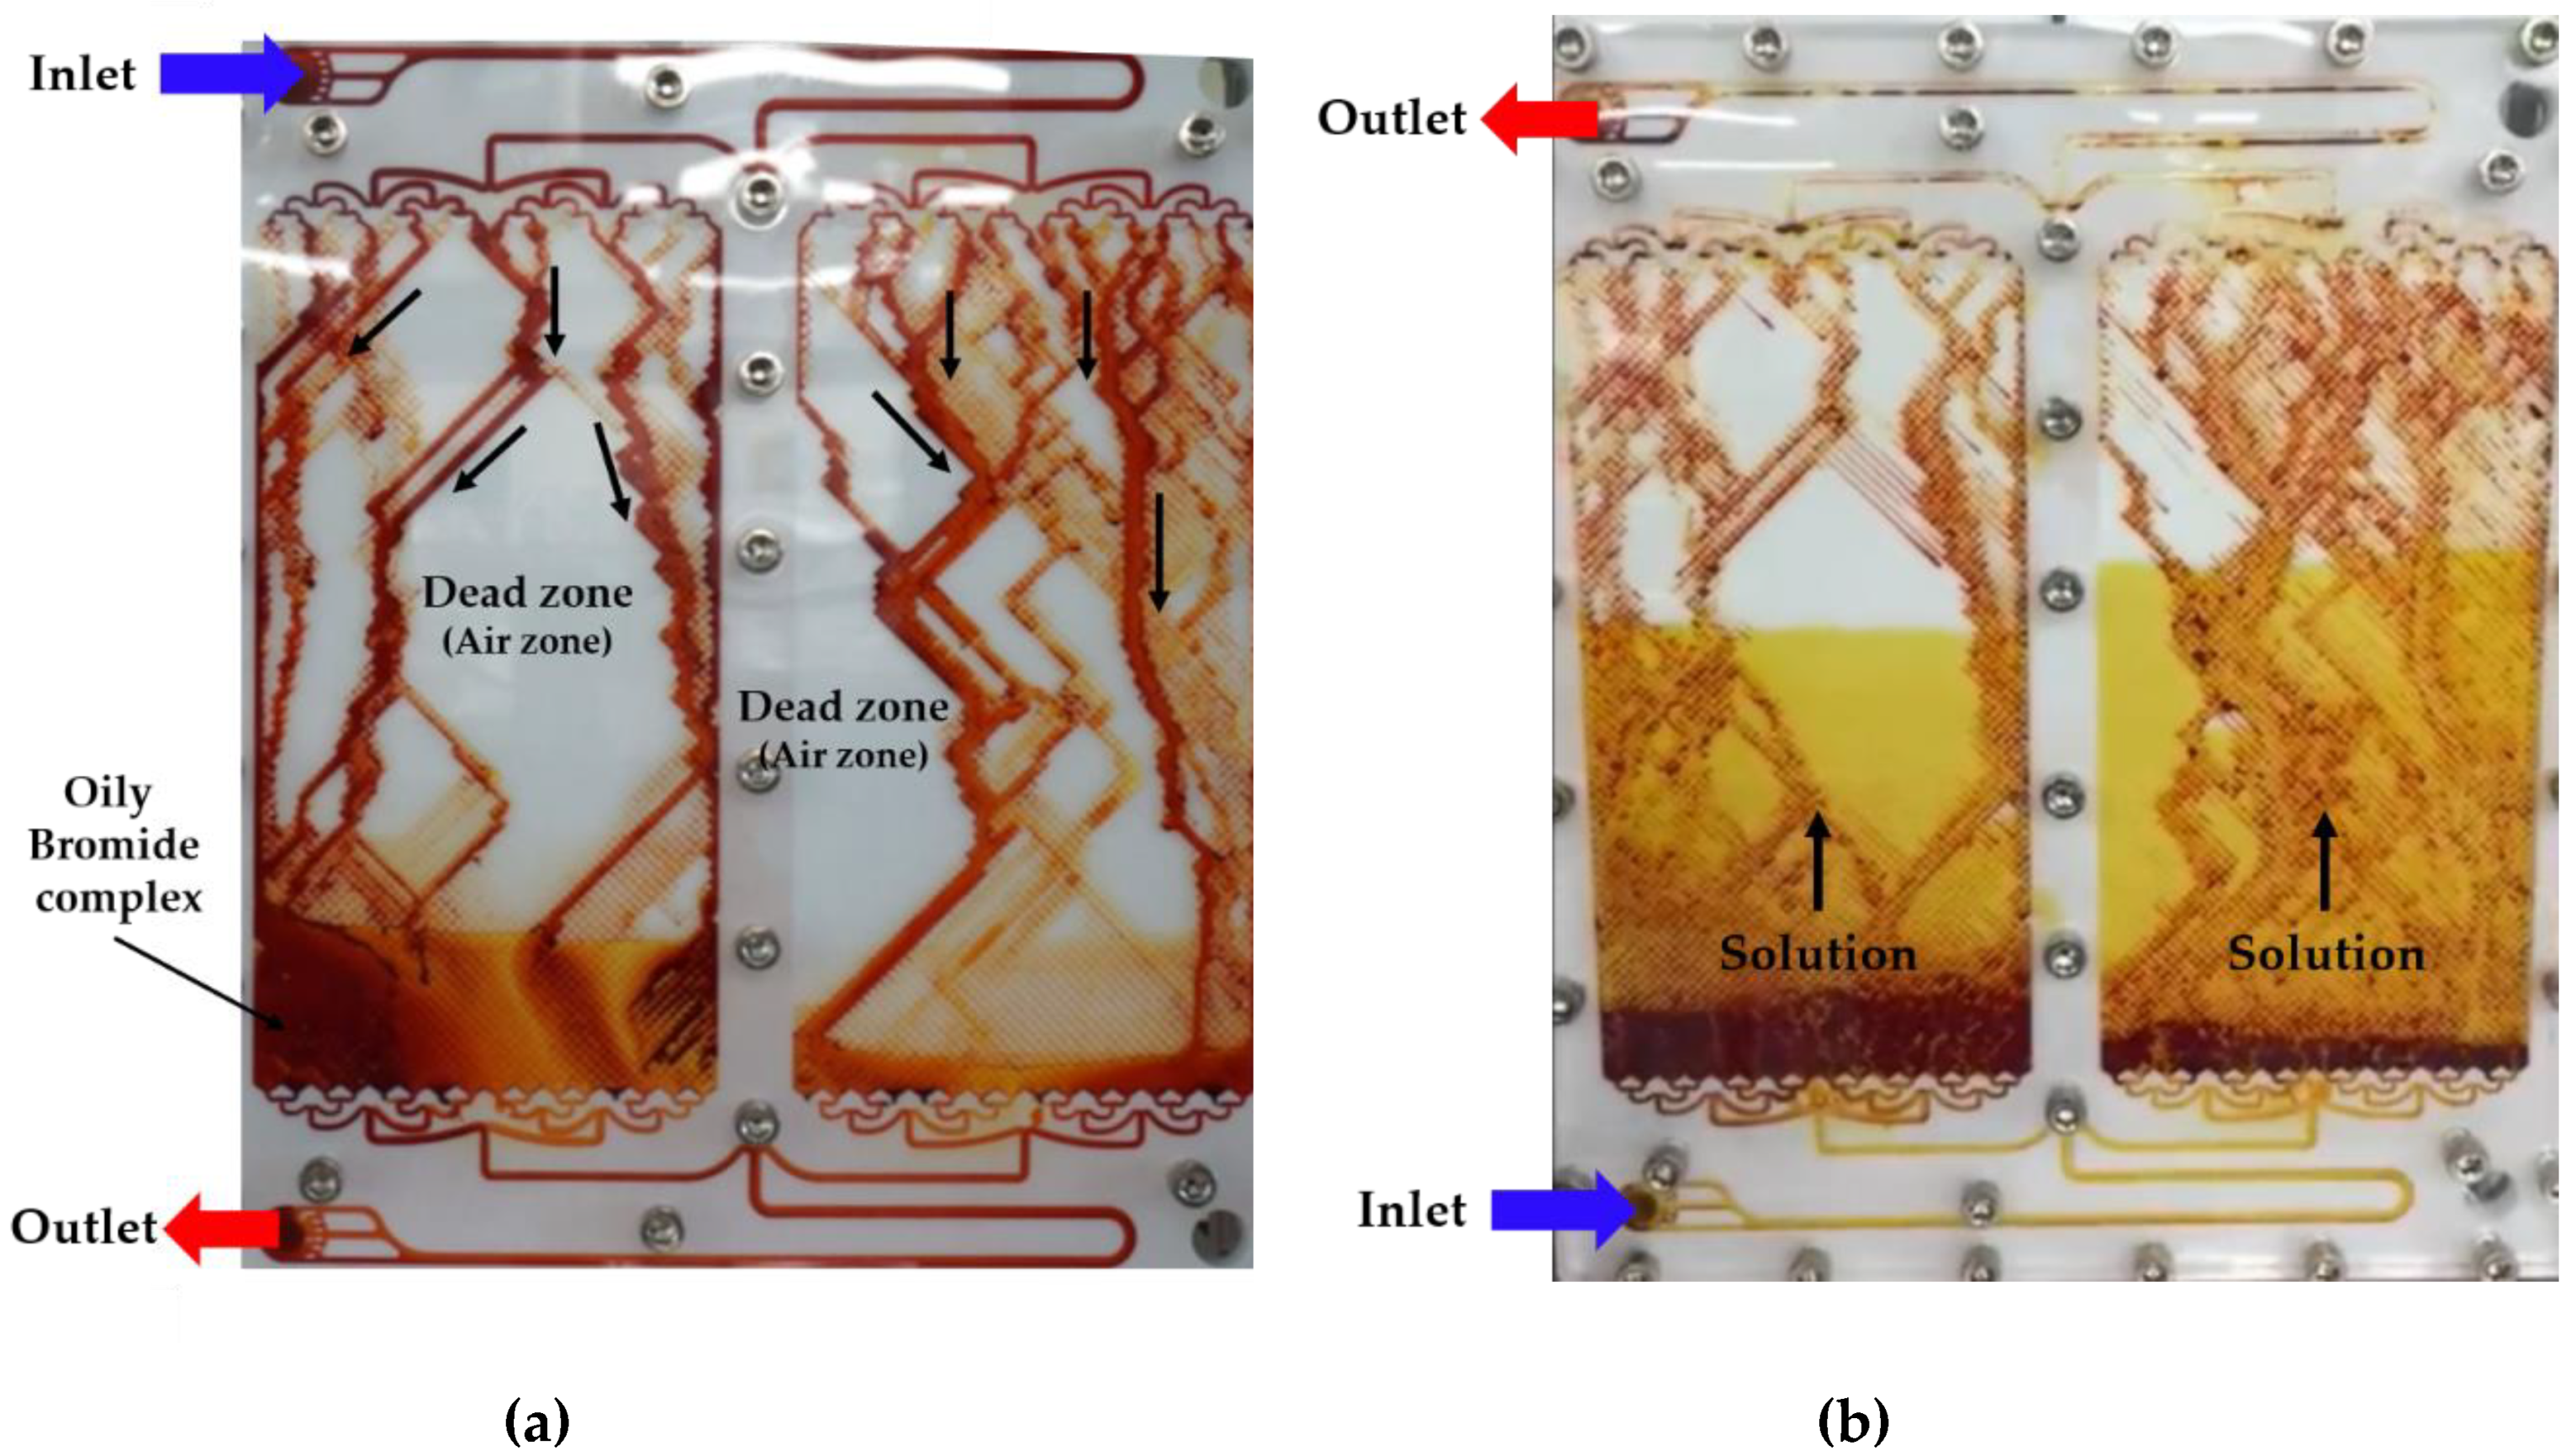
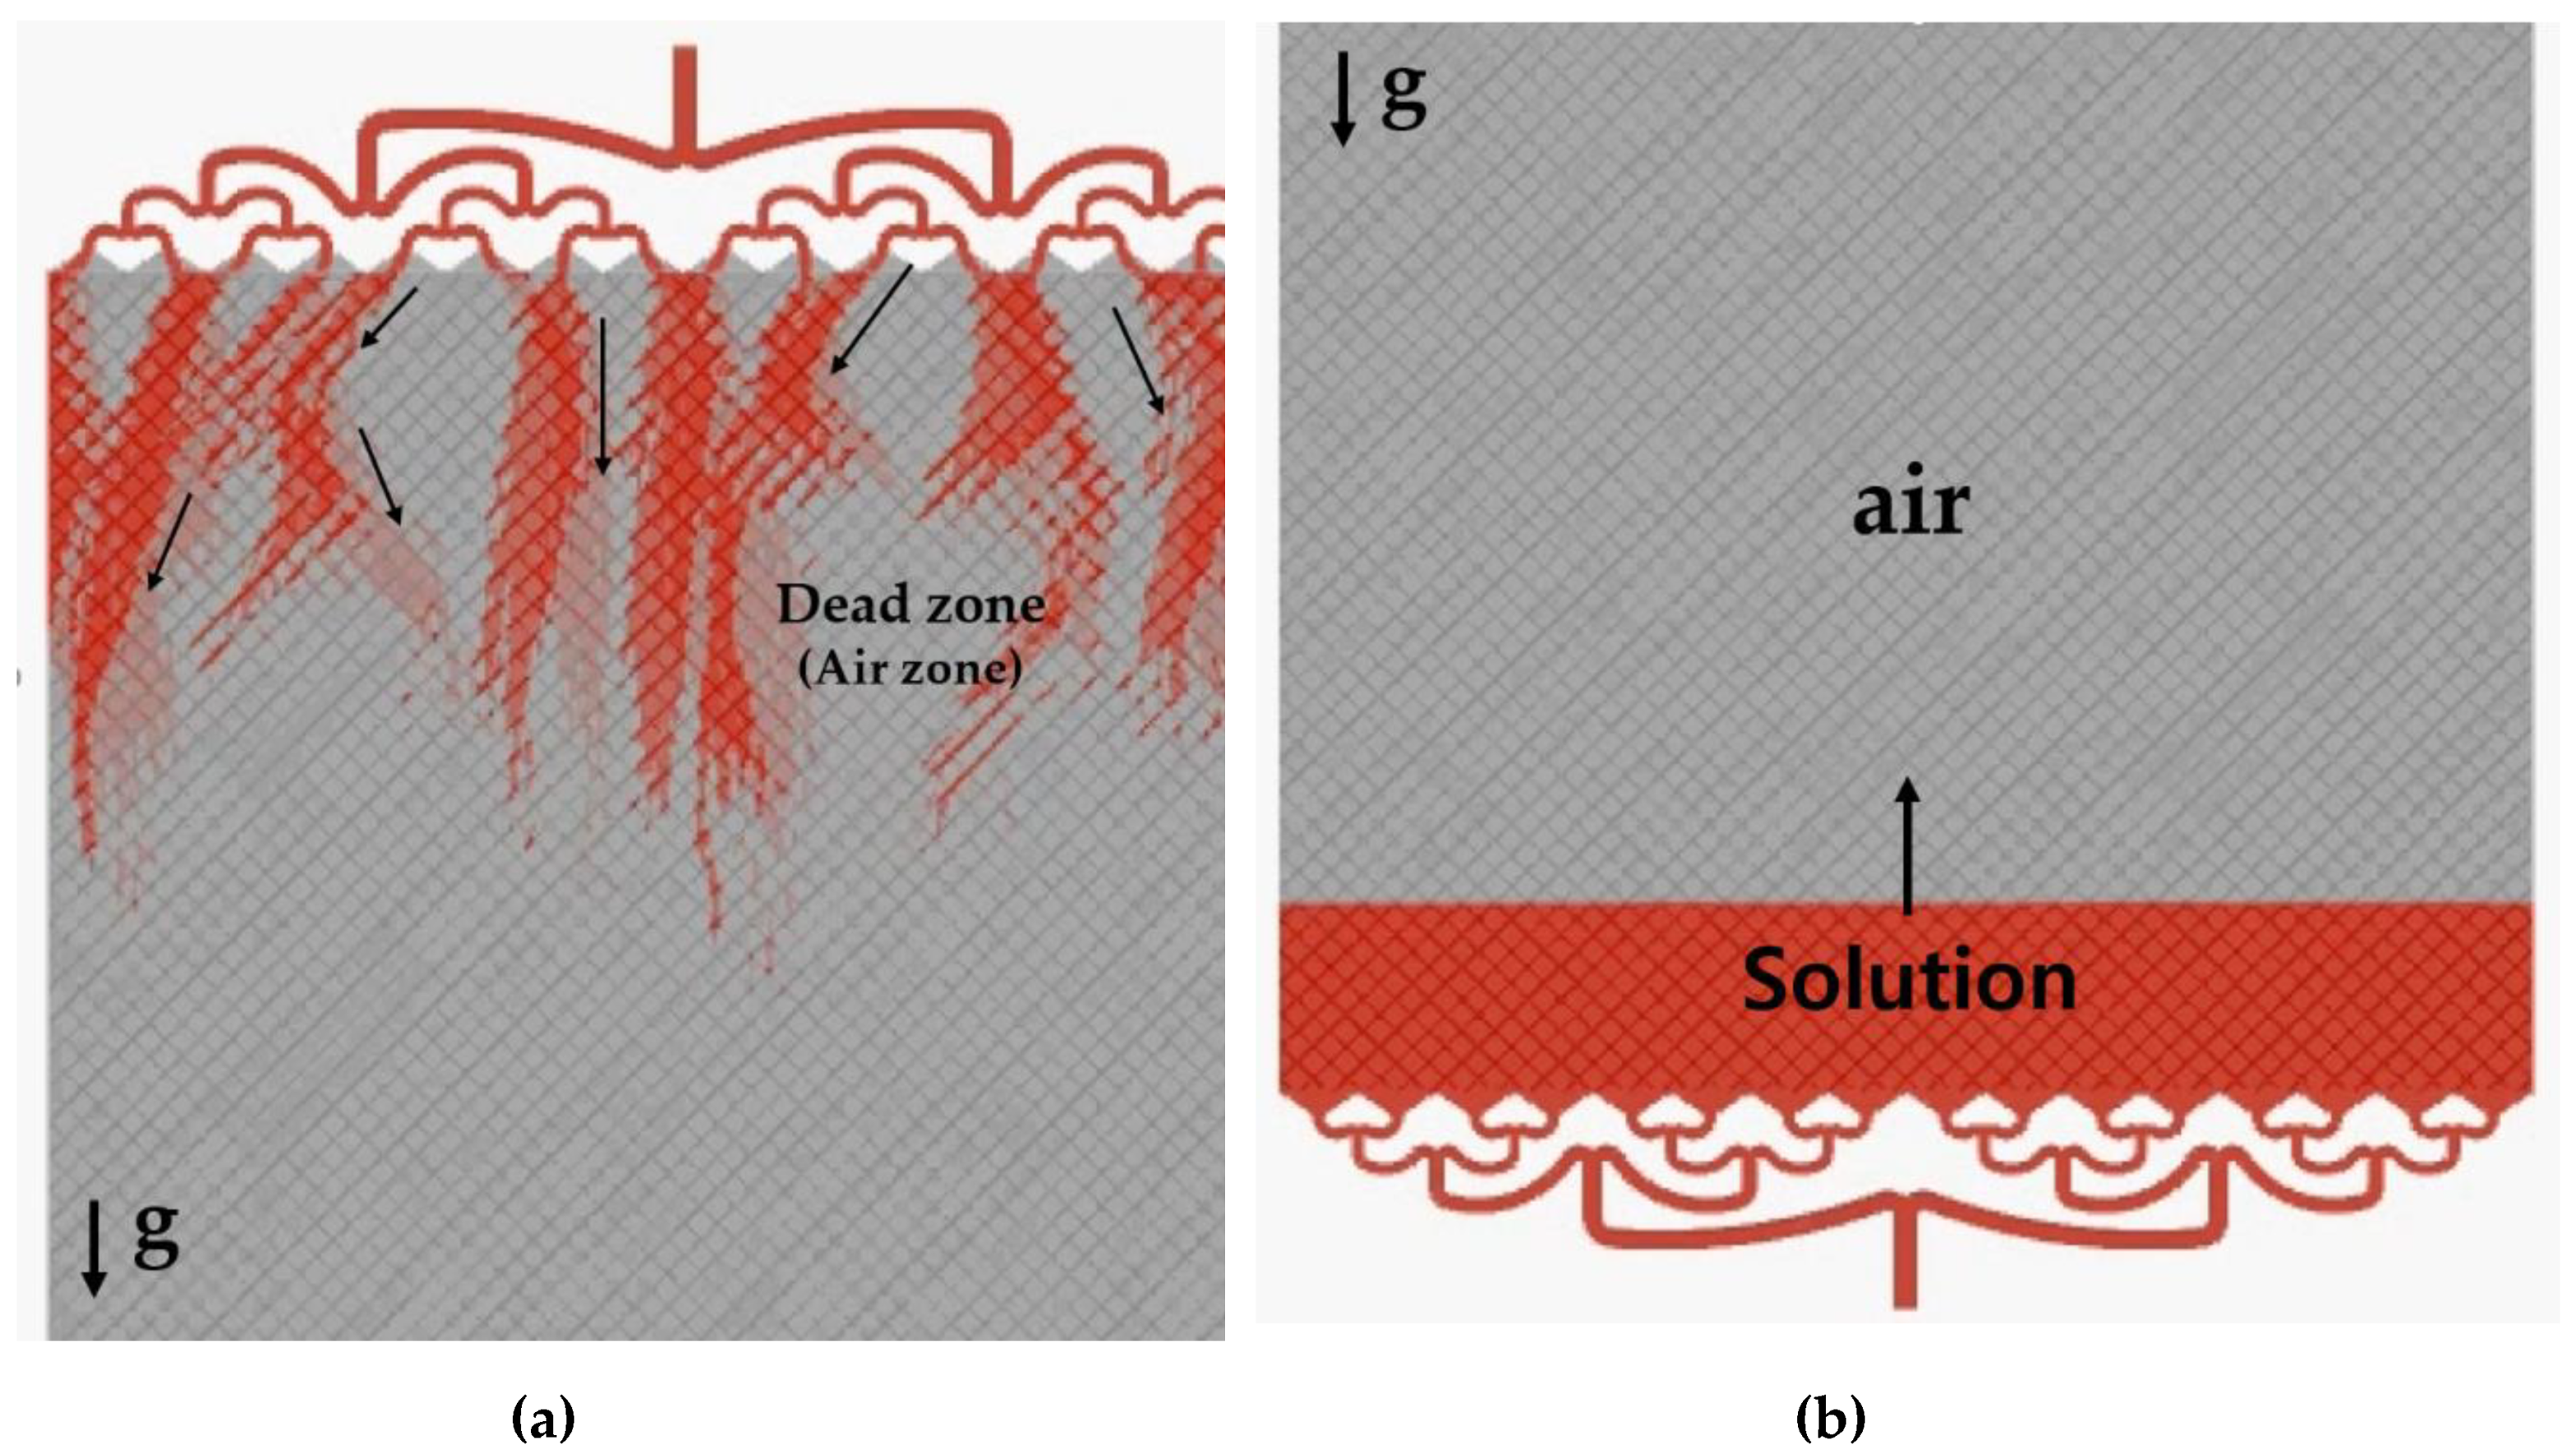
3.1.2. Comparison of Flow Pattern through Flow Visualization

Through the flow visualization experiment on the single RFB cell, we investigated the flow characteristics according to the direction of gravity, and compared the results with the numerical analysis. In the case of an inflow from the top, the electrolytic solution entered from the channel at the top of the RFB, flowed through the electrode, and was discharged into the outlet channel at the bottom of the RFB (Figure 7a); however, the air in the electrode remained inside. Because of the difference in density between the solution and air, light air cannot escape upward and becomes trapped.
In addition, the oily bromide complex settled in the bifurcations of the channel, clogging the flow paths; this reduced the active surface area by hindering the flow of the electrolyte, and forming dead zones. However, in the case of the flow from the bottom, dead zones were not generated as the electrolyte fills the electrode (Figure 7b). The orange lines shown in Figure 7b are the traces left by the experiment, shown in Figure 7a. In this case, a dead zone did not form, because the solution was filled from the bottom and the internal air was pushed out. However, the oily bromide complex settled at the bottom and interfered with the flow.
A numerical analysis was conducted under the same conditions as those of the experiment, so as to verify these flow characteristics. The VOF model [16] was used to analyze the flow characteristics, including the influence of the air layer, and an unsteady flow analysis was performed considering gravity; the VOF model was mainly used for tracking the phases between the phases for an incompressible multiphase flow. The numerical results show that dead zones were generated, owing to the influence of the air layer in the case of the inflow from the top (Figure 8a); this result agrees with Figure 7a. In the case of an inflow from the bottom, the calculated flow characteristics matched the experimental results (Figure 7b and Figure 8b).
Additionally, we studied the horizontal inflow to characterize the settlement of the bromide complex due to the gravitational field in the experiments performed under the top and bottom inflow. The flow characteristics resembled the bottom inflow experiment. However, the charge/discharge experiment showed that the energy efficiency increased by up to 3% compared with that of the bottom inflow case (Table 4). Based on these results, the horizontal inflow, which was less affected by gravity, increased the system efficiency.

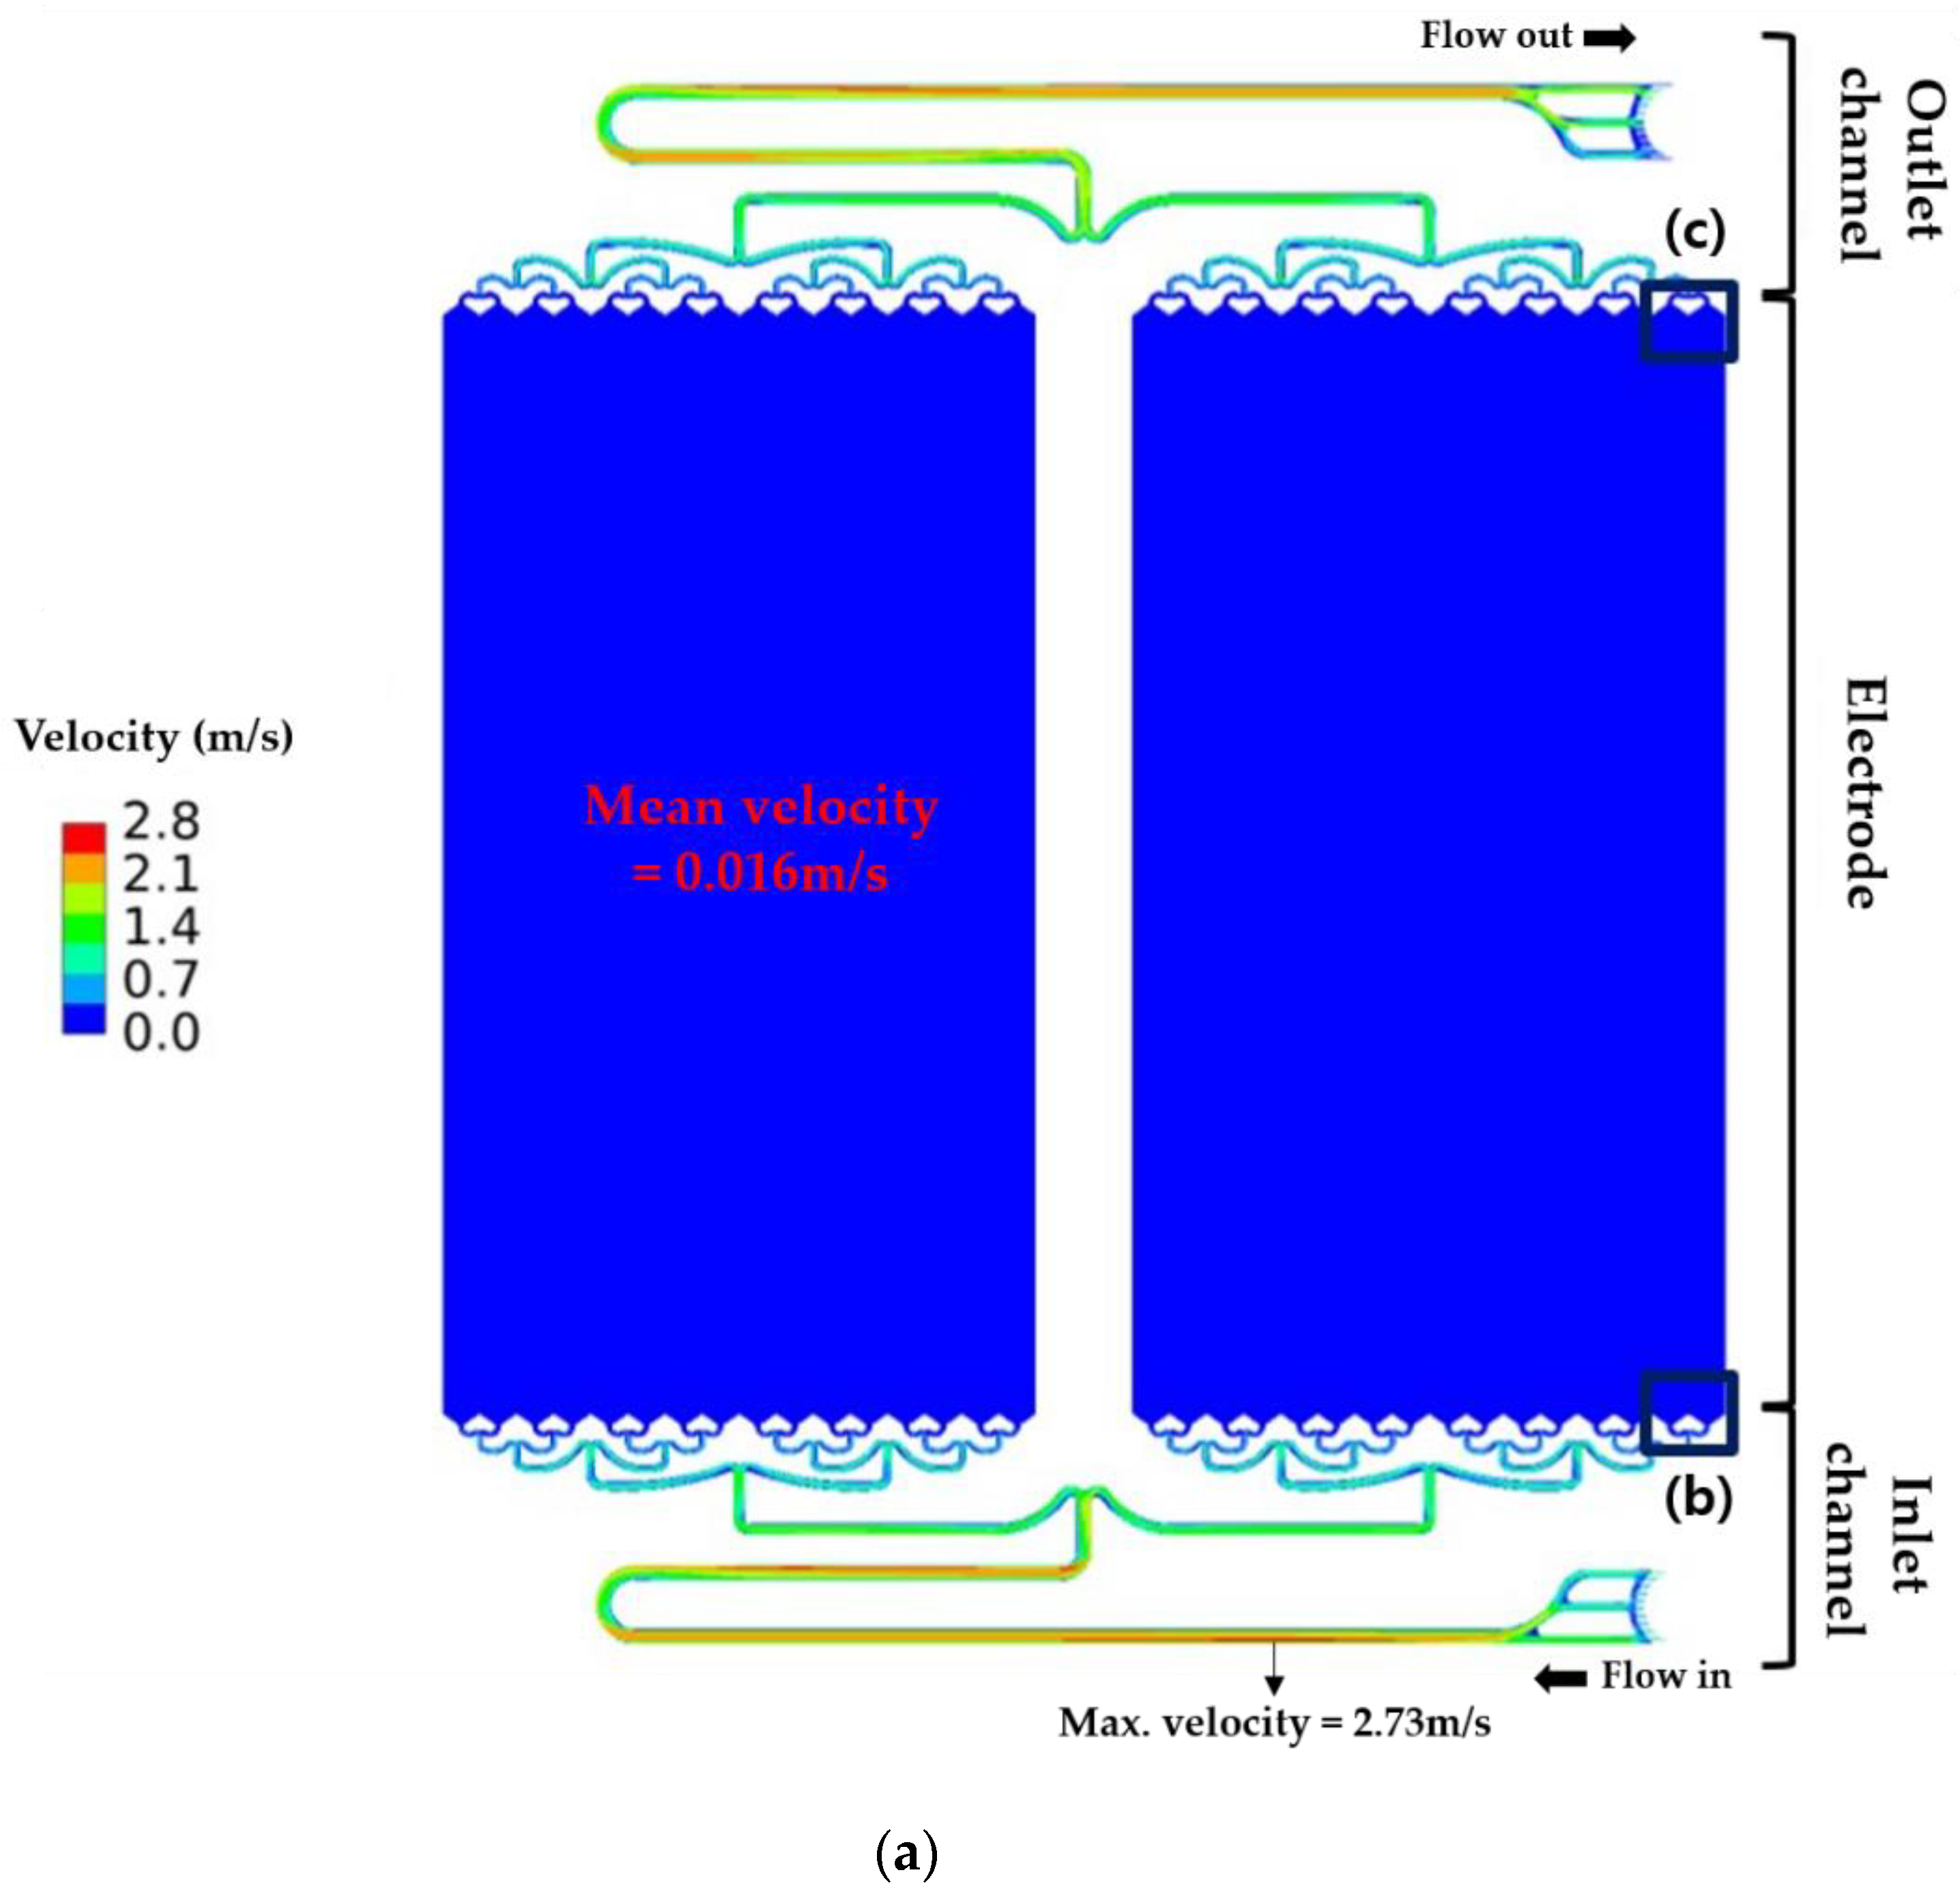
3.2. Flow Characteristics of a Conventional RFB Frame Cell

The flow characteristics of the basic RFB designed by Nathan et al. [17] were analyzed using CFD (Figure 9). Figure 9a shows the velocity distribution of the whole RFB. The maximum flow velocity in the channels was 2.73 m/s, and the mean velocity in the electrode was 0.016 m/s. When the diverging section from the inlet channel to the electrode and the converging section from the electrode to the outlet channel were magnified, the electrode inlet section (Figure 9b) exhibited a higher flow nonuniformity than the electrode outlet section (Figure 9c). When the variability range coefficient ( R i ) was calculated for this section, the electrode inlet (y = −148 mm) exhibited the highest value ( R i = 0.189   m / s ). As the measurement position moves up, the flow nonuniformity decreases, owing to the porous medium characteristics of the electrode (Figure 10).
The conventional RFB uses 32 outlets from the electrode, and the flow nonuniformity can be identified by the mass flux difference at each outlet (Figure 11). The mass flux difference at each bifurcation was obtained using the symmetry coefficient ( C s y m ), and the difference between the maximum and minimum flow rates for the 32 outlets was analyzed through the maximum flow rate deviation ( D m ). The maximum flow rate deviation ( D m ) of the electrode inlet was calculated as 17.9%, indicating a high difference in flow rate. For the symmetry coefficient ( C s y m ), the bifurcations in the five stages from the channel inlet to the electrode exhibited average values of 0.4%, 1.35%, 0.55%, 3.85%, and 2.9% (Figure 11). This suggests that flow nonuniformity occurs throughout the entire channel, and the fourth and fifth bifurcations exhibit the severest flow rate differences.
In a conventional RFB, the top and bottom surfaces contain v-shaped chevrons in an alternating pattern, as shown in Figure 12. These chevrons are installed to crush the oily bromide complex and mix it properly with Zn/Br. The CFD analysis shows that the vortices were generated in the cross-section of the flow path with the chevrons (Figure 13); this structure increased the pressure drop. While the pressure drop without chevrons was 0.683 bars, that with chevrons was 0.993 bars, indicating an approximately 45% increase. Figure 14 shows the pressure drops at the several locations of the inlet channel. The first and longest section before the beginning of the of bifurcation exhibited the largest pressure drop.

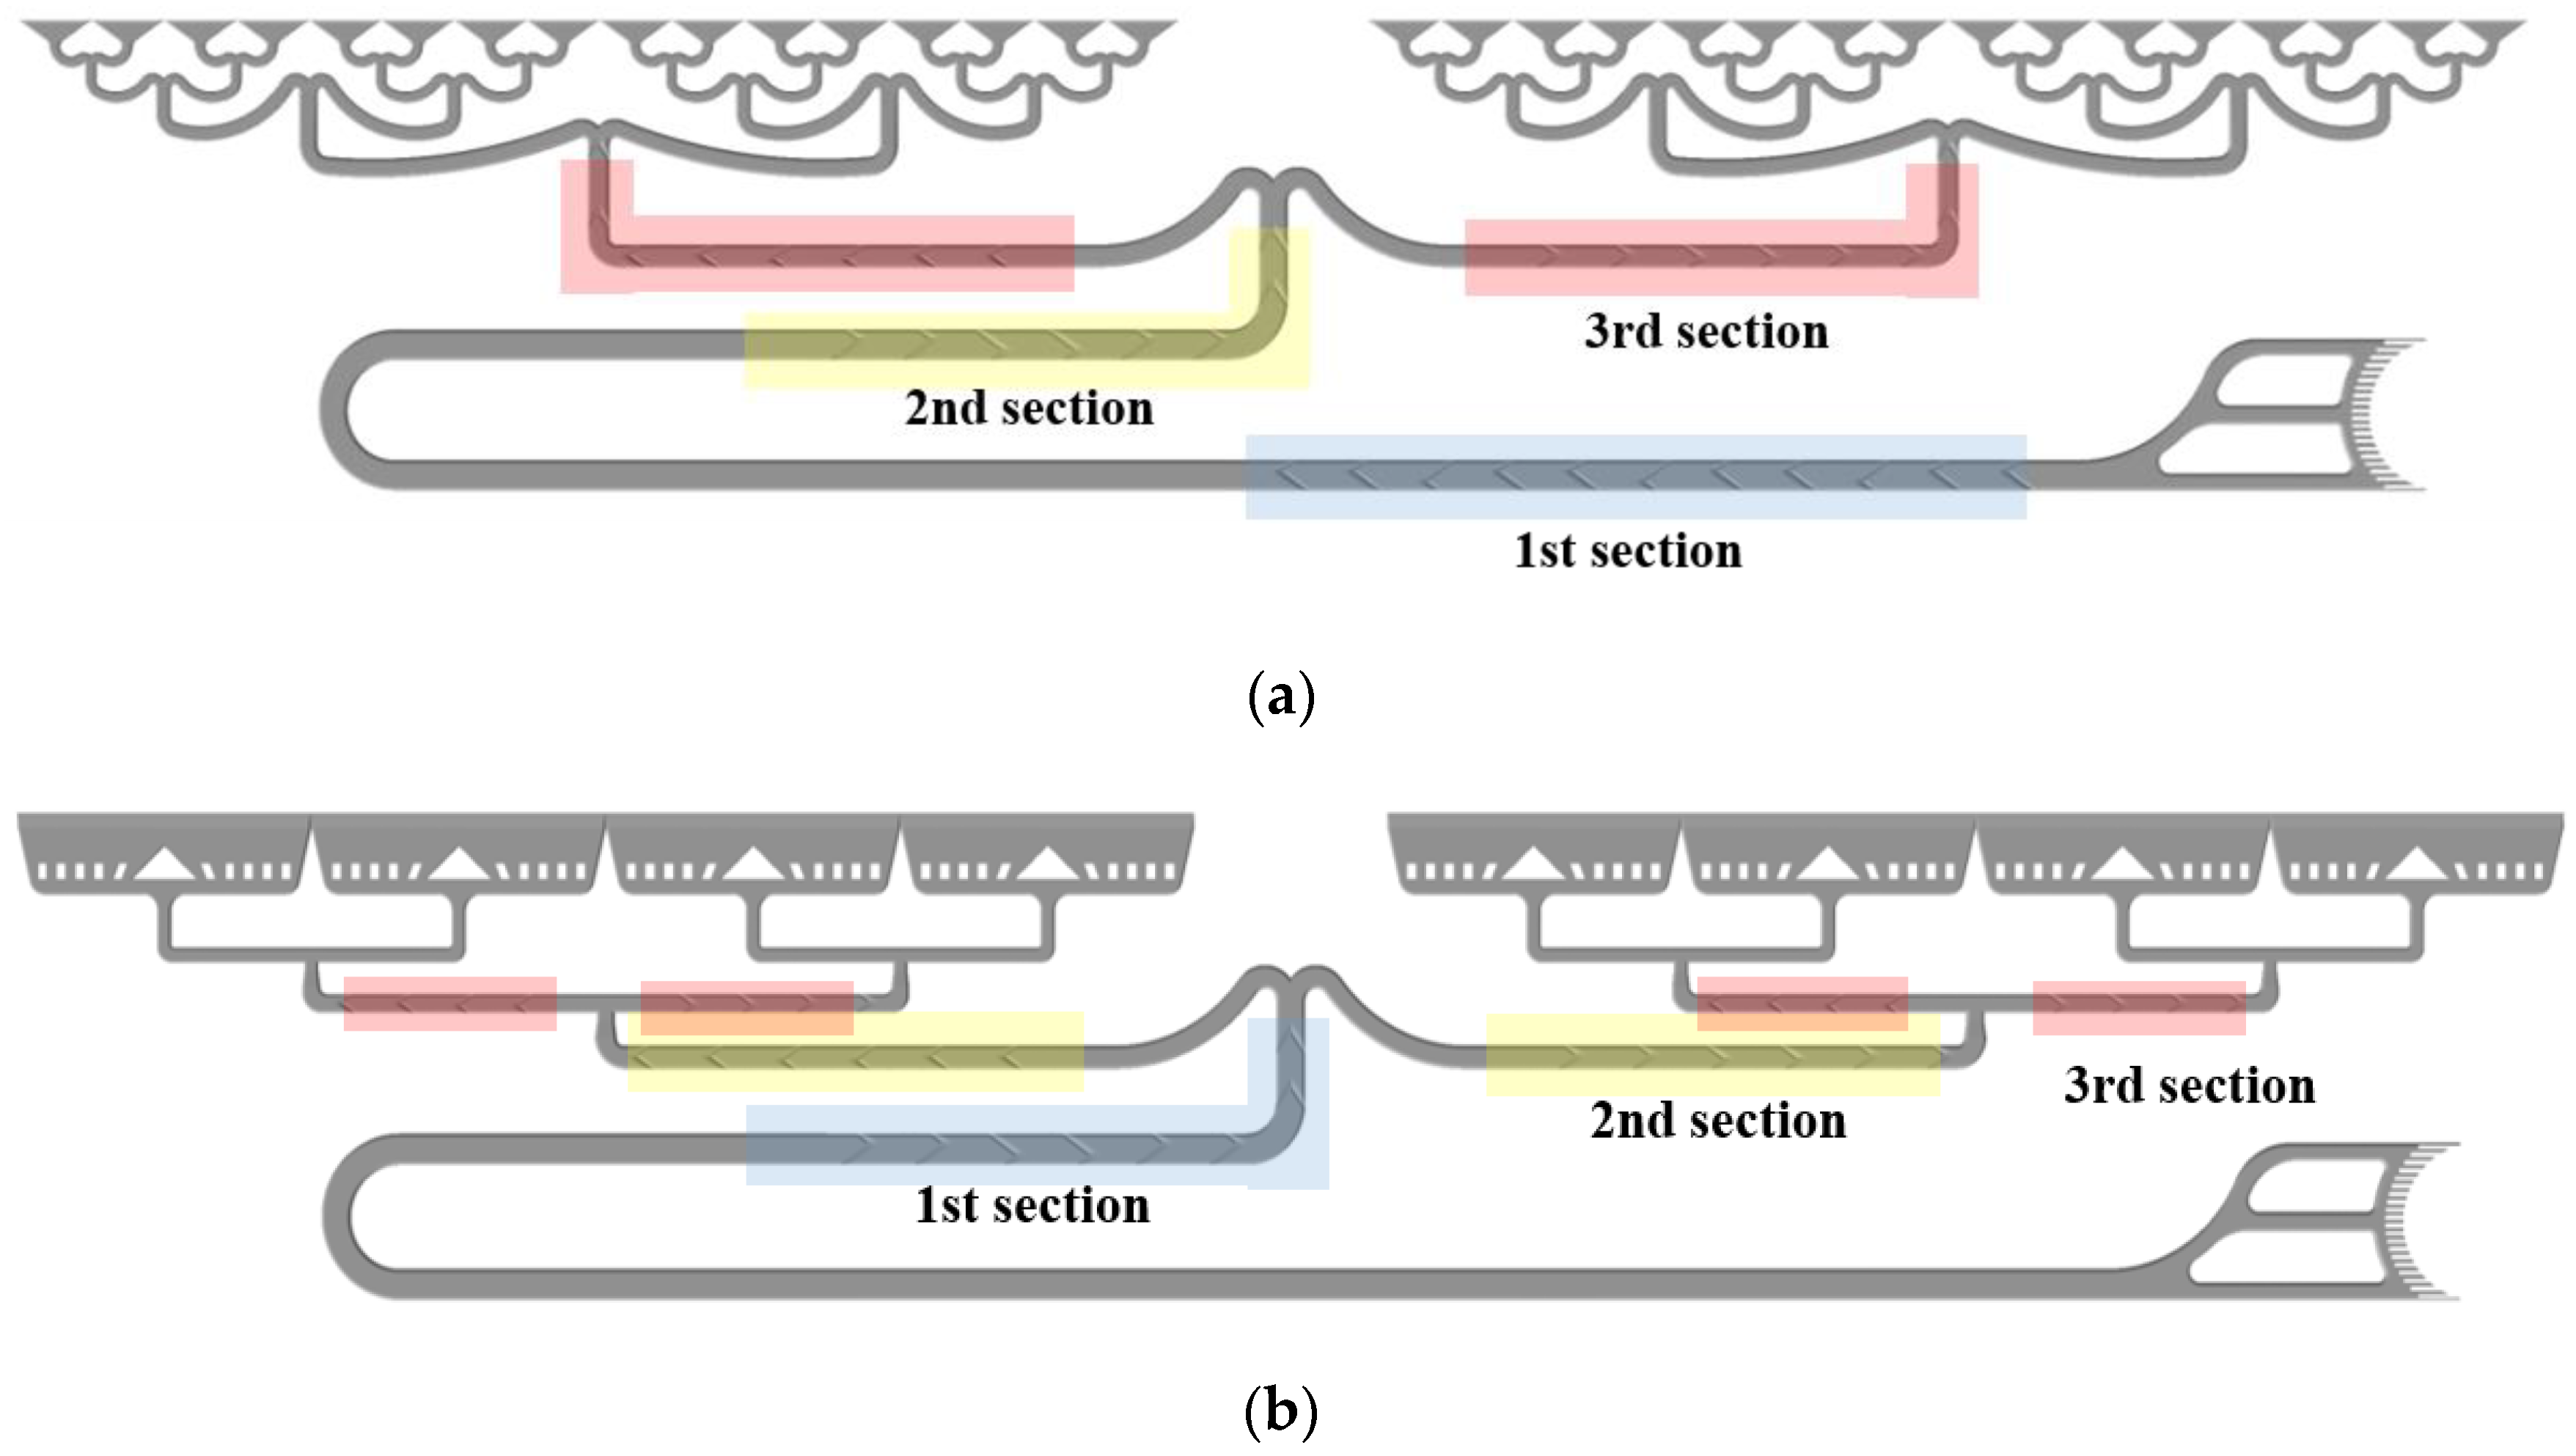
3.3. New RFB Flow Frame Configuration

In the case of the conventional flow frame, owing to the number of bifurcations, the symmetry coefficient ( C s y m ) reached a maximum of 3.8%, and the maximum flow rate deviation ( D m ) of the solution entering the electrode reached 17.9%, as mentioned above. The flow path clogging problem was due to the small diameter and the oily bromide complex, and the chevrons at the inlet channel with the highest velocity increased the pressure drop of the entire flow frame. To address these problems with the conventional frame, the configuration of the flow channel was modified (Figure 15). The curved geometry of the third bifurcation (yellow bifurcation in Figure 10) was removed to solve the flow path clogging problem caused by the settlement of the oily bromide complex; this settlement was observed through previous research (refer to Section 3.2), and the fourth and fifth bifurcations, which exhibited that the highest symmetry coefficient ( C s y m ) were integrated. In addition, square vanes and rectangular outlets were constructed to reduce the nonuniformity of the flow into the electrode. After exiting the square vanes, the Zn/Br solutions formed mixing zones and uniformly entered the electrode.
To solve one potential cause for the increased pressure drop in the conventional frame, the chevrons of the first section (Figure 16a) were moved to the end of the channel (third section; Figure 16b). The number of chevrons remained unchanged (72), so as to minimize the reduction in the mixing effect.

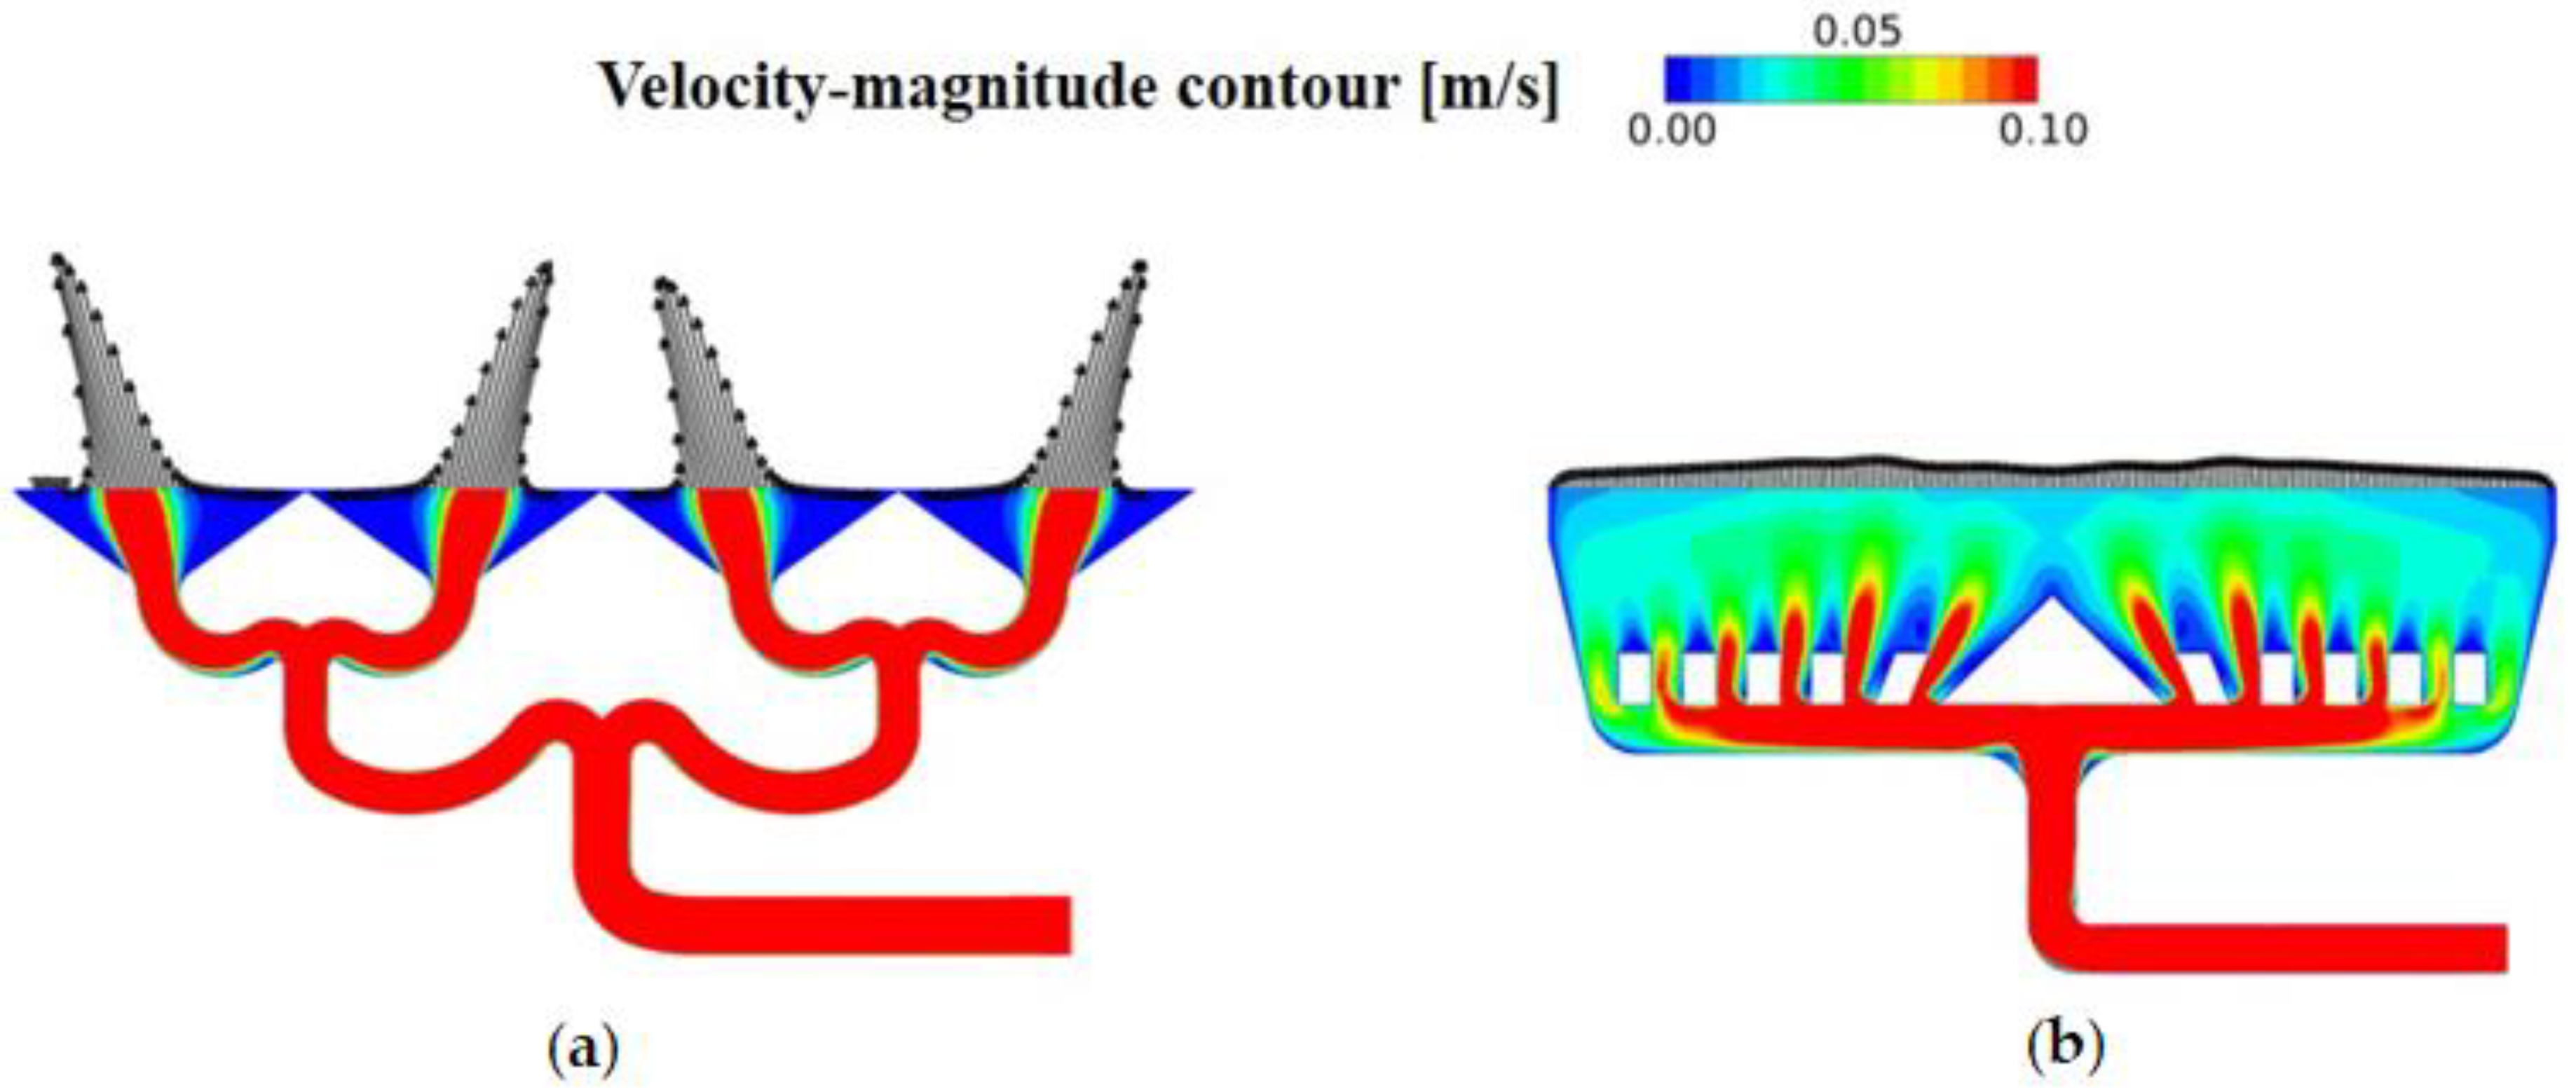
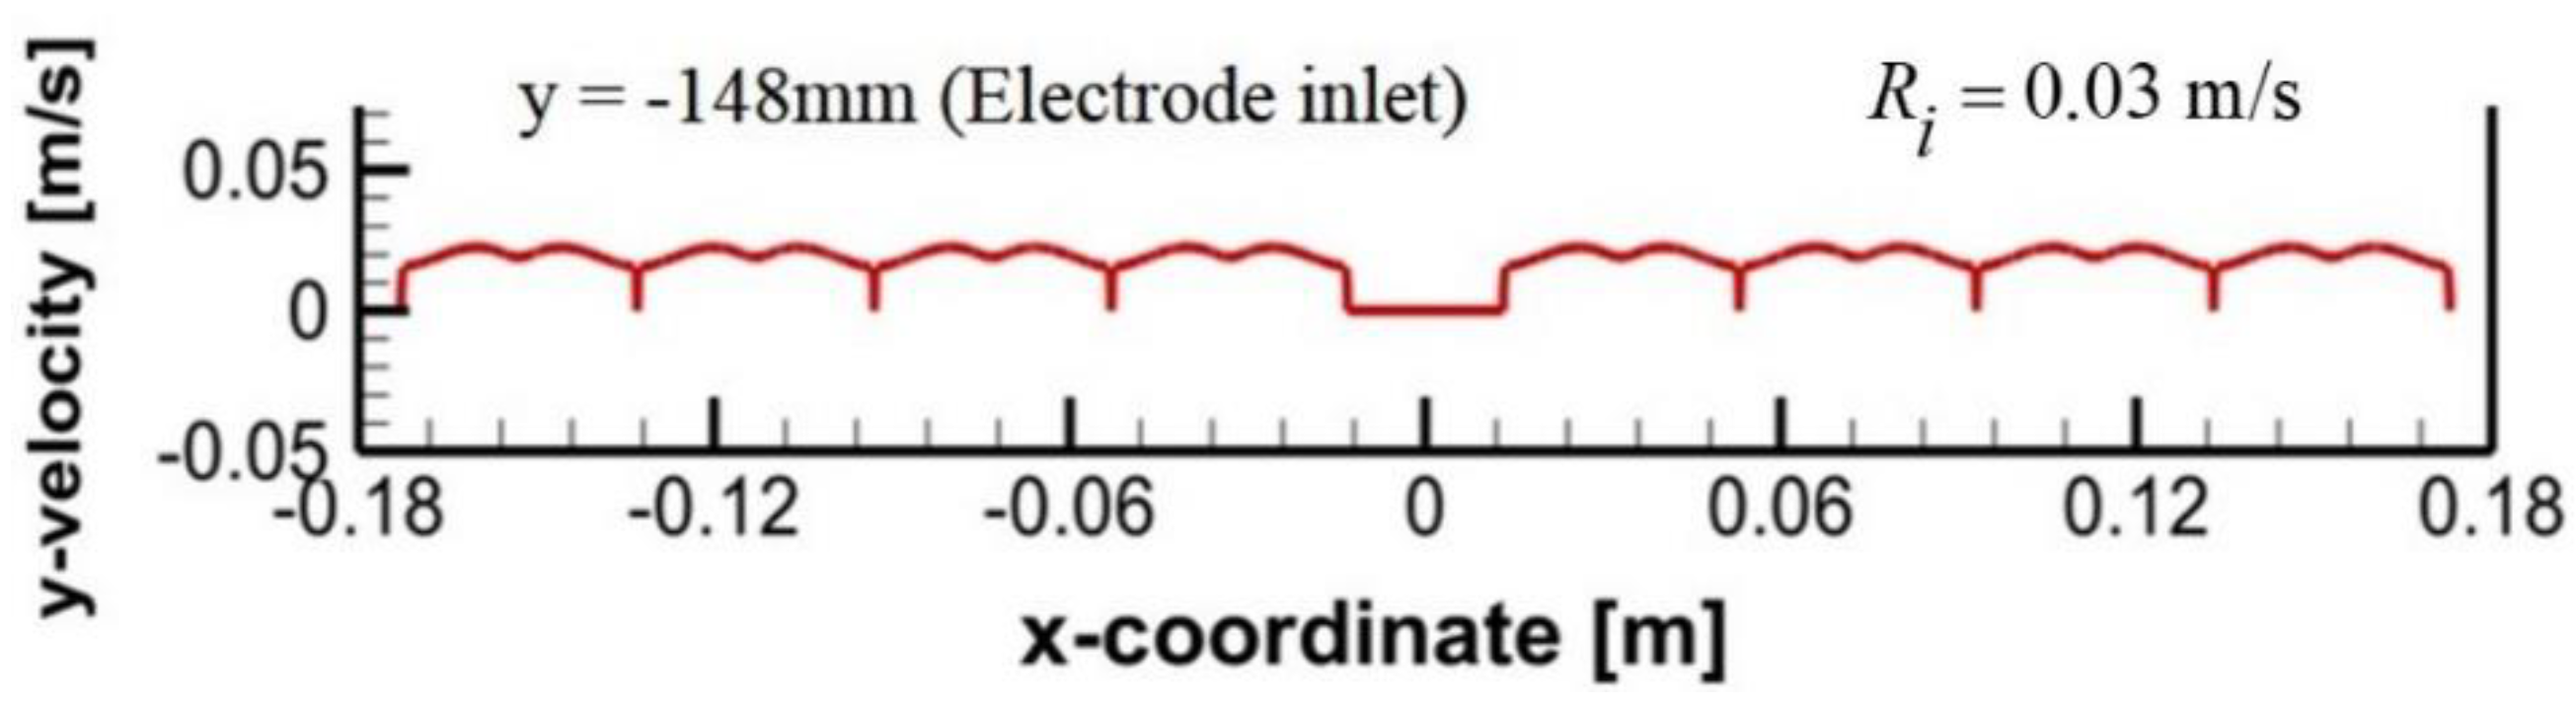
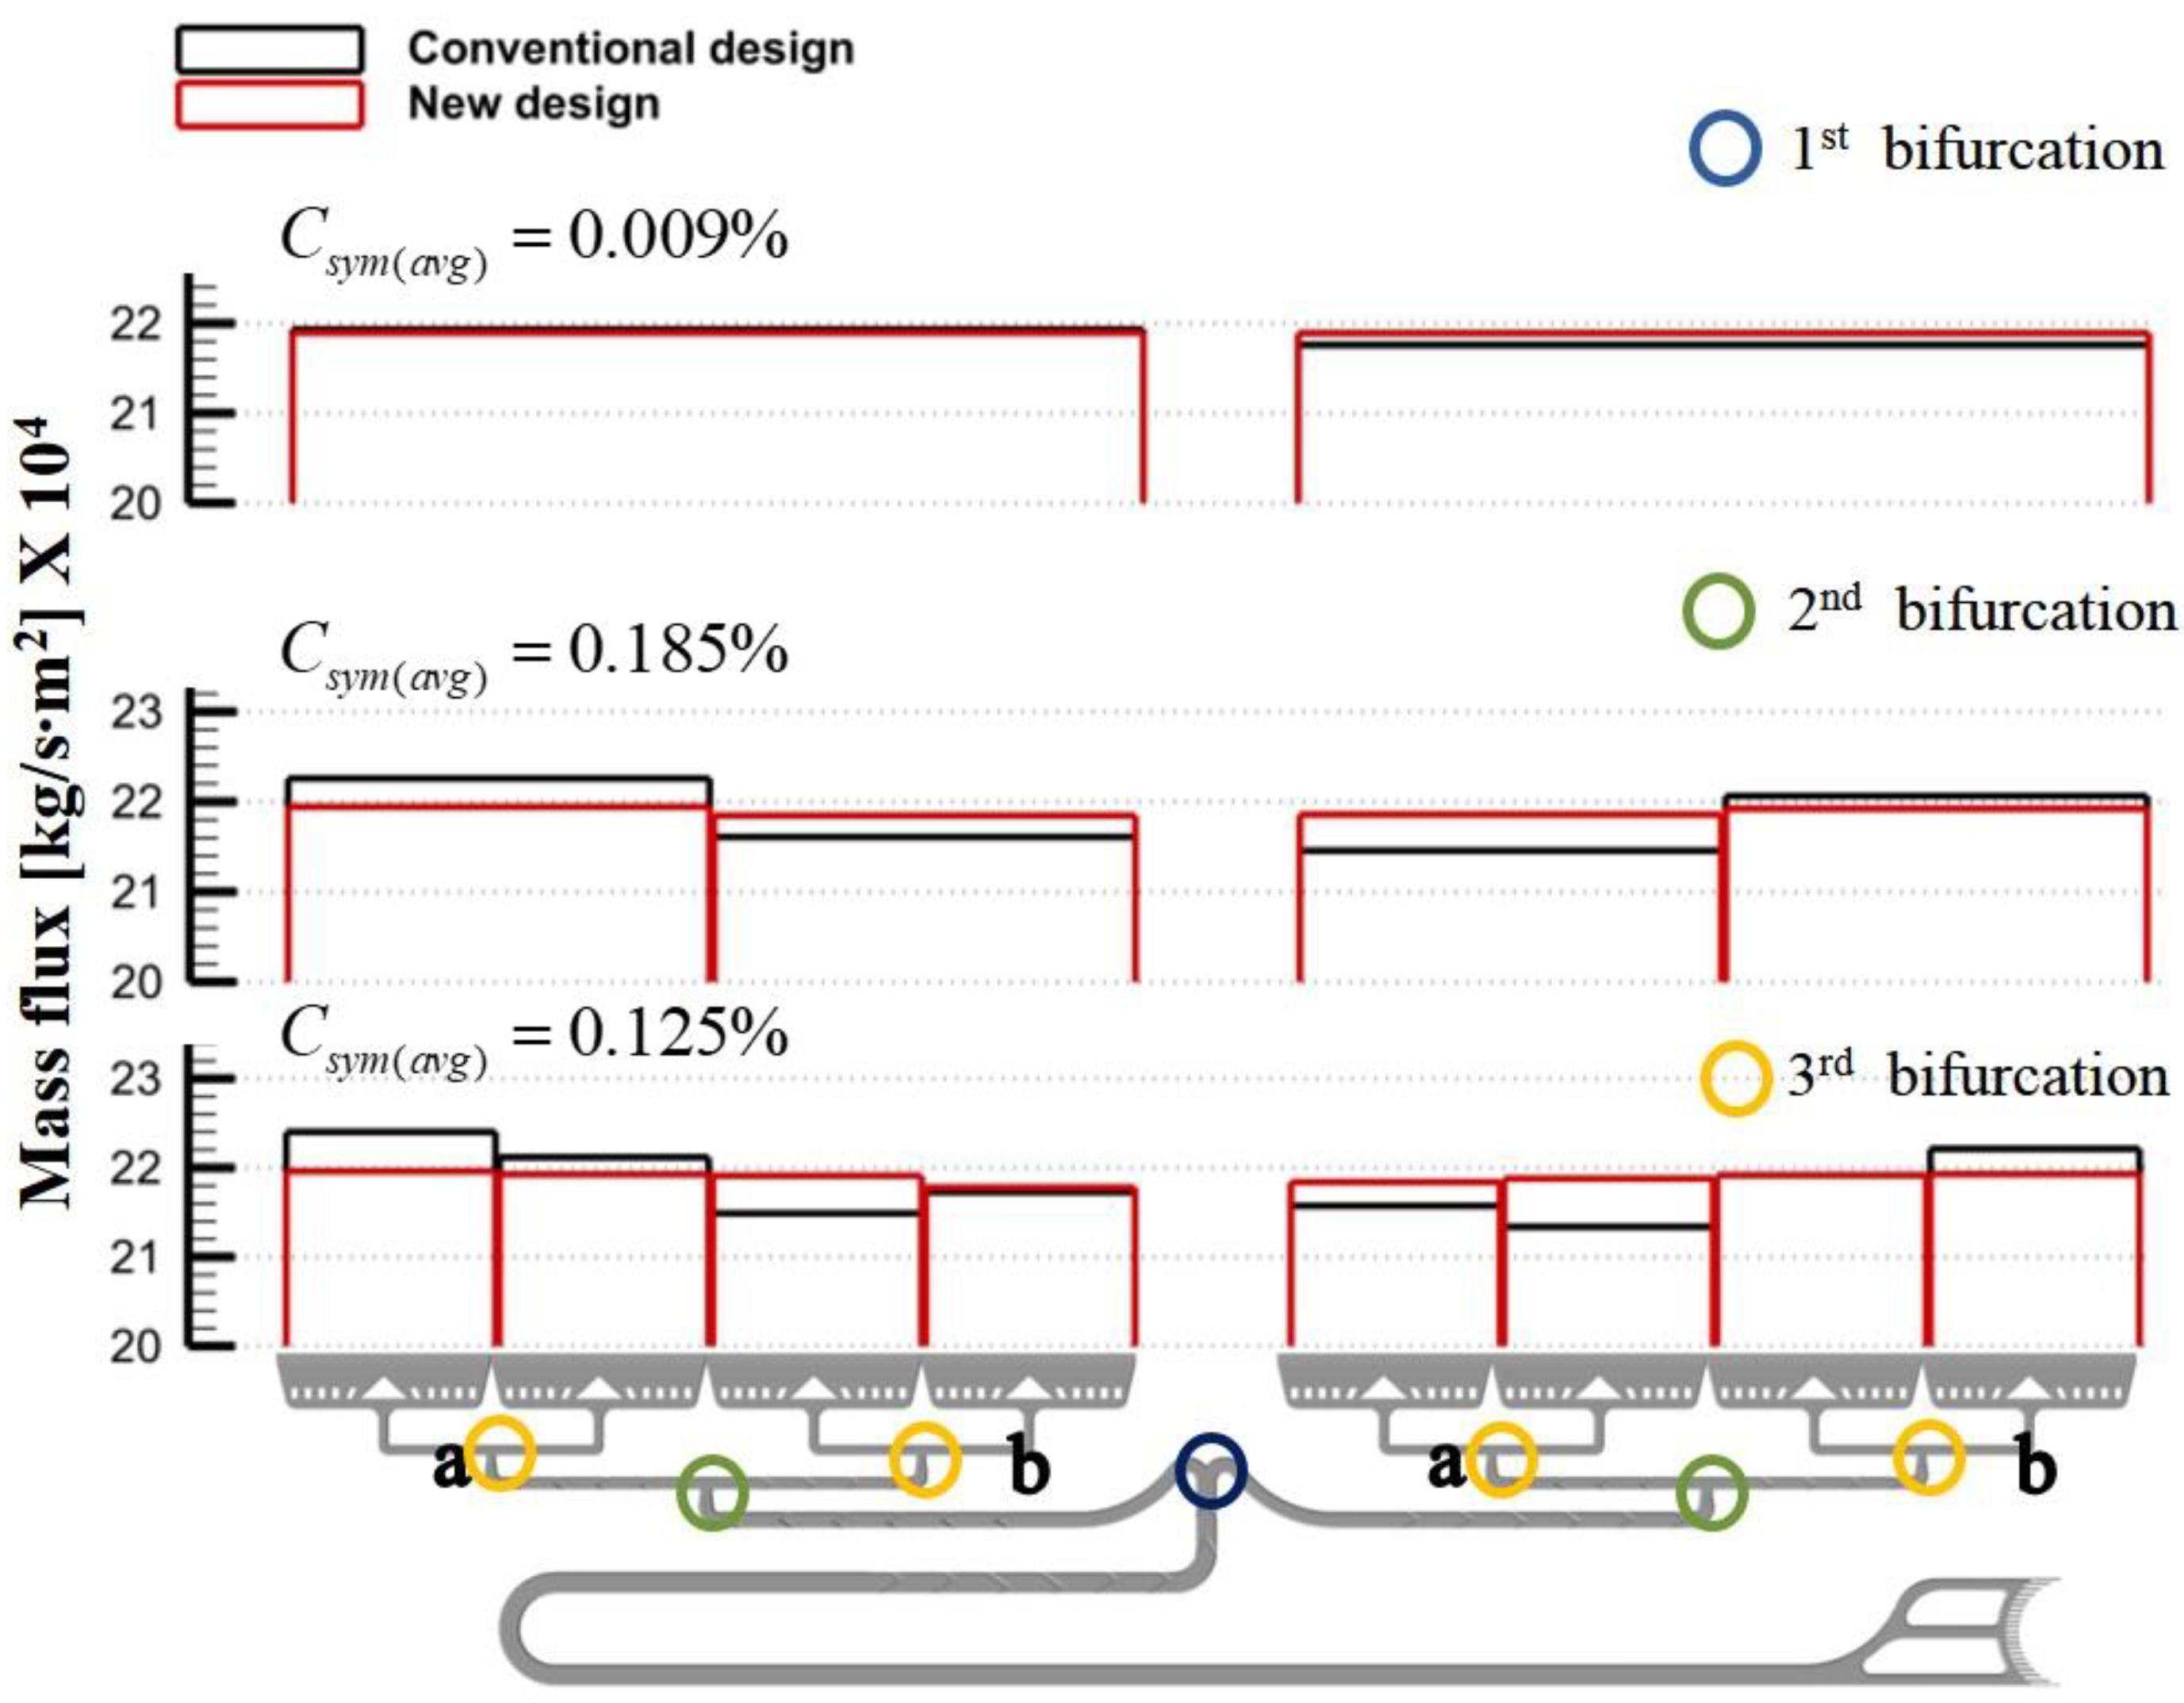
3.4. Flow Characteristics of the New RFB

A numerical analysis of the new configuration (Figure 17b) showed that the flow velocity distribution at the electrode inlet was more uniform than the conventional RFB (Figure 17a). The flow distribution at the electrode inlet indicated that the flow was uniformly distributed (Figure 18). In this uniform flow, the variability range coefficient ( R i ) significantly decreased from 0.189 to 0.030 m/s at the electrode inlet (y = −148 mm). Moreover, the symmetry coefficient ( C s y m ) at each bifurcation improved by less than 1% (Figure 19). The maximum flow rate deviation ( D m ) was 0.66%, which was significantly lower compared with the previous value of 17.9%. This confirms that the flow distribution at the bifurcations and outlets became uniform.
When the pressure drop of the new design was compared with the conventional design, the pressure drop decreased by 15.3% and 11.6% at the inlet and outlet channels, respectively (Table 5). There was a difference in pressure drop, even though the inlet and outlet channels had the same geometry, because the Zn/Br solutions had different flow directions. Consequently, the new design exhibited an average 13.3% reduction in pressure drop for the whole flow frame geometry.

4. Conclusions

In this study, the flow characteristics of the Zn/Br redox flow battery (RFB) were investigated, and a new cell frame configuration was proposed to improve the system efficiency. Additionally, the nonuniformity of the electrolyte entering the electrode was numerically defined by performing a flow analysis for the RFB frame geometry. This helps to improve flow nonuniformity, and thus increase the charge/discharge efficiency. The overall system efficiency was also improved by decreasing the power consumption of the pump through a reduction in pressure drop.
A flow visualization of the conventional RFB indicates that the oily bromide complex causes the flow path clogging problem, and, owing to gravity, the flow direction influences the active surface area of the electrode. Horizontal positioning is required, regardless of the flow direction, so as to obtain the maximum active surface area.
Based on the analysis of the conventional design problems, the fourth and fifth bifurcations that showed the high symmetry coefficient ( C s y m ) were integrated, and the downward bifurcations were removed to construct rectangular outlets. This was done to prevent flow path clogging caused by the settlement of the oily bromide complex. Depending on the bifurcations, these modifications reduced the symmetry coefficient ( C s y m ) and the maximum flow rate deviation ( D m ) by up to 98% each. Moreover, the first section exhibited the highest pressure drop because of the chevrons, which exist for the crushing and mixing of the oily bromide complex; they were removed and relocated to reduce the high-pressure loss. This relocation reduces the pressure drop by 15.3% and 11.6% for the inlet and outlet channels, respectively. Consequently, the RFB with the new design can reduce pump loss by 13% compared with the conventional RFB. Through the investigation of the flow characteristics of the flow frame and the modification of configuration, we confirm that the entire RFB’s efficiency can be improved by increasing the maximum active surface area and pump efficiency. One area of future work is to predict the overall system performance of the new RFB according to the flow uniformity through charge/discharge experiments for a single cell, as well as stacks.

Author Contributions

Conceptualization, B.-R.K., Y.-H.C. and Y.-H.L.; methodol-ogy, B.-R.K. and D.-Y.S.; software, B.-R.K.; formal analysis, B.-R.K. and D.-Y.S.; valida-tion (experiment), B.-R.K. and Y.-H.L.; writing. B.-R.K., Y.-H.C.; supervision, Y.-H.C.; project administration, D.-Y.S. and Y.-H.C. All authors have read and agreed to the published version of the manuscript.

Funding

This work was supported by the “Human Resources Program in Energy Technology” of the Korea Institute of Energy Technology Evaluation and Planning (KETEP), and a granted financial resource from the Ministry of Trade, Industry, and Energy, Republic of Korea (project no. 2017 4010 201410).

Conflicts of Interest

The authors declare no conflict of interest.

References

  1. Joerissen, L.; Garche, J.; Fabjan, C.; Tomazic, G. Possible use of vanadium redox-flow batteries for energy storage in small grids and stand-alone photovoltaic systems. J. Power Sources 2004, 127, 98–104. [Google Scholar] [CrossRef]
  2. Ponce de León, C.; Frías-Ferrer, A.; González-García, J.; Szánto, D.A.; Walsh, F.C. Redox flow cells for energy conversion. J. Power Sources 2006, 160, 716–732. [Google Scholar] [CrossRef] [Green Version]
  3. Nguyen, T.; Savinell, R.F. Flow batteries. Electrochem. Soc. Interface 2010, 19, 54. [Google Scholar] [CrossRef]
  4. Reddy, T. Linden’s Handbook of Batteries; McGraw-Hill Education: New York, NY, USA, 2010. [Google Scholar]
  5. Ke, X.; Prahl, J.M.; Alexander, J.I.D.; Wainright, J.S.; Zawodzinski, T.A.; Savinell, R.F. Rechargeable redox flow batteries: Flow fields, stacks and design considerations. Chem. Soc. Rev. 2018, 47, 8721–8743. [Google Scholar] [CrossRef] [PubMed]
  6. Xu, Q.; Zhao, T.S.; Leung, P.K. Numerical investigations of flow field designs for vanadium redox flow batteries. Appl. Energy 2013, 105, 47–56. [Google Scholar] [CrossRef]
  7. Bengoa, C.; Montillet, A.; Legentilhomme, P.; Legrand, J. Flow visualization and modelling of a filter-press type electrochemical reactor. J. Appl. Electrochem. 1997, 27, 1313–1322. [Google Scholar] [CrossRef]
  8. Escudero-González, J.; López-Jiménez, P.A. Redox cell hydrodynamic modelling: Towards real improved geometry based on CFD analysis. Eng. Appl. Comput. Fluid Mech 2014, 8, 435–446. [Google Scholar] [CrossRef] [Green Version]
  9. Escudero-González, J.; López-Jiménez, P.A. Methodology to optimize fluid-dynamic design in a redox cell. J. Power Sources 2014, 251, 243–253. [Google Scholar] [CrossRef]
  10. Ma, X.; Zhang, H.; Sun, C.; Zou, Y.; Zhang, T. An optimal strategy of electrolyte flow rate for vanadium redox flow battery. J. Power Sources 2012, 203, 153–158. [Google Scholar] [CrossRef]
  11. Reed, D.; Thomsen, E.; Li, B.; Wang, W.; Nie, Z.; Koeppel, B.; Sprenkle, V. Performance of a low cost interdigitated flow design on a 1 kW class all vanadium mixed acid redox flow battery. J. Power Sources 2016, 306, 24–31. [Google Scholar] [CrossRef] [Green Version]
  12. Messaggi, M.; Canzi, P.; Mereu, R.; Baricci, A.; Inzoli, F.; Casalegno, A.; Zago, M. Analysis of flow field design on vanadium redox flow battery performance: Development of 3D computational fluid dynamic model and experimental validation. Appl. Energy 2018, 228, 1057–1070. [Google Scholar] [CrossRef]
  13. Bortolin, S.; Toninelli, P.; Maggiolo, D.; Guarnieri, M.; Del Col, D. CFD study on electrolyte distribution in redox flow batteries. J. Phys. Conf. Ser. 2015, 655, 012049. [Google Scholar] [CrossRef] [Green Version]
  14. Kim, M.; Yun, D.; Jeon, J. Effect of a bromine complex agent on electrochemical performances of zinc electrodeposition and electrodissolution in Zinc–Bromide flow battery. J. Power Sources 2019, 438, 227020. [Google Scholar] [CrossRef]
  15. Porous Media Condition. Available online: http://www.afs.enea.it/project/neptunius/docs/fluent/html/ug/node233.htm (accessed on 29 January 2019).
  16. Hirt, C.W.; Nichols, B.D. Volume of fluid (VOF) method for the dynamics of free boundaries. J. Comput. Phys. 1981, 39, 201–225. [Google Scholar] [CrossRef]
  17. Nathan, C. Title of Patent. U.S. Patent No.US20140162095A1; Internal Header Flow Divider for Uniform Electrolyte Distribution, 12 June 2014. [Google Scholar]
  18. Poling, B.E.; Thomson, G.H.; Friend, D.G.; Rowley, R.L.; Wilding, W.V. Section 2: Physical and Chemical Data. In Perry’s Chemical Engineers’ Handbook; McGraw-Hill: New York, NY, USA, 2007; ISBN 0071542094. [Google Scholar]
Figure 1. Computational domain for a Zn/Br flow frame (the blue line shows 32 electrode inlets, and the red line shows 32 electrode outlets).
Applsci 10 00929 g001
Figure 2. Zn/Br redox flow battery (RFB) single cell structure.
Applsci 10 00929 g002
Figure 3. Spacer geometry and a photograph for the upper part of the flow frame.
Applsci 10 00929 g003
Figure 4. Pressure drop in the spacer for various velocities.
Applsci 10 00929 g004
Figure 5. Experimental setup for a single cell RFB.
Applsci 10 00929 g005
Figure 6. Comparison of pressure drops between the numerical and experimental results.
Applsci 10 00929 g006
Figure 7. Results of the flow visualization experiment: (a) inflow from the top part and (b) inflow from the bottom part (the orange lines are traces left by the experiment shown in Figure 6a).
Applsci 10 00929 g007
Figure 8. Volume of a fraction of the Zn/Br solution after 5 s (computational fluid dynamics (CFD) result): (a) inflow from the top and (b) inflow from the bottom.
Applsci 10 00929 g008
Figure 9. Velocity magnitude contours (a) in the conventional flow battery, (b) in the electrode inlet, and (c) in the electrode outlet.
Applsci 10 00929 g009aApplsci 10 00929 g009b
Figure 10. Velocity profiles at the electrode inlet region.
Applsci 10 00929 g010
Figure 11. Mass fluxes at five bifurcation locations between the inlet channel and the electrode.
Applsci 10 00929 g011
Figure 12. Chevron geometry in the inlet channel (marked with a red box).
Applsci 10 00929 g012
Figure 13. Flow characteristics in the several cross-sections of the inlet.
Applsci 10 00929 g013
Figure 14. Pressure drops at several locations in the inlet channel along the flow direction.
Applsci 10 00929 g014
Figure 15. New channel design of the flow frame of RFB.
Applsci 10 00929 g015
Figure 16. Comparison of chevron locations in the (a) conventional design and (b) new design.
Applsci 10 00929 g016
Figure 17. Velocity magnitude contour at the electrode inlet region in the (a) conventional design and (b) new design.
Applsci 10 00929 g017
Figure 18. Velocity distribution at the electrode inlet for the new RFB design.
Applsci 10 00929 g018
Figure 19. Comparison of mass flow deviation at three bifurcation locations between the inlet channel and electrode.
Applsci 10 00929 g019
Table 1. Inlet and outlet boundary conditions for numerical computation.
Inlet0.3 LPM (0.007 kg/s)
Outletatmospheric pressure
Table 2. Viscous and inertial resistance factors.
μ α   Δ n y 232.96
C 2 1 2 ρ   Δ n y 2296.3
Viscous Resistance1/α = 2.6462E + 07 [1/m2]
Inertial ResistanceC2 = 727.7712 [1/m]
Table 3. Instruments and sensors used for the experiment.
Instrument/SensorModelAccuracy
Pressure transducerSetra, model 206±0.13%
Liquid pumpKNF, NF 1300±1%
Data acquisitionAgilent, 34972A±1.5%
Table 4. Battery efficiencies from the charge/discharge experiments of eight cells per stack.
Inflow Type.Energy
Efficiency [%]
Voltage
Efficiency [%]
Coulomb
Efficiency [%]
Bottom inflow71.479.190.2
Horizontal inflow74.480.592.5
Table 5. Comparison of pressure drop between the conventional and new designs.
RegionConventional Design (bar)New Design (bar)Difference (%)
Inlet channel0.5010.42415.3
Electrode0.0050.0050
Outlet channel0.4880.43111.6
Whole region0.9920.86013.3

