Abstract
Previous studies have revealed the occurrence of alterations of white matter (WM) and grey matter (GM) microstructures in Alzheimer’s disease (AD) and their prodromal state amnestic mild cognitive impairment (MCI). In general, these alterations can be studied comprehensively by modeling the brain as a complex network, which describes many important topological properties, such as the small-world property, modularity, and efficiency. In this study, we systematically investigated white matter abnormalities using unbiased whole brain network analysis. We compared regional and network related WM features between groups of 19 AD and 25 MCI patients and 22 healthy controls (HC) using tract-based spatial statistics (TBSS), network based statistics (NBS) and graph theoretical analysis. We did not find significant differences in fractional anisotropy (FA) between two groups on TBSS analysis. However, observable alterations were noticed at a network level. Brain network measures such as global efficiency and small world properties were low in AD patients compared to HCs.
1. Introduction
Alzheimer’s disease (AD), an irreversible and progressive brain disorder, is the most common cause of dementia [1,2,3,4]. The deposition of two abnormal protein fragments known as plagues and tangles causes the death of neuron cells [2]. As such, neuronal death and white matter degeneration characterized by cortical atrophy take place primarily in medial temporal region and gradually spread over the entorhinal cortex and the limbic system and eventually affect the neocortical regions through synapses and neural connections [5,6]. Mild cognitive impairment (MCI) is the stage between healthy controls (HC) aging and serious cognitive decline of dementia [7,8].
Different imaging models, such as electroencephalography (EEG) [9], functional magnetic resonance imaging (fMRI) [10] and positron emission tomography (PET) [11], have been used to study the progression of disease. The majority of studies have investigated using the structural magnetic resonance imaging (MRI) [12,13,14] that assists in the visualization of degenerative histological changes caused by neurological disorders. The feature extracted from MRI is typically grey matter volumes. Although grey matter volume of the hippocampus has been an important biomarker of medial temporal lobe neurodegeneration, alterations of hippocampal white matter pathways are often observed in AD [15].
Recent studies [16,17,18,19] suggest a direct role of white matter (WM) degeneration in AD/MCI pathogenesis. Similarly, diffusion tensor imaging (DTI)-based studies [17] show lower fractional anisotropy (FA) and higher mean diffusivity (MD) in MCI and AD patients compared to controls. AD and MCI patients exhibit alterations in widely distributed connectivity pairs. This line of evidence suggests that AD is a disconnection syndrome characterized by network disruptions [20,21].
In recent years, many studies based on graph theory using WM features have provided metrics such as small world properties, clustering and modularity, characterizing relevant properties of networks such as efficiency and the integration and segregation of the brain network in the AD and MCI cohorts [22,23,24,25]. Graph theory is a mathematical approach for the analysis of complex networks constructed of “nodes” i.e., in our case brain regions of interest (ROI), which are interconnected via “edges”. Graph theory has emerged as a powerful tool for identifying anatomically localized subnetworks associated with neuronal alterations in psychiatric conditions [26].
Similarly, network-based statistics (NBS) [27,28] has been widely used for testing hypotheses about the human connectome. More specifically, it has been used to identify networks comprising the connectome associated with between-group difference. Initially, an arbitrary threshold is set to determine the network cluster. Next, the permutations are performed on the determined network. NBS potentially yields notably large power to provide the altered clustering network structure in AD/MCI.
In the current study, we use NBS to investigate the abnormal network components and clustering structure of connectivity alterations in AD and MCI. We employ NBS on the DTI model to explore the alterations in the network structure of white matter connectome. Further, we perform an integrated analysis of graph theoretical analysis with NBS to identify the subtle topological changes that occur in specific regions connected by the altered brain network. The overall flow chart of this study is shown in Figure 1.
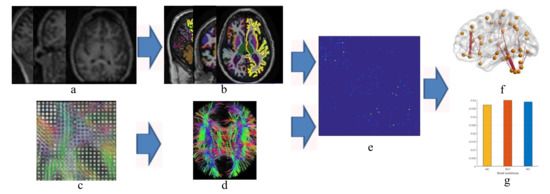
Figure 1.
Flow chart to compute structural connectivity matrix and network analysis (a) magnetic resonance (MR) images, (b) partition into region of interests, (c) diffusion tensor imaging, (d) tractography, (e) structural connectivity matrix calculation, (f) brain network and (g) graph theoretical analysis.
2. Materials and Methods
In this study we used HCs, patients with amnestic MCI and patients with AD data from the Alzheimer’s disease neuroimaging initiative database (ADNI) (www.loni.ucla.edu). The ADNI database was launched in 2003 as a public–private partnership. The primary goal of ADNI has been to test whether the serial MRI, PET other biological markers, and clinical and neurophysical assessment, can be combined to measure the progression of MCI and the early AD. ADNI project has four phases: ADNI-1, ADNI-GO, ADNI-2 and ADNI-3. We have used the DTI data from ADNI-2 screening phase.
Diffusion MRI were acquired from each participant using 3-tesla GE Medical Systems scanners with acquisition type 2D, field strength 3 Tesla, flip angle 90.0 degree, gradient directions 41 degree, echo time (TE) 68.3 ms, repetition time(TR) of 13,000.0 ms and voxel size of 1.3672 × 1.3672 × 2.70 mm3. Similarly, 3D T1-weighted images were collected using spoiled gradient echo (SPGR) sequences with acquisition type 3D, field strength = 3 Tesla, flip angle 11.0 degree, pixel spacing X = 1.0547000169754028 mm; Pixel Spacing Y = 1.0547000169754028 mm, slice thickness = 1.2000000476837158 mm; echo time (TE) 2.832 ms, inversion time (TI) 400.0 ms, repetition time (TR) 6.964 ms and weighting T1. The ADNI dataset consists of more than 6000 subjects aged from 18 to 96. From it, we selected subjects as specified in Table 1.

Table 1.
Demographic and clinical details of the patients with AD, MCI and HCs in this study.
3. Data Preprocessing
We used FSL toolbox (http://fsl.fmrib.ox.ac.uk/) to process each subject’s DTI. Processing began with eddy current distortion and motion correction and the removal of nonbrain tissue by affine registration to the first b0 image using the ‘eddy_correct’ function in FSL. Then, we generated five diffusion MRI indices of the WM microstructure for each participant.
A brain mask was created using the fractional intensity threshold of 0.3 to ensure that only diffusion tensors inside the brain were computed. The diffusion tensors were then linearly fitted to the diffusion-weighted images using the ‘dtifit’ tool in FSL, generating maps of FA and MD.
For sMR images, we used a fully automated pipeline of the FreeSurfer 5.3.0 software package for reconstruction and volumetric segmentation from all the sMR images and extracted the pattern of useful data. The software performs a series of preprocessing operations with the FreeSurfer’s recon-all processing pipeline on the original sMRI data. The preprocessing steps include motion correction, T1-weighted image averaging, registration of volume to the Talairach space, and skull striping with a deformable template model. The method developed by Schaer [29] was used to measure the folding index over the whole cortical surface.
3.1. Tract-Based Spatial Statistics Analysis
We used tract-based spatial statistics (TBSS) [30] to enable voxel wise between-subject’s analyses. Fractional anisotropy (FA) images of each subject were aligned to a space of a target image (FMRIB58_FA) using nonlinear registration FMRIB’s non-linear image registration tool FNIRT. In the next step, mean_FA images were generated that were further thinned to generate mean_FA_skeleton images. FA maps were averaged to create the mean FA template, from which the mean FA skeleton was derived (FA.0.2). Finally, all subjects’ spatially normalized FA data were projected onto the skeleton and fed into voxel-wise statistics, where 10,000 permutations of the data were generated using randomize with threshold-free cluster enhancement (TFCE) enabled.
3.2. Network Construction
We constructed a brain network from preprocessed DTI. A DTI derived brain network for each subject can be described as a graph with set of nodes representing regions of brain and edges that form the white matter connections between the nodes. Using the automated anatomical labeling (AAL) atlas, which included a total of 116 cortical and subcortical regions, a weighted, undirected graph was constructed for each subject by counting a number of tracts connecting each pair of anatomical regions. A DTI diffusion scheme was used, and a total of 41 diffusion sampling directions were acquired. The b-value was 1000 s/mm2, the in-plane resolution was 1.3672 mm and the slice thickness was 2.7 mm. The diffusion data were reconstructed in the MNI space using q-space diffeomorphic reconstruction [31] to obtain the spin distribution function [32]. A diffusion sampling length ratio of 1.25 was used, and the output resolution was 2 mm. A deterministic fiber tracking algorithm [33] was used. A seeding region was placed at whole brain. The angular threshold was randomly selected from 15 degrees to 90 degrees. The step size was randomly selected from 0.1 voxel to 3 voxels. The anisotropy threshold was randomly selected. The fiber trajectories were smoothed by averaging the propagation direction with a percentage of the previous direction. The percentage was randomly selected from 0% to 95%. Tracks with length shorter than 30 or longer than 300 mm were discarded. A total of 5000 seeds were placed. The analysis was conducted using DSI Studio (http://dsi-studio.labsolver.org).
3.3. Graph—Theoretical Analysis
Graph theory has been widely used for analyzing complex network structure of brain connectomes [34,35,36]. Graph theory allows one to better understand the network structure of the brain connectomes that can reveal abnormal patterns of organization of structural and functional connectivity [34]. Basic characterization of brain network features can be achieved by their integration and segregation properties. Network integration in the brain is the ability of network to combine distributed information in different brain regions [35]. The global efficiency measure provides this kind of information, describing how efficiently information is distributed within the network globally. Similarly, network segregation represents the ability for specialized information processing to occur within a densely interconnected group of regions [36]. Network measures such as clustering coefficient and local efficiency represent this feature. Clustering coefficient measures the number of connections of a node with its nearest nodes, thus providing information about the level of local connectedness within a network. Local efficiency is the global efficiency computed on the neighborhood of the node, and is related to the clustering coefficient. We can distinguish different types of network including a small world, random or regular based on the two network information processing perspective of information segregation and integration. The ratio of characteristic path length and clustering coefficient with normalized characteristic path lengths and normalized clustering coefficients determines small-worldness. Small-worldness occurs in sparsely connected networks, when clustering is high and the average path length between nodes is short. In other words, small-world networks refer to networks that have similar characteristic path lengths but are more clustered, as opposed to random networks [37].
4. Statistical Analysis
To identify the group differences in networks comprising pair of regions between AD and HC, we used the NBS approach. We applied t-statistics of two-sample one-sided independent sample t-tests to identify a set of suprathreshold connections. All the connected components within the suprathreshold connections and the component size (number of links) were determined, and the significance of each component was derived from the null distribution of the maximal component size yielded by the nonparametric permutation approach (5000 permutations). For each permutation, all subjects were reallocated to HC and AD randomly, and the t-statistic was recalculated. Then, the connected components were identified after the same t-statistic threshold was applied. The component sizes were stored, and they generated an empirical estimate of the null distribution of component sizes. A corrected p-value for an observed component of size k was estimated by identifying the proportion of the total number of permutations for which the maximal component size was greater than k.
5. Results
5.1. Demographic and Clinical Findings
We did not find a significant group difference in age and education in AD and HC. Significant group difference was found in Mini–Mental State Examination (MMSE) (Ps < 0.01).The gender proportion on both AD and HC is male dominant. AD has 57.8% and HC has 54.5% male dominance. No group differences were found in education in HC versus AD and AD versus MCI in age. However, the MMSE and education show the group difference in AD versus HC and MCI versus AD. In addition, all three subject groups (HC (86.3%), MCI (80%) and AD (84.2%)) are married dominant. Table 1 shows the detailed descriptions and analysis of these variables.
5.2. TBSS Analysis
We did not find significant difference in areas of FA in the group analysis between AD versus HC and AD versus MCI (p > 0.05) with standard threshold 0.2.
6. Graph Properties
We studied six graph properties, density, clustering coefficient, global efficiency, small-worldness, transitivity and network path length. All network properties were computed using weighted graph. Figure 2 shows the group averages of network properties compared with each subject cohort. In our analysis, the overall networks topology revealed the significant group differences in the global efficiency and clustering coefficient.
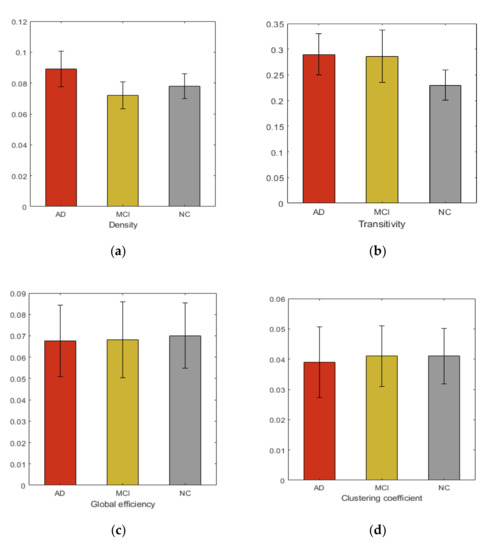
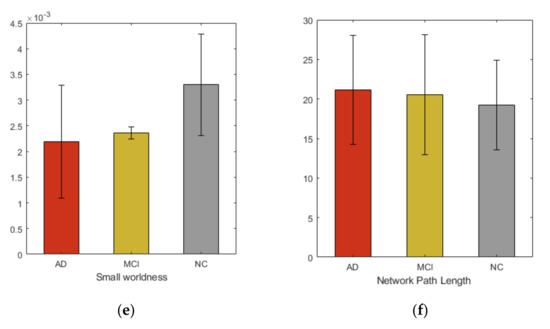
Figure 2.
Group averages and comparisons of topological properties (a) Density, (b) Transitivity, (c) Global efficiency, (d) Clustering coefficient, (e) Small-worldness, (f) Network path length.
6.1. NBS of Structural Connectivity
NBS analysis revealed a network that consisted of 17 edges where HCs had greater connectivity than ADs (t = 2.81, p < 0.05), as shown in Figure 3. The network comprised limbic lobe, medial and inferior surfaces, occipital lobe and cerebellum. However, altered network of MCI group consisted only five edges passing through, frontal and limbic lobe (t = 3.1, p < 0.05), as shown in Figure 4.
Figure 3.
The subnetwork derived from the NBS analysis showing uniformly significantly decreased connections in the AD subjects compared to HC.
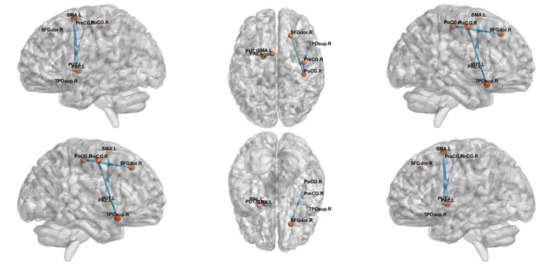
Figure 4.
The subnetwork derived from the NBS analysis showing uniformly significantly decreased connections in the MCI subjects compared to the HC.
6.2. Topological Properties of Altered Connection
Table 2 and Table 3 show the changes in clustering coefficient in different regions. These regions are selected in each group based on the altered connection obtained in NBS analysis. In this study, we found twelve different ROIs that made the altered connections in AD versus HC analysis that are as shown in Table 2. Similarly, Table 3 shows different statistical values of four different ROIs while conducting HC versus MCI analysis.
Table 2.
Region-of-interest-based clustering coefficient changes between HC and AD.
Table 3.
Region-of-interest-based clustering coefficient changes between HC and MCI.
7. Discussion
In this study, we comprehensively explored the whole brain network for WM changes in AD and MCI using TBSS, graph theoretical analysis and NBS. NBS and graph theory have become ideal tools for studying the changes that occur in brain network due to progression of AD and MCI. For graph theoretic analysis, achieving consistent results is the major issue while doing studies on different imaging modalities.
Recent studies show that consistent results on graph metrics measured using cortical features and weighted network metrics can be achieved with fewer number of subjects in AD and control groups [38]. Thus, our study is more concerned about the use of graph theoretical analysis technique that generates stable results. The novel finding of this study is identification of topological changes in regions where observable alterations in network level have occurred. Thus, we performed the combined study of NBS and graph theoretic analysis to identify the graph theoretical metrics of regions where observable alterations of white matter are noticed.
Additionally, in this study, we comprehensively examined the whole brain network to identify AD and MCI associated WM changes using TBSS. From our study we did not find that FA could reflect significant regional changes in brain. However, at network level observable alterations were noticed. Many previous studies [39] show the increase in randomization in brain functional network in AD, suggesting the elevation of small-worldness property. These studies further demonstrate the loss of global information integration in AD. Increased value of small-worldness and global efficiency in HC indicated more efficient use of neural resources in the absence of neurodegeneration process. These characteristics indicate that AD and MCI patients have significantly longer path lengths of their MRI graphs, thus suggesting a disruption in effective interactions between and across cortical regions and providing further support for the concept of AD as a disconnection syndrome. Consistent with prior studies, our study demonstrated that in the analysis of the global network parameters, no significant difference was found between the controls and patients, which suggests that global network analysis may not reflect the subtle changes of connectivity in MCI and AD, even after the neuro-degeneration process has begun. Additionally, our study shows increased clustering coefficient in HC, compared to MCI and AD. The view contradicts the recent study [40] that found subtle changes in global and local network metrics in AD and MCI.
Another goal of our study is to investigate the disruption of structural connections between different regions of brain in AD and MCI patients, compared with HC. As predicted, compared to HC and MCI patients, AD patients showed wide-spread alterations in many regions of the brain, including frontal, temporal, limbic, parietal lobe, sub cortical grey nuclei and central and medial surfaces. Similarly, patients with MCI showed network alterations in sub cortical grey nuclei, frontal limbic and central region. As MCI is considered to be prodromal stage of AD, even in preclinical phase, our results collectively indicate that disruption begins in limbic lobe [40]. However, the disruption gradually increases as the disease progresses. We observed in our results that the disruption is mainly concentrated in precentral and postcentral gyrus, hippocampus, insula, temporal pole: superior temporal gyrus, median cingulate and para cingulate gyri, supplementary motor area, cerebellum and precneus. However, majority of alterations occurred within the network associated with limbic lobe and central and medial surfaces of AD patients. In our study, disruption of connection from hippocampus of limbic system to other region supports the need to establish the hypothesis that WM would be altered at the network level and, more specifically, regarding the connections associated with the processing of short-term memories into long-term memories [41]. In addition, we found supplementary motor area (SMA) was the only region that was affected in left and right hemisphere of the brain. The SMA is also known as Brodmann area 6, which is situated medially between primary motor cortex and medial-to-premotor cortex [42]. SMA is involved in planning of learned complex movements and in coordinating movements involving both hands and learning new motor sequences. The altered network with this region suggests either a failing motor planning system of learned movement or alternative strategy for enforcing motor response. Similarly, this study found altered connection in the parietal and temporal lobe. We overserved disruption in network associated with superior parietal gyrus and inferior parietal lobule. These regions are mainly responsible for the interpretation of sensory information, language, mathematical operations, and body image. Damage or stimulation of network in these regions can result in difficulty in processing language, undertaking mathematical operations and processing sensory information. Additionally, our study found alterations within the cerebellum network. Cerebellum system is well known for receiving information from various sensory systems, spinal cord and other parts of brain and then regulating movement. Recent clinical and neuroimaging studies reveal the involvement of cerebellum in modulation of cognition and emotion [43].
Compared to network alterations in AD versus HC, we found fewer alterations in HC versus MCI with only three edges. The altered network includes frontal, limbic, medial, central and subcortical gyri nuclei. Majority of alterations are occurred in subcortical gyri and central region. These areas are more involved in emotion and formation of memory. Additionally, we performed an integrated analysis of WM alteration using NBS and graph theoretical analysis. The detailed investigation show changes in clustering coefficient in different regions. The integrated study shows that the significant group differences were observed in clustering coefficient between AD and HC in limbic surface (p = 0.0352), medial surface (p = 0.0075) and parietal surface (p = 0.004), which are highlighted in Table 2. This fact appears in support to set the hypothesis set by NBS based experiments. To our knowledge, the current study is the first to demonstrate the enhanced structural connectome in AD/MCI using integrated NBS and graph theoretic analysis. We highlight not only the importance of connectivity deficits in relation to pathophysiology of AD, but also the implications of the complex nature of their interaction. We report the structural relationships in a network encompassing limbic, frontal, temporal and medial regions, and the group differences in global and local efficiency of the overall network topology.
8. Conclusions
In this paper, we investigated the white matter abnormalities of AD/MCI using voxel-based morphometry method TBSS DTI measure, NBS and graph theoretical analysis. AD cohort data was compared in a group wise analysis against HC and MCI subjects. We did not find significant difference in areas of FA in the group analysis between AD versus NC and MCI. However, significant alterations were observed at the network level, specifically in the network connecting the limbic lobe with other different regions of the brain. Similarly, a study of graph theoretical analysis of the brain showed a reduction in small-world properties, suggesting that AD and MCI patients have significantly longer path lengths of their MRI graphs because of a disruption in effective interactions between and across cortical regions. Additionally, the integrated study of NBS and graph theoretic analysis showed that the statistical difference of clustering coefficient among patient group was observed in limbic lobe.
Author Contributions
Conceptualization was done by S.-W.L. and R.K.L. R.K.L. collected the original imagining data from ADNI home page. S.-W.L. managed and analyzed the imaging data. Methodology, software and validation with formal analysis were done by both authors. R.K.L. wrote the original draft of manuscript. Review and editing were done by S.-W.L. All authors have read and agreed to the published version of the manuscript.
Funding
This work was supported by the GRRC program of Gyeonggi province [GRRC-Gachon2017(B01), analysis of behavior based on senior life log].
Acknowledgments
Data collection and sharing for this project was funded by the Alzheimer’s Disease Neuroimaging Initiative (ADNI) (National Institutes of Health Grant U01 AG024904) and DOD ADNI (Department of Defense award number W81XWH-12-2-0012). ADNI is funded by the National Institute on Aging, the National Institute of Biomedical Imaging and Bioengineering and through generous contributions from the following: AbbVie, Alzheimer’s Association; Alzheimer’s Drug Discovery Foundation; Araclon Biotech; BioClinica, Inc.; Biogen; Bristol-Myers Squibb Company; CereSpir, Inc.; Cogstate; Eisai Inc.; Elan Pharmaceuticals, Inc.; Eli Lilly and Company; EuroImmun; F. Hoffmann-La Roche Ltd. and its affiliated company Genentech, Inc.; Fujirebio; GE Healthcare; IXICO Ltd.; Janssen Alzheimer Immunotherapy Research and Development, LLC.; Johnson and Johnson Pharmaceutical Research and Development LLC.; Lumosity; Lundbeck; Merck and Co., Inc.; Meso Scale Diagnostics, LLC.; NeuroRx Research; Neurotrack Technologies; Novartis Pharmaceuticals Corporation; Pfizer Inc.; Piramal Imaging; Servier; Takeda Pharmaceutical Company; and Transition Therapeutics. The Canadian Institutes of Health Research provided funds to support ADNI clinical sites in Canada. Private sector contributions were facilitated by the Foundation for the National Institutes of Health (www.fnih.org). The grantee organization was the Northern California Institute for Research and Education, and the study was coordinated by the Alzheimer’s Therapeutic Research Institute at the University of Southern California. ADNI data were disseminated by the Laboratory for Neuro Imaging at the University of Southern California.
Conflicts of Interest
The authors declare no conflict of interest.
References
- Alzheimer’s Association. 2016 Alzheimer’s disease facts and figures. Alzheimer’s Dement. 2016, 12, 459–509. [Google Scholar] [CrossRef] [PubMed]
- Alzheimer’s Association. FDA: Approved Treatments for Alzheimer’s. 2012. Available online: https://www.alz.org/national/documents/topicsheet_treatments.pdf (accessed on 2 May 2019).
- Yang, H.Q.; Sun, Z.K.; Chen, S.D. Current Advances in the Treatment of Alzheimer’s Disease: Focused on Considerations Targeting Aβ and Tau. Transnatl. Neurodegener. 2012, 1, 1–12. [Google Scholar]
- Braak, H.; Braak, E. Staging of alzheimer’s disease-related neurofibrillary changes. Neurobiol. Aging 1995, 16, 271–278. [Google Scholar] [CrossRef]
- Clerx, L.; van Rossum, I.A.; Burns, L.; Knol, D.L.; Scheltens, P.; Verhey, F.; Aalten, P.; Lapuerta, P.; Van de Pol, L.; Van Schijndel, R.; et al. Measurements of medial temporal lobe atrophy for prediction of Alzheimer’s disease in subjects with mild cognitive impairment. Neurobiol. Aging 2013, 34, 2003–2013. [Google Scholar] [CrossRef] [PubMed]
- Yao, Z.; Zhang, Y.; Lin, L.; Zhou, Y.; Xu, C.; Jiang, T. Abnormal cortical networks in mild cognitive impairment and Alzheimer’s disease. PLoS Comput. Biol. 2010, 6, e1001006. [Google Scholar] [CrossRef] [PubMed]
- Knopman, D.S.; Petersen, R.C. Mild cognitive impairment and mild dementia: A clinical perspective. Mayo Clin. Proc. 2014, 89, 1452–1459. [Google Scholar] [CrossRef]
- Petersen, R.C.; Smith, G.E.; Waring, S.C.; Ivnik, R.J.; Tangalos, E.G.; Kokmen, E. Mild cognitive impairment: Clinical characterization and outcome. Arch. Neurol. 1999, 56, 303–308. [Google Scholar] [CrossRef]
- Houmani, N.; Vialatte, F.; Gallego-Jutglà, E.; Dreyfus, G.; Nguyen-Michel, V.H.; Mariani, J.; Kinugawa, K. Diagnosis of Alzheimer’s disease with Electroencephalography in a differential framework. PLoS ONE 2018, 13, 3. [Google Scholar] [CrossRef]
- Stam, C.J.; Jones, B.F.; Manshandena, I.; van Walsumc, A.M.V.; Montez, T.; Verbunt, J.P.A.; van Dijk, B.W.; Berendse, H.W.; Scheltens, P. Magnetoencephalographic evaluation of resting-state functional connectivity in Alzheimer’s disease. Neuroimage 2006, 32, 1335–1344. [Google Scholar] [CrossRef]
- Gray, K.R.; Wolz, R.; Heckemann, R.A.; Hammers, P.A.; Rueckert, A.D. Multi-region analysis of longitudinal FDG-PET for the classification of Alzheimer’s disease. Neuroimage 2012, 60, 221–229. [Google Scholar] [CrossRef]
- Lama, R.K.; Gwak, J.; Park, J.S.; Lee, S.W. Diagnosis of Alzheimer’s disease based on structural MRI images using a regularized extreme learning machine and PCA features. J. Healthc. Eng. 2017, 2017. [Google Scholar] [CrossRef] [PubMed]
- Beheshti, I.; Demirel, H.; Farokhian, F.; Yang, C.; Matsuda, H.; Alzheimer’s Disease Neuroimaging Initiative. Structural MRI-based detection of Alzheimer’s disease using feature ranking and classification error. Comput. Methods Programs Biomed. 2016, 137, 177–193. [Google Scholar] [PubMed]
- Beheshti, I.; Demirel, H. Alzheimer’s Disease Neuroimaging Initiative. Feature-ranking-based Alzheimer’s disease classification from structural MRI. Magn. Reson. Imaging 2016, 34, 252–263. [Google Scholar]
- Ly, M.; Canu, E.; Xu, G.; Oh, J.; Mclaren, D.G.; Dowling, N.M. Midlife measurements of white matter microstructure predict subsequent regional white matter atrophy in healthy adults. Hum. Brain Mapp. 2014, 35, 2044–2054. [Google Scholar] [CrossRef] [PubMed]
- Bendlin, B.B.; Carlsson, C.M.; Johnson, S.C.; Zetterberg, H.; Blennow, K.; Willette, A. CSF T-Tau/Aβ42 predicts white matter microstructure in healthy adults at risk for Alzheimer’s disease. PLoS ONE 2012, 7, e37720. [Google Scholar] [CrossRef] [PubMed]
- Teipel, S.J.; Grothe, M.J.; Filippi, M.; Fellgiebel, A.; Dyrba, M.; Frisoni, G.B.; Hauenstein, K. Fractional anisotropy changes in Alzheimer’s disease depend on the underlying fiber tract architecture: A multiparametric DTI study using joint independent component analysis. J. Alzheimer’s Dis. 2014, 41, 69–83. [Google Scholar] [CrossRef]
- Delbeuck, X.; Collette, F.; van der Linden, M. Is Alzheimer’s disease a disconnection syndrome? Evidence from a crossmodal audio-visual illusory experiment. Neuropsychologia 2007, 45, 3315–3323. [Google Scholar] [CrossRef]
- Chen, H.; Wang, K.; Yao, J.; Dai, J.; Ma, J.; Li, S.; Ai, L.; Chen, Q.; Chen, X.; Zhang, Y. White matter changes in Alzheimer’s disease revealed by diffusion tensor imaging with TBSS. World J. Neurosci. 2015, 5, 58. [Google Scholar] [CrossRef][Green Version]
- Liu, Y.; Spulber, G.; Lehtimäki, K.K.; Könönen, M.; Hallikainen, I.; Gröhn, H.; Soininen, H. Diffusion tensor imaging and tract-based spatial statistics in Alzheimer’s disease and mild cognitive impairment. Neurobiol. Aging 2011, 32, 1558–1571. [Google Scholar] [CrossRef]
- Alves, G.S.; Oertel Knöchel, V.; Knöchel, C.; Carvalho, A.F.; Pantel, J.; Engelhardt, E.; Laks, J. Integrating retrogenesis theory to Alzheimer’s disease pathology: insight from DTI-TBSS investigation of the white matter microstructural integrity. Biomed Res. Int. 2015. [Google Scholar] [CrossRef]
- Liu, Y.; Yu, C.; Zhang, X.; Liu, J.; Duan, Y.; Alexander-Bloch, A.F.; Liu, B.; Jiang, T.; Bullmore, E. Impaired Long Distance Functional Connectivity and Weighted Network Architecture in Alzheimer’s Disease. Cereb. Cortex 2014, 24, 1422–1435. [Google Scholar] [CrossRef] [PubMed]
- Sorg, C.; Riedl, V.; Mühlau, M.; Calhoun, V.D.; Eichele, T.; Läer, L.; Drzezga, A.; Förstl, H.; Kurz, A.; Zimmer, C.; et al. Selective changes of resting-state networks in individuals at risk for Alzheimer’s disease. Proc. Nat. Acad. Sci. USA 2007, 104, 18760–18765. [Google Scholar] [CrossRef] [PubMed]
- Acosta-Cabronero, J.; Alley, S.; Williams, G.B.; Pengas, G.; Nestor, P.J. Diffusion tensor metrics as biomarkers in Alzheimer’s disease. PLoS ONE 2012, 7, e49072. [Google Scholar] [CrossRef] [PubMed]
- Doan, N.T.; Engvig, A.; Persson, K.; Alnæs, D.; Kaufmann, T.; Rokicki, J.; Córdova-Palomera, A.; Moberget, T.; Brækhus, A.; Barca, M.L.; et al. Dissociable diffusion MRI patterns of white matter microstructure and connectivity in Alzheimer’s disease spectrum. Sci. Rep. 2017, 7, 45131. [Google Scholar] [CrossRef] [PubMed]
- Bullmore, E.; Sporns, O.; Bullmore, E. Complex brain networks: Graph theoretical analysis of structural and functional systems. Nat. Rev. Neurosci. 2009, 10, 186–198. [Google Scholar] [CrossRef] [PubMed]
- Zalesky, A.; Bullmore, E.T. Network-based statistic: Identifying differences in brain networks. NeuroImage 2010, 53, 1197–1207. [Google Scholar] [CrossRef]
- Zalesky, A.; Cocchi, L.; Fornito, A.; Murray, M.M.; Bullmore, E.T. Connectivity differences in brain networks. NeuroImage 2012, 60, 1055–1062. [Google Scholar] [CrossRef]
- Schaer, M.; Cuadra, M.B.; Schmansky, N.; Fischl, B.; Thiran, J.-P.; Eliez, S. How to Measure Cortical Folding from MR Images: A Step-by-Step Tutorial to Compute Local Gyrification Index. J. Vis. Exp. 2012, 59, e3417. [Google Scholar] [CrossRef]
- Smith, S.M.; Jenkinson, M.; Johansen-Berg, H.; Rueckert, D.; Nichols, T.E.; Mackay, C.E.; Watkins, K.E.; Ciccarelli, O.; Cader, M.Z.; Matthews, P.M.; et al. Tract-based spatial statistics: Voxelwise analysis of multi-subject diffusion data. NeuroImage 2006, 31, 1487–1505. [Google Scholar] [CrossRef]
- Yeh, F.-C.; Verstynen, T.D.; Wang, Y.; Fernández-Miranda, J.C.; Tseng, W.-I. Deterministic Diffusion Fiber Tracking Improved by Quantitative Anisotropy. PLoS ONE 2013, 8, e80713. [Google Scholar] [CrossRef]
- Yeh, F.-C.; Tseng, W.Y. NTU-90: A high angular resolution brain atlas constructed by q-space diffeomorphic reconstruction. J. Neuroimage 2011, 58, 91–99. [Google Scholar] [CrossRef] [PubMed]
- Yeh, F.-C.; Tseng, W.Y. Generalized q-sampling imaging. IEEE Trans. Med. Imaging 2010, 29, 1626–1635. [Google Scholar] [PubMed]
- Karwowski, W.; Vasheghani Farahani, F.; Lighthall, N. Application of graph theory for identifying connectivity patterns in human brain networks: A systematic review. Front. Neurosci. 2019, 13, 585. [Google Scholar]
- Guye, M.; Bettus, G.; Bartolomei, F.; Cozzone, P.J. Graph theoretical analysis of structural and functional connectivity MRI in normal and pathological brain networks. Magn. Reson. Mater. Phys. Biol. Med. 2010, 23, 409–421. [Google Scholar] [CrossRef] [PubMed]
- Wang, J.H.; Zuo, X.N.; Gohel, S.; Milham, M.P.; Biswal, B.B.; He, Y. Graph theoretical analysis of functional brain networks: test-retest evaluation on short-and long-term resting-state functional MRI data. PLoS ONE 2010, 6, e21976. [Google Scholar] [CrossRef]
- Bassett, D.S.; Bullmore, E.T. Small-world brain networks revisited. Neuroscience 2017, 23, 499–516. [Google Scholar] [CrossRef]
- Mårtensson, G.; Pereira, J.B.; Mecocci, P.; Vellas, B.; Tsolaki, M.; Kłoszewska, I.; Soininen, H.; Lovestone, S.; Simmons, A.; Volpe, G.; et al. Stability of graph theoretical measures in structural brain networks in Alzheimer’s disease. Sci. Rep. 2018, 8, 11592. [Google Scholar] [CrossRef]
- Zhou, Y.; Lui, Y.W. Small-World Properties in Mild Cognitive Impairment and Early Alzheimer’s Disease: A Cortical Thickness MRI Study. Isrn Geriatr. 2013, 2013, 1–11. [Google Scholar] [CrossRef]
- Menon, S.K.; Rubin, V.; Musen, D.M.; Greicius, M.D. Network analysis of intrinsic functional brain connectivity in Alzheimer’s disease. Plos Comput. 2008, 4, e1000100. [Google Scholar]
- Li, X.; Wang, H.; Tian, Y.; Zhou, S.; Li, X.; Wang, K.; Yu, Y. Impaired White Matter Connections of the Limbic System Networks Associated with Impaired Emotional Memory in Alzheimer’s Disease. Front. Aging Neurosci. 2016, 8, 250. [Google Scholar] [CrossRef]
- Vidoni, E.D.; Thomas, G.P.; Honea, R.A.; Loskutova, N.; Burns, J.M. Evidence of altered corticomotor system connectivity in early-stage Alzheimer’s disease. J. Neurol. Phys. 2012, 36, 8–16. [Google Scholar] [CrossRef] [PubMed]
- Jacobs, H.I.; Hopkins, D.A.; Mayrhofer, H.C.; Bruner, E.; van Leeuwen, F.W.; Raaijmakers, W.; Schmahmann, J.D. The cerebellum in Alzheimer’s disease: evaluating its role in cognitive decline. Brain 2018, 141, 37–47. [Google Scholar] [CrossRef] [PubMed]
© 2020 by the authors. Licensee MDPI, Basel, Switzerland. This article is an open access article distributed under the terms and conditions of the Creative Commons Attribution (CC BY) license (http://creativecommons.org/licenses/by/4.0/).