Exploring the Evolution of Drought Characteristics in Balochistan, Pakistan

 , , , and
Abstract
1. Introduction
2. Materials and Methods
2.1. Meteorological Data
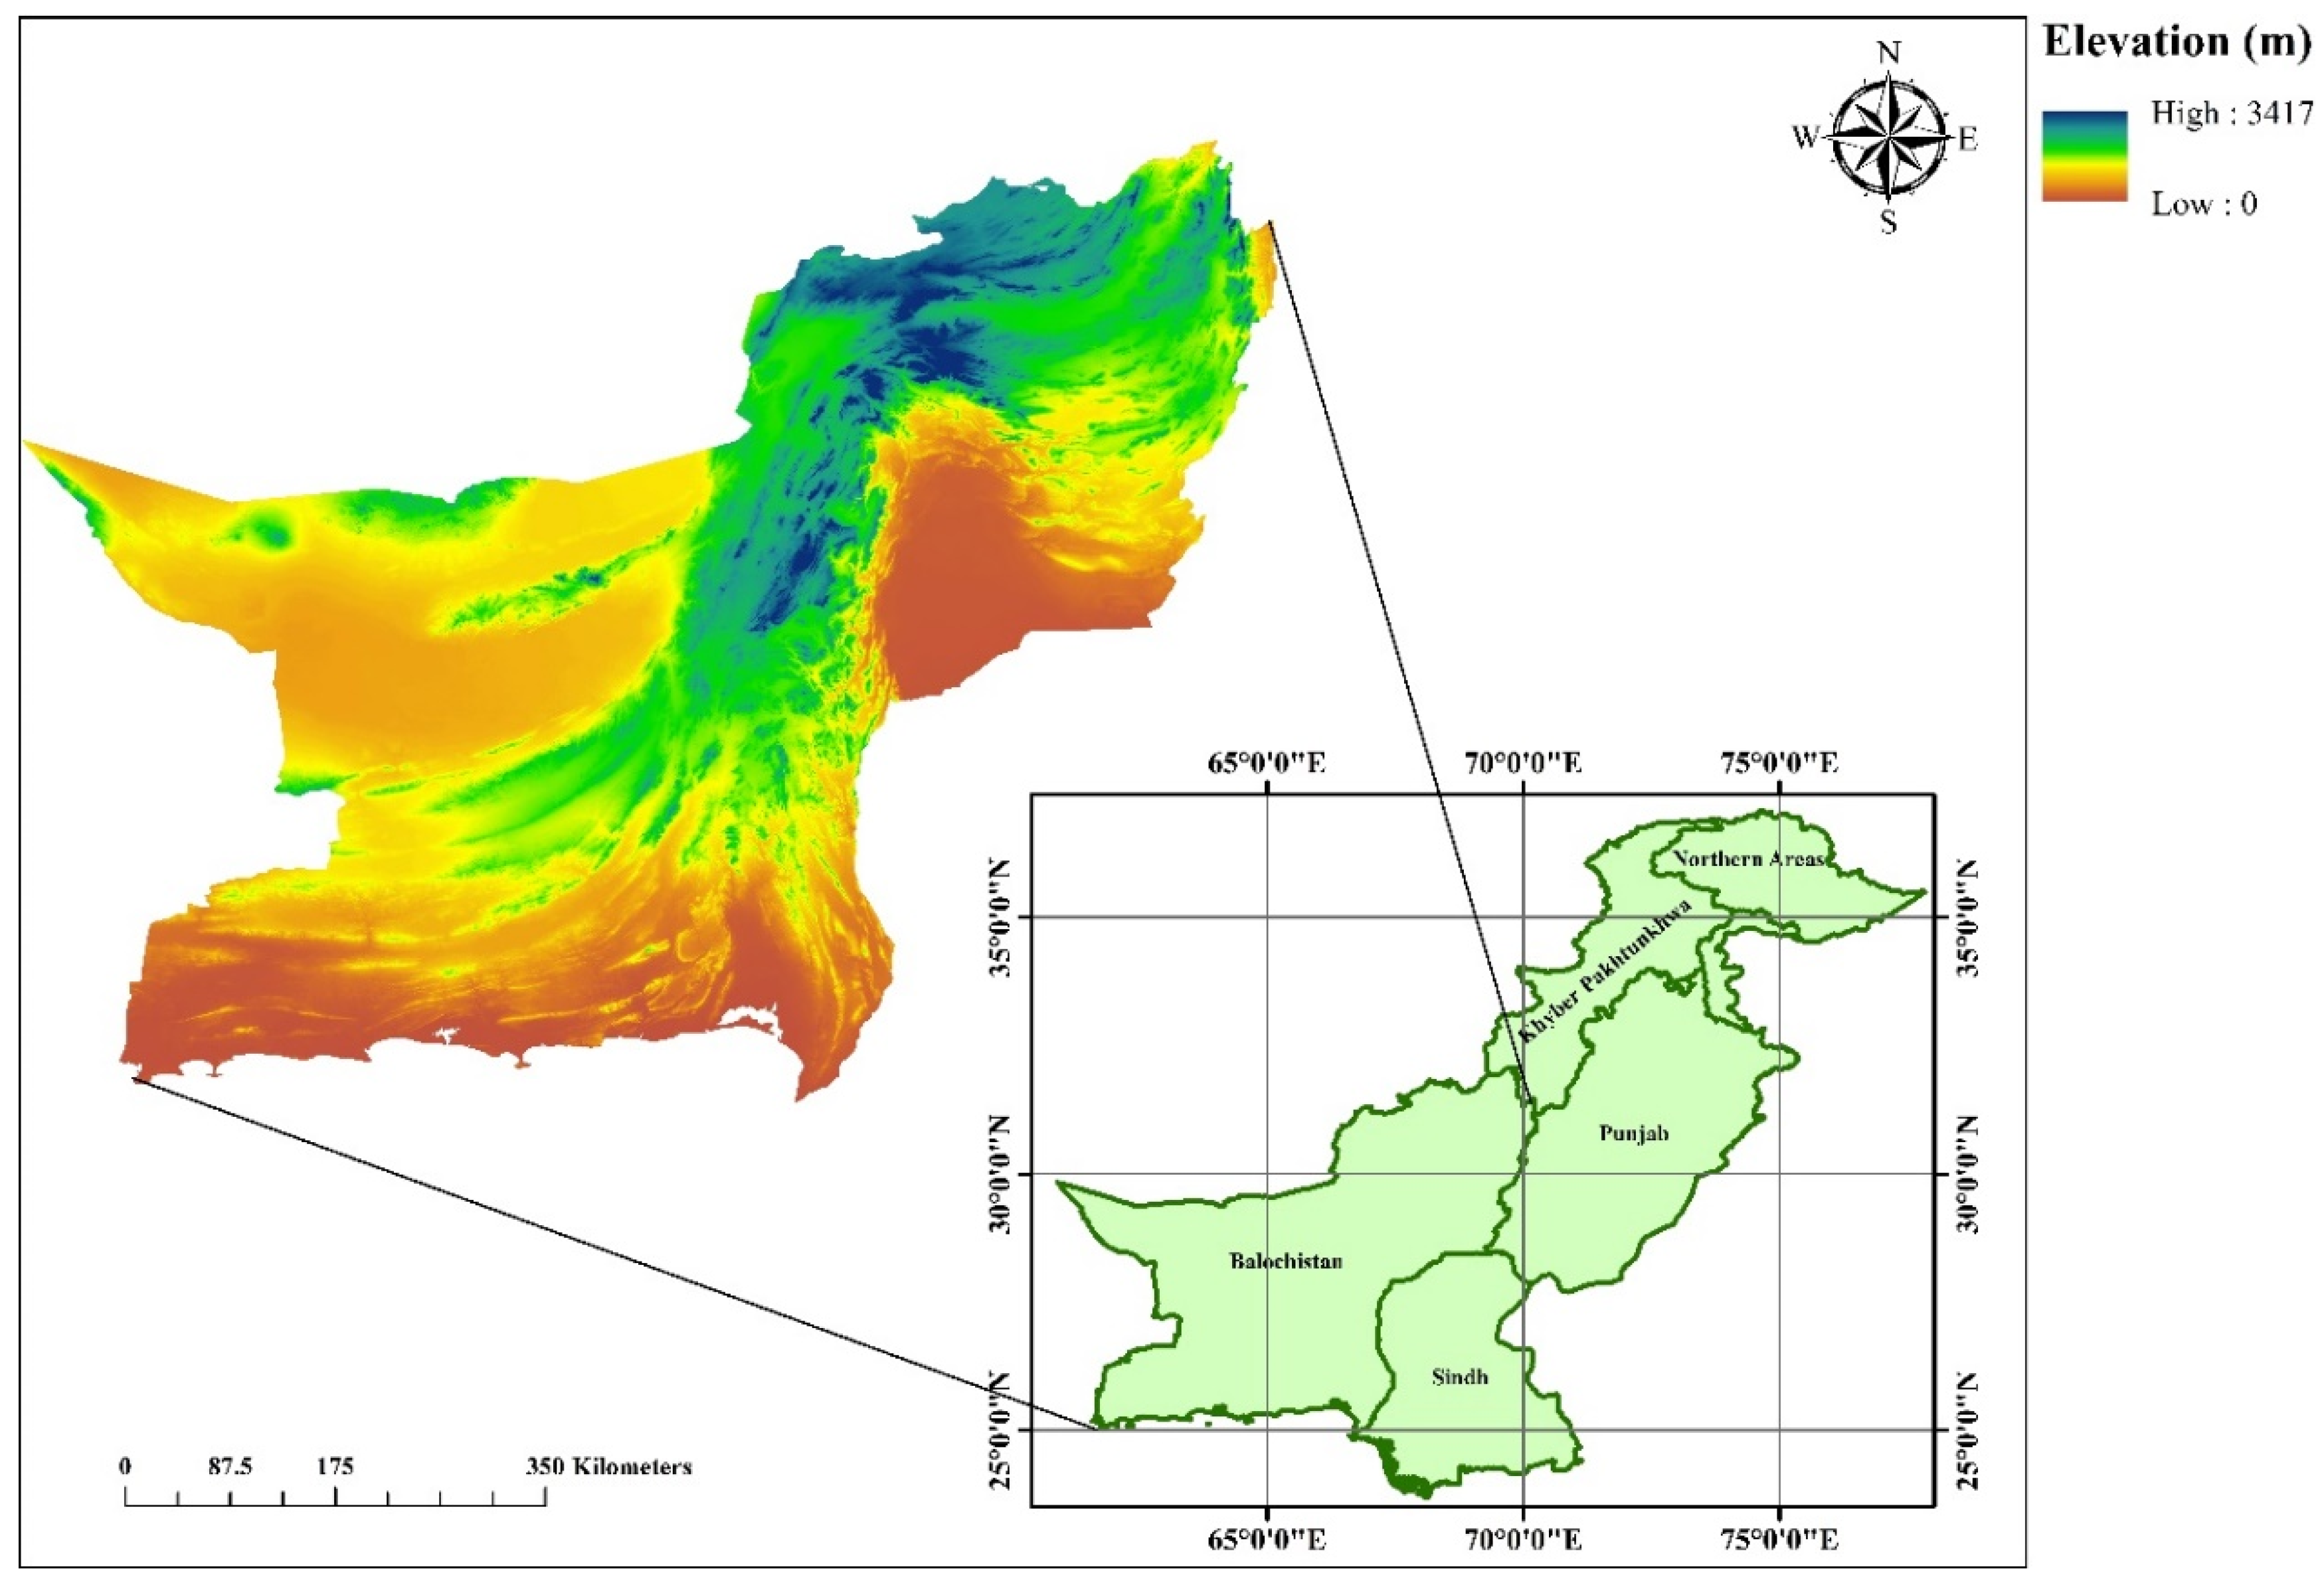
2.2. Study Area
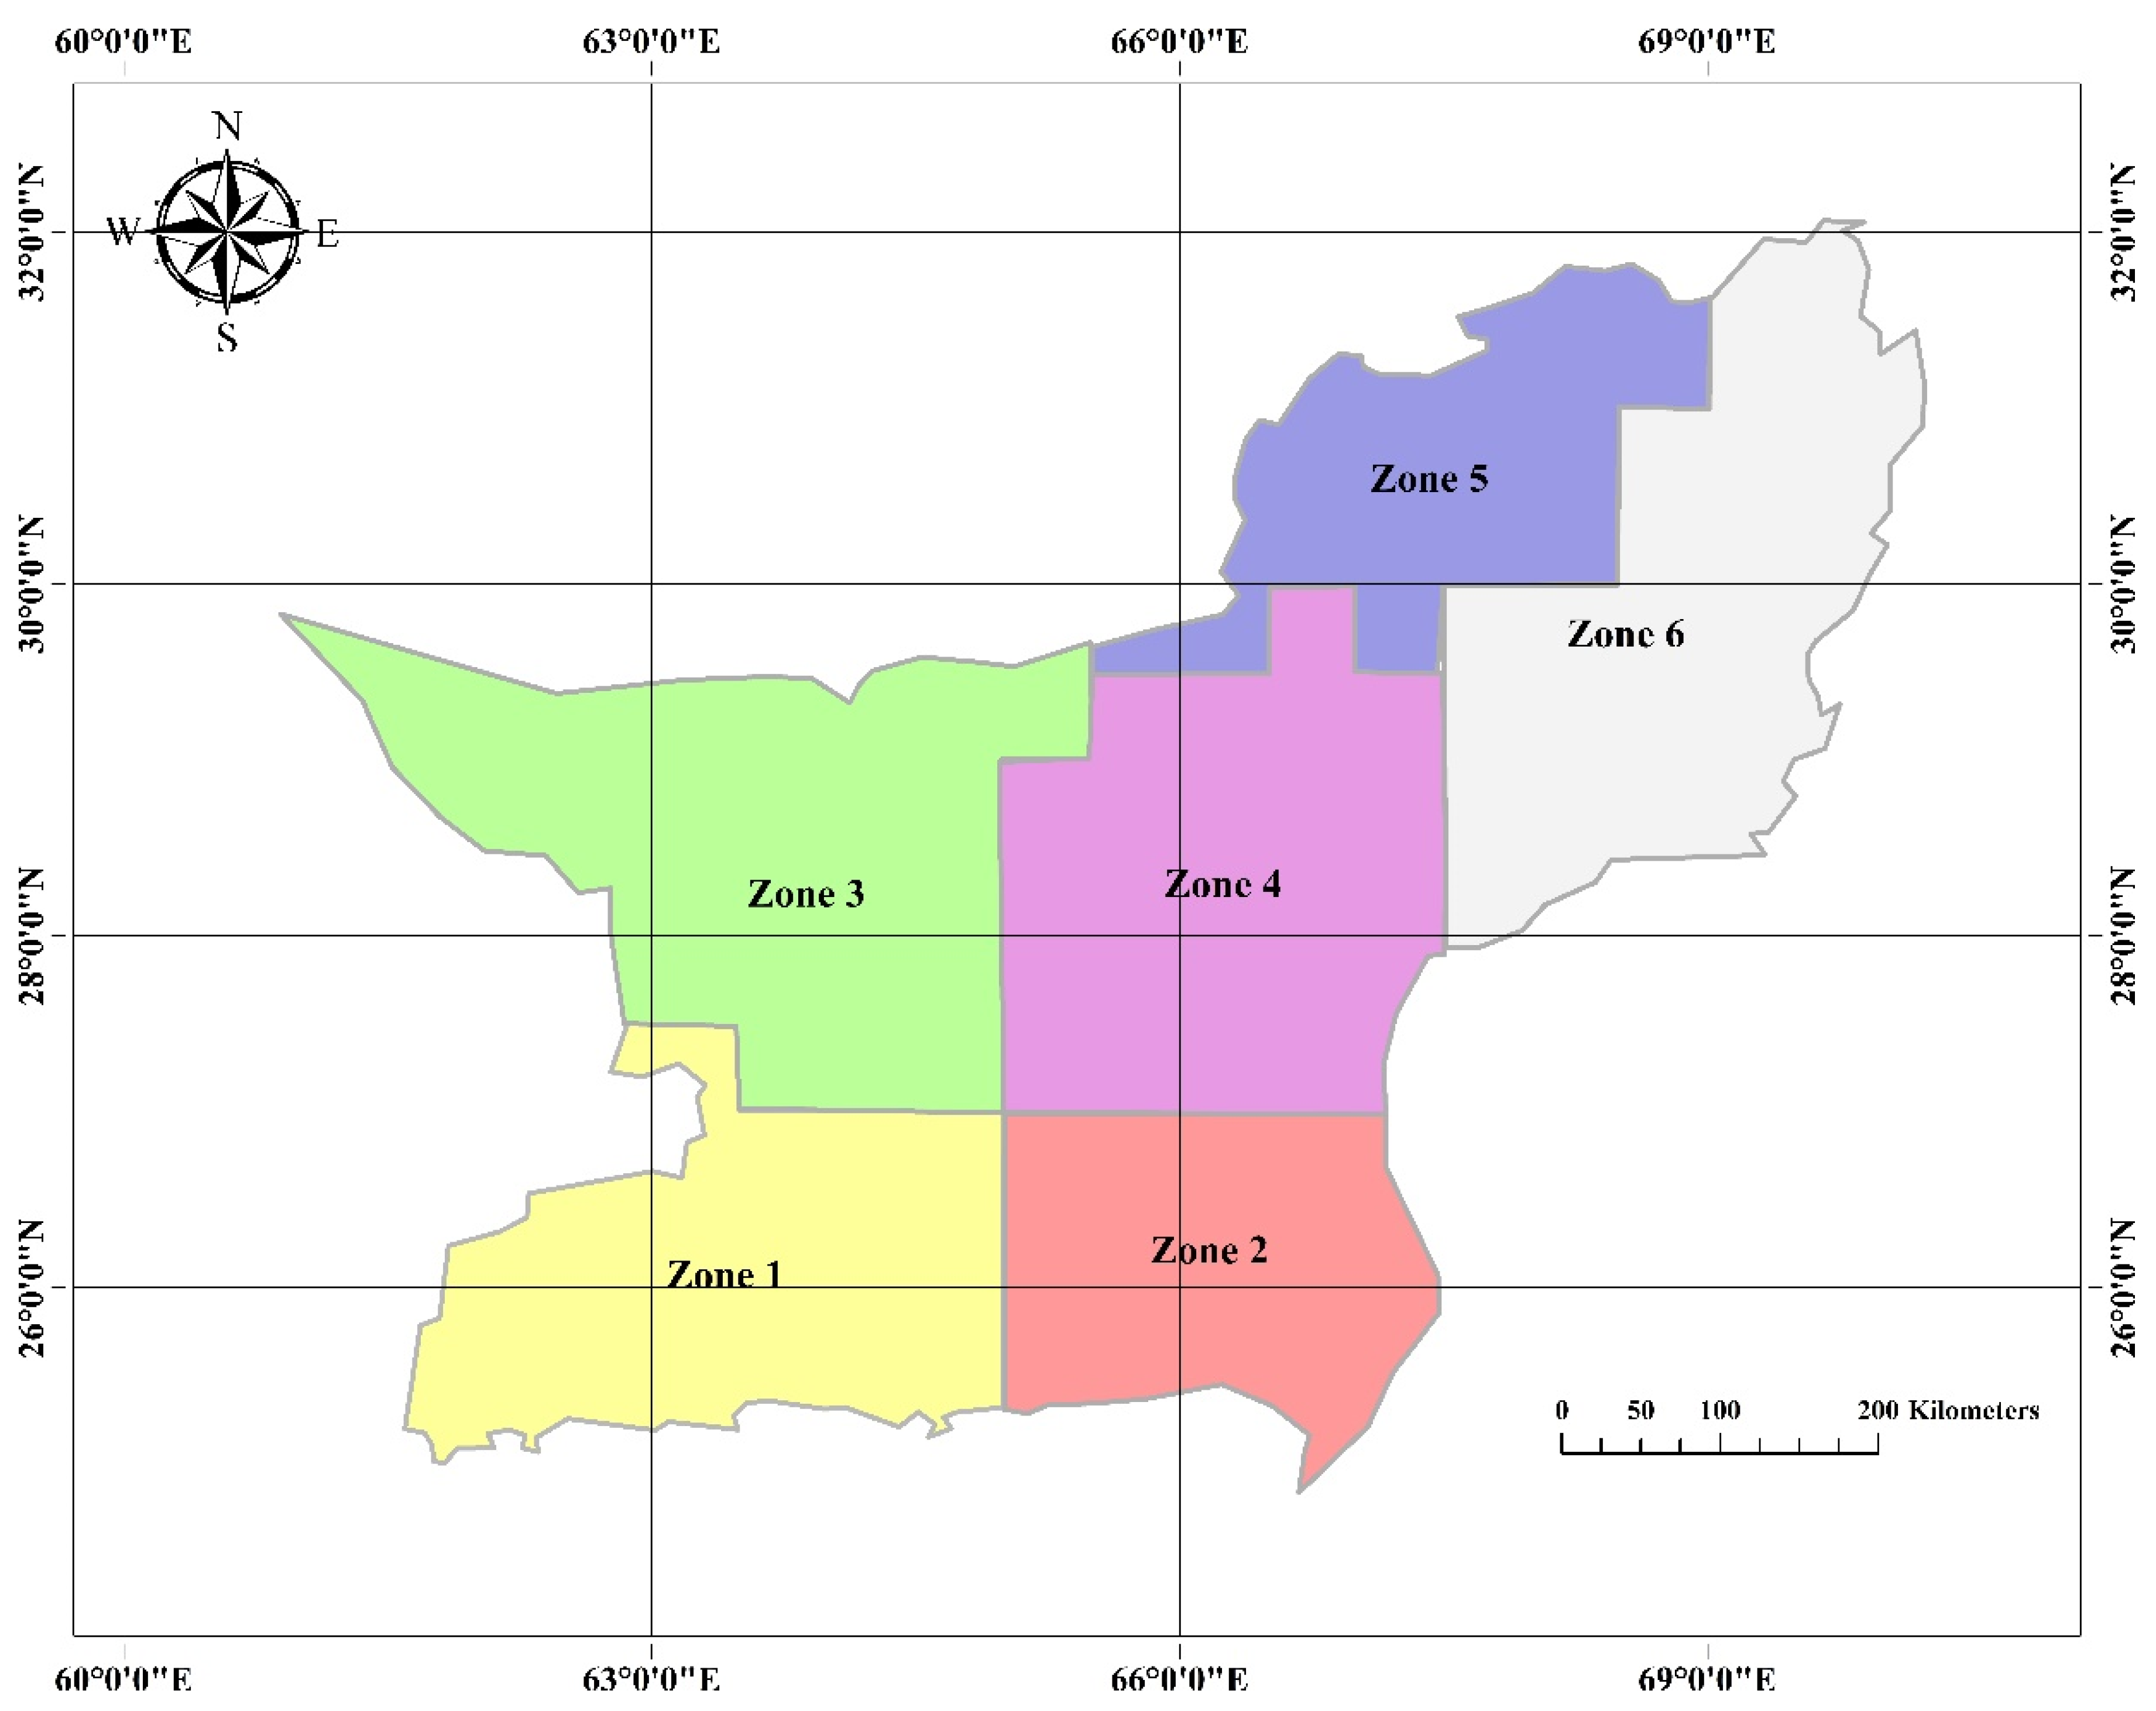
2.3. Drought Regionalization
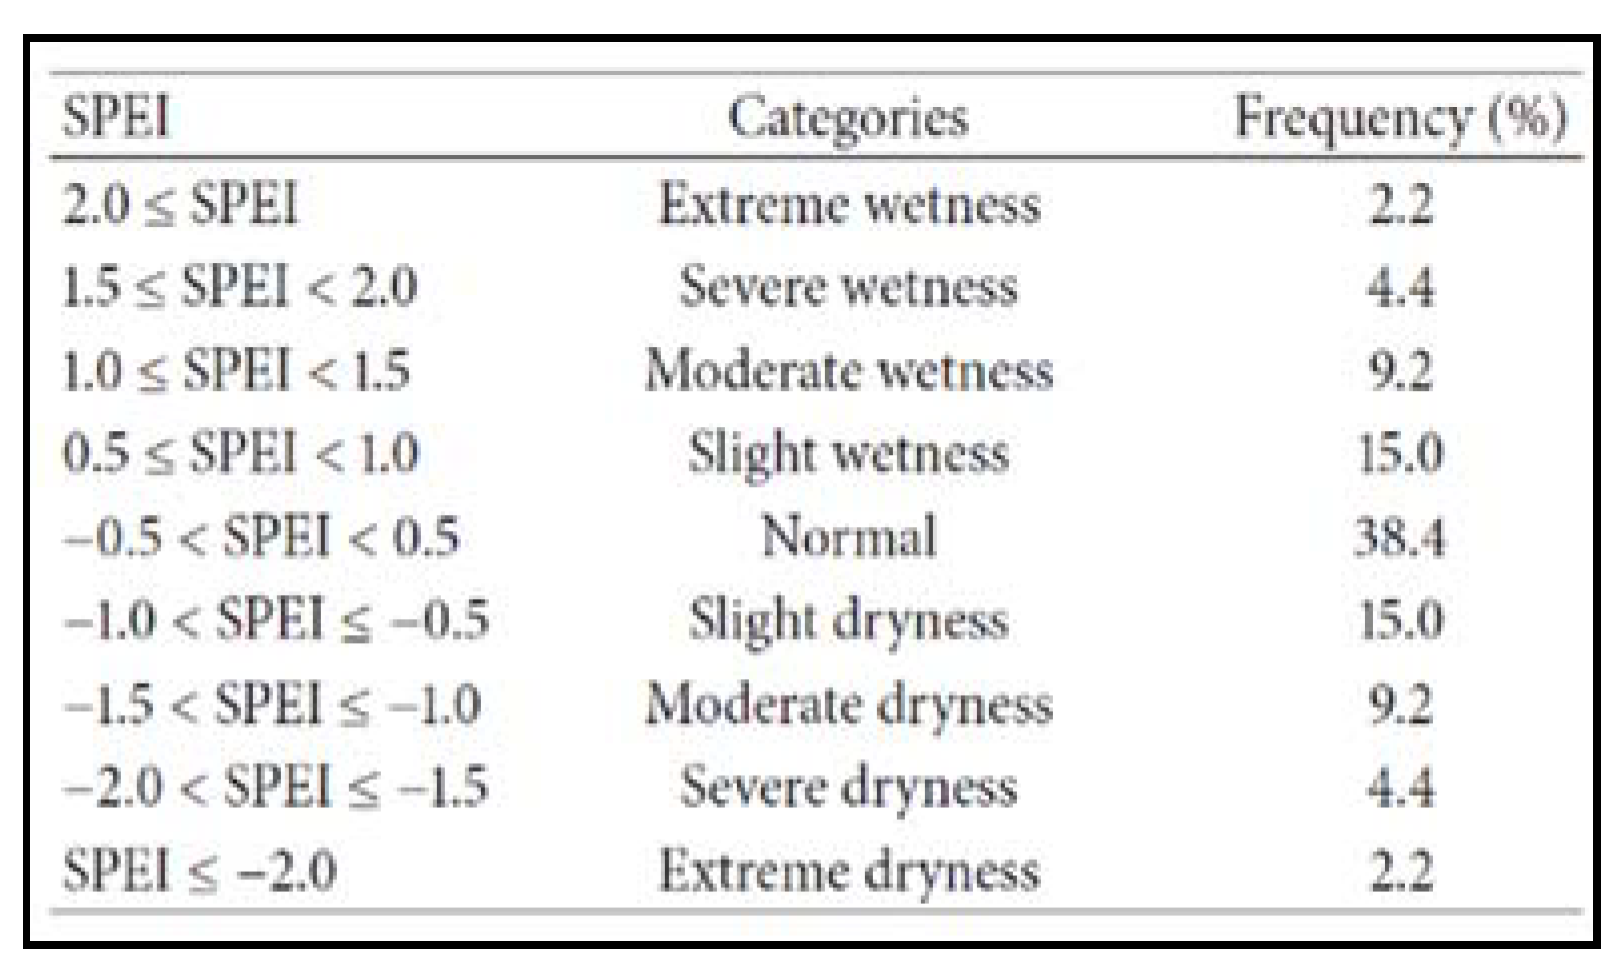
2.4. Drought Characterization
2.5. Drought Trends and Evolution
3. Results
3.1. Drought Regionalization
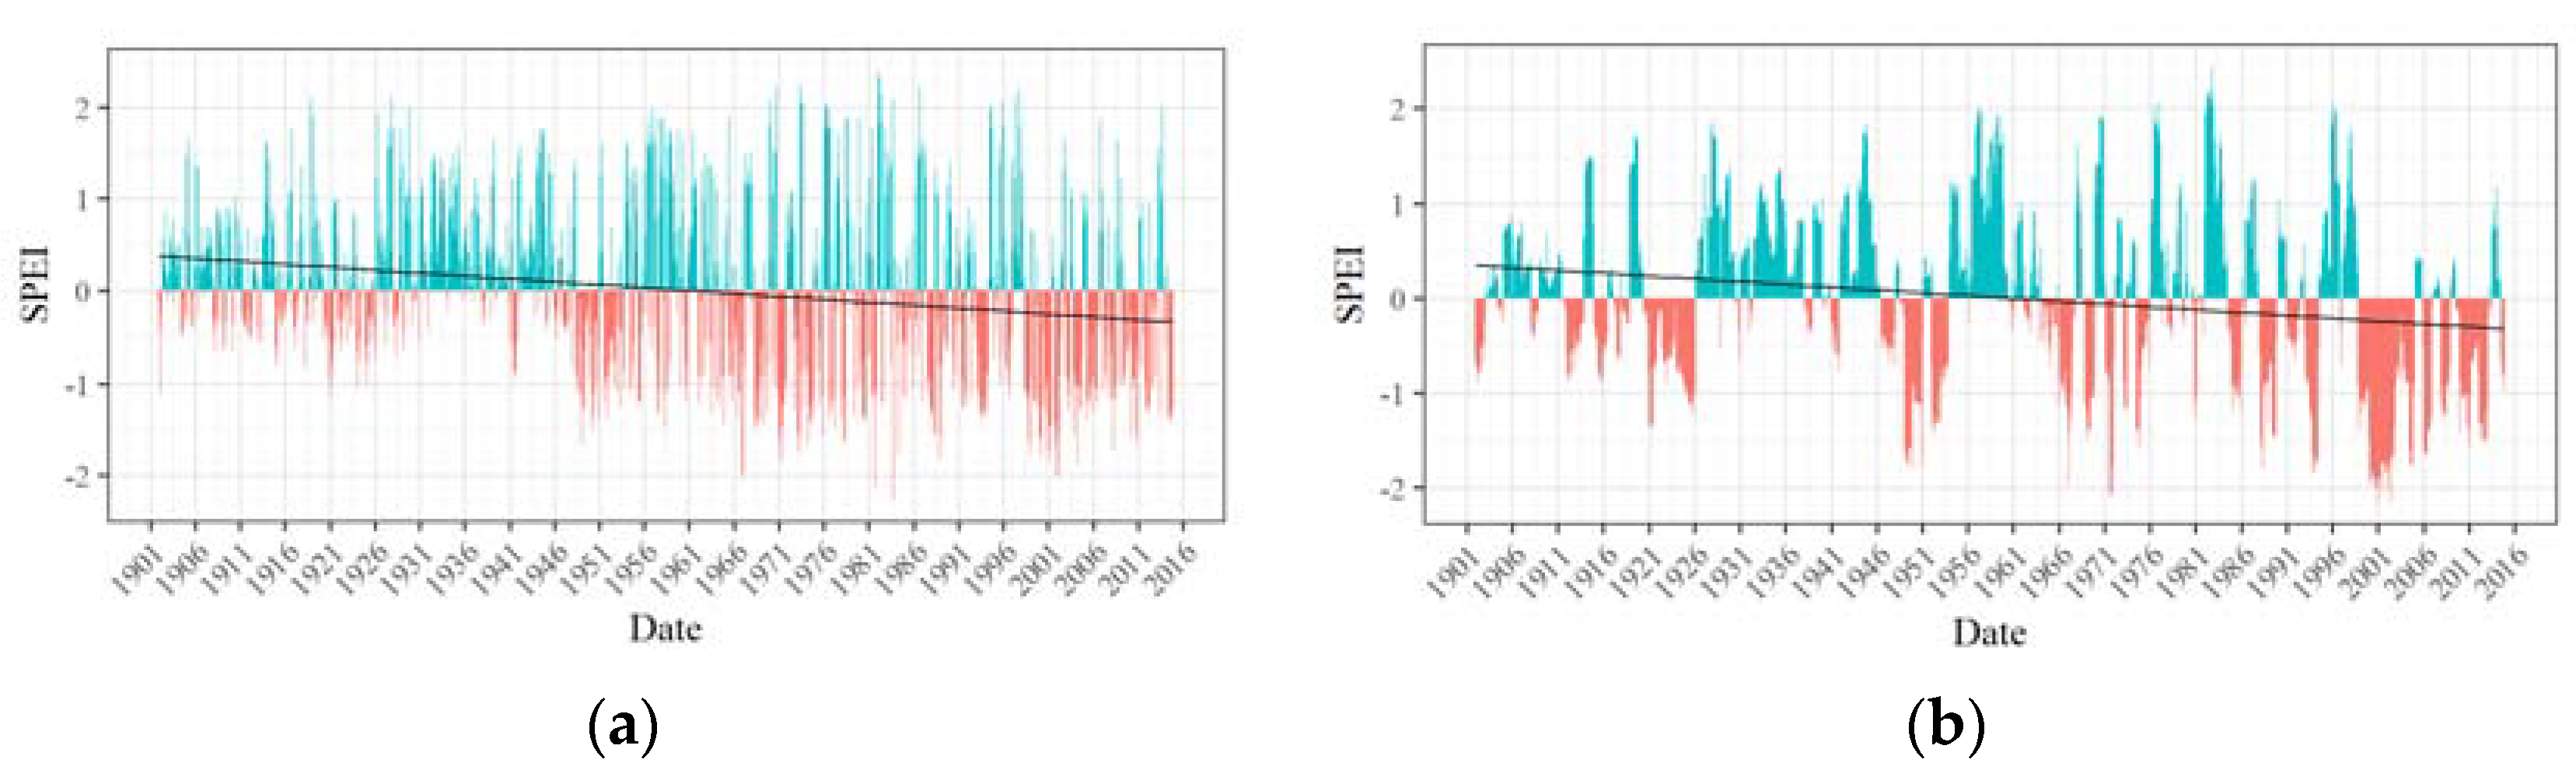
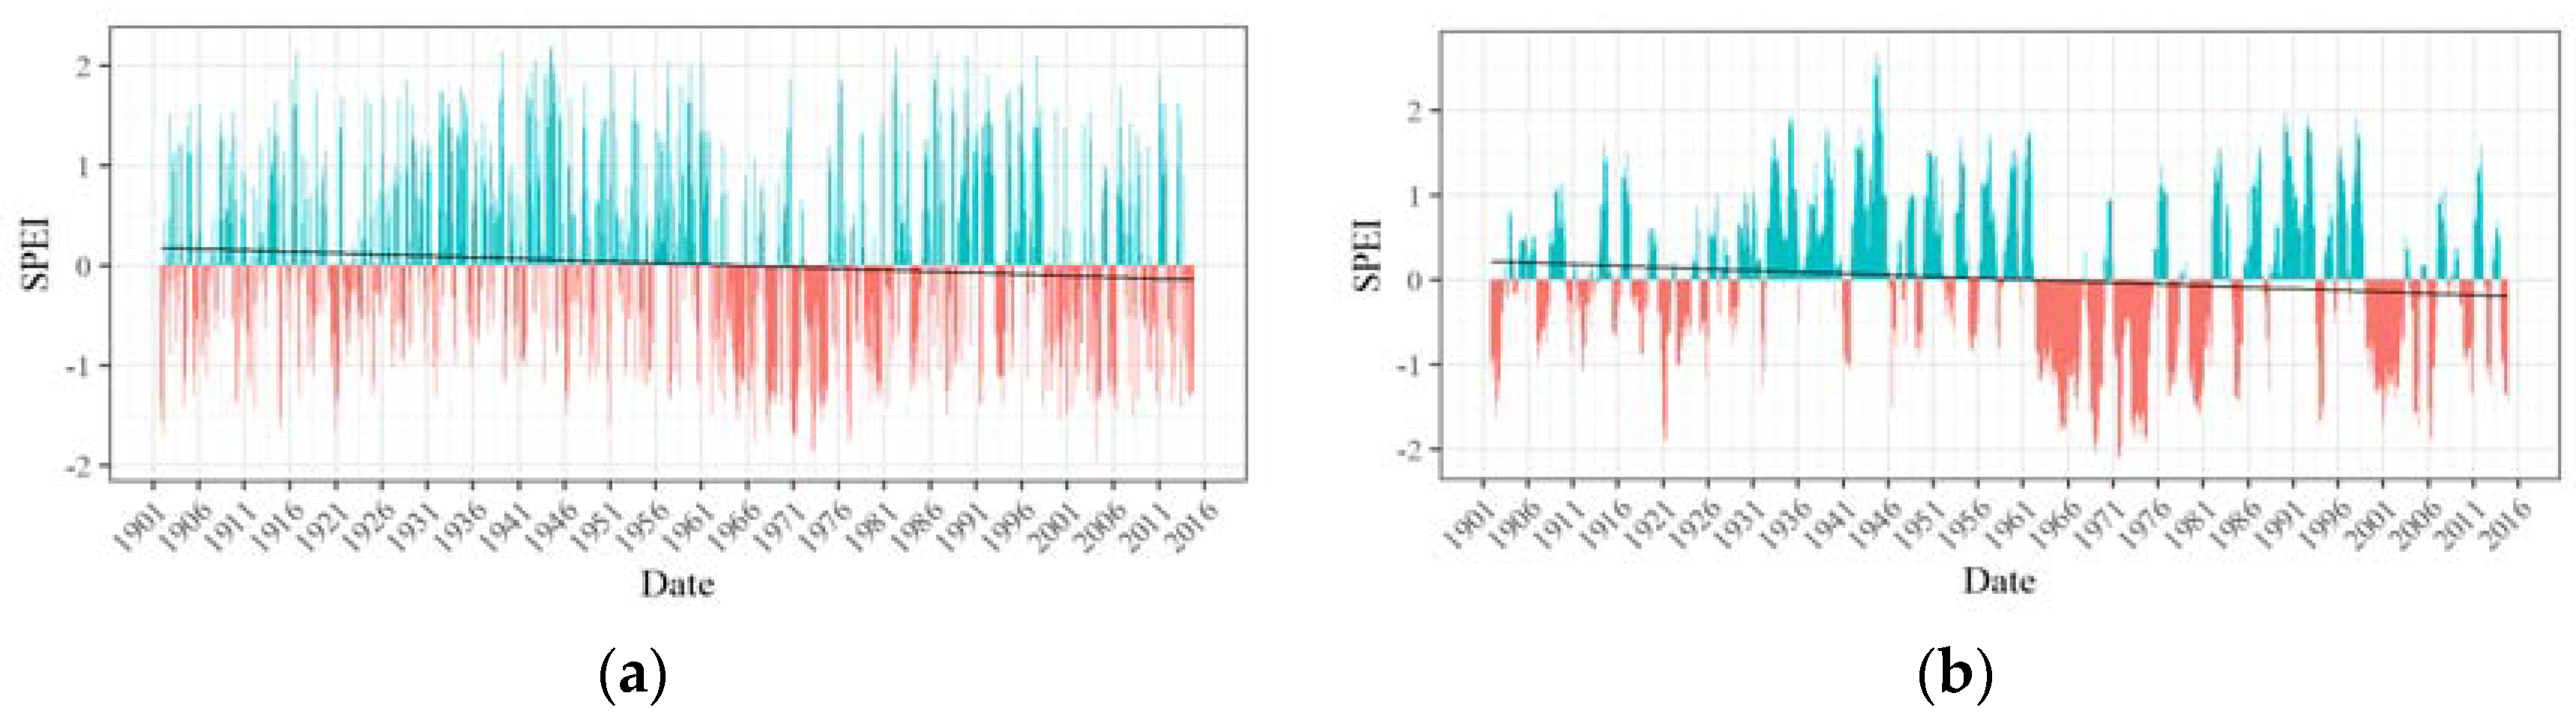
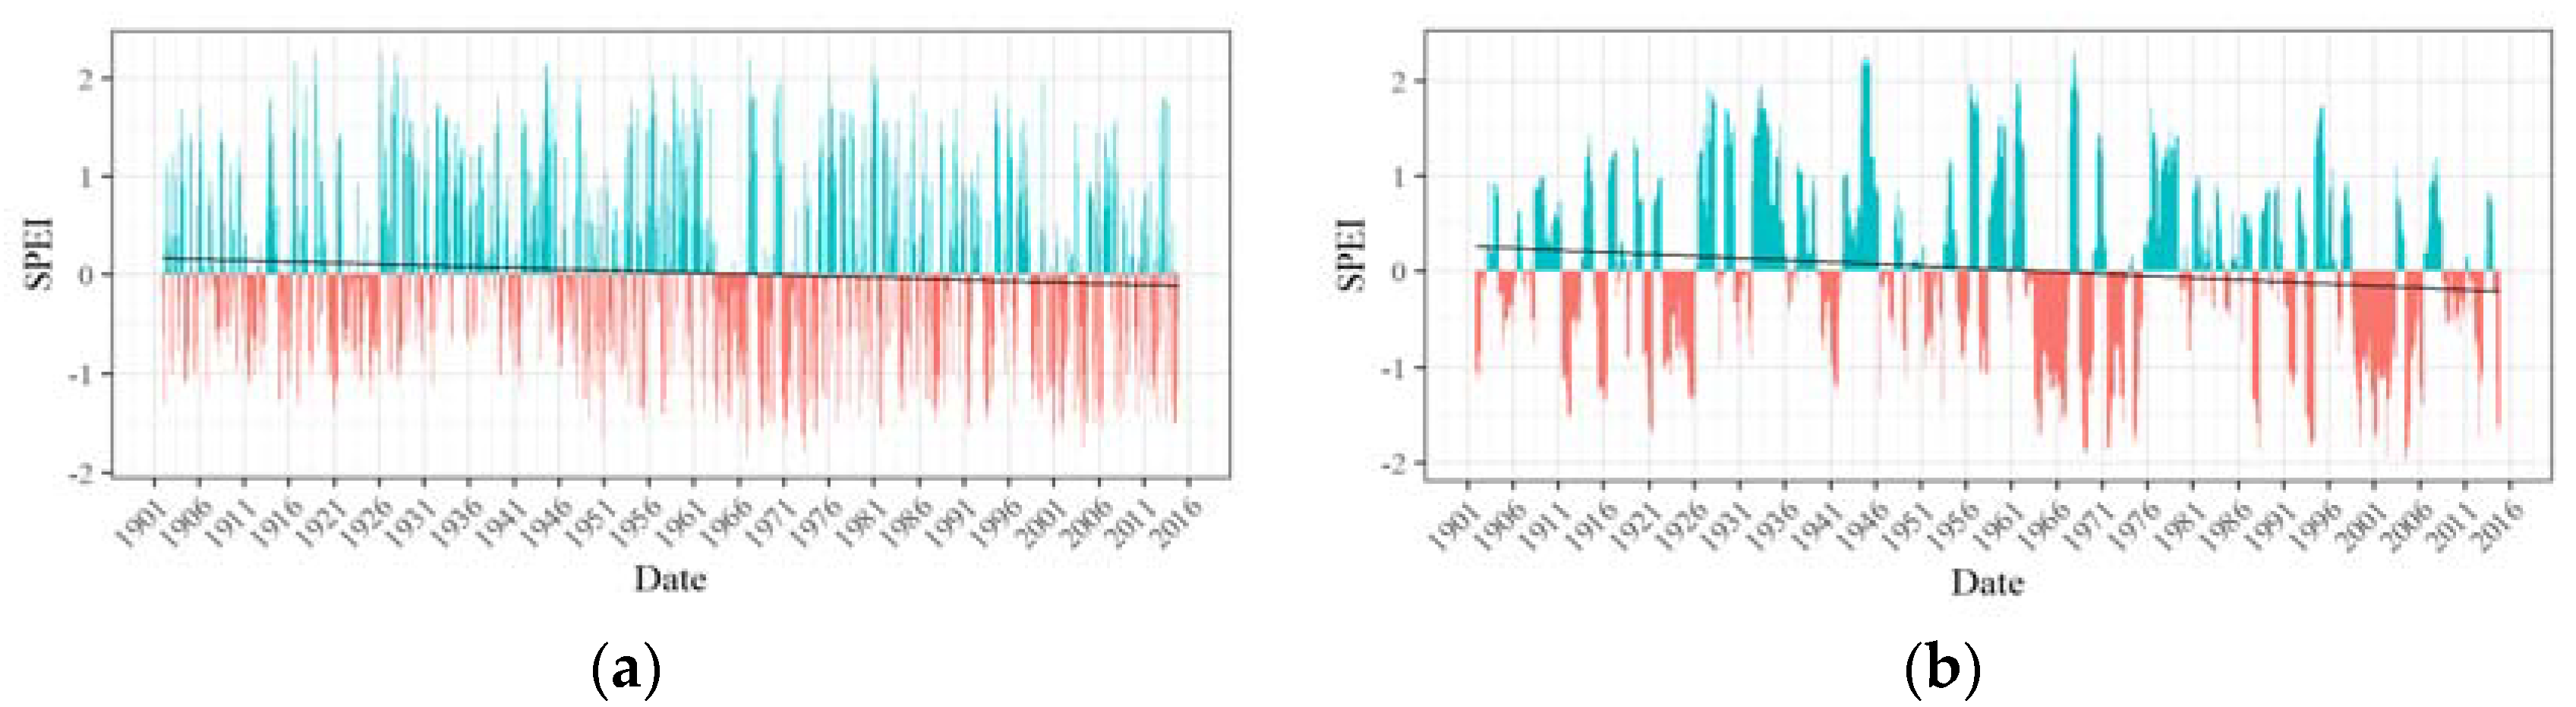
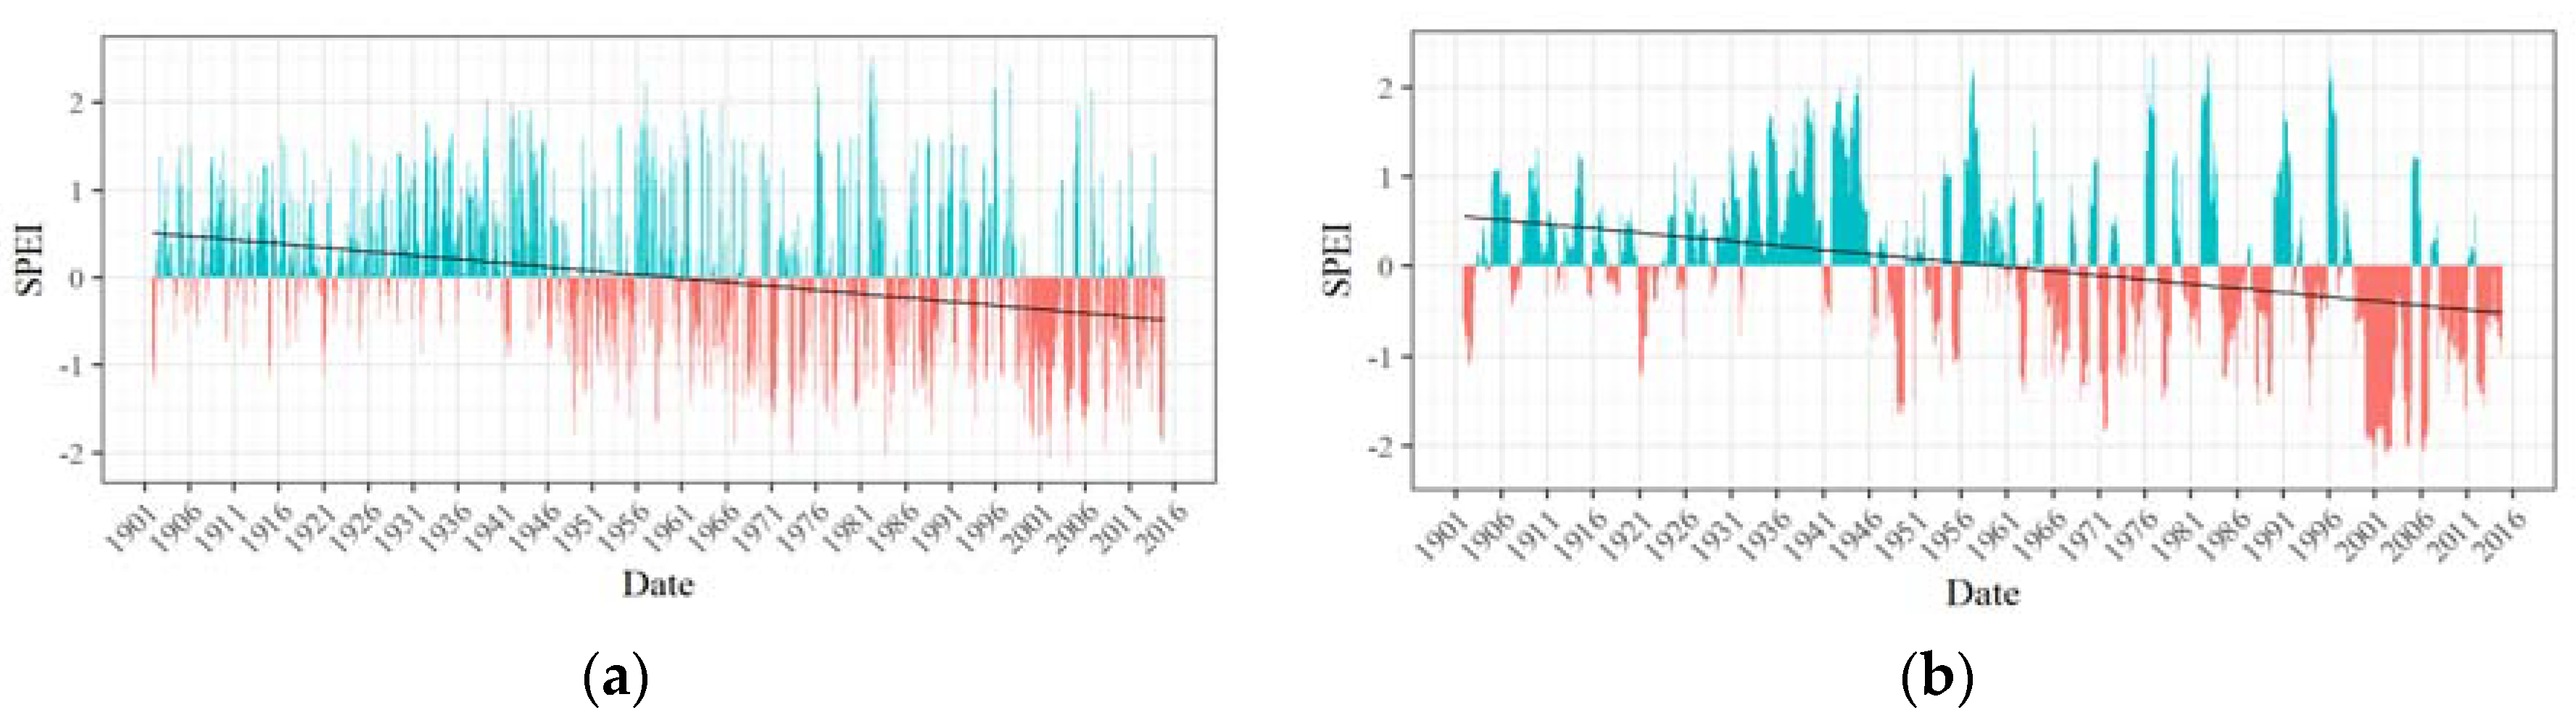
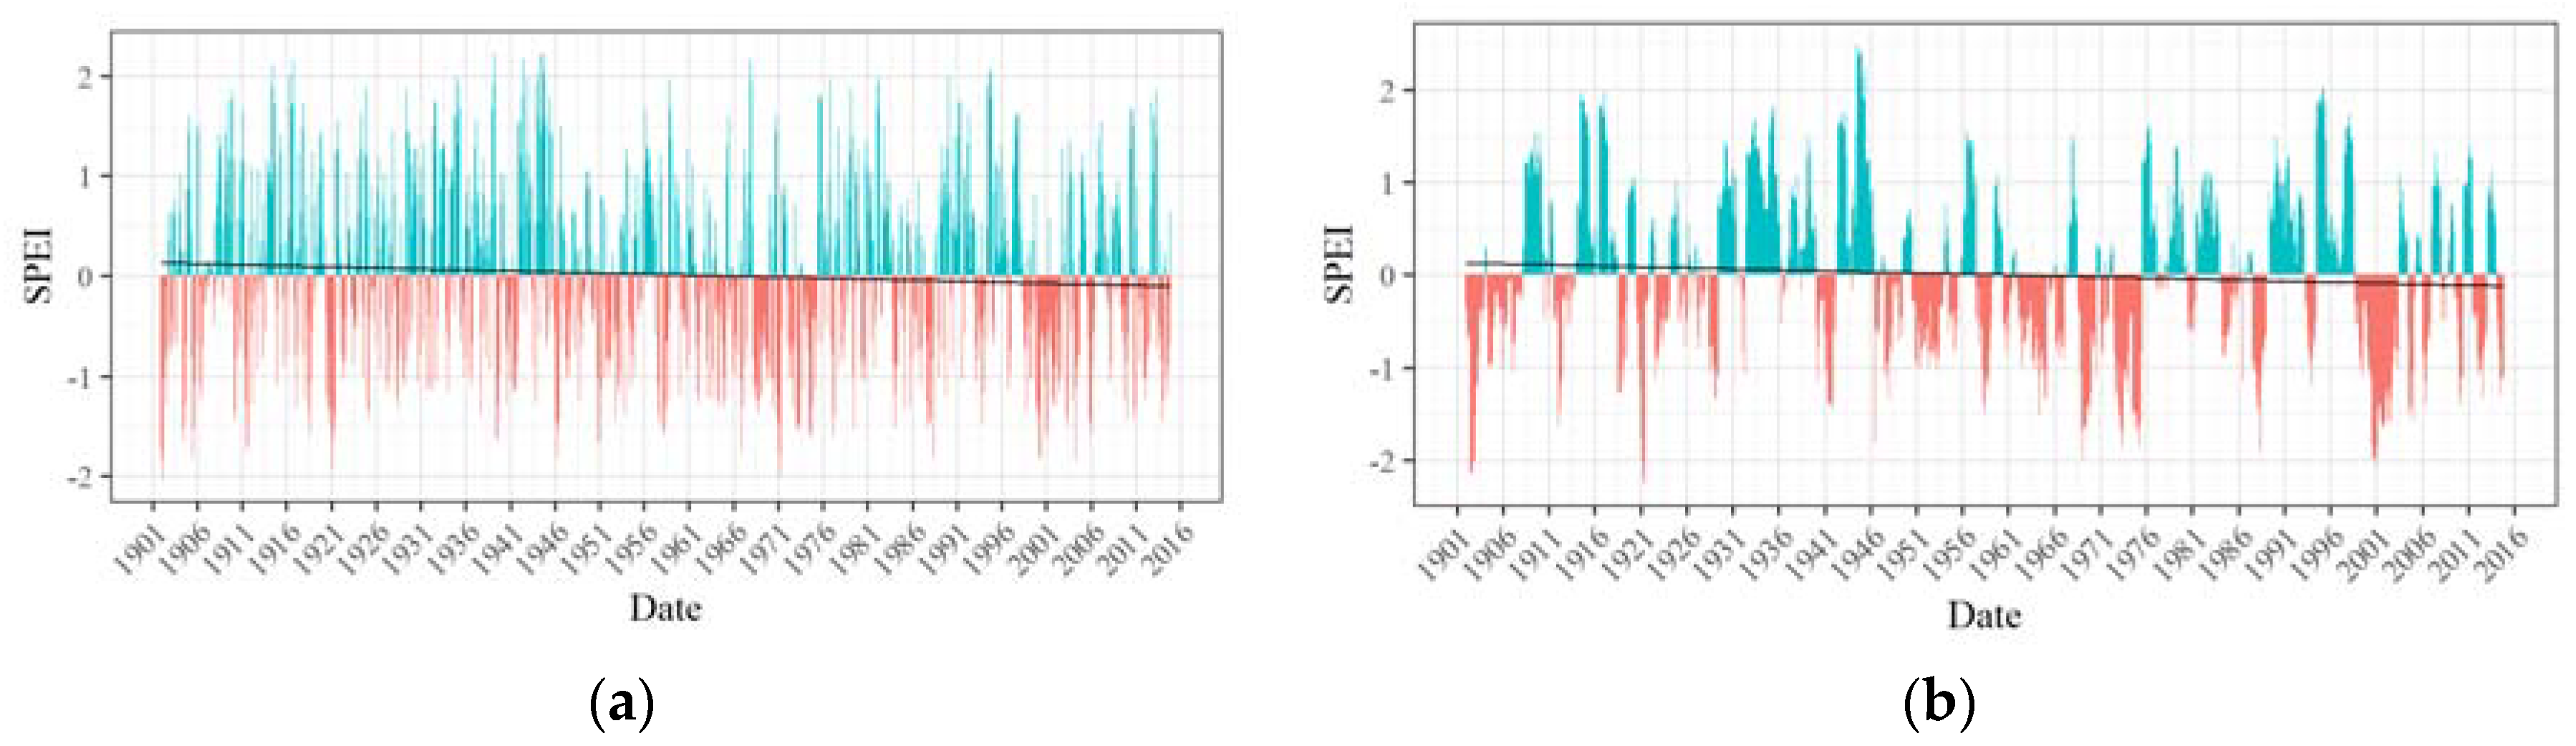
3.2. 3-Month and 12-Month SPEI Time Series
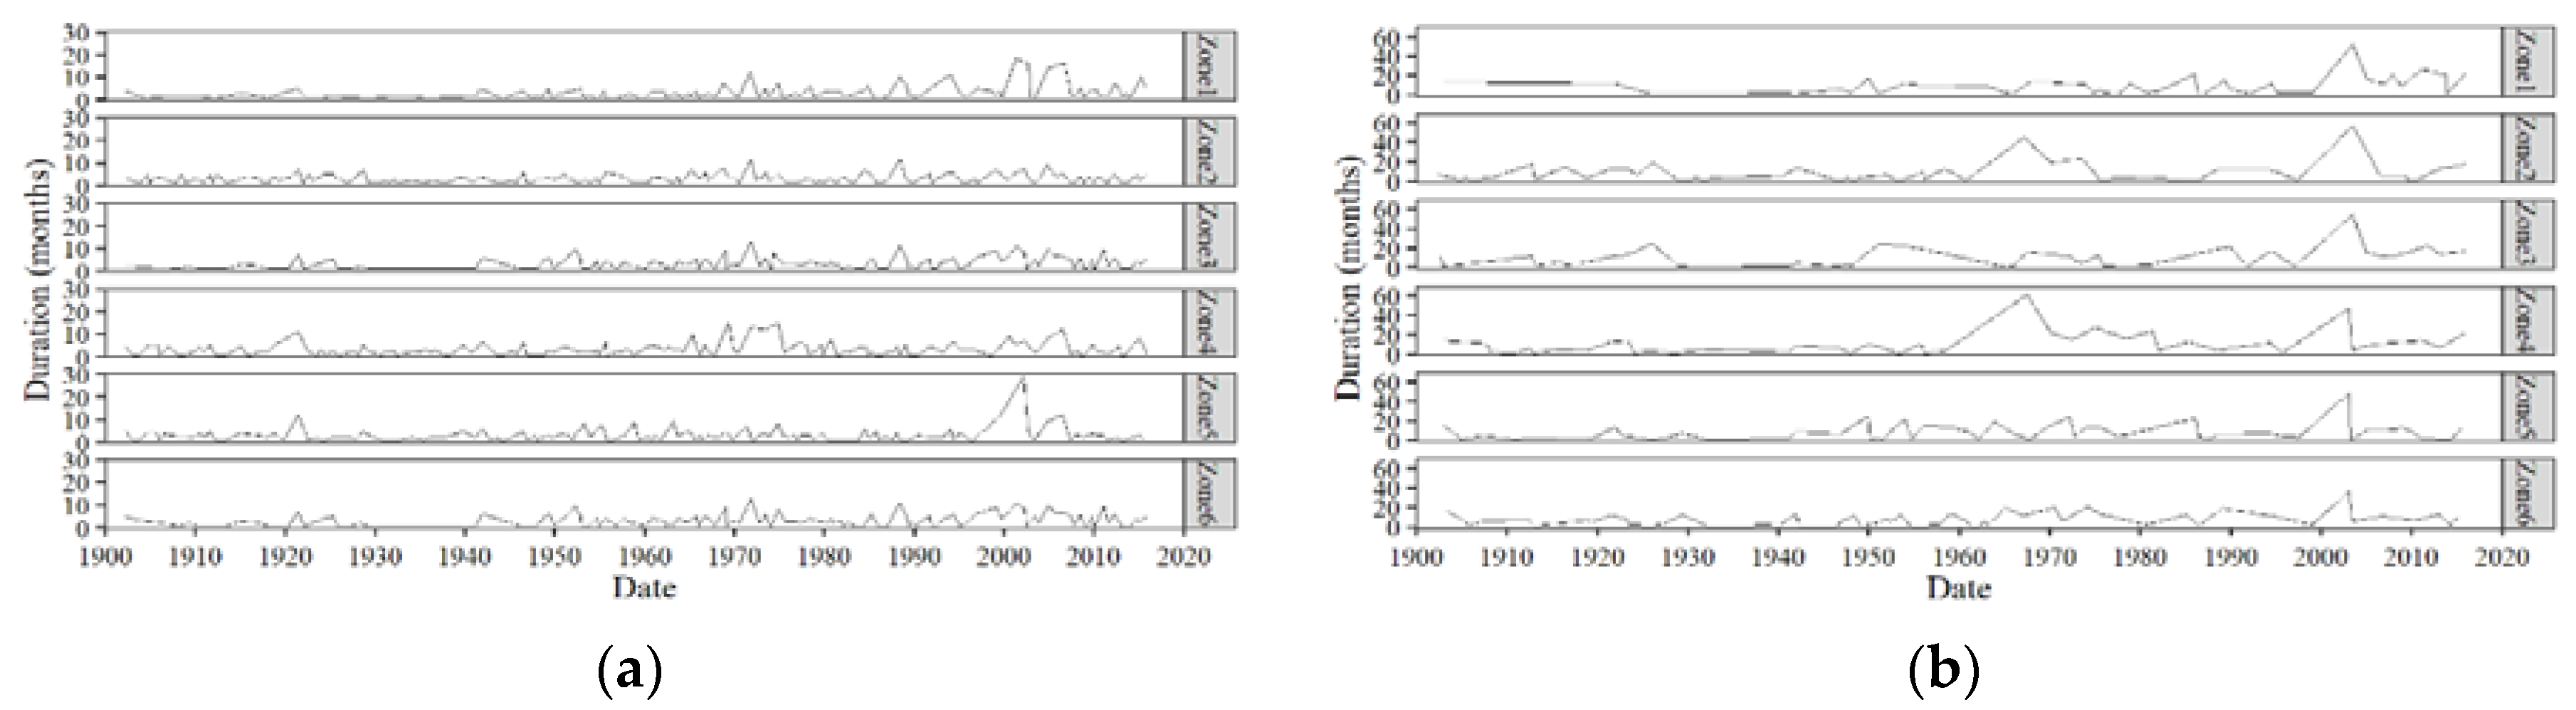
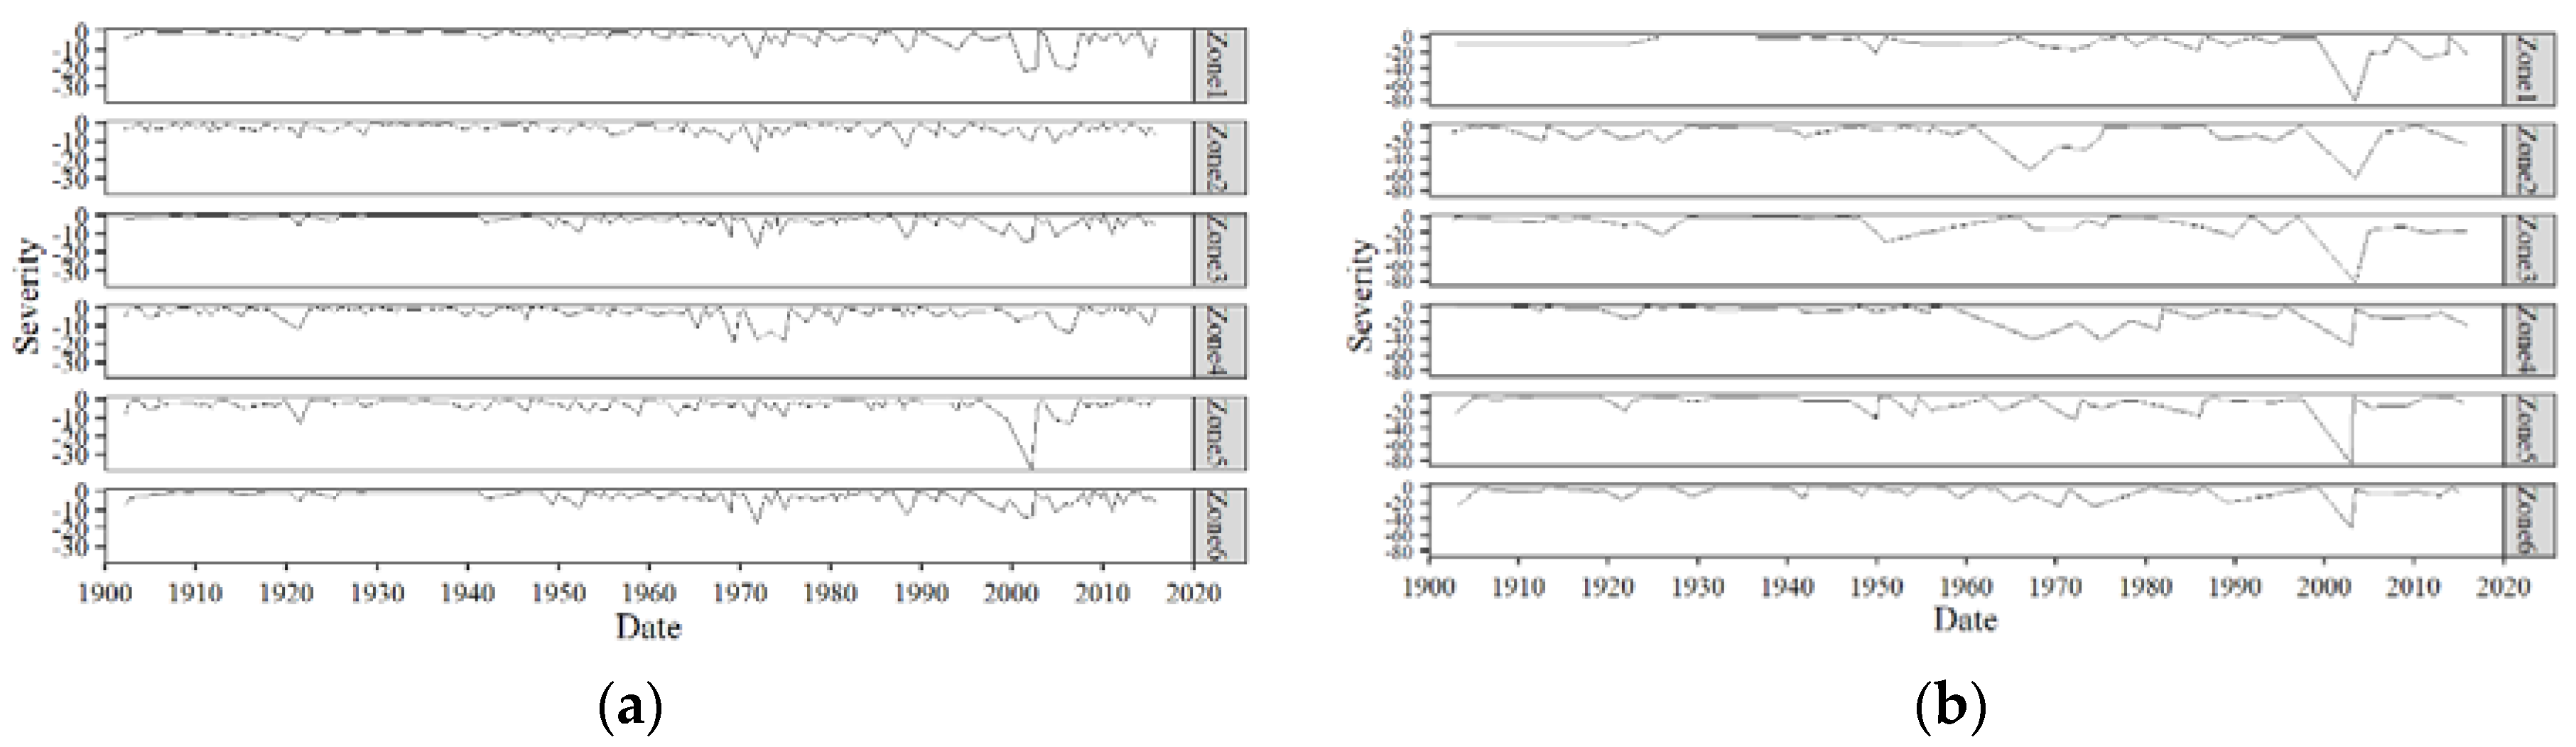
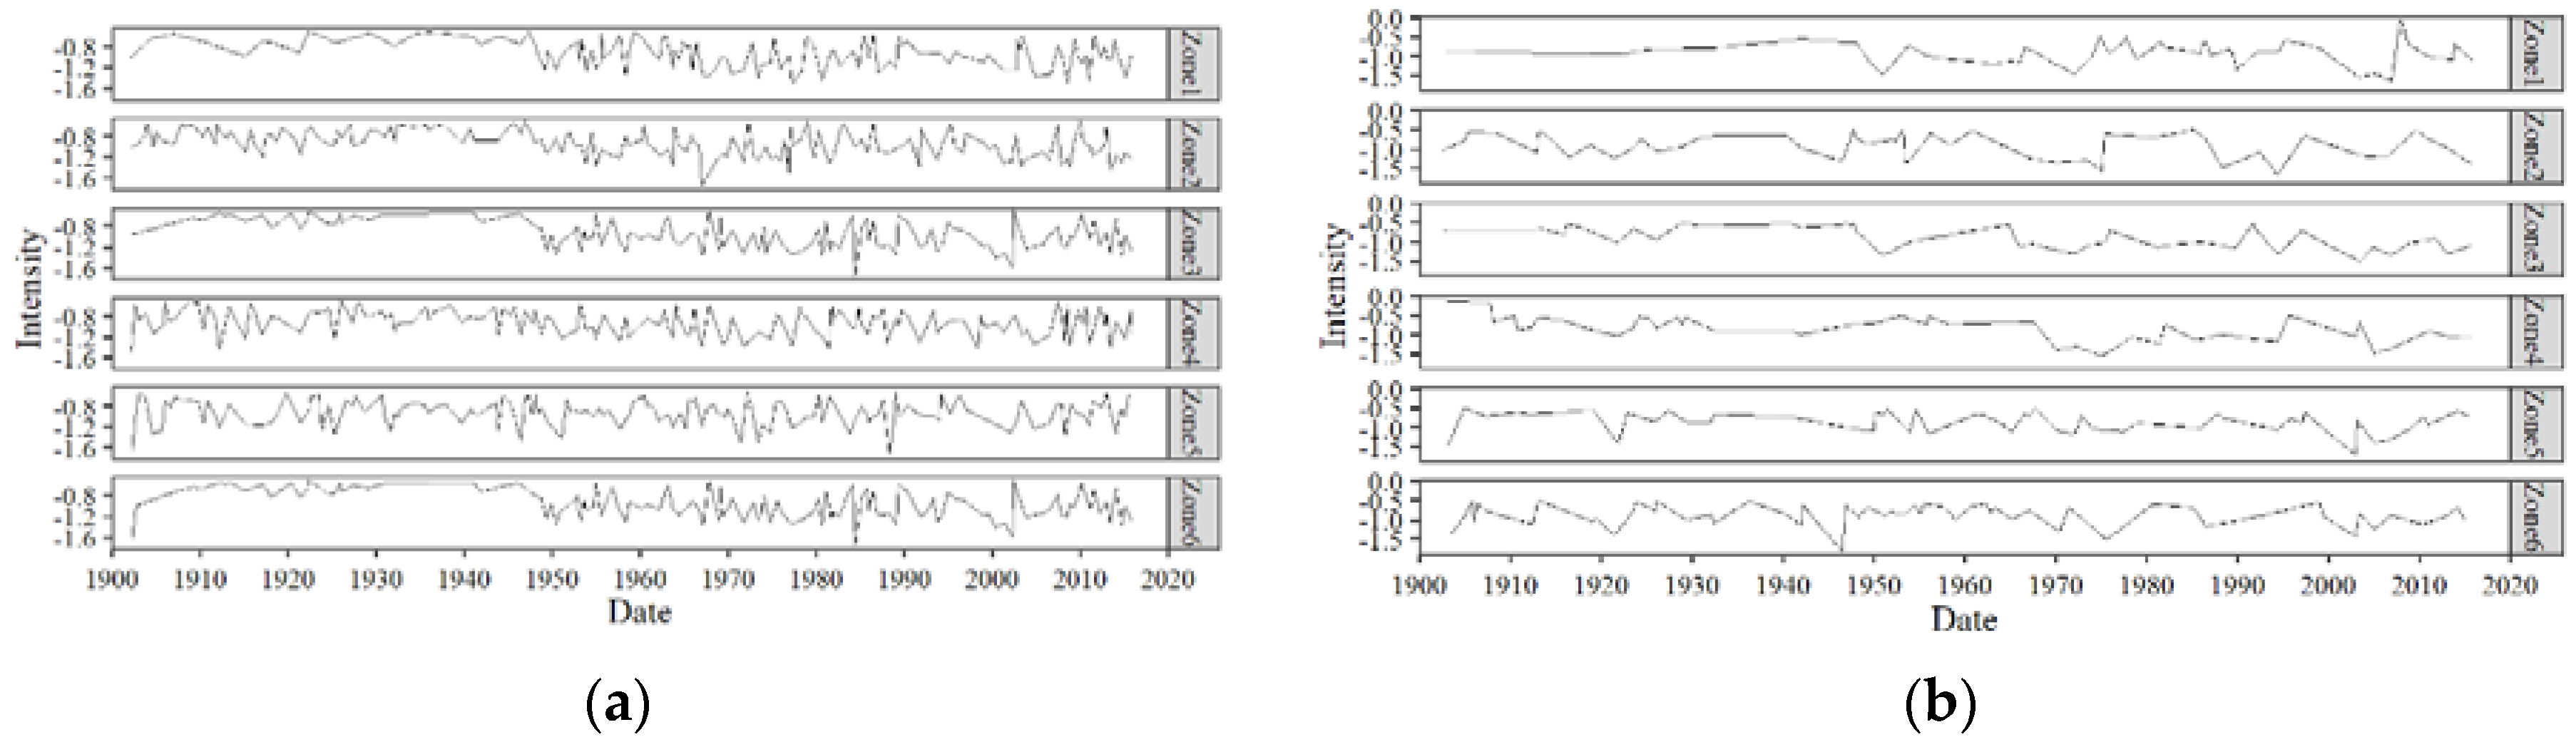
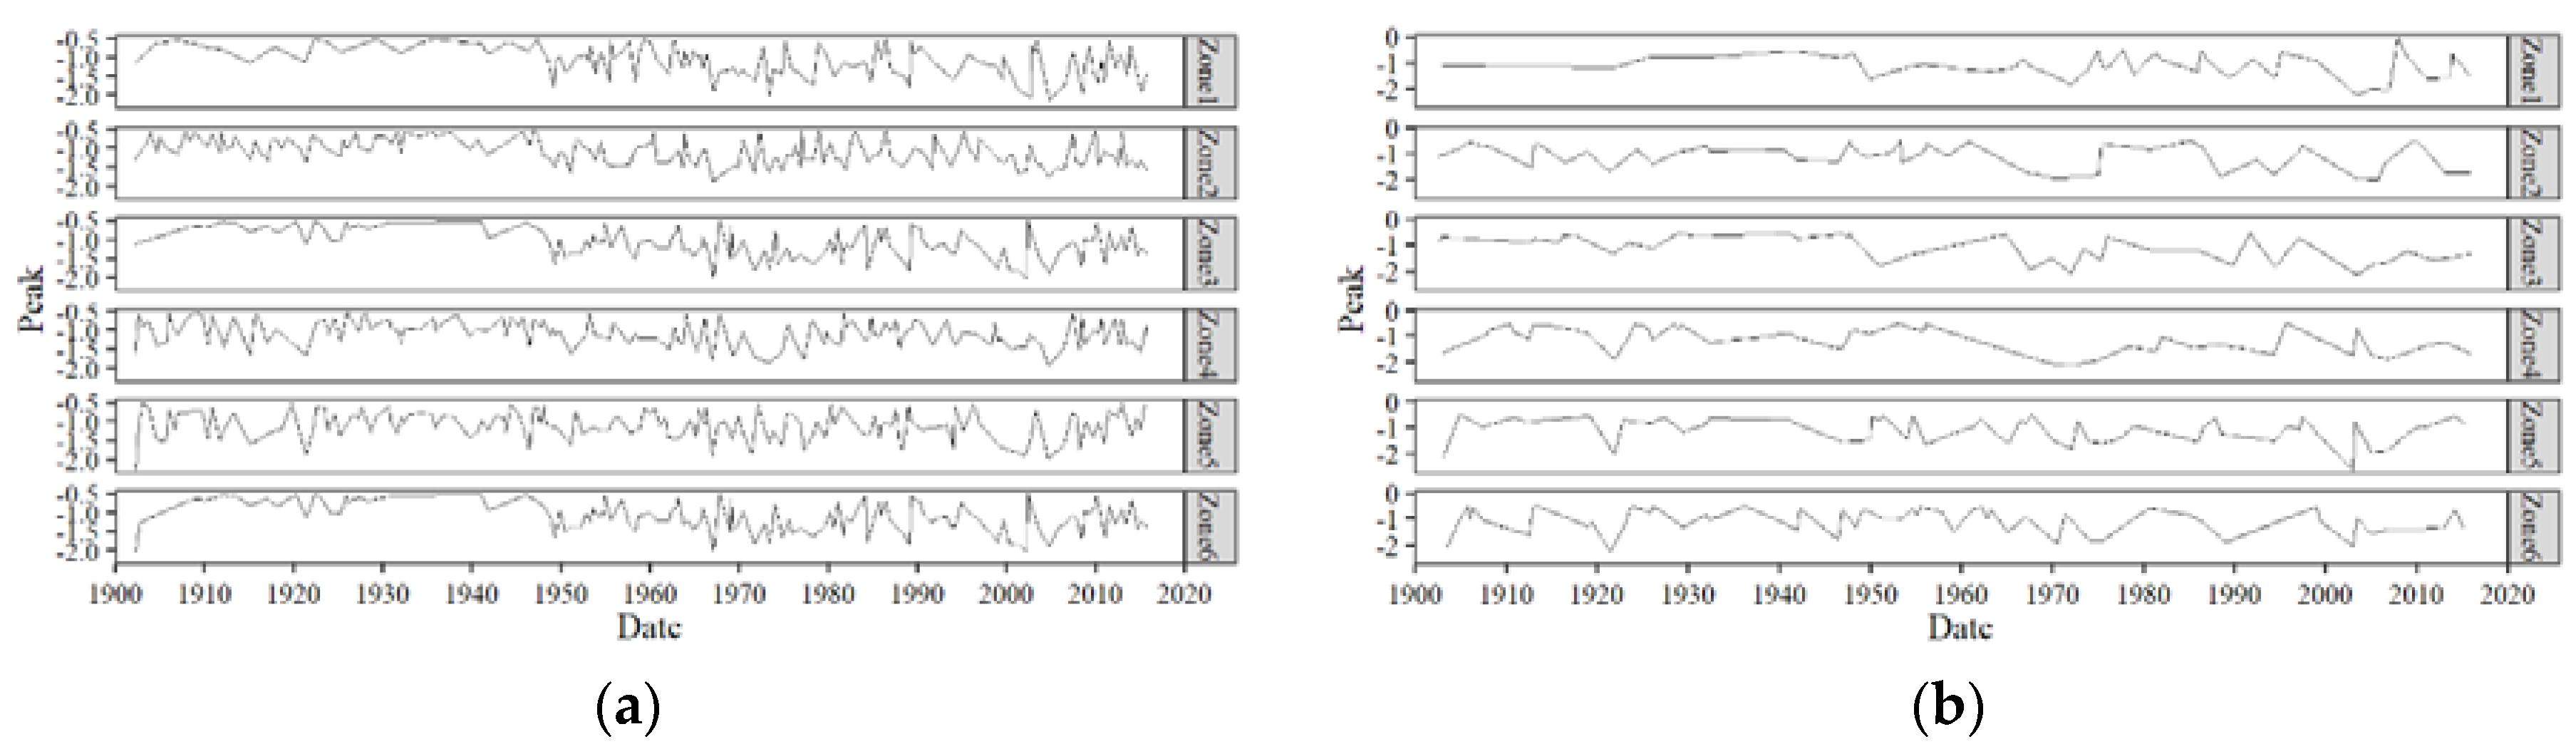
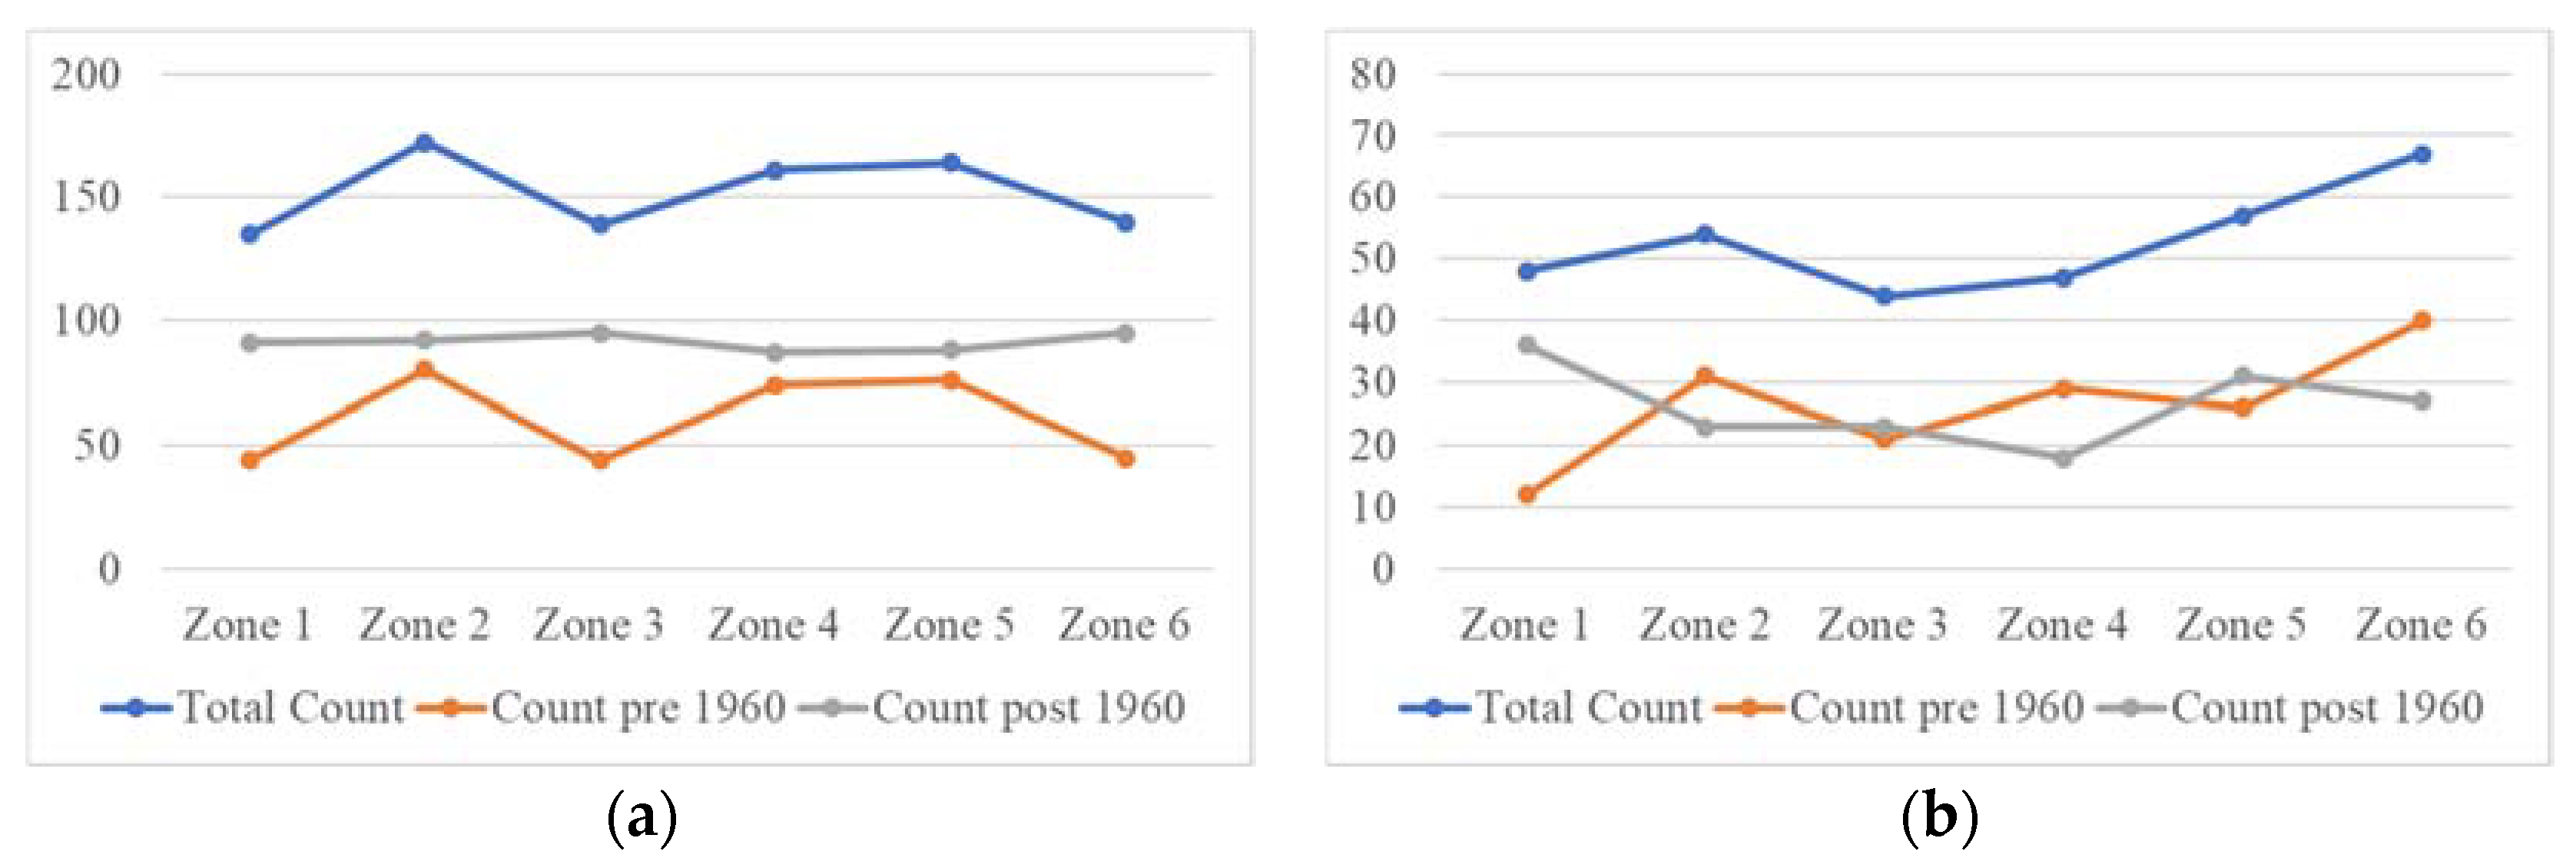
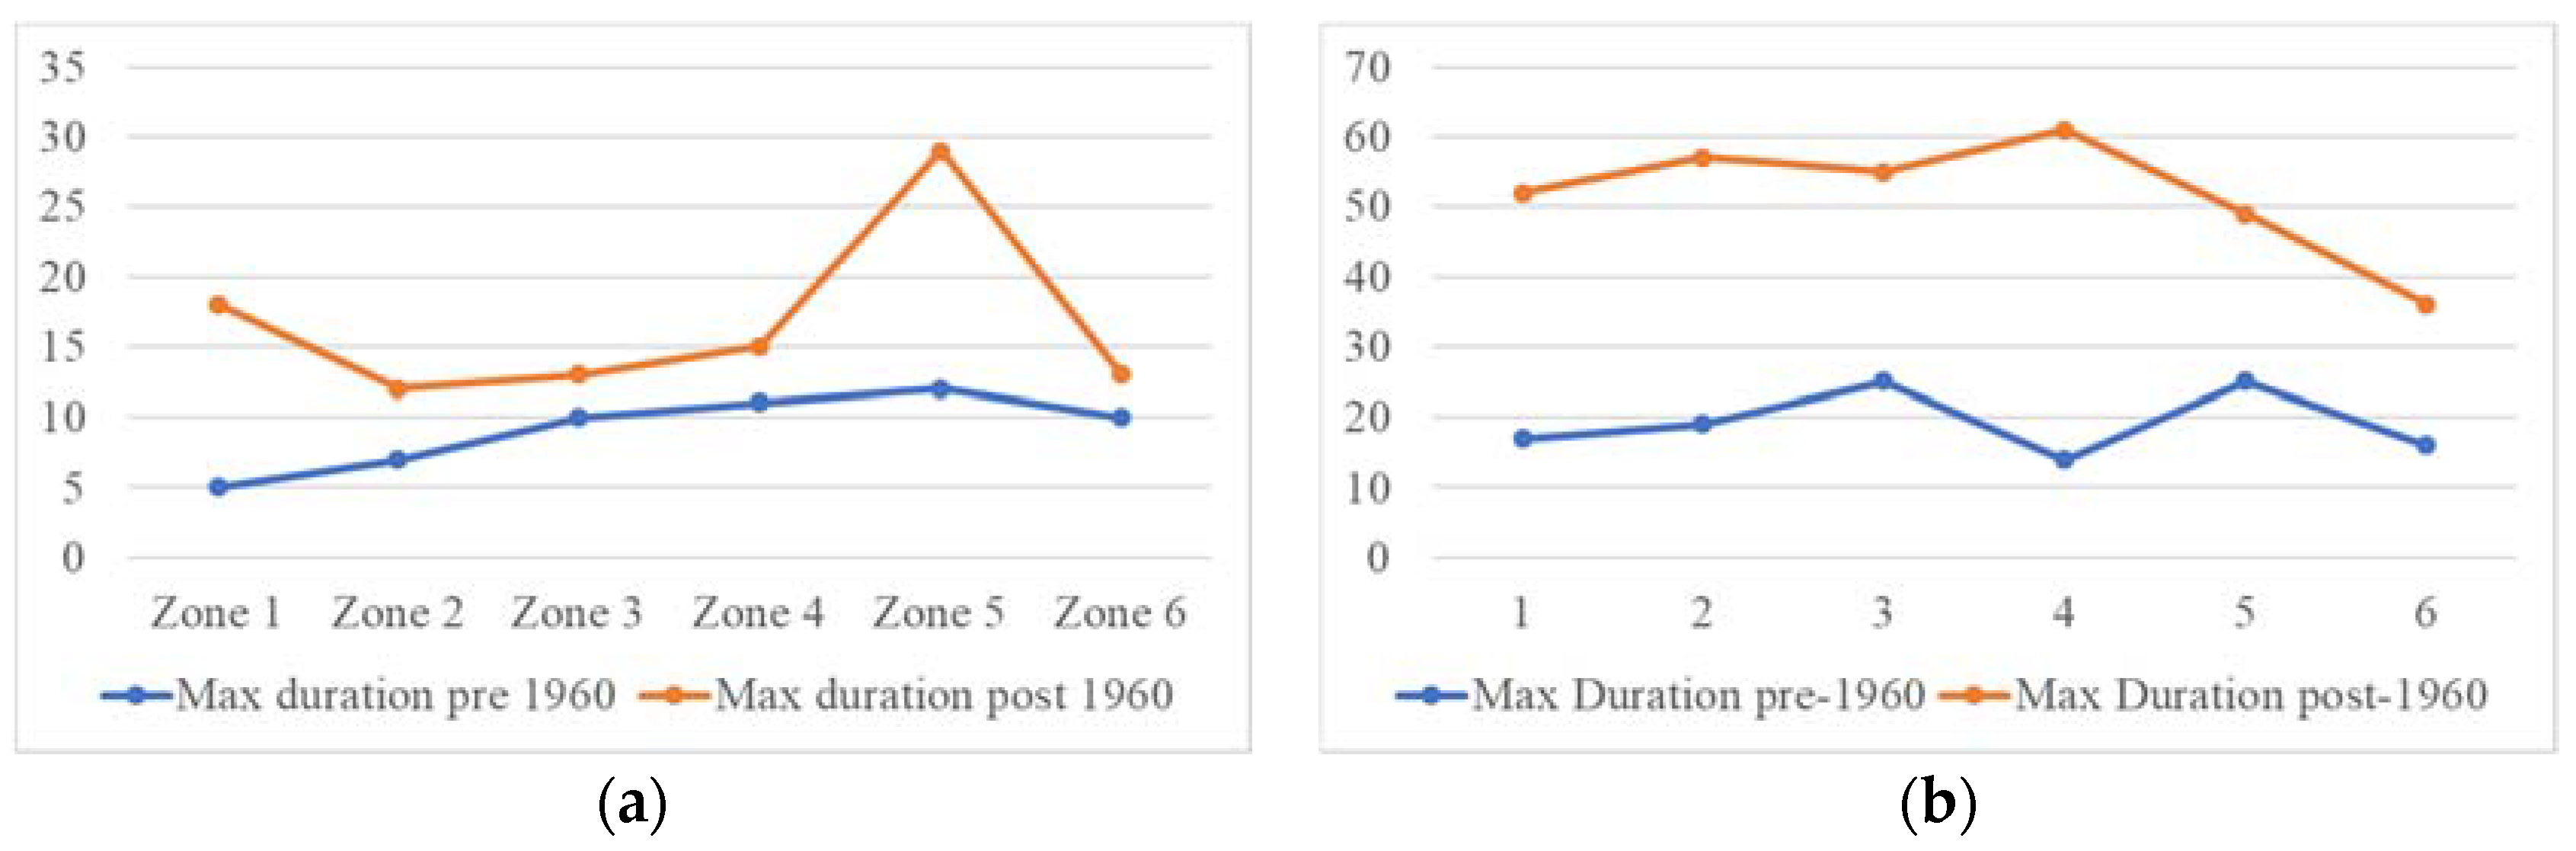
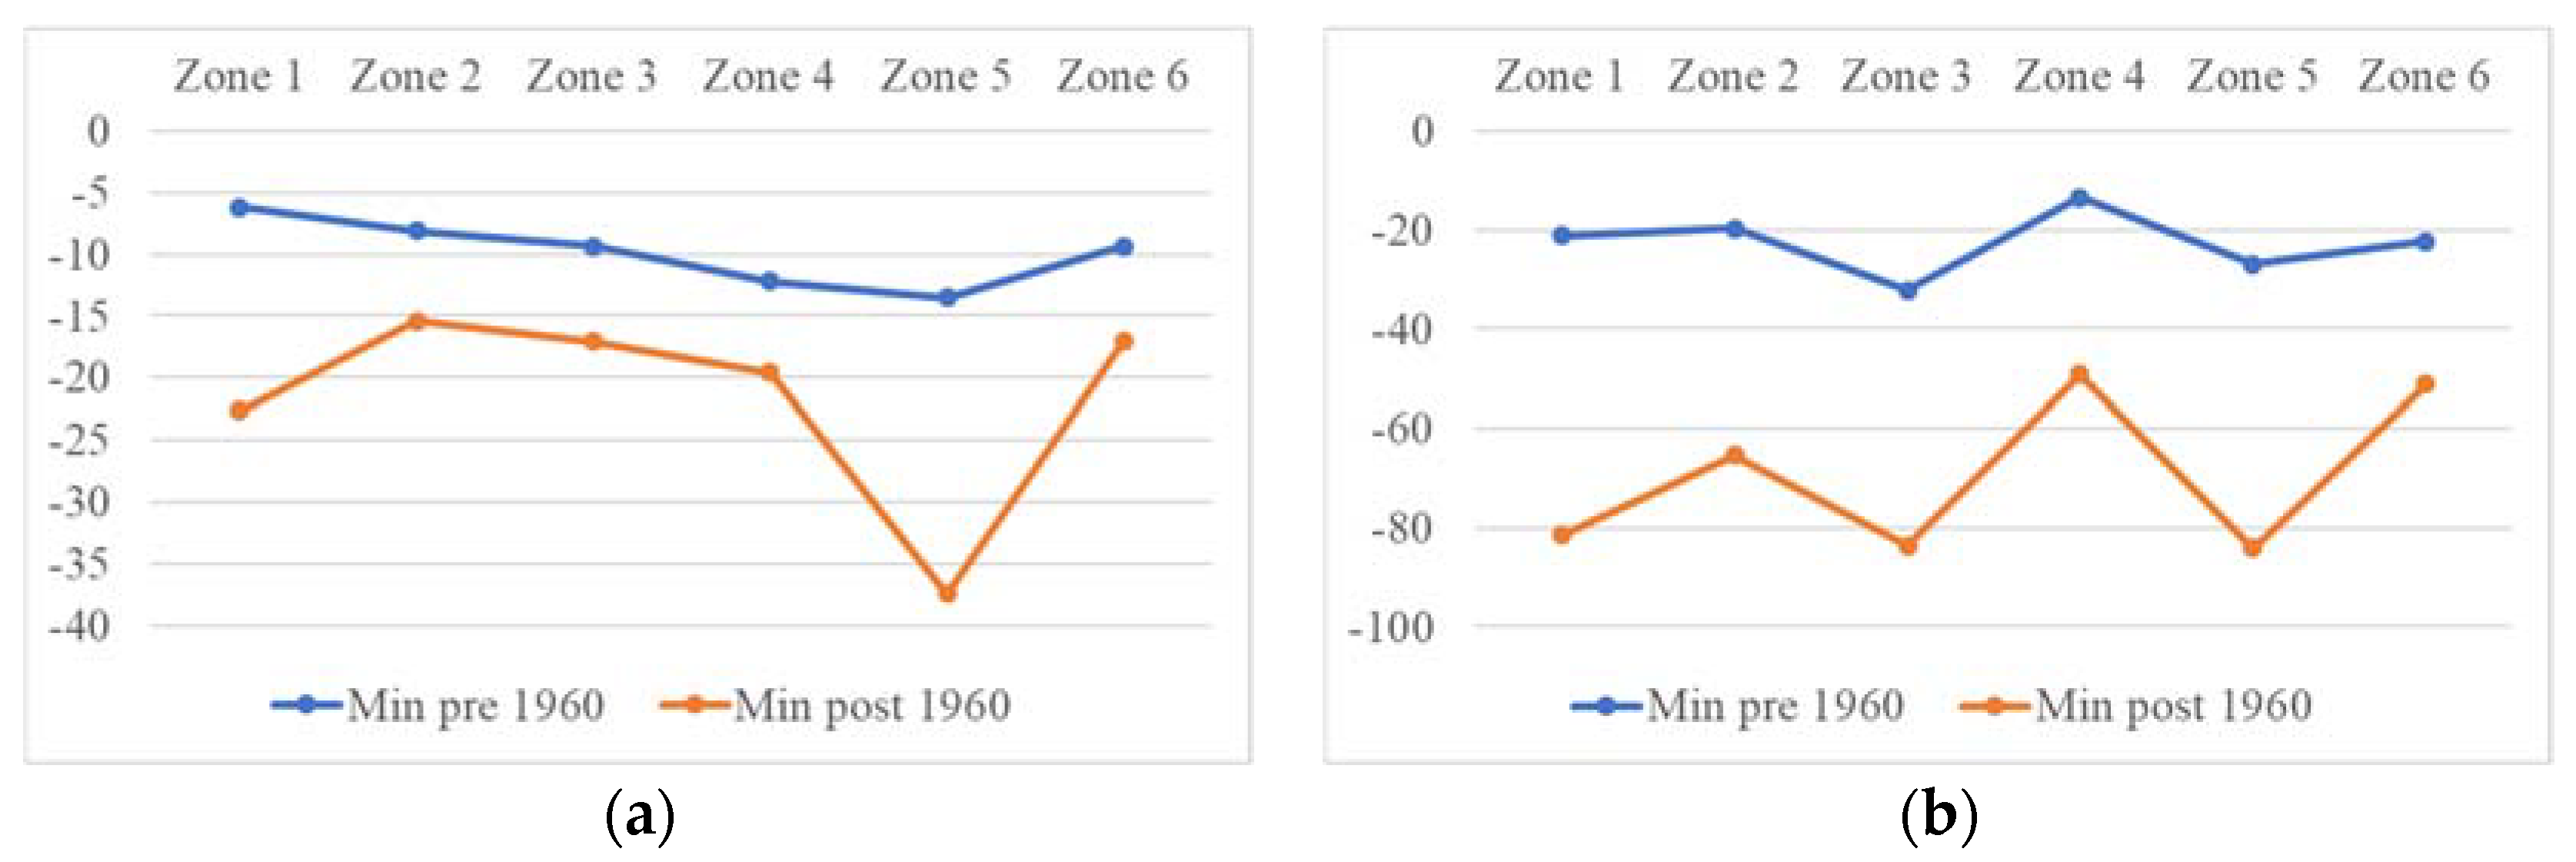
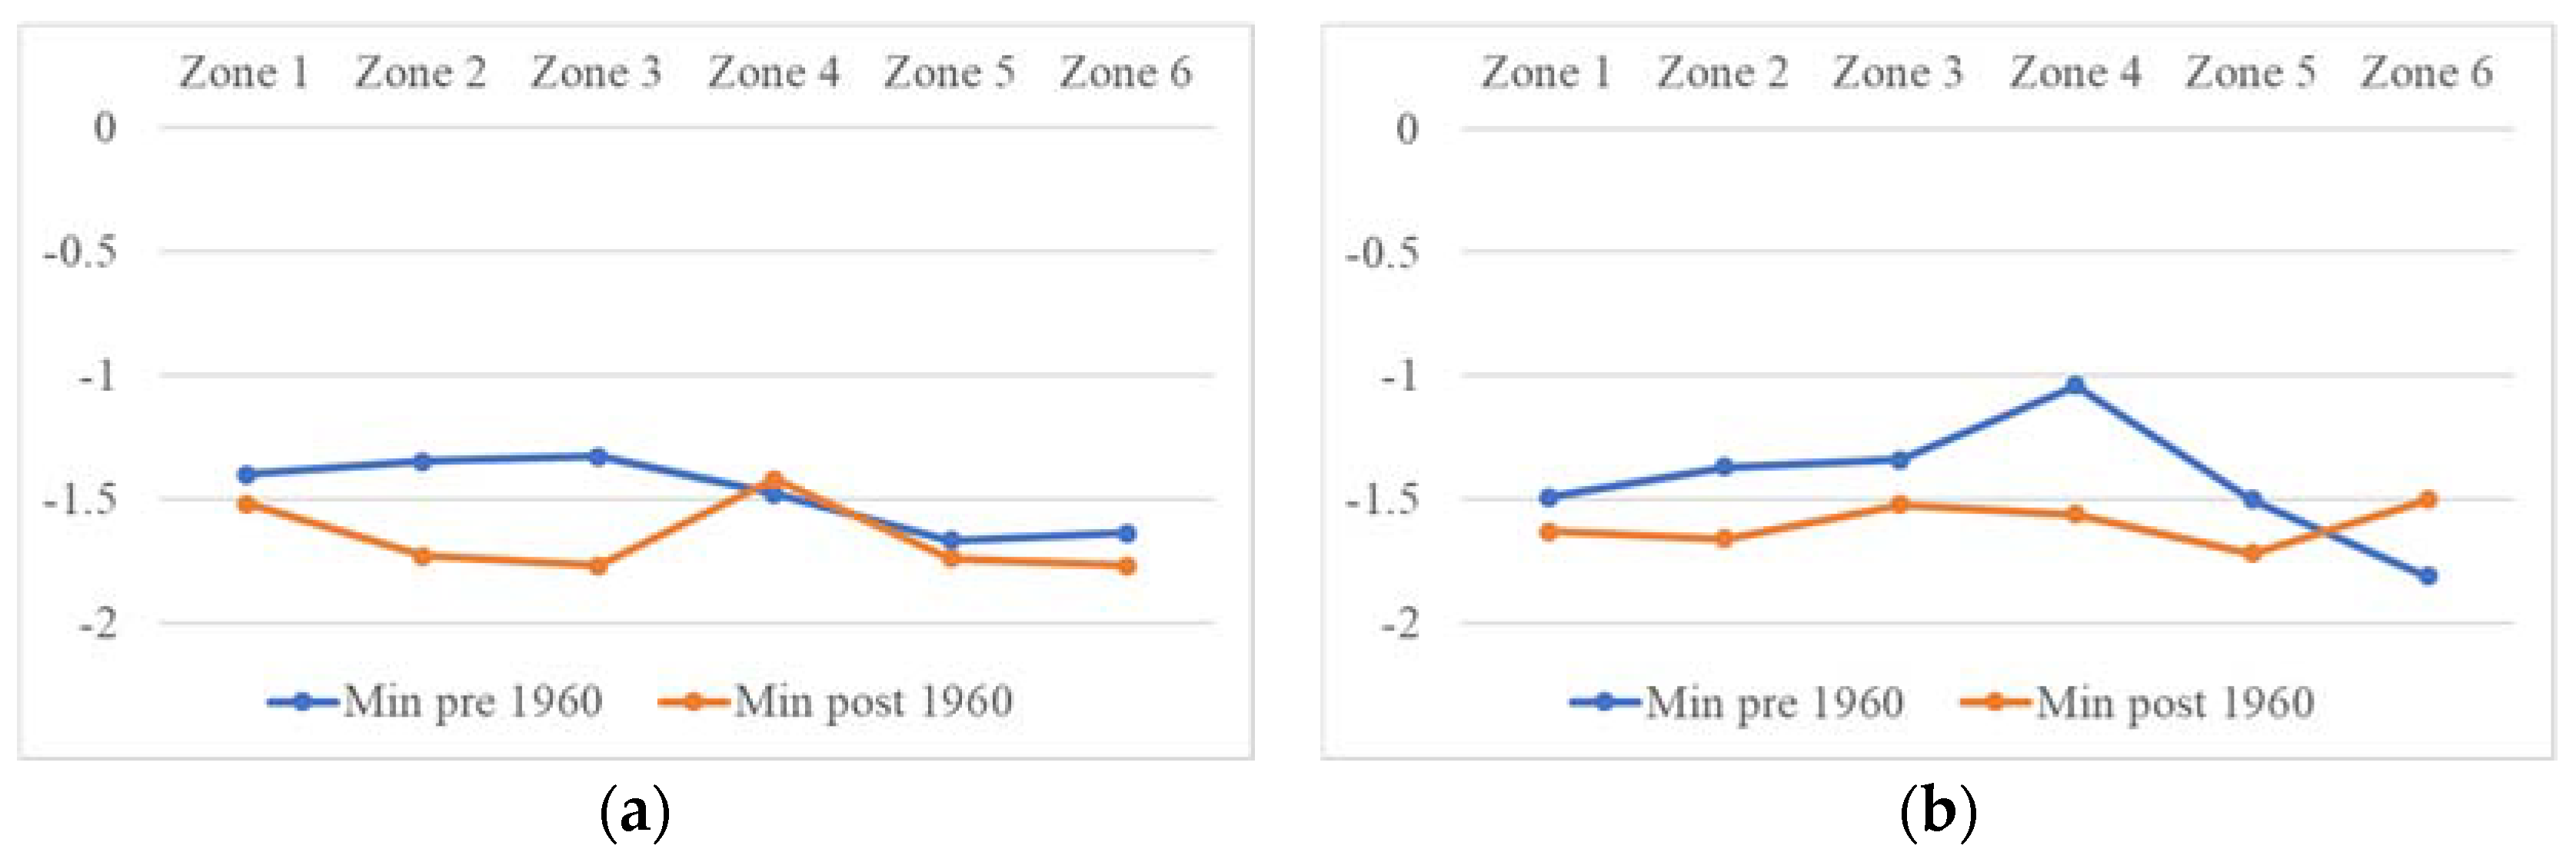
3.3. Drought Characterization
3.4. Drought Evolution
4. Discussion
5. Conclusions
Author Contributions
Funding
Conflicts of Interest
References
- Panagoulia, D.G.; Dimou, G. Definitions and effects of droughts. Div. Water Resour. 1998, 7, 2–5. [Google Scholar]
- Dars, G.H.; Najafi, M.R.; Qureshi, A.L. Assessing the Impacts of Climate Change on Future Precipitation Trends Based on Downscaled CMIP5 Simulations Data. Mehran Univ. Res. J. Eng. Technol. 2017, 36, 385–394. [Google Scholar] [CrossRef]
- Mishra, A.K.; Singh, V.P. A review of drought concepts. J. Hydrol. 2010, 391, 202–216. [Google Scholar] [CrossRef]
- Edossa, D.C.; Woyessa, Y.E.; Welderufael, W.A. Spatiotemporal analysis of droughts using self-calibrating Palmer’s Drought Severity Index in the central region of South Africa. Theor. Appl. Clim. 2016, 126, 643–657. [Google Scholar] [CrossRef]
- Palmer, W.C. Meteorological Drought; US Department of Commerce; Weather Bureau: Melbourne, Australia, 1965; p. 58.
- Byun, H.R.; Wilhite, D.A. Objective quantification of drought severity and duration. J. Clim. 1999, 12, 2747–2756. [Google Scholar] [CrossRef]
- Thomas, M.B.; Nolan, D.J.; John, K. The Relationship of Drought Frequency and Duration to Time Scales. In Proceedings of the 8th Conference on Applied Climatology, Anaheim, CA, USA, 17–22 January 1993; Volume 17, pp. 179–183. [Google Scholar]
- Gocic, M.; Trajkovic, S. Spatiotemporal characteristics of drought in Serbia. J. Hydrol. 2014, 510, 110–123. [Google Scholar] [CrossRef]
- Dabanlı, İ.; Mishra, A.K.; Şen, Z. Long-term spatio-temporal drought variability in Turkey. J. Hydrol. 2017, 552, 779–792. [Google Scholar] [CrossRef]
- Ashraf, M.; Routray, J.K. Spatio-temporal characteristics of precipitation and drought in Balochistan Province, Pakistan. Nat. Hazards 2015, 77, 229–254. [Google Scholar] [CrossRef]
- Haroon, M.A.; Zhang, J.; Yao, F. Drought monitoring and performance evaluation of MODIS-based drought severity index (DSI) over Pakistan. Nat. Hazards 2016, 84, 1349–1366. [Google Scholar] [CrossRef]
- Xie, H.; Ringler, C.; Zhu, T.; Waqas, A. Droughts in Pakistan: A spatiotemporal variability analysis using the Standardized Precipitation Index. Water Food Secur. Chall. Pak. 2016, 38, 116–127. [Google Scholar] [CrossRef]
- Vicente-Serrano, S.M.; Beguería, S.; López-Moreno, J.I. A multiscalar drought index sensitive to global warming: The standardized precipitation evapotranspiration index. J. Clim. 2010, 23, 1696–1718. [Google Scholar] [CrossRef]
- Adnan, S. Spatio-Temporal Distribution of Drought and its Characteristics over Pakistan. Ph.D. Thesis, Commission on Science and Technology for Sustainable Development in the South University, Islamabad, Pakistan, 2016. [Google Scholar]
- Guo, H.; Bao, A.; Liu, T.; Jiapaer, G.; Ndayisaba, F.; Jiang, L.; Kurban, A.; De Maeyer, P. Spatial and temporal characteristics of droughts in Central Asia during 1966–2015. Sci. Total Environ. 2018, 624, 1523–1538. [Google Scholar] [CrossRef] [PubMed]
- Krakauer, N.Y.; Lakhankar, T. Trends in Drought over the Northeast United States. Water 2019, 11, 1834. [Google Scholar] [CrossRef]
- Potop, V.; Boronean, C. Observed evolution of drought episodes assessed with the Standardized Precipitation Evapotranspiration Index (SPEI) over the Czech Republic. EGU Gen. Assem. 2012, 14, 10010. [Google Scholar]
- Liu, X.; Wang, S.; Zhou, Y.; Wang, F.; Li, W.; Liu, W. Regionalization and Spatiotemporal Variation of Drought in China Based on Standardized Precipitation Evapotranspiration Index (1961-2013). Adv. Meteorol. 2015, 2015, 18. [Google Scholar] [CrossRef]
- Tan, C.; Yang, J.; Li, M. Temporal-spatial variation of drought indicated by SPI and SPEI in Ningxia Hui Autonomous Region, China. Atmosphere 2015, 6, 1399–1421. [Google Scholar] [CrossRef]
- Tian, L.; Quiring, S.M. Spatial and temporal patterns of drought in Oklahoma (1901–2014). Int. J. Climatol. 2019, 39, 3365–3378. [Google Scholar] [CrossRef]
- Dayal, K.S.; Deo, R.C.; Apan, A.A. Investigating drought duration-severity-intensity characteristics using the standardized precipitation-evapotranspiration index: Case studies in drought-prone southeast Queensland. J. Hydrol. Eng. 2018, 23, 1–16. [Google Scholar] [CrossRef]
- Deo, R.C.; Salcedo-Sanz, S.; Carro-Calvo, L.; Saavedra-Moreno, B. Drought Prediction with Standardized Precipitation and Evapotranspiration Index and Support Vector Regression Models; Elsevier: Amsterdam, The Netherlands, 2018; ISBN 9780128120576. [Google Scholar]
- Khan, M.I.; Liu, D.; Fu, Q.; Faiz, M.A. Detecting the persistence of drying trends under changing climate conditions using four meteorological drought indices. Meteorol. Appl. 2018, 25, 184–194. [Google Scholar] [CrossRef]
- Eckstein, D.; Künzel, V.; Schäfer, L.; Winges, M. Global Climate Risk Index 2020. Bonn Ger. 2019, 9. [Google Scholar]
- Sheikh, M.M. Drought management and prevention in Pakistan. Sci. Vis. 2001, 7, 117–131. [Google Scholar]
- Jamro, S.; Dars, G.H.; Ansari, K.; Krakauer, N.Y. Spatio-temporal variability of drought in Pakistan using standardized precipitation evapotranspiration index. Appl. Sci. 2019, 9, 4588. [Google Scholar] [CrossRef]
- McKee, T.B.; Doesken, N.J.; Kleist, J. Drought Monitoring with Multiple Time Scales; American Meteorological Society: Dallas, TX, USA, 1995; pp. 233–236. [Google Scholar]
- Andujar, E.; Krakauer, N.Y.; Yi, C.; Kogan, F. Ecosystem Drought Response Timescales from Thermal Emission versus Shortwave Remote Sensing. Adv. Meteorol. 2017, 2017, 10. [Google Scholar] [CrossRef]
- Hameed, M.; Ahmadalipour, A.; Moradkhani, H. Apprehensive drought characteristics over Iraq: Results of a multidecadal spatiotemporal assessment. Geosciences 2018, 8, 58. [Google Scholar] [CrossRef]
- Beguería, S.; Vicente-Serrano, S.M.; Reig, F.; Latorre, B. Standardized precipitation evapotranspiration index (SPEI) revisited: Parameter fitting, evapotranspiration models, tools, datasets and drought monitoring. Int. J. Climatol. 2014, 34, 3001–3023. [Google Scholar] [CrossRef]
- Guttman, N.B. Accepting the standardized precipitation index: A calculation algorithm. J. Am. Water Resour. Assoc. 1999, 35, 311–322. [Google Scholar] [CrossRef]
- Beguería, S.; Latorre, B.; Reig, F.; Vicente-Serrano, S.M. sbegueria/SPEIbase: Version 2.5.1. Glob. SPEI Database 2017. [Google Scholar]
- Harris, I.; Jones, P.D.; Osborn, T.J.; Lister, D.H. Updated high-resolution grids of monthly climatic observations—the CRU TS3.10 Dataset. Int. J. Climatol. 2014, 34, 623–642. [Google Scholar] [CrossRef]
- The World Bank. Pakistan—Balochistan Economic Report: From Periphery to Core (Vol. 2): Full Report; The World Bank: Washington, WA, USA, 2008; Volume II. [Google Scholar]
- BUITEMS. UNDP Drought Risk Assessment in the Province of Balochistan; BUITEMS: Quetta, Pakistan, 2015; p. 87. [Google Scholar]
- Zaman, Q.U.; Rasul, G. Agro-Climatic Classification of Pakistan. Q. Sci. Vis. 2004, 9, 59–66. [Google Scholar]
- About Balochistan—Government of Balochistan. Available online: www.balochistan.gov.pk/index.php?option=com_content&view=article&id=37&Itemid=783 (accessed on 20 December 2019).
- Assunção, R.M.; Neves, M.C.; Câmara, G.; Da Costa Freitas, C. Efficient regionalization techniques for socio-economic geographical units using minimum spanning trees. Int. J. Geogr. Inf. Sci. 2006, 20, 797–811. [Google Scholar] [CrossRef]
- Lage Palmieri, J.; Assunção, R.M.; Reis, E.A. A Minimal Spanning Tree Algorithm Applied to Spatial Cluster Analysis. Electron. Notes Discrete Math. 2001, 7, 162–165. [Google Scholar] [CrossRef]
- Jungnickel, D. Graphs, Networks and Algorithms; Springer: Berlin/Heidelberg, Germany, 1999. [Google Scholar]
- Yevjevich, V. An objective approach to definitions and investigations of continental hydrologic droughts. J. Hydrol. 1969, 7, 353. [Google Scholar]
- Kendall, M.G. Rank Correlation Methods; Griffin: Oxford, UK, 1948. [Google Scholar]
- Sen, P.K. Estimates of the Regression Coefficient Based on Kendall’s Tau. J. Am. Stat. Assoc. 1968, 63, 1379–1389. [Google Scholar] [CrossRef]
- da Silva, R.M.; Santos, C.A.G.; Moreira, M.; Corte-Real, J.; Silva, V.C.L.; Medeiros, I.C. Rainfall and river flow trends using Mann–Kendall and Sen’s slope estimator statistical tests in the Cobres River basin. Nat. Hazards 2015, 77, 1205–1221. [Google Scholar] [CrossRef]
- Joshi, N.; Gupta, D.; Suryavanshi, S.; Adamowski, J.; Madramootoo, C.A. Analysis of trends and dominant periodicities in drought variables in India: A wavelet transform based approach. Atmos. Res. 2016, 182, 200–220. [Google Scholar] [CrossRef]
- Pakistan Weather Portal History of Drought in Pakistan—In Detail. Available online: https://pakistanweatherportal.com/2011/05/08/history-of-drought-in-pakistan-in-detail/ (accessed on 19 September 2019).
- Durrani, Z.K. Lessons for Pakistan from Droughts in the Past. Available online: https://cscr.pk/explore/themes/energy-environment/lessons-pakistan-droughts-past/ (accessed on 20 July 2018).
- Centre, N.D.M. Drought Bulletin of Pakistan July-September 2019; Pakistan Meteorological Department: Islamabad, Pakistan, 2019.
- Baines, P.G.; Folland, C.K. Evidence for a rapid global climate shift across the late 1960s. J. Clim. 2007, 20, 2721–2744. [Google Scholar] [CrossRef]
- Lamb, H. Climate in the 1960’s Changes in the World’s Wind Circulation Reflected in Prevailing Temperatures, Rainfall Patterns and the Levels of the African Lakes. Geograohic. J. 1966, 132, 183–212. [Google Scholar] [CrossRef]
- Li, Y.; Ye, W.; Wang, M.; Yan, X. Climate change and drought: A risk assessment of crop-yield impacts. Clim. Res. 2009, 39, 31–46. [Google Scholar] [CrossRef]


| Mann–Kendall Test Results for 3-Month SPEI | ||||
|---|---|---|---|---|
| p-Value | Tau | Sen’s Slope | ||
| Zone 1 | SPEI | 1.41 × 10⁻¹⁹ | −1.63 × 10⁻¹ | −6.15 × 10⁻⁴ |
| Duration | 7.83 × 10⁻³ | 1.49 × 10⁻¹ | 0.00 | |
| Severity | 2.52 × 10⁻⁴ | −2.13 × 10⁻¹ | −1.23 × 10⁻² | |
| Intensity | 5.66 × 10⁻⁶ | −2.64 × 10⁻¹ | −2.79 × 10⁻³ | |
| Peak | 2.00 × 10⁻⁵ | −2.48 × 10⁻¹ | −3.77 × 10⁻³ | |
| Zone 2 | SPEI | 3.94 × 10⁻⁵ | −7.42 × 10⁻² | −2.76 × 10⁻⁴ |
| Duration | 1.20 × 10⁻¹ | 8.15 × 10⁻² | 0.00 | |
| Severity | 2.27 × 10⁻² | −1.23 × 10⁻¹ | −5.42 × 10⁻³ | |
| Intensity | 1.97 × 10⁻³ | −1.67 × 10⁻¹ | −1.43 × 10⁻³ | |
| Peak | 6.78 × 10⁻⁴ | −1.83 × 10⁻¹ | −2.09 × 10⁻³ | |
| Zone 3 | SPEI | 1.26 × 10⁻⁶ | −8.75 × 10⁻² | −3.33 × 10⁻⁴ |
| Duration | 6.06 × 10⁻¹ | 2.67 × 10⁻² | 0.00 | |
| Severity | 3.43 × 10⁻¹ | −5.06 × 10⁻² | −1.85 × 10⁻³ | |
| Intensity | 1.67 × 10⁻¹ | −7.37 × 10⁻² | −6.22 × 10⁻⁴ | |
| Peak | 1.22 × 10⁻¹ | −8.24 × 10⁻² | −1.01 × 10⁻³ | |
| Zone 4 | SPEI | 3.83 × 10⁻⁴ | −6.41 × 10⁻² | −2.43 × 10⁻⁴ |
| Duration | 2.81 × 10⁻¹ | 5.45 × 10⁻² | 0.00 | |
| Severity | 1.72 × 10⁻² | −1.24 × 10⁻¹ | −5.82 × 10⁻³ | |
| Intensity | 2.71 × 10⁻⁸ | −2.89 × 10⁻¹ | −2.36 × 10⁻³ | |
| Peak | 8.11 × 10⁻⁸ | −2.79 × 10⁻¹ | −3.17 × 10⁻³ | |
| Zone 5 | SPEI | 5.41 × 10−38 | −2.33 × 10⁻¹ | −8.12 × 10⁻⁴ |
| Duration | 5.03 × 10⁻³ | 1.61 × 10⁻¹ | 0.00 | |
| Severity | 5.44 × 10⁻⁴ | −2.04 × 10⁻¹ | −1.20 × 10⁻² | |
| Intensity | 1.62 × 10⁻⁴ | −2.23 × 10⁻¹ | −2.31 × 10⁻³ | |
| Peak | 3.26 × 10⁻⁵ | −2.45 × 10⁻¹ | −3.90 × 10⁻³ | |
| Zone 6 | SPEI | 1.44 × 10⁻² | −4.41 × 10⁻² | −1.67 × 10⁻⁴ |
| Duration | 1.87 × 10⁻² | 1.32 × 10⁻¹ | 0.00 | |
| Severity | 9.11 × 10⁻⁴ | −1.92 × 10⁻¹ | −1.06 × 10⁻² | |
| Intensity | 2.33 × 10⁻⁵ | −2.45 × 10⁻¹ | −2.62 × 10⁻³ | |
| Peak | 1.12 × 10⁻⁴ | −2.24 × 10⁻¹ | −3.44 × 10⁻³ | |
| Statistically significant at 95% confidence interval | ||||
| Not statistically significant | ||||
| Mann–Kendall Test Results for 12-Month SPEI | ||||
|---|---|---|---|---|
| p-Value | Tau | Sen’s Slope | ||
| Zone 1 | SPEI | 4.62 × 10−42 | −2.45 × 10⁻¹ | −8.53 × 10⁻⁴ |
| Duration | 8.22 × 10⁻² | 1.72 × 10⁻¹ | 7.69 × 10⁻² | |
| Severity | 1.47 × 10⁻¹ | −1.45 × 10⁻¹ | −5.41 × 10⁻² | |
| Intensity | 7.29 × 10⁻¹ | −3.55 × 10⁻² | −1.18 × 10⁻³ | |
| Peak | 2.23 × 10⁻¹ | −1.22 × 10⁻¹ | −5.62 × 10⁻³ | |
| Zone 2 | SPEI | 1.86 × 10⁻⁸ | −1.02 × 10⁻¹ | −3.86 × 10⁻⁴ |
| Duration | 7.00 × 10⁻¹ | 3.63 × 10⁻² | 0.00 | |
| Severity | 6.87 × 10⁻¹ | −3.84 × 10⁻² | −6.78 × 10⁻³ | |
| Intensity | 4.38 × 10⁻¹ | −7.34 × 10⁻² | −2.18 × 10⁻³ | |
| Peak | 3.25 × 10⁻¹ | −9.29 × 10⁻² | −3.98 × 10⁻³ | |
| Zone 3 | SPEI | 1.33 × 10⁻¹⁵ | −1.44 × 10⁻¹ | −5.31 × 10⁻⁴ |
| Duration | 6.00 × 10⁻² | 1.96 × 10⁻¹ | 1.18 × 10⁻¹ | |
| Severity | 2.29 × 10⁻² | −2.39 × 10⁻¹ | −1.95 × 10⁻¹ | |
| Intensity | 9.42 × 10⁻⁴ | −3.47 × 10⁻¹ | −1.18 × 10⁻² | |
| Peak | 3.70 × 10⁻³ | −3.04 × 10⁻¹ | −1.81 × 10⁻² | |
| Zone 4 | SPEI | 6.19 × 10⁻⁶ | −8.16 × 10⁻² | −3.13 × 10⁻⁴ |
| Duration | 1.32 × 10⁻² | 2.49 × 10⁻¹ | 1.54 × 10⁻¹ | |
| Severity | 1.61 × 10⁻³ | −3.19 × 10⁻¹ | −2.35 × 10⁻¹ | |
| Intensity | 4.60 × 10⁻⁴ | −3.54 × 10⁻¹ | −1.21 × 10⁻² | |
| Peak | 1.02 × 10⁻² | −2.60 × 10⁻¹ | −1.63 × 10⁻² | |
| Zone 5 | SPEI | 6.78 × 10⁻²⁰ | −1.65 × 10⁻¹ | −6.26 × 10⁻⁴ |
| Duration | 1.49 × 10⁻¹ | 1.31 × 10⁻¹ | 4.00 × 10⁻² | |
| Severity | 1.28 × 10⁻¹ | −1.39 × 10⁻¹ | −4.77 × 10⁻² | |
| Intensity | 2.81 × 10⁻² | −2.01 × 10⁻¹ | −3.98 × 10⁻³ | |
| Peak | 4.37 × 10⁻² | −1.84 × 10⁻¹ | −7.01 × 10⁻³ | |
| Zone 6 | SPEI | 1.16 × 10⁻² | −4.56 × 10⁻² | −1.69 × 10⁻⁴ |
| Duration | 2.68 × 10⁻² | 1.81 × 10⁻¹ | 3.64 × 10⁻² | |
| Severity | 2.80 × 10⁻² | −1.84 × 10⁻¹ | −3.72 × 10⁻² | |
| Intensity | 3.63 × 10⁻¹ | −7.64 × 10⁻² | −1.62 × 10⁻³ | |
| Peak | 1.24 × 10⁻¹ | −1.29 × 10⁻¹ | −3.94 × 10⁻³ | |
| Statistically significant at 95% confidence interval | ||||
| Not statistically significant | ||||
© 2020 by the authors. Licensee MDPI, Basel, Switzerland. This article is an open access article distributed under the terms and conditions of the Creative Commons Attribution (CC BY) license (http://creativecommons.org/licenses/by/4.0/).
Share and Cite
Jamro, S.; Channa, F.N.; Dars, G.H.; Ansari, K.; Krakauer, N.Y. Exploring the Evolution of Drought Characteristics in Balochistan, Pakistan. Appl. Sci. 2020, 10, 913. https://doi.org/10.3390/app10030913
Jamro S, Channa FN, Dars GH, Ansari K, Krakauer NY. Exploring the Evolution of Drought Characteristics in Balochistan, Pakistan. Applied Sciences. 2020; 10(3):913. https://doi.org/10.3390/app10030913
Chicago/Turabian StyleJamro, Shoaib, Falak Naz Channa, Ghulam Hussain Dars, Kamran Ansari, and Nir Y. Krakauer. 2020. "Exploring the Evolution of Drought Characteristics in Balochistan, Pakistan" Applied Sciences 10, no. 3: 913. https://doi.org/10.3390/app10030913
APA StyleJamro, S., Channa, F. N., Dars, G. H., Ansari, K., & Krakauer, N. Y. (2020). Exploring the Evolution of Drought Characteristics in Balochistan, Pakistan. Applied Sciences, 10(3), 913. https://doi.org/10.3390/app10030913