1. Introduction
Block pavements constructed of natural stones are often required the specific areas where are in low traffic volumes such as communal sites, sidewalks, and historically neighbourhood areas [
1,
2,
3]. Commonly, stone-paved roads are quarried in heritage sites or cities due to their variety in creation (patterns, texture, and environmental aspects) [
1,
4,
5,
6,
7,
8,
9]. However, the deteriorations of those types of pavements have frequently occurred because of the increasing amount and weight of vehicles crossing. To avoid these circumstances, they are recommended for passing light or medium traffic volume in such areas.
The fractures of bound stone pavements are mainly generated by high vertical and horizontal loads caused by braking and accelerating forces. If the superstructure of the pavement was not appropriately designed or constructed, the pavement layer, especially at the surface course, laying course and jointing parts can be often damaged. Furthermore, the vertical displacement of the paving materials would be able to be made owing to lack of punching shear resistance between the joints and bedding course. The vertical and lateral movements of the stone elements, then terminally are dislodged out from the matrix of stones and as a result of this circumstance, an expensive renewal may be considered.
To develop natural stone block pavements for heavy-duty traffic, various studies were conducted to estimate the performance of pavement constructions. Among the numerous evaluations, the empirical determinations under long-term exposure and field tests have been inquired in the promoting pavement design procedures [
10,
11,
12,
13]. For instance, full-scale accelerated pavement testing (APT) has become a positive and reasonable simulation because of its ability to determine the long-term performance of the road within a restrict time period. For this reason, diverse highway agencies have introduced to APT facilities. Additionally, there is a couple of research that numerically analysed the behaviour or performance of natural stone and block pavement and APT using the Finite Element Method (FEM) [
2,
14,
15]. Nevertheless, the long-term performance of bound stone pavement using APT has not largely researched and compared with other types of pavements such as asphalt and block interlocking pavement.
Accordingly, the objective of the present study is to investigate the long-term serviceability of the suggested bonded stone-paved road by comparing with the other types of pavements. To progress the APT, the structured pavement, such as asphalt and concrete block interlocking pavement, two different types of stone-paved roads were prepared by following corresponding design specifications in the first part of the study. The materials used in the pavement were experimentally verified in advance. Additionally, the vertical deflection profile was recorded during after the accelerated simulation. In the second part of this study, the maximum deflection using Falling Weight Deflectometer (FWD), and skid resistance were measured at the specific stage of APT. Moreover, the APT outcomes, which were from the test and computational method (Finite Element Method), were also analysed to establish the fundamental data.
2. Testing Pavements and Material Summary
Primarily, a testing pavement track was constructed in the Korea Accelerated Loading Environment Simulator (KALES) designed by the Korea Expressway Corporation Research Institute Hwaseong-si, Gyeonggi-do, South Korea for comparing the long-term performance of four types of structured pavements. As tabulated in
Table 1, the material used in the construction is indicated with the thickness of each layer. Additionally,
Figure 1 shows a set of pictures taken after finishing surface structures construction.
All the pavements were designed with a thickness of 560 mm by referring to the corresponding design specifications as detailed in the first part of the study [
16,
17]. The Asphalt Pavement Design Guideline published by Seoul Metropolitan Government was a reference for designing asphalt pavement in the present study. In terms of block pavement and bound stone pavement A, design specifications were brought from European countries such as Belgium and Germany, respectively. This was because there are currently no design specifications for those types of paved roads in Korea. For the bound stone pavement B was the suggested design profile by modifying the bound stone pavement A which is a typical stone pavement section in Korea. The recommended stone pavement design was designated for less than 1000 Annual Average Daily Truck Traffic (AADTT) and 60 km/h of travelling speed.
To determine the quality and mechanical properties of materials used to design the testing track, various material tests were conducted following the equivalent test method in the previous part of the study. Additionally, the test results were verified by the assessments as listed in
Table 2.
The aggregate gradation and quality control of asphalt mixtures for the base course, wearing course and Stone Mastic Asphalt (SMA) were assured by both Korean Construction Specifications (KCS) and Express Construction Specification (EXCS). From the quality tests completed by the plant, all the properties such as Marshall stability, flow, air void, and saturation were satisfied with the corresponding recommendations.
In case of sand for joint filling and bedding course, sieve analysis and measurement of the maximum size of aggregate were assured by the design guideline published by Seoul Metropolitan Government, Seoul, Korea. Similarly, the concrete blocks used for pavers were evaluated by judging compressive and flexural strength.
The mortar for joint filling and bedding course was a mixture of Ultra-Rapid-Hardening (URH) cement and retardant. The mix design was experimentally discovered and the mechanical properties were also examined in the former study [
3]. The mortar showed improved performance with a comparison of minimum requirements from both BS 7533-4 and Natural Stone Surface (NSS) in the UK. Regarding the concrete applied for the base course, air content, slump and compressive strength tests were performed as described in Korean Standard (KS) F 2421 and 2402. Furthermore, the test results showed a higher value compared to the related specifications. Similar to the mortar, the natural stones for the surface layer were also tested by following the KS F 2530 in the previous study [
3]. The compressive strength and water absorption of the stone elements were investigated by KS F 2519 and 2518, respectively, and both properties have met the recommendation.
3. Experimental Methods
The current part of the study aims to evaluate long-term pavement performance of the suggested bound stone pavements that designed for less than 1000 Annual Average Daily Traffic Volume (AADT) of heavy vehicles (axle load less than 10ton) and 60km/h of operating speed. In the first part of the study, the bearing capacity of the sub-base course of pavements was determined before pavement construction completed. After surface layer construction, the skid resistance and vertical pavement deflection were measured according to related test methods. Furthermore, the APT was computationally simulated by FEM to obtain numerical rut depth and to compare with experimental measurement.
3.1. Skid Resistance
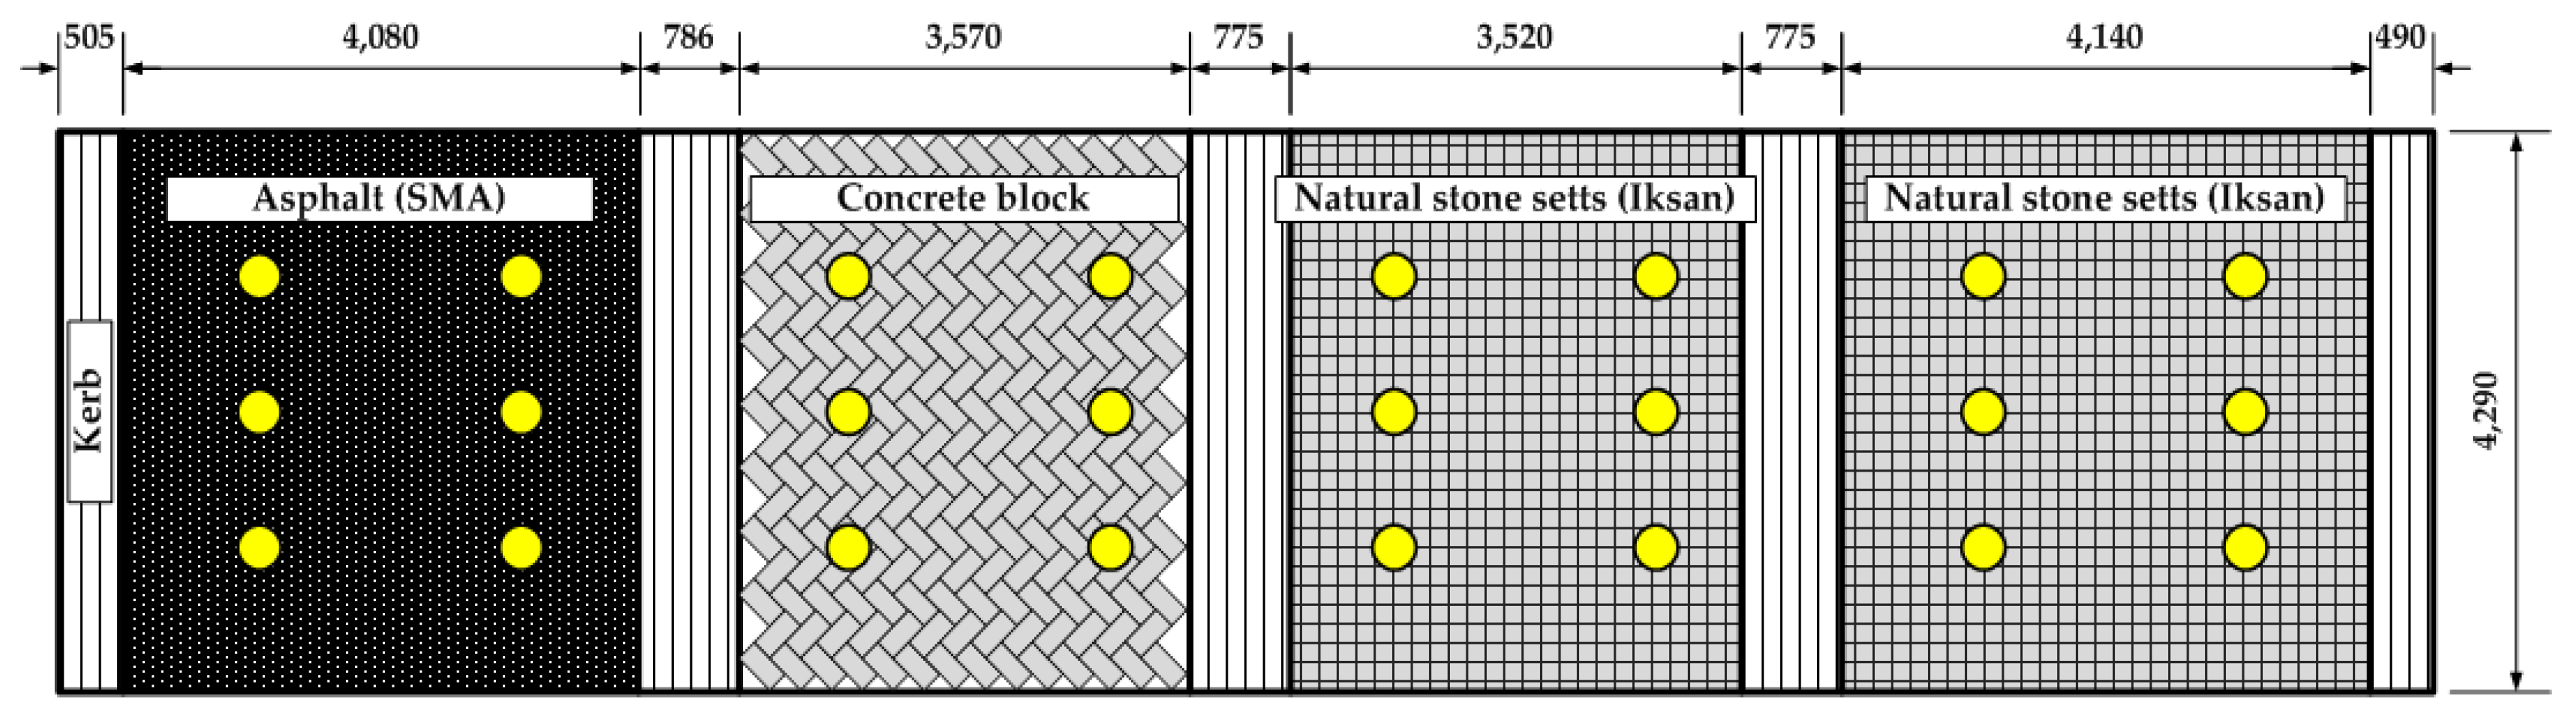
For measuring skid resistance of the pavement, static measurement is mainly used in a conventional way. The specific measuring devices measure frictional resistance while moving across a small portion of the pavement. A typical device implied for static measurement is the portable British Pendulum Tester (BPT). The standard test method is described in ASTM E303: Standard Test Method for Measuring Surface Frictional Properties Using the British Pendulum Tester. This equipment is applicable for on-site testing of skid resistance on surfaces. Additionally, it includes a small rubber shoe at the end of the spring-loaded pendulum. The tester measures frictional resistance caused by between the rubber shoe and the point of contact with the pavement. The friction resistance is read on a scale on the device as the British Pendulum Number (BPN). As illustrated in
Figure 2, the measurement points of each pavement are indicated in six yellow dots and 24 spots in total. Among the points, top and bottom rows were the places where under passing wheel loads during the APT.
3.2. Falling Weight Deflectometer Test
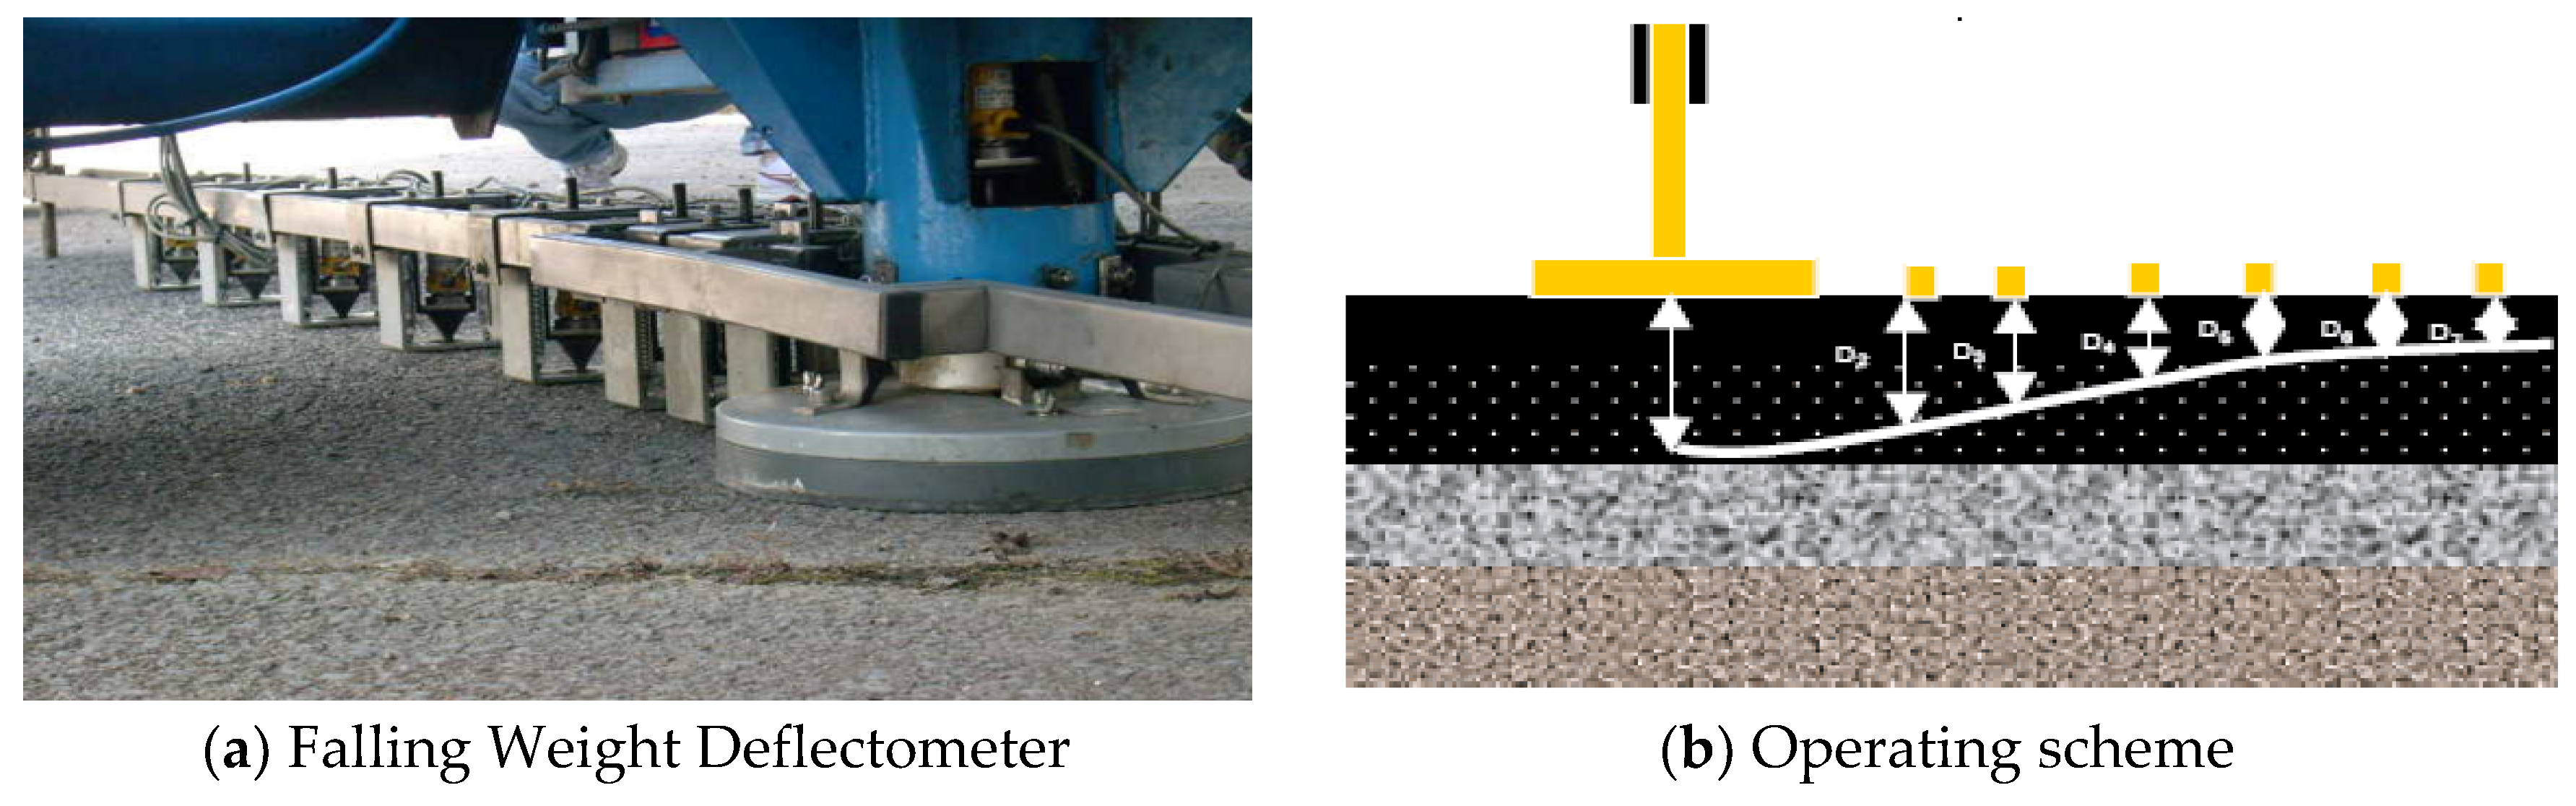
FWDs (
Figure 3a) have been used to measure pavement deflections of response to a stationary dynamic load, for instance, a moving wheel load (
Figure 3b). The data collected can be applied to determine the structural capacity of pavements for design and pavement management purposes. The measurements were obtained by complying with the test method as described in ASTM D 4694-09: Standard Test Method for Deflections with a Falling-Weight-Type Impulse Load Device. Moreover, the deflection of pavements was investigated at three different phases of the APT which were at the beginning, 400,000 ESALs and termination of the APT.
3.3. Finite Element Analysis of Accelerated Pavement Test
Finite element analysis of APT, which was performed in the first part of the study, was conducted in order to estimate the rut depth of surface structure depending upon the cumulative number of ESALs. The commercial FEM analysis program ABAQUS was adopted for the numerical analysis. The mechanical properties of materials used in each course of the testing pavements are summarised in
Table 3. Those material characteristics were referred by the previously conducted studies [
15,
18,
19].
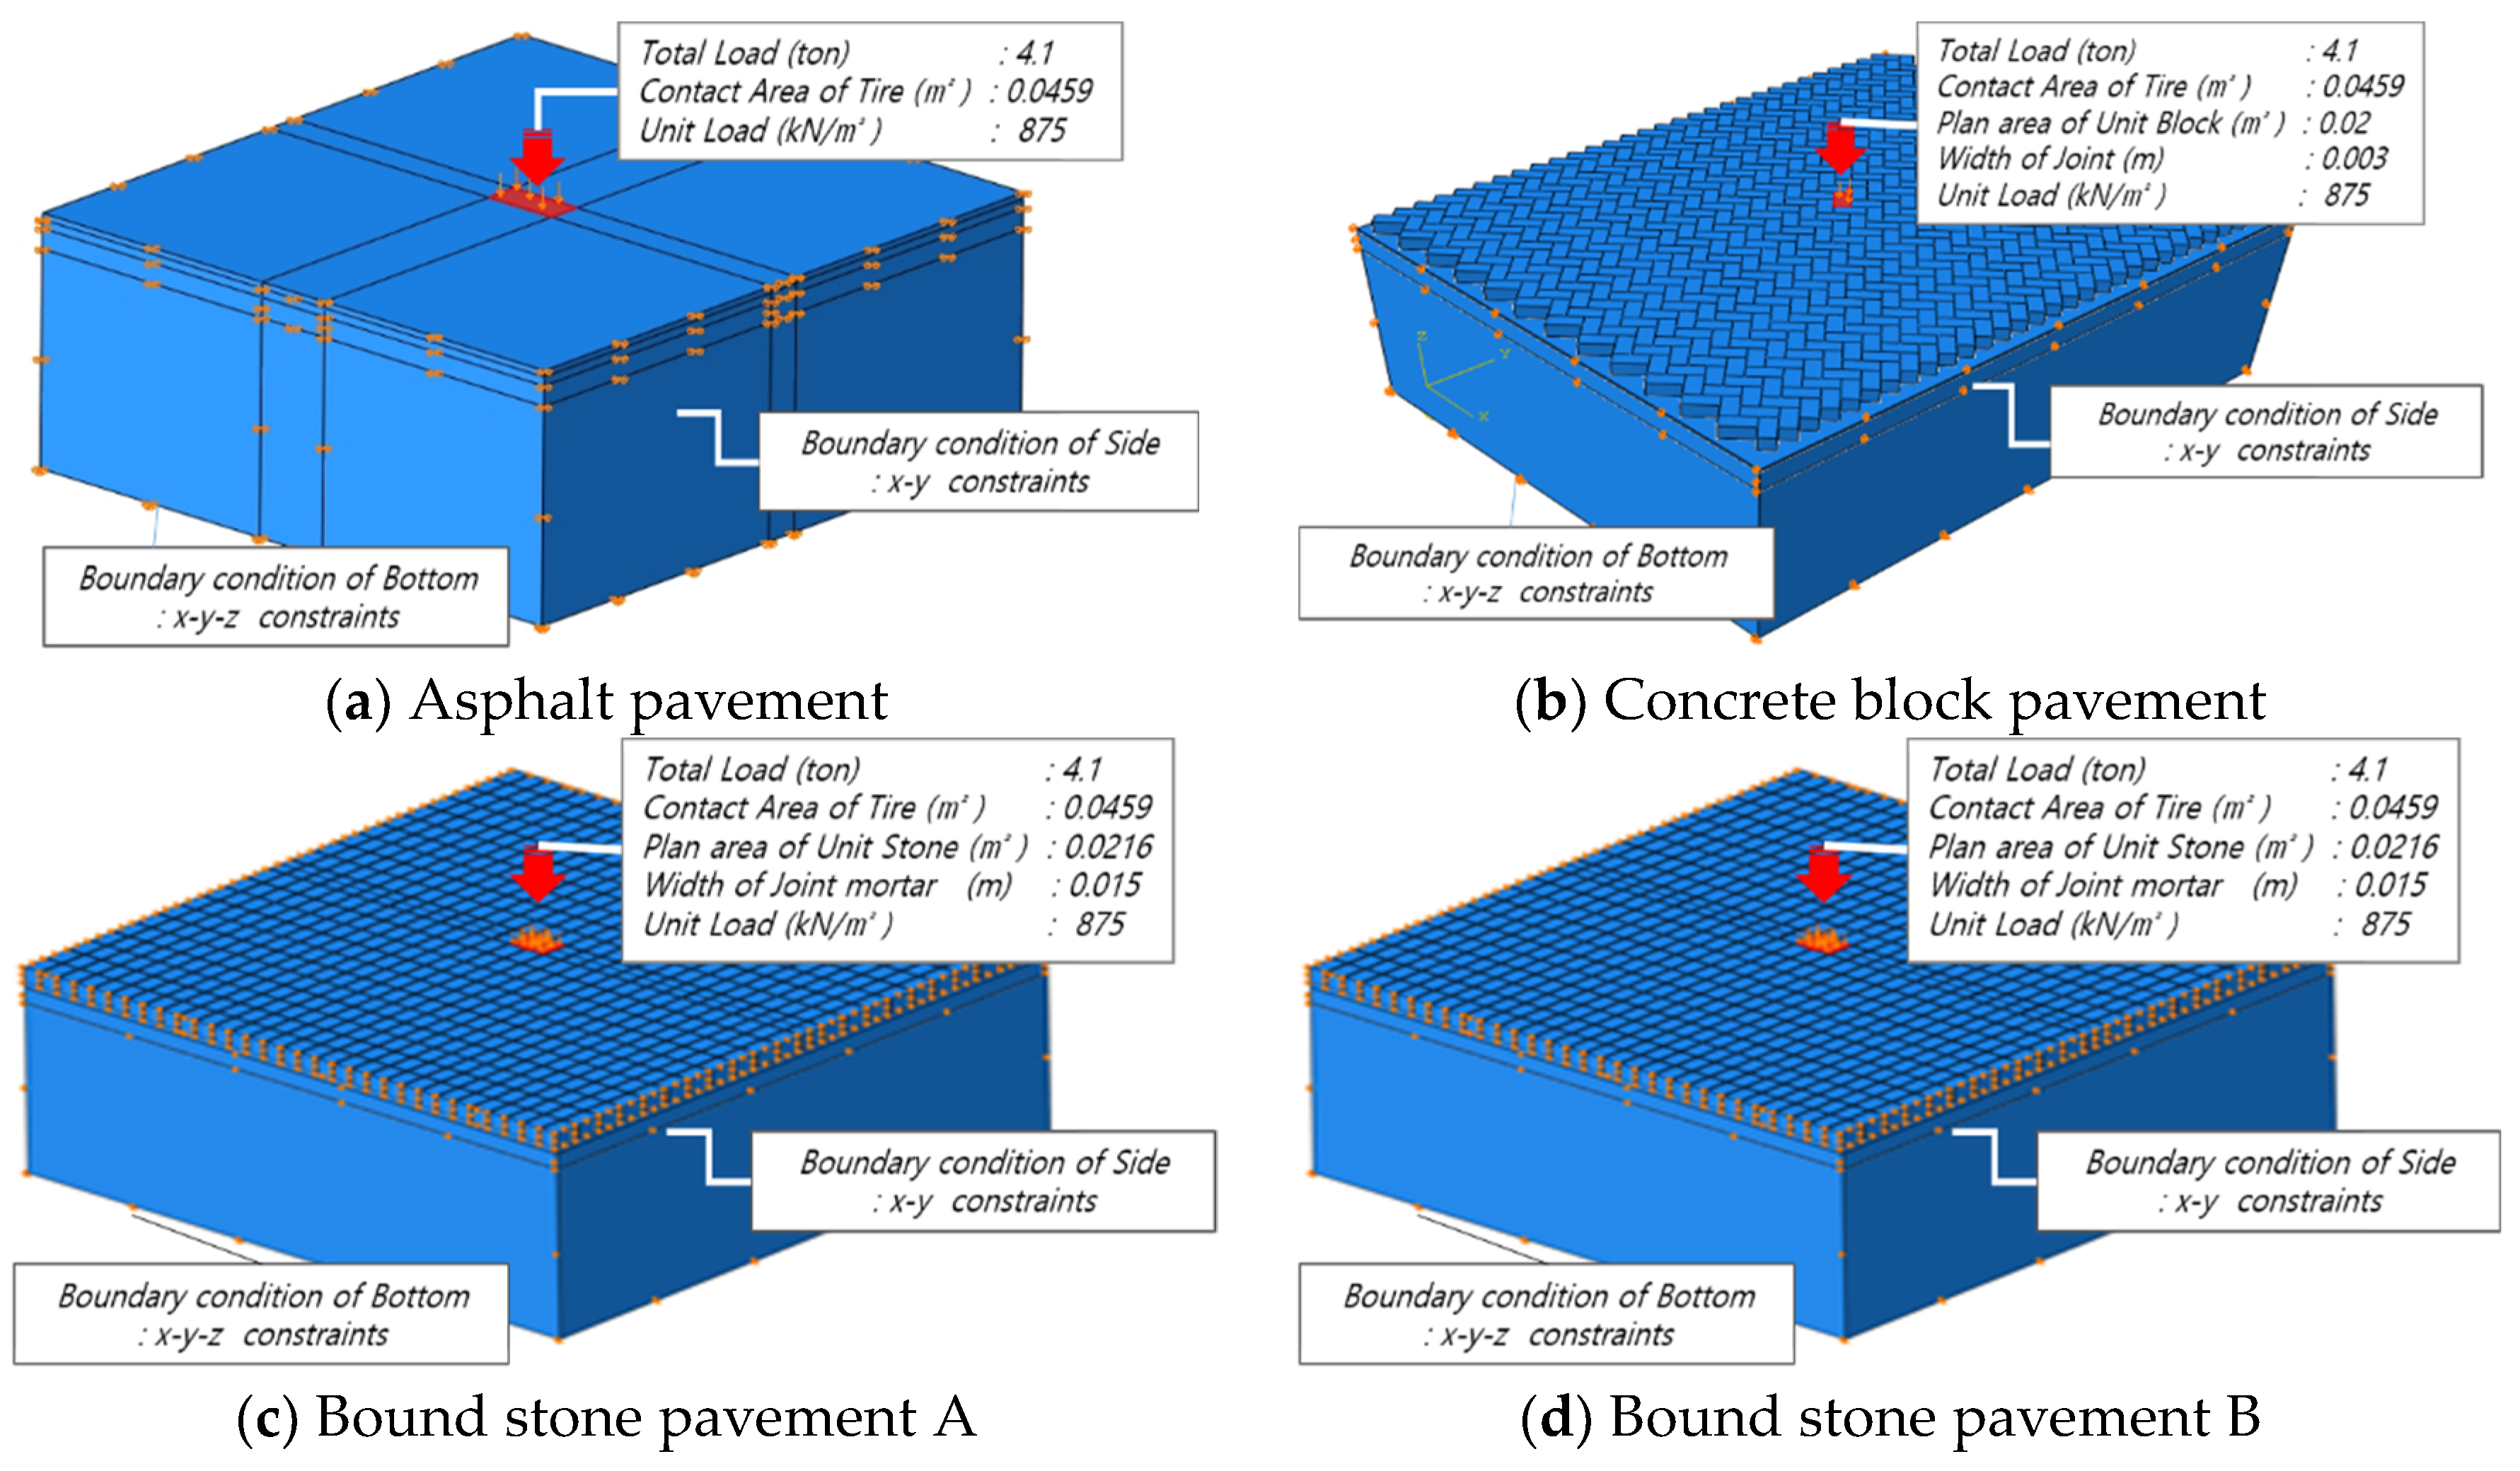
As illustrated in
Figure 4, the contact area and a load of a single tire of heavy vehicle simulator, which was 0.0459 m
2 (0.18 m × 0.255 m) and 4.1 ton, respectively, were considered for the computational simulation in order to demonstrate the APT completed in the first part of the study. To simulate the dynamic wheel load, the load was gradually imposed onto the surface with a speed of 0.41 ton/s for 10 s. Once the wheel load was fully exerted on, the imposed load was dislodged with the same ratio and those steps for 20 s were dealt with a single loading cycle. The target loading cycles were 1.97 million cycles which were equivalent to 1.97 million ESALs.
To model the testing pavements, the eight-node brick element with reduced integration (C3D8R) that is the element family provided by ABAQUS software was introduced. Normally, it is used in stress analysis and continuum element. As indicated in
Table 4, the surface layer for asphalt and stone pavements was used as an elastic material model. Additionally, concrete damaged plasticity and Mohr-Coulomb material models were assigned for the concrete and asphalt layers respectively. A Drucker–Prager-type concrete plasticity model was selected for the mortar for joint and laying course.
4. Result and Discussion
4.1. Skid Resistance Test
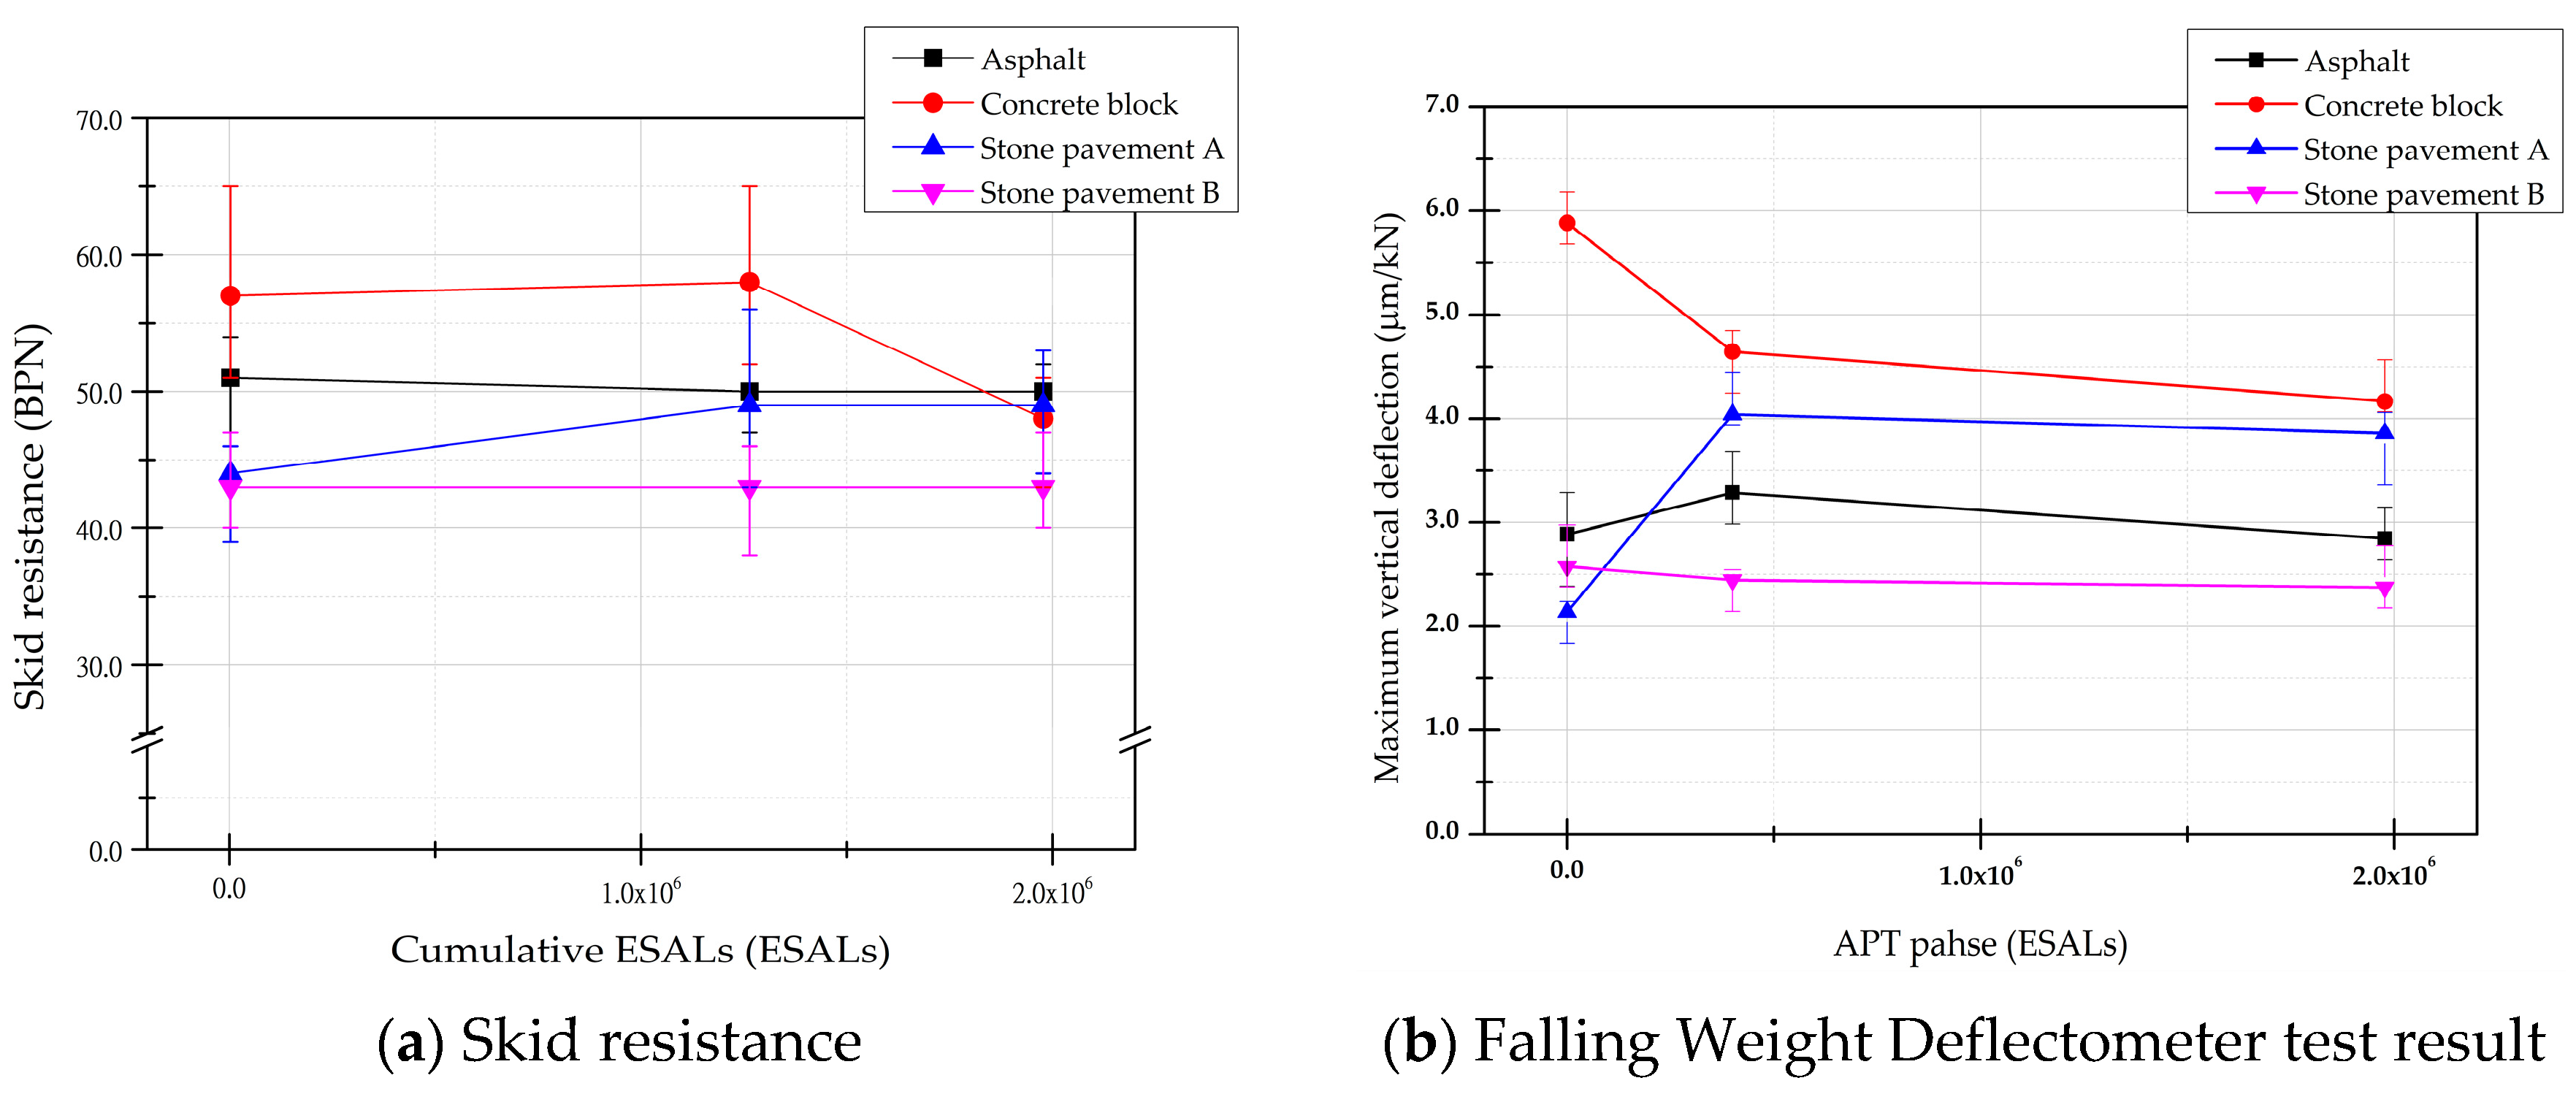
The surface frictional properties of the testing pavements were measured using the BPT. The measuring points of each pavement were selected at a wheel loading path and the centre of wheel alignment. As described in ASTM-303, the mean BPN data of each pavement at the cumulative ESALs of 0, 1.3 and 1.97 million was collected and plotted in
Figure 5a. There were minor or no BPN differences in asphalt and stone pavement B. However, the BPN of concrete block was dramatically dropped between 1.3 and 1.97 million ESALs. The BPNs of stone pavements ranged from 43 to 49 and this indicated greater than a satisfactory of block and stone pavements surface (32 BPN) for travelling under 60 km/h from Road Safety Facilities Installation and Management Guidelines in Korea.
4.2. Falling Weight Deflectometer Test
The FWD test was conducted to evaluate the pavement deflections in response to a temporally exerted load such as a driving wheel load. The measurements were performed by following the test method of ASTM D 4694-09 and were obtained at 0, 0.4 and 1.97 million ESALs of the APT. As plotted in
Figure 5b, there were sudden changes of vertical deflection in concrete block and bound stone pavement A at 0.4 million ESALs. In the case of concrete block, the response of surface deflection rapidly declined and gradually stabilised in the early stage and end of the APT respectively. This circumstance was initially caused by the compaction of laying sand occurred by the driving wheel loads. Comparing the response of both stone pavements, there was a slight increase in the bound stone pavement A. This would be influenced by the material difference of base courses which were asphalt and concrete.
4.3. Finite Element Analysis
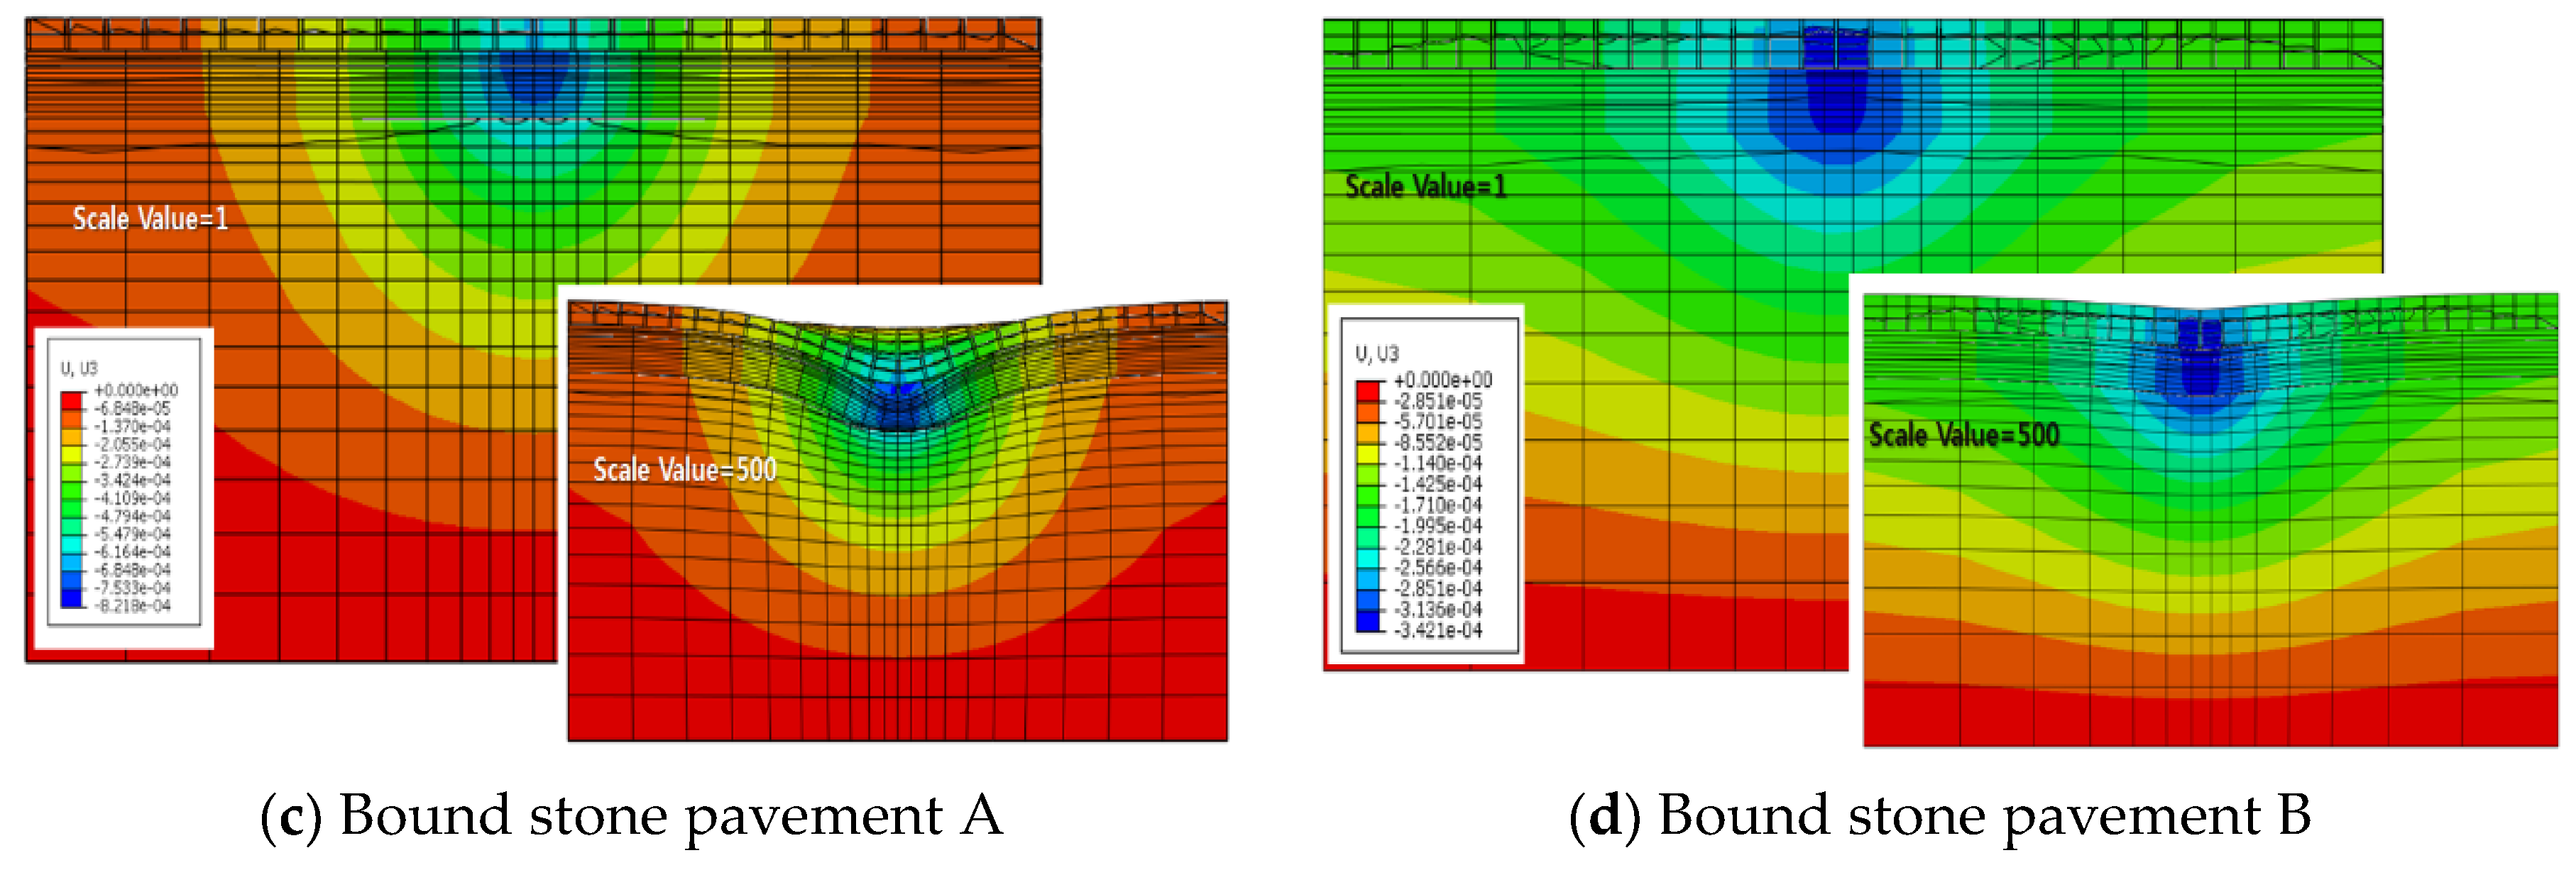
The finite element analysis was conducted in order to examine the deformations of pavements during the accelerated simulation and to measure rut depth.
Figure 6 indicates the cross-sectional vertical deformations of each testing pavement at 50 loading cycles. As shown in
Figure 6a, the rut depth at the initial stage of the simulation was calculated to 1.16 mm. This was the largest rut depth compared to the other pavements. In the rest of pavements, the rutting calculations were 0.63, 0.82 and 0.34 mm for concrete block and bound stone pavement A and B, respectively. Comparing two types of stone pavements, the rut depth of bound stone pavement B was calculated relatively lower. The difference in this comparison was mainly caused by the different type of base courses. The asphalt base course was considered as a flexible construction.
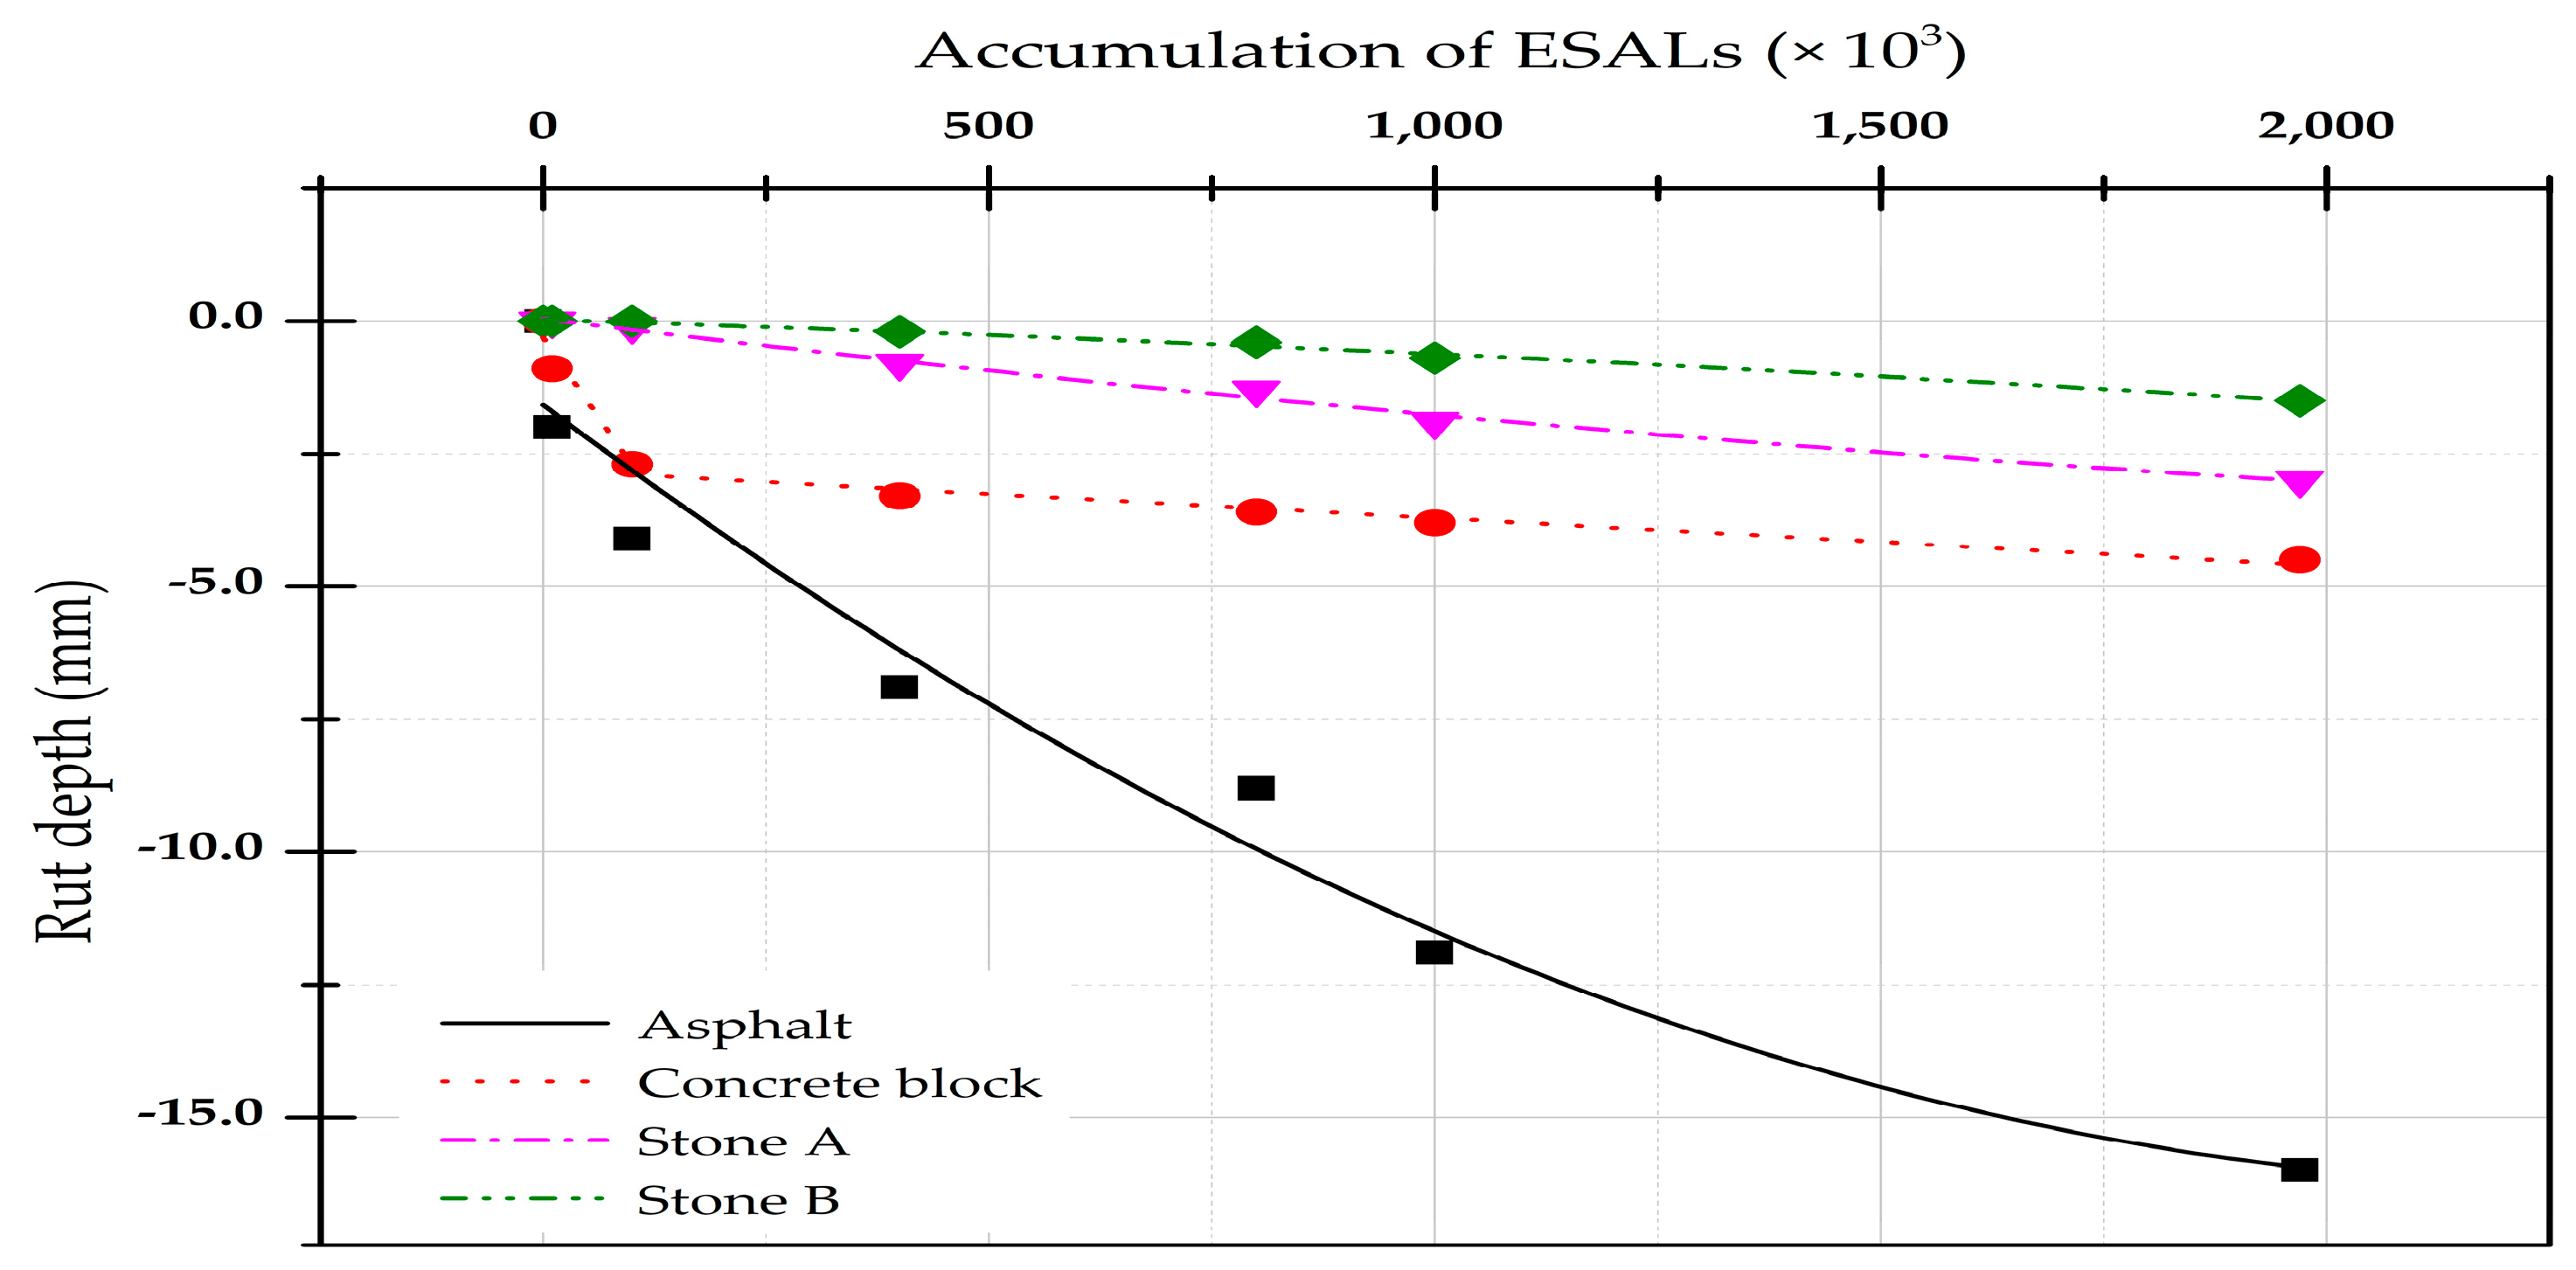
Figure 7 indicates rut depth calculation data according to the cumulative number of loading cycles. As shown in
Figure 7a, the trend lines of vertical deflection were gradually increased in all the testing pavements except concrete block pavement. For the concrete block pavement, there was a rapid drop from 0 to 5000 loading cycles, and it was made by the compaction of laying sand. The terminal deformations of the pavements were determined as 17.7, 6.1, 6.3 and 3.6 mm for asphalt, concrete block and bound stone A and B pavement, respectively. The greater value was calculated in the bound stone pavement A compared to stone pavement B. Additionally, a slope of the trend line in the bound stone pavement A increased after one million loading cycles. These circumstances were caused by different material types of base courses which were asphalt and concrete.
Figure 8 is a plotted data of rut depth measurements obtained from the APT in the first part of the current study. The final rut depth of the APT was recorded as 16.0, 4.5, 3.0 and 1.5 mm for asphalt, concrete pavement and bound stone pavement A and B, respectively. Approximately, the trend lines in
Figure 7 and
Figure 8 show great agreements over both accelerated and computational simulation periods in asphalt and concrete block pavements. On the other hand, comparing rut depth outcomes at the end of both test and simulation, there were 52.4% and 58.3% of increases in FEM analysis of the bound stone pavement A and B, respectively. For the improved analysis of bound stone pavements, it would be necessary to consider the enhanced modelling of bedding course such as the influence of joint mortar loss.
5. Conclusions
To overcome the obstacles of stone pavements, the bound stone pavement B was offered for less than 1000 AADTT and 60 km/h of operating speed. Even though various studies of long-term serviceability for asphalt and concrete block pavements have been conducted, a few researches have been completed to analyse the performance using the APT. To evaluate the long-term serviceability for bound stone pavement, the testing pavements such as asphalt, concrete block and two types of stone pavements were designed by following corresponding design specifications in the previous part of this study. Primarily, the skid resistance test using BPT was performed at the specific stage of the APT to identify the changes of skid resistance of the surface courses. The test results of block and stone pavements met the satisfactory which are 32 BPN from the guideline. For the next test, the pavement deflections in the response of FWD were measured to validate the structural capacity for design and pavement management purposes. The test results were influenced by base course construction and material types (flexible and rigid). The FEM analysis was conducted by modelling with the mechanical property information of the materials. Additionally, the loading cycle was also created for imitating the APT. The maximum terminal deflections of asphalt, concrete block, stone A and stone B were calculated as 17.7, 6.1, 6.3 and 3.6 mm, respectively. Compared to the final outcomes of APT and FEM analysis, there were 2.1 mm (58.3%) and 3.3 mm (52.4%) increases in rut depth in bound stone pavement B and A, respectively. Throughout the first and second parts of the study, diverse test methods, such as plate load, skid resistance, Falling Weight Deflectometer tests and Finite Element Method analysis, were introduced for investigating the long-term performance of the bound stone pavement. Moreover, those test results would be applicable for building the baseline data for design and maintenance uses.
Author Contributions
Conceptualisation, E.-S.H. and D.C.; Methodology, E.-S.H., J.G., S.-K.P. and D.C.; Experiment, E.-S.H., J.G. and S.-K.P.; Validation, D.C.; Formal Analysis, E.-S.H. and S.-K.P.; Investigation, E.-S.H., J.G., H.J. and D.C.; Data Curation, E.-S.H. and J.G.; Writing—Original Draft Preparation, J.G. and E.-S.H; Writing—Review & Editing, D.C.; Visualisation, J.G.; Supervision, D.C.; Project Administration, D.C. All authors have read and agreed to the published version of the manuscript.
Funding
This study was supported by the Research Scholarship of the Chungnam National University in 2019. The authors gratefully acknowledge this support.
Conflicts of Interest
The authors declare no conflicts of interest.
References
- Coni, M.; Portas, S.; Maltinti, F.; Pinna, F. Sealing of paving stone joints. Int. J. Pavement Res. Technol. 2018, 11, 819–828. [Google Scholar] [CrossRef]
- Zoccali, P.; Moretti, L.; Mascio, P.D.; Loprencipe, G.; D’Andrea, A.; Bonin, G.; Teltayev, B.; Caro, S. Analysis of natural stone block pavements in urban shared areas. Case Stud. Constr. Mater. 2018, 8, 498–506. [Google Scholar] [CrossRef]
- Han, E.S.; Gong, J.; Cho, D.; Park, S.K. Experimental Investigation on the Application of Ultra-Rapid-Hardening Mortar for Rigid Small Element Pavement. Adv. Mater. Sci. Eng. 2019, 2019, 9. [Google Scholar] [CrossRef]
- Miccoli, S.; Finucci, F.; Murro, R. Social Evaluation Approaches in Landscape Projects. Sustainability 2014, 6, 7906–7920. [Google Scholar] [CrossRef]
- Moretti, L.; Mascio, P.D.; D’Andrea, A. Environmental impact assessment of road asphalt pavements. Mod. Appl. Sci. 2013, 7, 1–11. [Google Scholar] [CrossRef]
- Miccoli, S.; Finucci, F.; Murro, R. Assessing Project Quality: A Multidimensional Approach. Adv. Mater. Res. 2014, 1030–1032, 2519–2522. [Google Scholar] [CrossRef]
- Pouranian, M.R.; Shishehbor, M. Sustainability Assessment of Green Asphalt Mixtures: A Review. Environments 2019, 6, 73. [Google Scholar] [CrossRef]
- Jeong, H.; Gong, J.; Yoon, W.; Cho, D. The Development of a Surface Finisher of Car Park Slab Using Waterborne Silicon Acrylic with Polyamide [Part I: Performance Evaluation]. Materials 2019, 12, 171. [Google Scholar] [CrossRef] [PubMed]
- Gong, J.; Jeong, H.; Cho, D. The Development of a Surface Finisher of Car Park Slab Using Waterborne Silicon Acrylic with Polyamide [Part II: Safety Tests]. Materials 2019, 12, 158. [Google Scholar] [CrossRef] [PubMed]
- Harvey, J.; Popescu, L. Accelerated Pavement Testing of Rutting Performance of Two Caltrans Overlay Strategies. Transp. Res. Rec. 2000, 1716, 116–125. [Google Scholar] [CrossRef]
- Erlingsson, S. Performance of two thin pavement structures during accelerated pavement testing using a Heavy Vehicle Simulator. In Proceedings of the 2nd International Conferences on Accelerated Pavement Testing, Minneapolis, MN, USA, 26–29 September 2004. [Google Scholar]
- Romanoschi, S.A.; Metcalf, J.B.; Li, Y.; Rasoulian, M. Assessment of Pavement Life at First Full-Scale Accelerated Pavement Test in Louisiana. Transp. Res. Rec. 1999, 1655, 219–226. [Google Scholar] [CrossRef]
- Gokhale, S.; Choubane, B.; Byron, T.; Tia, M. Rut Initiation Mechanisms in Asphalt Mixtures as Generated under Accelerated Pavement Testing. Transp. Res. Rec. 2005, 1940, 136–145. [Google Scholar] [CrossRef]
- Nejad, F.M.; Shadravan, M.R. A Study on Behavior of Block Pavement Using 3D Finite Element Method. In Proceedings of the 8th International Conference on Concrete Block Paving, San Francisco, CA, USA, 6–8 November 2006. [Google Scholar]
- Blab, R.; Kluger-Eigl, W.; Füssl, J.; Arraigada, M. Accelerated pavement testing on slab and block pavements using the MLS10 Mobile Load Simulator. In Proceedings of the 4th International Conference on Advances in Pavement Design Through Full-Scale Accelerated Pavement Testing, Davis, CA, USA, 19–21 September 2012. [Google Scholar]
- Korean Design Specification (KDS). 44 50 00: Road Pavement Design; Korea Construction Standards Center: Goyang-si, Gyeonggi-do, Korea, 2018; Available online: http://www.kcsc.re.kr (accessed on 11 January 2019).
- Expressway Construction Specification (EXCS). 44 50 10: Aspahlt Concrete Paving Construction; Korea Construction Standards Center: Goyang-si, Gyeonggi-do, Korea, 2018; Available online: http://www.kcsc.re.kr (accessed on 11 January 2019).
- Lin, W. Development of Performance Prediction Model for Discrete Layer of Concrete Block Pavement. Ph.D. Thesis, Chung-Ang University, Seoul, Korea, 2015. [Google Scholar]
- Archdata. Available online: www.archidata.co.kr (accessed on 13 August 2019).
© 2020 by the authors. Licensee MDPI, Basel, Switzerland. This article is an open access article distributed under the terms and conditions of the Creative Commons Attribution (CC BY) license (http://creativecommons.org/licenses/by/4.0/).


