Article

Anomalous Humidity Dependence in Photoacoustic Spectroscopy of CO Explained by Kinetic Cooling

Institute of Chemical Technologies and Analytics, Technische Universität Wien, 1060 Wien, Austria
*
Author to whom correspondence should be addressed.
Appl. Sci. 2020, 10(3), 843; https://doi.org/10.3390/app10030843
Submission received: 30 December 2019 / Revised: 18 January 2020 / Accepted: 19 January 2020 / Published: 24 January 2020
(This article belongs to the Special Issue Quartz-Enhanced Photoacoustic and Photothermal Spectroscopy)

Abstract

:

Featured Application

A quantitative model for photoacoustic signals of CO describes their humidity dependence and helps design photoacoustic gas sensors.

Abstract

Water affects the amplitude of photoacoustic signals from many gas phase molecules. In quartz-enhanced photoacoustic (QEPAS) measurements of CO excited at the fundamental vibrational resonance of CO, the photoacoustic signal decreases with increasing humidity, reaches a pronounced minimum at ~0.19%V, and increases with humidity for higher water contents. This peculiar trend is explained by competing endothermal and exothermal pathways of the vibrational relaxation of CO in N2 and H2O. Near-resonant vibrational–vibrational transfer from CO to N2, whose vibrational frequency is 188 cm−1 higher than in CO, consumes thermal energy, yielding a kinetic cooling effect. In contrast, vibrational relaxation via H2O is fast and exothermal, and hence counteracts kinetic cooling, explaining the observed trend. A detailed kinetic model for collisional relaxation of CO in N2 and H2O is presented. Simulations using rate constants obtained from literature were performed and compared to humidity dependent QEPAS experiments at varying pressure. Agreement between the experiments and simulations confirmed the validity of the model. The kinetic model can be used to identify optimized experimental conditions for sensing CO and can be readily adapted to include further collision partners.

1. Introduction

Humidity plays a key role in photoacoustic spectroscopy (PAS) and sensing of many molecules. Water is an efficient quencher that facilitates the conversion of the vibrational energy of other molecules into heat much more rapidly than other collision partners such as N2 or O2 typically would [1]. This can be attributed mostly to the high polarity of water and the resulting attractive forces that occur during molecular collisions [2]. Without efficient quenchers, many molecules, in particular small molecules at reduced pressure, relax too slowly to release all of the absorbed energy within one half period of photoacoustic modulation. Therefore, signals usually increase with water concentration, especially in quartz-enhanced PAS (QEPAS), where modulation frequencies are approximately one order of magnitude higher than in conventional PAS, and fast relaxation is accordingly more important. For mid-IR QEPAS of CO, this trend was confirmed, but only for water concentrations above ~0.19%V [3,4]. For smaller concentrations, the opposite trend is observed. The QEPAS signal decreases with increasing humidity and shows a pronounced minimum at ~0.19%V (compare Figure 2). Although this peculiar behavior has been observed previously [3,4], an interpretation or quantitative model of this effect is still pending.
In this contribution, the humidity dependence of photoacoustic signals from CO excited at the fundamental vibrational frequency can be explained by a kinetic cooling effect that occurs during vibrational–vibrational (V–V) energy transfer from CO to the near-resonant vibration of N2. Kinetic cooling, which refers to a transient decrease of temperature in response to an excitation, was observed previously in photoacoustic measurements of CO2 [5,6,7] as well as thermal lensing measurements of CD4 and SO2 [8]. Additionally, kinetic models for the relaxation of these molecules in different gas matrices were derived [5,9,10]. Kinetic cooling was also observed in the photoacoustic signal of CO excited at its fundamental vibrational frequency at 4.6 μm in nitrogen, however, without discussing the influence of water [11]. In this manuscript, the energy transfer steps in the three component system of CO, N2, and H2O including the V–V transfer from CO to N2 that causes kinetic cooling are summarized. Competition between endothermic V–V transfer from CO to N2 and exothermic energy transfer from CO as well as N2 to H2O was identified as the origin of the observed minimum of the photoacoustic signal at a humidity of 0.19%V. A kinetic model for simulating the photoacoustic response from CO in N2 and H2O was introduced. Simulations were compared with experimental QEPAS measurements of CO at varying humidity and pressure recorded using a custom quartz tuning-fork to validate the introduced kinetic model. Further simulations are presented for excitation frequencies of 32.8 kHz and 1.5 kHz, corresponding to typical excitation frequencies for QEPAS and PAS, respectively.

2. Materials and Methods

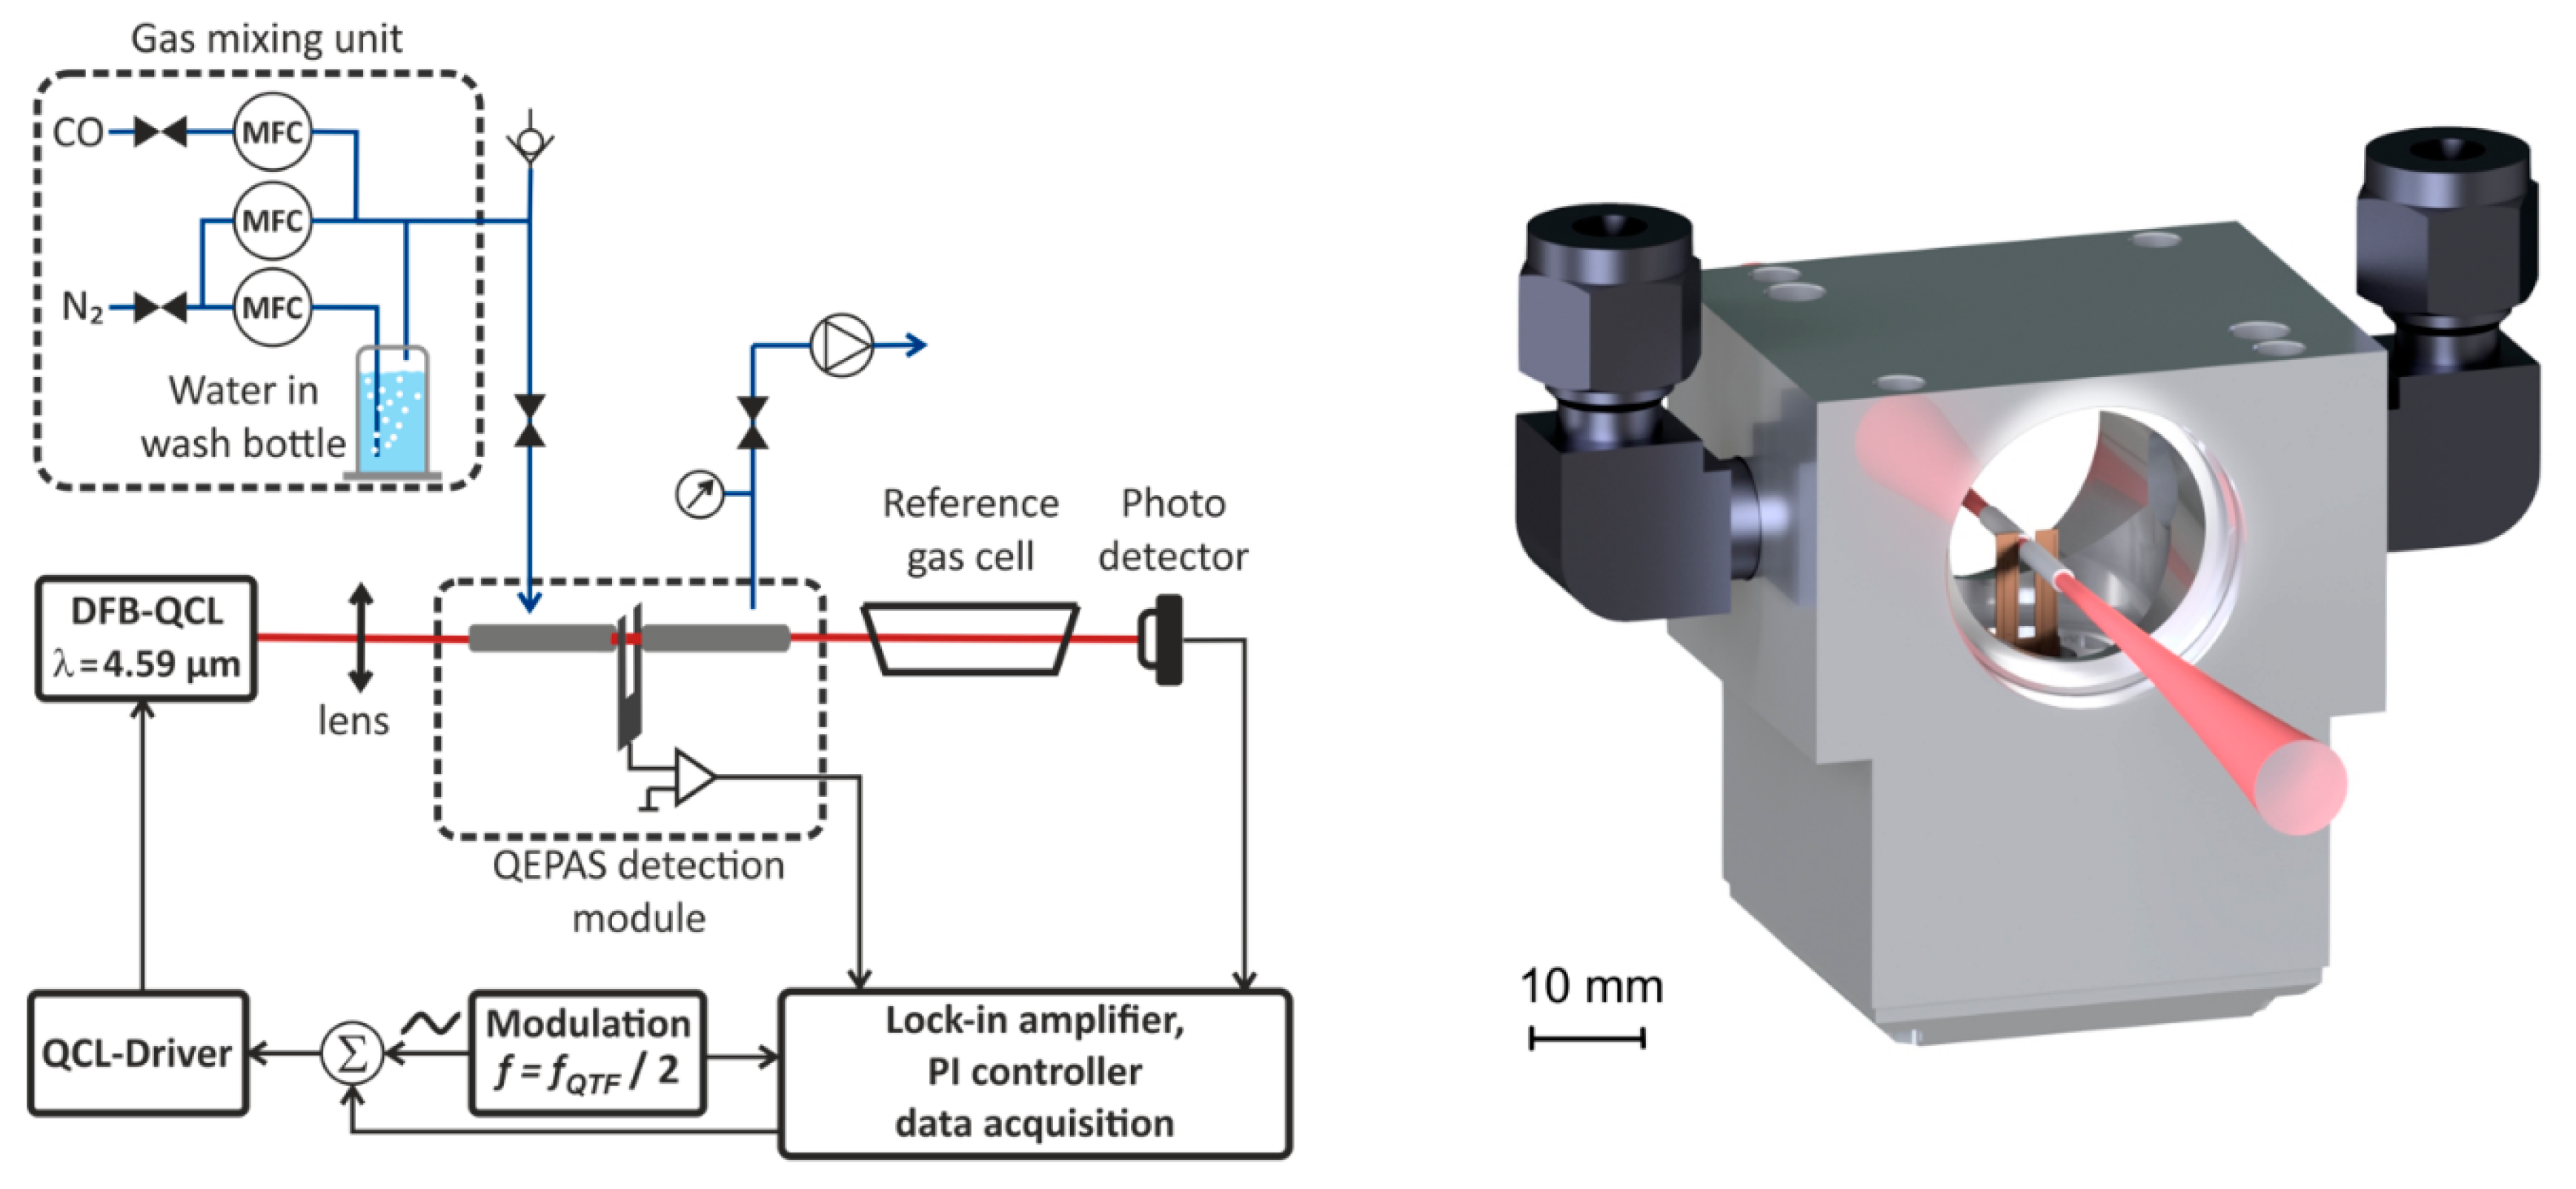
2.1. Measurement of Humidity Dependent 2f-WM-QEPAS Signals of CO

The experimental setup for wavelength modulation QEPAS with second harmonic detection (2f-WM-QEPAS) is illustrated in Figure 1. A distributed feedback quantum cascade laser (DFB-QCL, Adtech Optics, City of Industry, CA, USA) was operated in continuous wave mode at a wavenumber of 2179.77 cm−1. The laser wavenumber was sinusoidally modulated at half the QTF resonance frequency fQTF via a small amplitude current modulation. The laser current was modulated by applying a sinusoidal voltage signal to the analog control input of the laser current driver (QCL OEM300, Wavelength electronics, Bozeman, MT, USA). The modulation amplitude was adjusted to maximize the QEPAS signal for every measurement.
The beam was focused to a spot size (1/e2 radius) of 0.23 mm and directed through the resonator tubes and between the prongs of the quartz tuning fork (QTF). The optical power at the QTF was 25 mW. The QTF was a custom design for QEPAS with a resonance frequency of 12.46 kHz and a prong spacing of 0.8 mm (see [12], design T08, and [13], design S2). The tuning fork including electronic trans-impedance amplification and excitation circuitry was provided as a prototype of a now commercially available QEPAS module (Thorlabs ADM01, Dachau, Germany, compare Figure 1). Two 12.5 mm long stainless steel resonator tubes with a 1.5 mm inner diameter were used as an acoustic resonator [12]. The amplified signal from the QTF was demodulated at the second harmonic of the modulation frequency using a lock-in amplifier (ZI-MFLI, Zurich Instruments, Zurich, Switzerland), yielding the 2f-WM-QEPAS signal. The quality factor Q and resonance frequency fQTF of the tuning fork were measured by exciting the tuning fork by a sinusoidal voltage of stepped frequency and the modulation frequency of the laser was adjusted to half the resonance frequency for every measurement.
After the QEPAS detection module, the beam passed a reference gas cell filled with CO diluted in N2 at 100 mbar and was finally detected on a mercury–cadmium–telluride (MCT) photodetector (PCI-2TE-12, Vigo Systems S.A., Poznańska, Poland). The reference gas cell was used to lock the laser wavelength to the resonance wavenumber of the R9 transition of CO at 2179.77 cm−1 using wavelength modulation locking. To this end, the detector signal was demodulated at the third harmonic of the laser modulation frequency using a lock-in amplifier. The so obtained error signal was used as the input for a digital PI-controller (Digilock 110, Toptica Photonics, Farmington, NY, USA) whose output was applied to the control input of the laser current driver.
All measurements were performed in a steady gas flow. A custom built gas mixing unit [14] was used to prepare samples of defined CO concentration and humidity (see electronic supporting information for more details on the gas mixing unit). Defined flow rates of N2 and CO test gas (100 ppm in N2, Air Liquide, Paris, France) were set using mass flow controllers (MFC). One stream of nitrogen was humidified using a wash bottle filled with water. To achieve a reproducible humidity, the temperature of the wash bottle was stabilized at 40 °C in a water bath thermostat [15]. Using the three MFCs, the humidity was varied stepwise while keeping the concentration of CO constant. The overall flow rate was set to 1200 sccm at the MFCs, of which approximately 300 sccm were pumped through the gas cell and the remaining flow was directed through a check valve. The humidity of the mixed gas was determined in a separate transmission FTIR measurement (Vertex 80v, Bruker Optics, Ettlingen, Germany). To this end, absorption measurements of the gas at varying humidities were taken in a 10 cm gas cell at ambient pressure and the volumetric concentrations of H2O were obtained from the absorption spectra based on a reference spectrum of H2O from the IR spectral database of the Pacific Northwest National Laboratory (PNNL) [16].
Experimentally, it was found that the concentration of CO varied between the measurements of different humidity even though the nominal concentration as set by the gas mixing unit should be constant. The actual concentration of CO was therefore measured using wavelength modulation spectroscopy with second harmonic detection (2f-WMS). To this end, the QEPAS-module and the reference gas cell were removed from the setup and a 10 cm gas cell was inserted in the beam path. The measured 2f-WMS signal was used to normalize the QEPAS signals recorded at varying humidity to CO concentration.

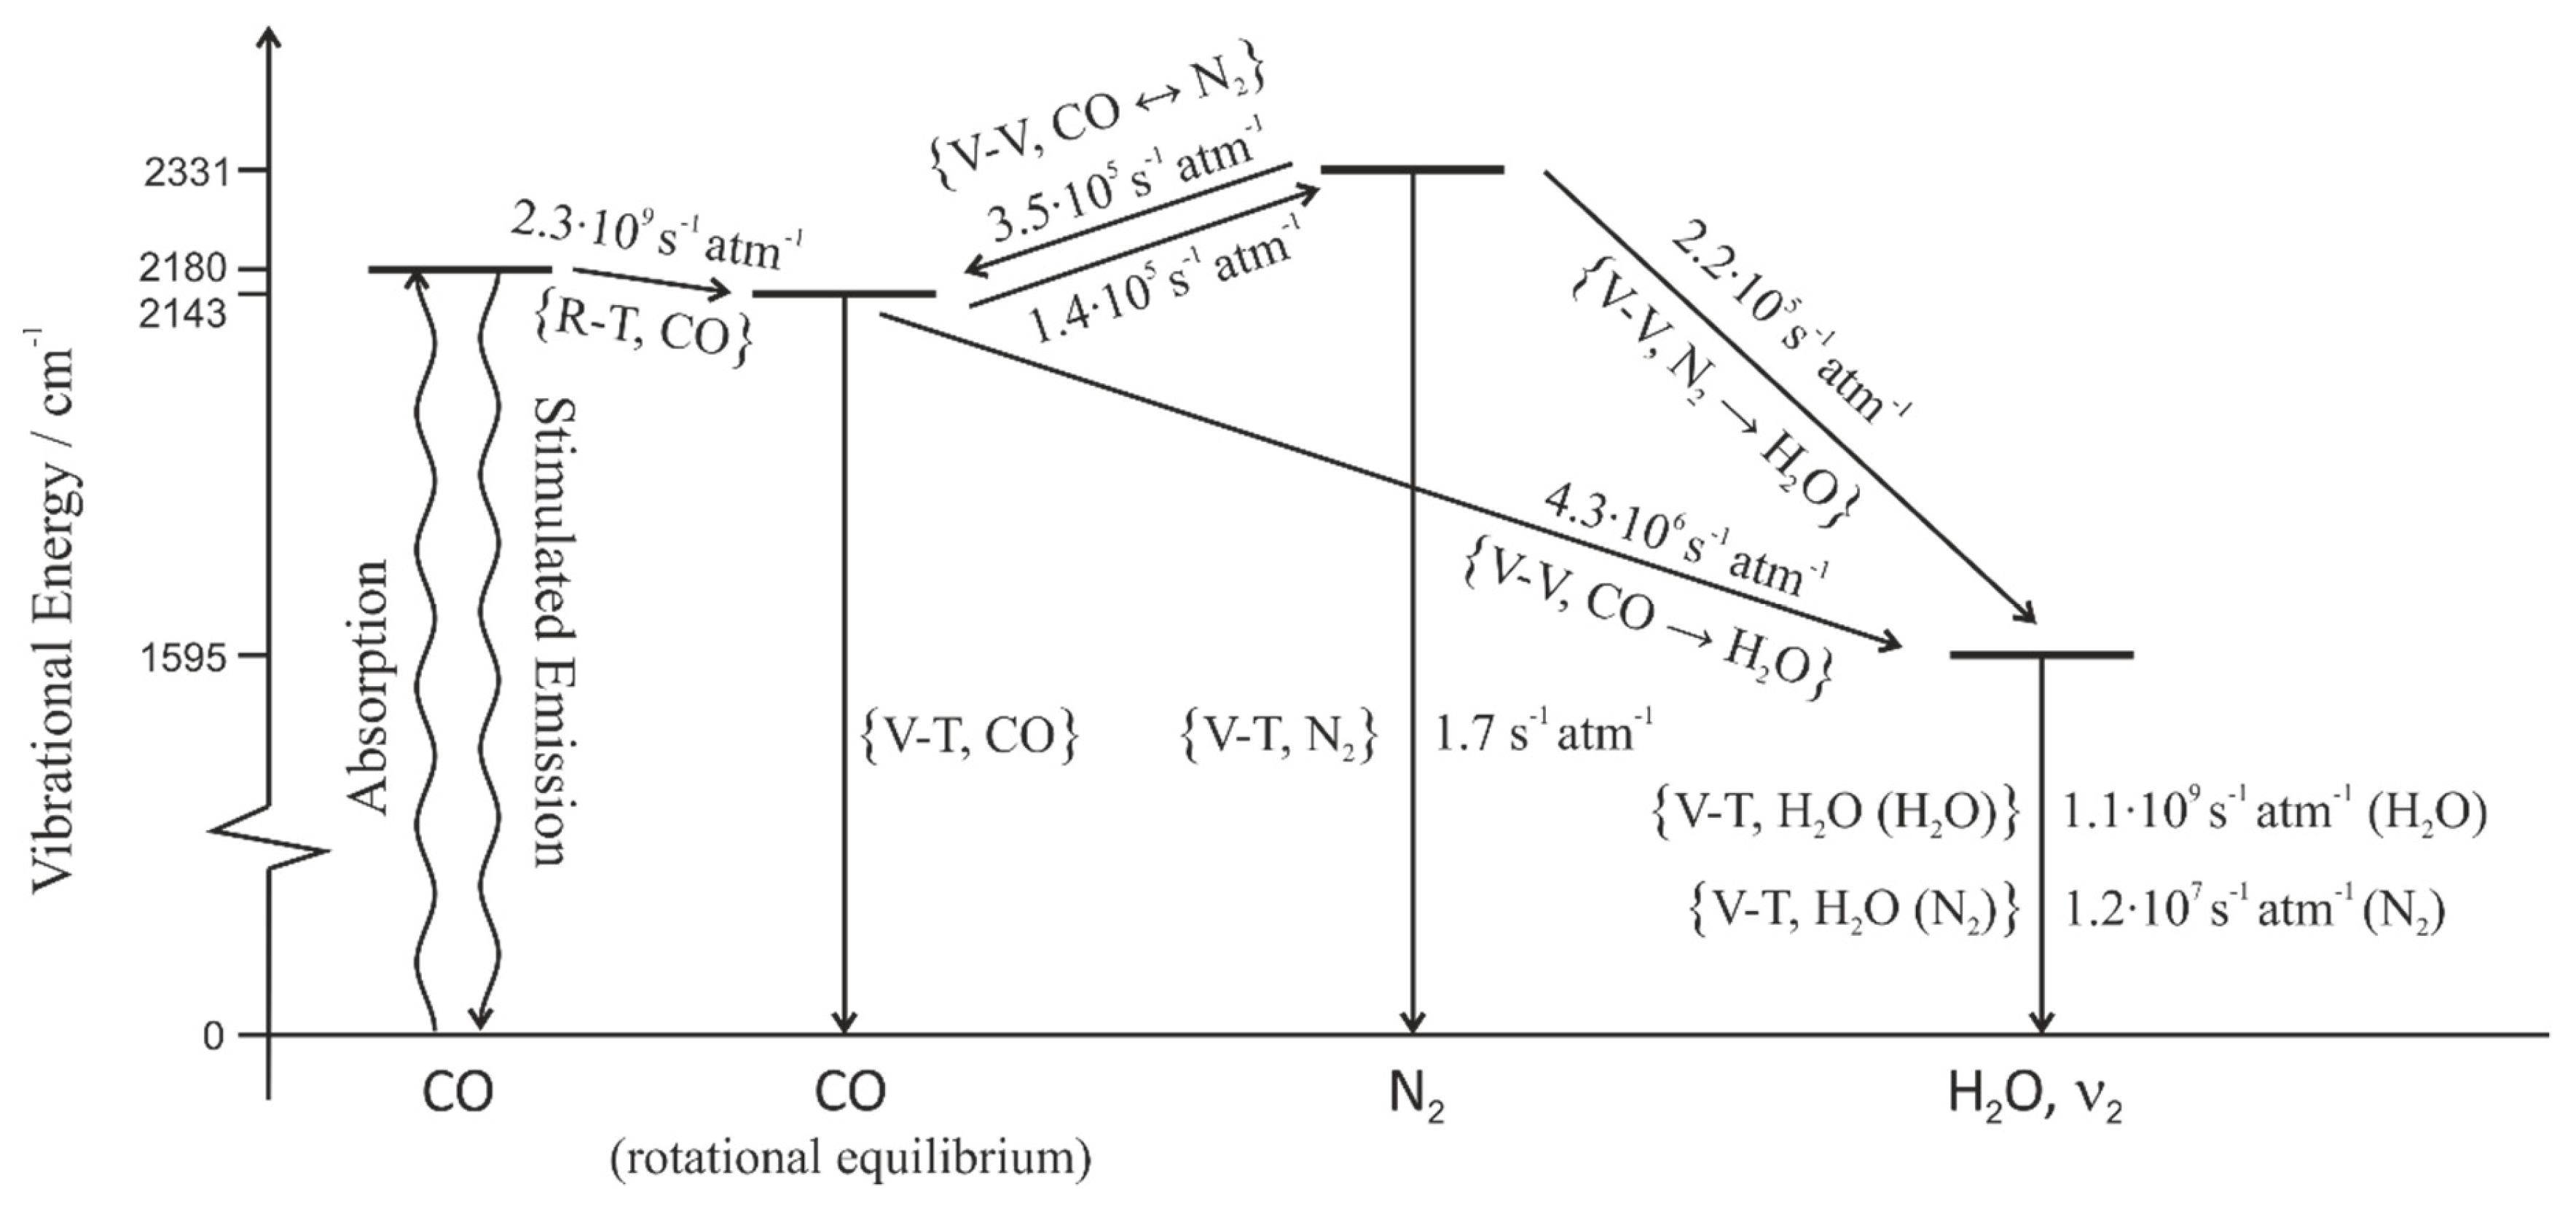
2.2. Collisional Energy Transfer and Relaxation

For transitions in the infrared spectral region, spontaneous emission is relatively slow (ms timescale). Therefore, at a pressure of tens to hundreds of mbar as typically used for PAS based sensing, vibrationally excited molecules relax almost exclusively via inelastic collisions, during which energy can be transferred inter- and intramolecularly between vibrational, rotational, and translational degrees of freedom [2], of which only translational energy contributes to photoacoustic signals. The collision frequency between a single molecule A with molecules B is given by
Z A B = 2 N B D A B 2 k T π μ = 2 p B k T D A B 2 R T π M A M B M A + M B
Herein, N B = p B / k T is the number density of molecules B; pB is the partial pressure of B; D A B = π ( r A + r B ) 2 is the collision cross section; ri is the kinetic radius of molecule i; k is the Boltzmann constant; T temperature; μ = k R · M A M B M A + M B the reduced mass; pB the partial pressure of B; R the gas constant; and M is the molar mass. On average, only one out of Z ^ A B collisions leads to a particular energy transfer. Hence, the rate for that energy transfer from a single molecule A is given by
γ A B = Z A B Z ^ A B
The so called collision number Z ^ A B is related to the collision number Z ^ B A of the inverse process via
Z ^ B A = Z ^ A B exp ( Δ E k T )
where Δ E is the energy difference between the modes between which energy is transferred ( Δ E > 0 for E A > E B ).
The energy difference Δ E is released as (exothermic direction) or consumed from (endothermic direction) kinetic energy (i.e., heat.) The thermal power deposited per unit volume H represents the source of photoacoustic pressure p [17,18].
2 t 2 p c a c 2 p = ( γ 1 ) t H
Herein, cac is the speed of sound and γ is the heat capacity ratio. As shown below, H can be simulated by calculating the rate at which energy is transferred from an excited molecule in a given process and subsequent multiplication of this rate with Δ E for that process. The sum over all possible energy transfers yields the net thermal power H and the photoacoustic signal.

3. Results

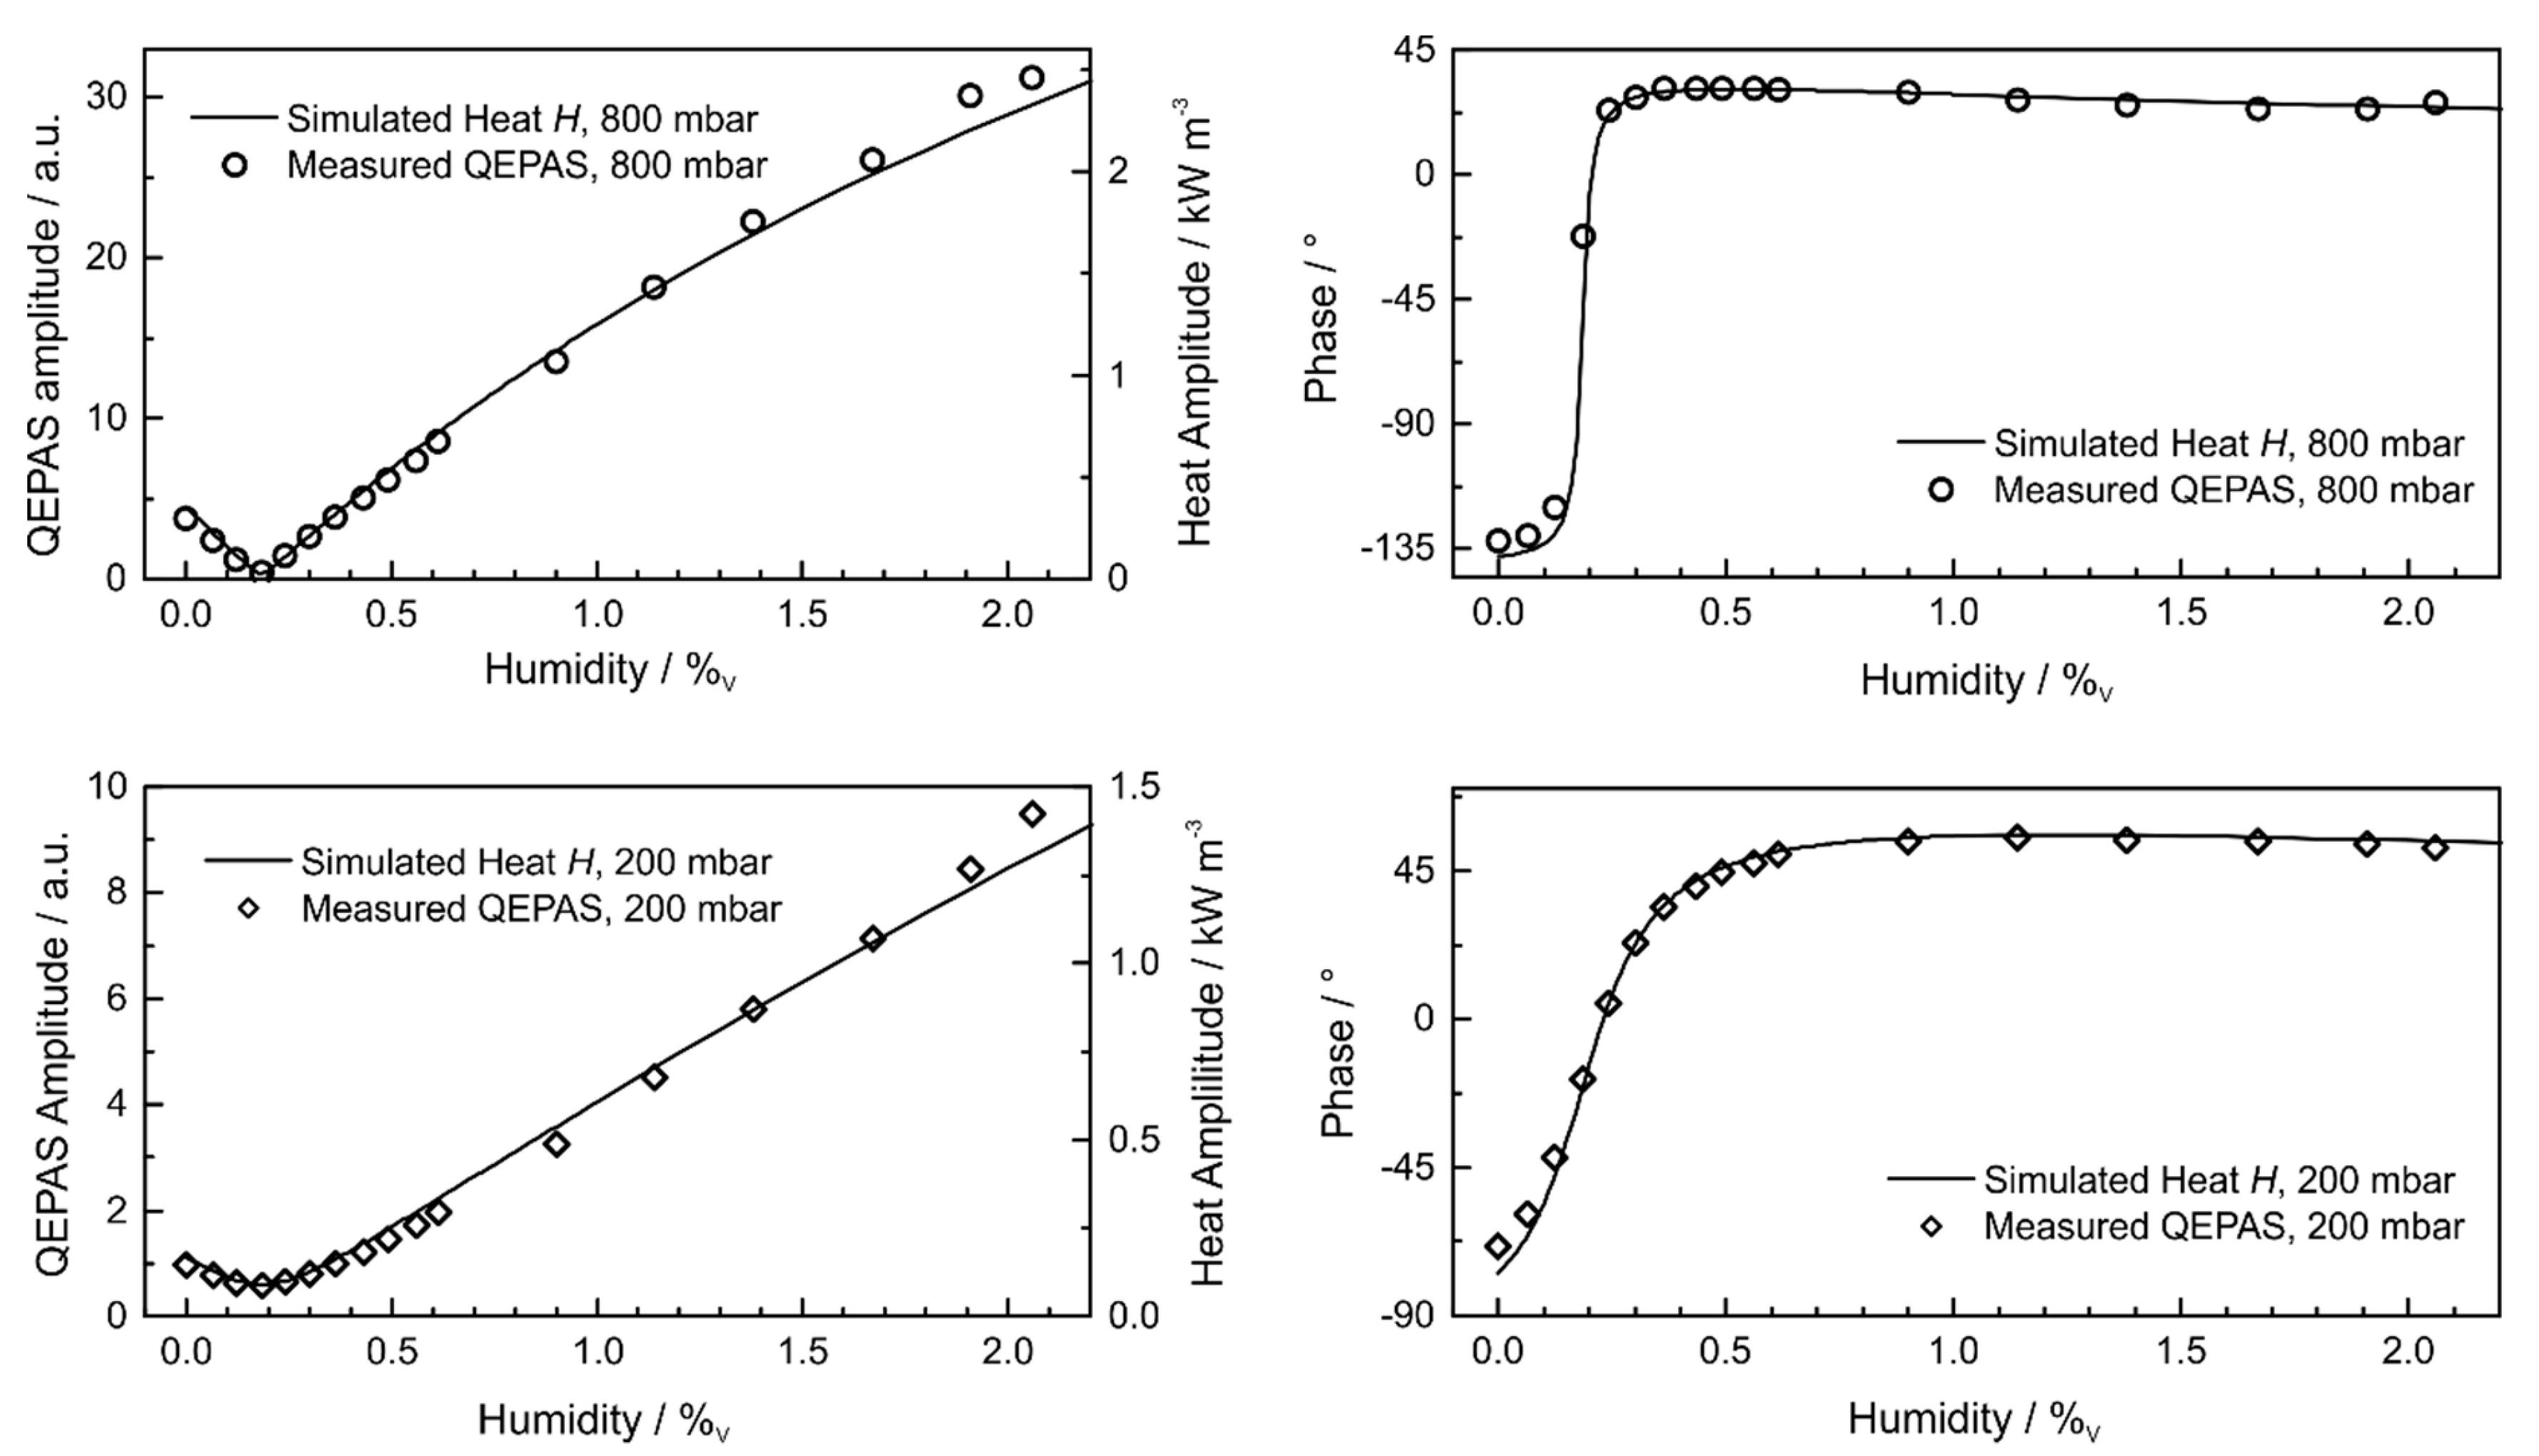
3.1. Humidity Dependence in the Experiment

Using the 2f-WM-QEPAS setup described in Section 2.1, the photoacoustic signal from 20 ppm of CO in N2 was recorded at a pressure of 200 mbar as well as 800 mbar while the humidity was varied. The laser wavelength was locked to the peak of the R9 transition of CO throughout. To correct for changes of the quality factor Q and resonance frequency fQTF of the tuning fork with pressure and humidity, Q and fQTF were measured for each pressure and humidity (see Figure S2 in the electronic supporting material). The excitation frequency was adjusted for every data point in Figure 2 and the photoacoustic signal was normalized by Q.
The amplitude of the QEPAS signal showed a pronounced minimum at a humidity of 0.19%V. The minimum in amplitude was accompanied by a change of phase from dry N2 to humidified N2 of 155° (800 mbar) and 125° (200 mbar). The phase change was more abrupt and the minimum in amplitude was more pronounced for a sample pressure of 800 mbar when compared to 200 mbar.

3.2. Collisional Relaxation in the CO, N2, and H2O System

To explain the peculiar trend of the QEPAS signal of CO with humidity, the processes involved in the excitation and relaxation of CO in N2 and H2O are summarized in Figure 3. The number density N C O * of CO molecules in the excited vibrational state changes along a coherent pathway (absorption and stimulated emission) and a non-coherent pathway (inelastic collisions). Spontaneous emission as well stimulated emission are neglected in the following (linear regime).
The non-coherent processes involved in the relaxation of CO are rotational–translational (R–T), vibrational-vibrational (V–V), and vibrational–translational (V–T) transfers. The collision numbers Z ^ A B and the collision rates Z A B for the involved collisional energy transfers are summarized in Table 1. The fastest step is R–T transfer from the rotational level J = 10, which leads to the rapid establishment of rotational thermal equilibrium within the excited vibrational state. The same is true for the vibrational ground state for which the rotational energy level J = 9 is rapidly repopulated. The net kinetic energy released in R–T transfer equals the difference between the excitation wavenumber (2179.77 cm−1) and the wavenumber of the vibrational mode (2143 cm−1).
V–V transfer occurs between CO and N2 (bidirectional), from CO to H2O and from N2 to H2O. In the absence of H2O, V–V transfer to N2 is much faster than V–T relaxation of CO and is hence the prevailing process. At low concentrations and partial pressure p of CO (ppm range), the collision rate Z N 2 C O is so low that, on the timescale of photoacoustic modulation, V–V transfer from N2 back to CO can be neglected. Therefore, V–V transfer only occurs in the endothermic direction from CO to N2, yielding a kinetic cooling effect. Exothermic V–T relaxation of N2 is sufficiently slow to not contribute to the photoacoustic signal and therefore does not cancel the kinetic cooling effect.
In the presence of H2O, exothermic V–V transfer from CO as well as N2 to H2O occurs, followed by fast V–T relaxation of the ν2 vibration of H2O. Due to the fast depopulation of the excited ν2 state of H2O via V–T relaxation, V–V transfer to H2O is considered unidirectional.
Due to the opposite sign of the heat transferred from CO to N2 (cooling) and CO and N2 to H2O (heating), the photoacoustic signals corresponding to these different pathways are also of opposite sign (i.e., their phase differs by 180°). This explains the change of phase from low to high humidity observed in Figure 2. The minimum of the QEPAS amplitude at ~0.19%V in Figure 2 originates from the mutual cancellation of endothermic and exothermic transfers, as is demonstrated below.

3.3. Rate Equations and Quantitative Model

Based on the scheme of collisional energy transfers shown in Figure 3, the rate equations for the number density N of all involved molecular species can be defined: CO , CO * , N 2 , N 2 * , H 2 O , and H 2 O * . Here, “*” denotes the vibrationally excited state (ν2 bending mode of H2O). Thermal rotational equilibrium is assumed at any time and the small contribution from rotational relaxation to the dissipated heat will be included later. The rate equation for N C O can be written as a sum of coherent excitation of CO, N ˙ C O , and collisional relaxation of vibrationally excited CO*, N ˙ C O * .
N ˙ C O * = N ˙ C O = N ˙ C O + N ˙ C O *
As before, stimulated emission was neglected ( N C O N C O * ) . According to Figure 3, N ˙ C O * holds contributions from V–V transfer between CO and N2 as well as H2O.
N ˙ C O * = N ˙ C O N 2 V V + N ˙ C O H 2 O V V
N ˙ C O N 2 V V = N C O * Z C O N 2 Z ^ C O N 2 + N N 2 * Z N 2 C O Z ^ N 2 C O
N ˙ C O H 2 O V V = N C O * Z C O H 2 O Z ^ C O H 2 O
Herein, Equation (2) was used to describe the rates of V–V transfer in terms of collision rates and collision numbers. As outlined above, the second term in Equation (7) describing the V–V transfer from N 2 * back to CO can be neglected if the concentration of CO is small. Analogous to Equation (6), the rate equations for the number densities of N 2 * and H 2 O * can be written as
N ˙ N 2 * = N ˙ N 2 H 2 O V V N ˙ C O N 2 V V + N ˙ N 2 * V T
N ˙ N 2 H 2 O V V = N N 2 * Z N 2 H 2 O Z ^ N 2 H 2 O
N ˙ N 2 * V T = N N 2 * Z N 2 N 2 Z ^ N 2 N 2
and
N ˙ H 2 O * = N ˙ C O H 2 O V V N ˙ N 2 H 2 O V V + N ˙ H 2 O * V T
N ˙ H 2 O * V T = N H 2 O * ( Z H 2 O N 2 Z ^ H 2 O N 2 + Z H 2 O H 2 O Z ^ H 2 O H 2 O )
The collision rates ZA-B are given by Equation (1) with the kinetic radii r H 2 O = 132   pm , r N 2 = 182   pm , and r C O = 188   pm and molar masses M C O = M N 2 = 0.028   kg   mol 1 and M H 2 O = 0.018   kg   mol 1 [23]. The collision rates and collision numbers for the involved energy transfers are summarized in Table 1.
As outlined in Section 2.2, the energy difference Δ E between the levels involved in V–V and V–T transfer is released or taken up as heat (compare Table 1). Hence, the thermal energy H dissipated per unit time and volume is directly proportional to the rates N ˙ given in Equations (6)–(8).
H = c h ( N ˙ C O N 2 V V 188   cm 1 N ˙ C O H 2 O V V 548   cm 1 N ˙ N 2 H 2 O V V 736   cm 1 N ˙ N 2 * V T 2331   cm 1 N ˙ H 2 O * V T 1595   cm 1 N ˙ C O · 37   cm 1 )
As demonstrated in Section 3.4, numerically solving the rate Equations (5)–(8) and inserting them in Equation (14) allows for H to be simulated in response to modulated excitation and, due to its direct proportionality to H, the photoacoustic signal.
The last term in Equation (14) corresponds to the establishment of thermal rotational equilibrium in the excited vibrational state of CO (R–T relaxation). Since this process is very fast (compare Table 1), it can be assumed to follow the excitation described by N ˙ C O without delay. Aside from its small contribution in Equation (14) and assuming a low excitation intensity (linear optical regime), the excitation term N ˙ C O in Equation (5) is merely a scaling factor for all other rates and the dissipated heat. Assuming N C O N C O * , N ˙ C O is given by [24]
N ˙ C O = N C O 1 B 12 Γ ( ν ˜ ) I c 2 = N C O 1 A 21 8 π h ν ˜ 3 g 2 g 1 Γ ( ν ˜ ) I c 2
where B12 is the Einstein B coefficient; Γ ( ν ˜ ) is the area normalized line-shape function (in m); ν ˜ is wavenumber; c is vacuum speed of light; I denotes optical intensity; h is Planck’s constant; A21 is the Einstein A coefficient of the transition; and gi is the statistical weight (also called degeneracy) of the states (compare [25]). N C O 1 denotes a subset of the CO population that is in the lower state of the targeted transition and can hence be excited by the laser (here, those of total angular momentum quantum number J = 9 ). Assuming the pressure is in the range between ~1 mbar and 1 bar, collision induced repopulation of the targeted rotational level is fast and CO as well as CO* are in thermal rotational equilibrium at any time. Hence, N C O 1 is not selectively depleted by laser excitation and is given by
N C O 1 = N C O g 1 G exp ( E 1 k T ) = p C O k T g 1 G exp ( h c J 2 k T )
where G is the total internal partition sum of CO at temperature T ( G C O ,   296 K = 107.2 [26]); E 1 = h c J 2 is the rotational energy; = h 8 π 2 c μ r C O 2 is the rotational constant (B = 1.9 cm−1 for 12C16O); and rC-O is the distance between C and O in CO.

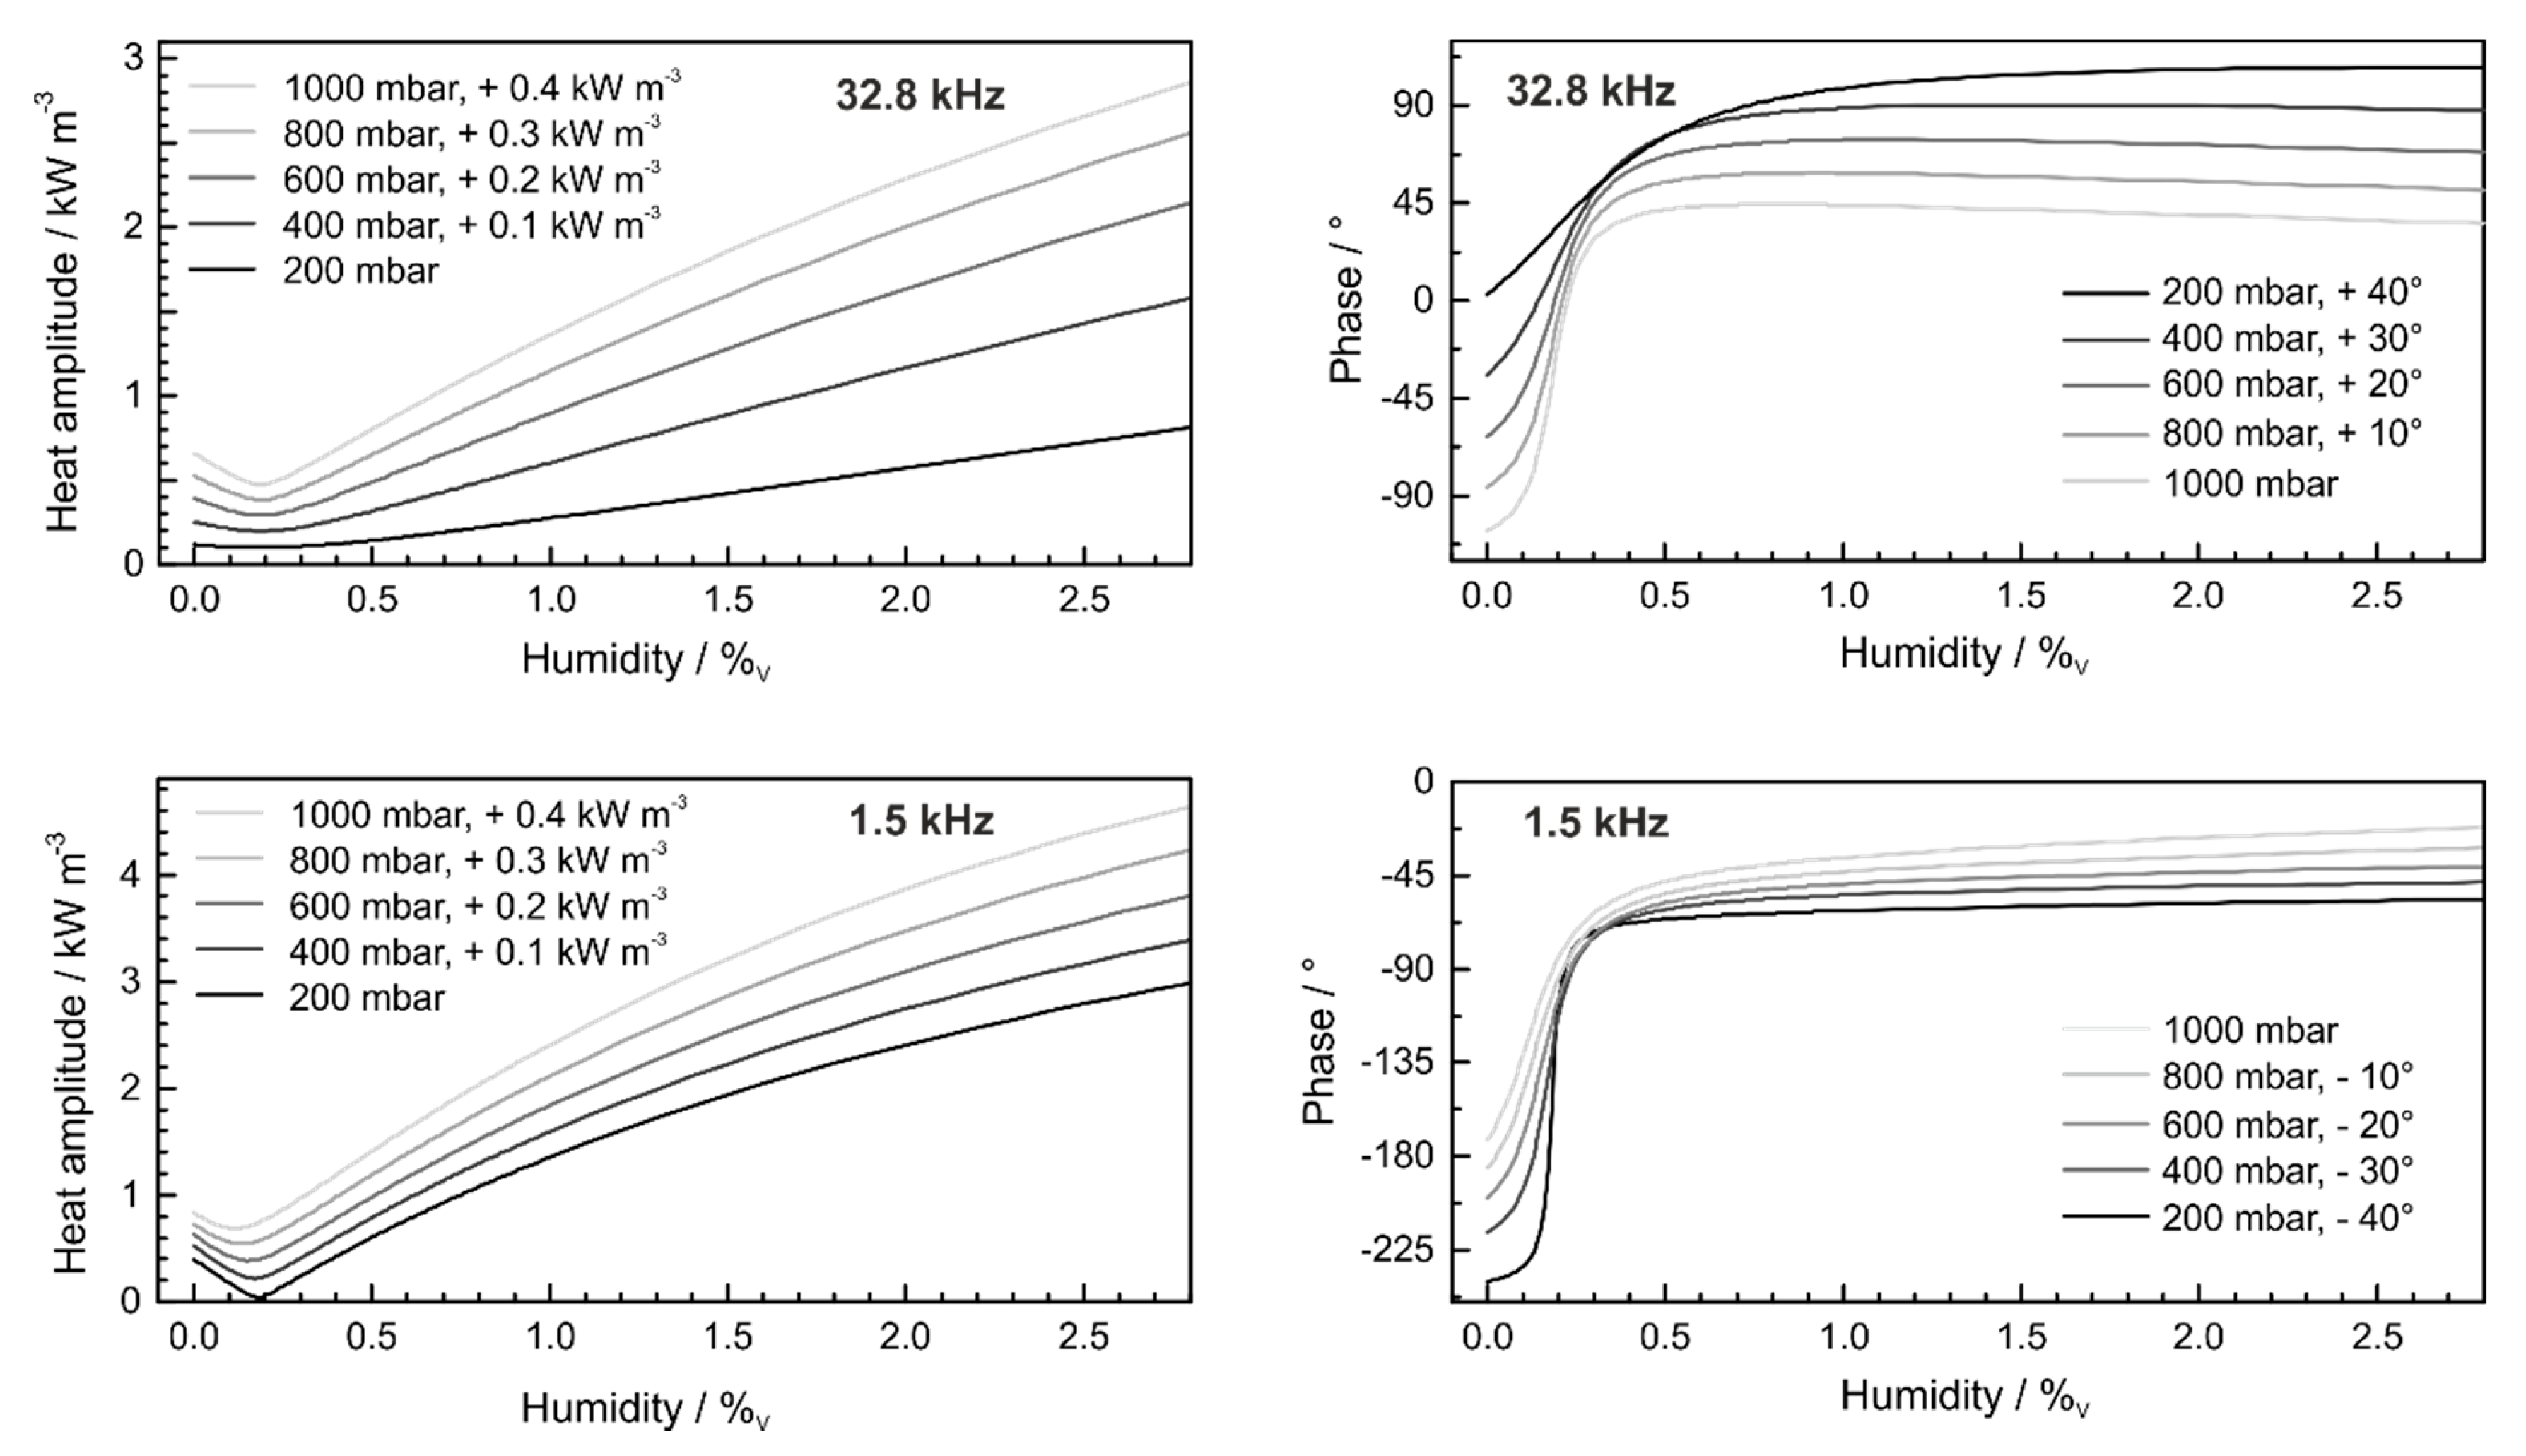
3.4. Simulation Results

Based on the quantitative kinetic model described in the previous section, the photothermal heat dissipation H was simulated in accordance with the experimental conditions corresponding to Figure 2. Simulations were carried out in MATLAB (MathWorks, Inc., Natick, MA, USA) using the finite element method to stepwise calculate the temporal evolution of H in response to wavelength modulated absorption. The MATLAB script for the simulation can be found in the electronic supporting information. The initial excited state populations of all molecular species at t = 0 was set to zero and the simulation was carried out over several modulation periods until all populations N reached a steady (yet periodically modulated) state. Wavelength modulated excitation was included by inserting a time dependent wavenumber in Γ in Equation (15)
Γ = Γ ( ν ˜ ( t ) )
ν ˜ ( t ) = ν ˜ 0 + Δ ν ˜ cos ( 2 π f m o d t )
The relevant constants of the R9 transition of CO in Equation (15) are A21 = 17.91 s−1, g2 = 21, and g1 = 19 [27].
From the rates N ˙ ( t ) of all molecular species, the heat H(t) was calculated using Equation (14). The Fourier transform of the last modulation period of H(t) at the second harmonic of the modulation frequency yielded the complex valued heat H ^ ( 2 f m o d ) , which is directly proportional to the photoacoustic signal. The resulting amplitude and phase of H ^ for H2O concentrations from 0%V to 2.2%V are given in Figure 4. The simulations closely resemble the experimental data for both sample pressures. We point out that no fitting was involved in simulating H ^ and all collision numbers and other parameters were taken directly from literature (compare Table 1).
From the amplitudes shown in Figure 4 (left panels), it can be seen that the proportionality constant between the simulation of H and the measured QEPAS signal was different for 200 mbar and 800 mbar (~factor two difference). Since QEPAS signals were normalized by the quality factor of the tuning fork, this cannot be attributed to the pressure dependence of the latter. Rather, a pressure dependent resonant enhancement of the acoustic resonator may explain this discrepancy [28]. The phase of the QEPAS signal in Figure 4 was inverted and shifted to overlap with the phase of the simulated heat amplitude. The necessity of inverting and shifting the QEPAS phase can be attributed to the “arbitrary” sign of the recorded piezoelectric voltage and the phase shifts associated with the tuning fork and the acoustic resonator. Note, however, that the phase was not scaled.
Further simulations were carried out for excitation frequencies of 32.8 kHz and 1.5 kHz, corresponding to the resonance frequency of a standard quartz tuning fork and a typical excitation frequency of PAS when conventional microphones are used, respectively. The simulated humidity dependent amplitude and phase of H ^ ( 32.8   k H z ) and H ^ ( 1.5   k H z ) are shown in Figure 5 for different sample pressures.
Intriguingly, the minimum in amplitude was more pronounced at high pressure for 32.8 kHz, while the opposite trend was observed for an excitation frequency of 1.5 kHz. Additionally, the minimum for 1.5 kHz shifted toward a lower humidity for 1.5 kHz while it stayed constant at a humidity of 0.19%V for 32.8 kHz as well as 12.46 kHz (compare Figure 4). An interpretation of the physical origin of these observations was beyond the scope of this manuscript. Based on the kinetic model presented herein, the observed trends could be further investigated by simulating H(t) in response to impulsive excitation (rather than sinusoidal excitation chosen herein) as well as the individual contributions of the various relaxation pathways to H(t).

4. Conclusions

A kinetic model for the collisional relaxation of CO in N2 and H2O was introduced that quantitatively explains the surprising humidity dependence of photoacoustic signals from CO as measured in PAS and QEPAS experiments. The minimum in photoacoustic amplitude at a humidity of 0.19%V could be attributed to the mutual cancellation of a kinetic cooling effect during V–V transfer from CO to N2 and exothermal relaxation of CO and N2 in collision with H2O. The comparison of the simulations with experimental data validated the kinetic model and methodology. The detailed treatment of collisional energy transfers responsible for the generation of photoacoustic signals allows for the influence of a variety of experimental parameters such as pressure, humidity, or modulation frequency to be simulated and can hence help identify the preferred operation conditions in sensing applications. The model can be easily adapted, for example, to include oxygen as an important collision partner in ambient measurements, and is equally valid for photoacoustic and photothermal detection [29]. Finally, since the kinetic model yields rates for the collisional relaxation of CO, it can also be used to estimate the saturation intensity of CO at varying humidities and pressures [30,31,32]. The presented kinetic model provides an in-depth understanding of the relaxation dynamics of CO and may be used to further improve photoacoustic and photothermal trace gas sensors and thus extend the scope of their applications.

Supplementary Materials

The following are available online at https://www.mdpi.com/2076-3417/10/3/843/s1, MATLAB code used for numeric simulations, original data, supporting information on gas mixing unit and pressure dependent resonance properties of the quartz tuning fork.

Author Contributions

Methodology, J.H.; Software, J.H.; Investigation, J.H. and B.B.; Resources, J.H. and B.B.; Writing—Original draft preparation, J.H.; Writing—Review and editing, B.B. and B.L.; Funding acquisition, B.L. All authors have read and agreed to the published version of the manuscript.

Funding

This work has received funding from the COMET Center CHASE (project No 868615), which is funded within the framework of COMET (Competence Centers for Excellent Technologies) by BMVIT, BMDW, and the Federal Provinces of Upper Austria and Vienna. The COMET program is run by the Austrian Research Promotion Agency (FFG). The authors acknowledge TU Wien University Library for financial support through its Open Access Funding Program.

Acknowledgments

The authors want to thank Vincenzo Spagnolo, Marilena Giglio, and Angelo Sampaolo for providing the QEPAS module and for support with the same.

Conflicts of Interest

The authors declare no conflicts of interest.

References

  1. Kosterev, A.A.; Mosely, T.S.; Tittel, F.K. Impact of humidity on quartz-enhanced photoacoustic spectroscopy based detection of HCN. Appl. Phys. B 2006, 85, 295–300. [Google Scholar] [CrossRef]
  2. Lambert, J.D. Vibrational and Rotational Relaxation in Gases; The International Series of Monographs on Chemistry; Clarendon Press: Oxford, UK, 1977; ISBN 0-19-855605-5. [Google Scholar]
  3. Ma, Y.; Lewicki, R.; Razeghi, M.; Tittel, F.K. QEPAS based ppb-level detection of CO and N2O using a high power CW DFB-QCL. Opt. Express 2013, 21, 1008–1019. [Google Scholar] [CrossRef] [PubMed] [Green Version]
  4. Dong, L.; Lewicki, R.; Liu, K.; Buerki, P.R.; Weida, M.J.; Tittel, F.K. Ultra-sensitive carbon monoxide detection by using EC-QCL based quartz-enhanced photoacoustic spectroscopy. Appl. Phys. B 2012, 107, 275–283. [Google Scholar] [CrossRef]
  5. Wood, A.D.; Camac, M.; Gerry, E.T. Effects of 10.6-μ laser induced air chemistry on the atmospheric refractive index. Appl. Opt. 1971, 10, 1877–1884. [Google Scholar] [CrossRef] [PubMed]
  6. Hammerich, M.; Ólafsson, A.; Henningsen, J. Photoacoustic study of kinetic cooling. Chem. Phys. 1992, 163, 173–178. [Google Scholar] [CrossRef]
  7. Santosa, I.E.; Oetama, E.J.; Harren, F.J.M. Phasor representation for the nonlinear photoacoustic signal. Eur. J. Phys. 2017, 38, 065803. [Google Scholar] [CrossRef] [Green Version]
  8. Siebert, D.R.; Grabiner, F.R.; Flynn, G.W. Time—resolved thermal lensing studies of laser—induced translational energy fluctuations in CD4, SO2, and OCS. J. Chem. Phys. 1974, 60, 1564–1574. [Google Scholar] [CrossRef]
  9. Wysocki, G.; Kosterev, A.A.; Tittel, F.K. Influence of molecular relaxation dynamics on quartz-enhanced photoacoustic detection of CO2 at λ = 2 μm. Appl. Phys. B 2006, 85, 301–306. [Google Scholar] [CrossRef]
  10. Rooth, R.A.; Verhage, A.J.L.; Wouters, L.W. Photoacoustic measurement of ammonia in the atmosphere: Influence of water vapor and carbon dioxide. Appl. Opt. 1990, 29, 3643–3653. [Google Scholar] [CrossRef]
  11. Truong, N.; Buüscher, S.; Kuühnemann, F.; Harith, M.A. Detecting Carbon Monoxide (CO) With Photoacoustic Spectroscopy: The Role of Molecular Collision Dynamics. In Proceedings of the AIP Conference Proceedings, University Park, MD, USA, 8 October 2009; pp. 3–8. [Google Scholar]
  12. Patimisco, P.; Sampaolo, A.; Giglio, M.; dello Russo, S.; Mackowiak, V.; Rossmadl, H.; Cable, A.; Tittel, F.K.; Spagnolo, V. Tuning forks with optimized geometries for quartz-enhanced photoacoustic spectroscopy. Opt. Express 2019, 27, 1401–1415. [Google Scholar] [CrossRef] [Green Version]
  13. Giglio, M.; Elefante, A.; Patimisco, P.; Sampaolo, A.; Sgobba, F.; Rossmadl, H.; Mackowiak, V.; Wu, H.; Tittel, F.K.; Dong, L.; et al. Quartz-enhanced photoacoustic sensor for ethylene detection implementing optimized custom tuning fork-based spectrophone. Opt. Express 2019, 27, 4271–4280. [Google Scholar] [CrossRef] [PubMed]
  14. Moser, H. Development and Implementation of An Industrial Process Gas Monitoring System for H2S Based on Mid-Infrared Quantum Cascade Laser Spectroscopy; Technische Univerisät Wien: Vienna, Austria, 2016. [Google Scholar]
  15. Baumgartner, B.; Hayden, J.; Loizillon, J.; Steinbacher, S.; Grosso, D.; Lendl, B. Pore size-dependent structure of confined water in mesoporous silica films from water adsorption-desorption using ATR-FTIR spectroscopy. Langmuir 2019, 35, 11986–11994. [Google Scholar] [CrossRef] [PubMed]
  16. Johnson, T.J.; Sams, R.L.; Sharpe, S.W. The PNNL Quantitative Infrared Database for Gas-Phase Sensing: A Spectral Library for Environmental, Hazmat, and Public Safety Standoff Detection; Sedlacek, A.J., III, Colton, R., Vo-Dinh, T., Eds.; International Society for Optical and Engineering: Washington, DC, USA, 2004; Volume 5269, p. 159. [Google Scholar] [CrossRef]
  17. Rosencwaig, A. Photoacoustics and Photoacoustic Spectroscopy; Wiley: Bacon, NJ, USA, 1980; ISBN 0471044954. [Google Scholar]
  18. Wojcik, M.D.; Phillips, M.C.; Cannon, B.D.; Taubman, M.S. Gas-phase photoacoustic sensor at 8.41 μm using quartz tuning forks and amplitude-modulated quantum cascade lasers. Appl. Phys. B 2006, 85, 307–313. [Google Scholar] [CrossRef]
  19. Matteuci, S.; Yampolskii, Y.; Freeman, B.D.; Pinnau, I. Transport of Gases and Vapors. In Membranes for Gas and Vapor Separation; Yampolskii, Y., Pinnau, I., Freeman, B., Eds.; John Wiley & Sons, Ltd.: Bacon, NJ, USA, 2015; pp. 1–47. ISBN 978-0-470-85345-0. [Google Scholar]
  20. Zittel, P.F.; Masturzo, D.E. Vibrational relaxation of H2O from 295 to 1020 K. J. Chem. Phys. 1989, 90, 977–989. [Google Scholar] [CrossRef]
  21. Kung, R.T.V.; Center, R.E. High temperature vibrational relaxation of H2O by H2O, He, Ar, and N2. J. Chem. Phys. 1975, 62, 2187–2194. [Google Scholar] [CrossRef]
  22. Whitson, M.E.; McNeal, R.J. Temperature dependence of the quenching of vibrationally excited N2 by NO and H2O. J. Chem. Phys. 1977, 66, 2696–2700. [Google Scholar] [CrossRef]
  23. Frey, R.; Lukasik, J.; Ducuing, J. Tunable raman excitation and vibrational relaxation in diatomic molecules. Chem. Phys. Lett. 1972, 14, 514–517. [Google Scholar] [CrossRef]
  24. Hilborn, R.C. Einstein coefficients, cross sections, f values, dipole moments, and all that. Am. J. Phys. 1982, 50, 982–986. [Google Scholar] [CrossRef] [Green Version]
  25. Šimečková, M.; Jacquemart, D.; Rothman, L.S.; Gamache, R.R.; Goldman, A. Einstein A-coefficients and statistical weights for molecular absorption transitions in the HITRAN database. J. Quant. Spectrosc. Radiat. Transf. 2006, 98, 130–155. [Google Scholar] [CrossRef]
  26. Fischer, J.; Gamache, R.R.; Goldman, A.; Rothman, L.S.; Perrin, A. Total internal partition sums for molecular species in the 2000 edition of the HITRAN database. J. Quant. Spectrosc. Radiat. Transf. 2003, 82, 401–412. [Google Scholar] [CrossRef]
  27. Gordon, I.E.; Rothman, L.S.; Hill, C.; Kochanov, R.V.; Tan, Y.; Bernath, P.F.; Birk, M.; Boudon, V.; Campargue, A.; Chance, K.V.; et al. The HITRAN2016 molecular spectroscopic database. J. Quant. Spectrosc. Radiat. Transf. 2017, 203, 3–69. [Google Scholar] [CrossRef]
  28. Szakáll, M.; Huszár, H.; Bozóki, Z.; Szabó, G. On the pressure dependent sensitivity of a photoacoustic water vapor detector using active laser modulation control. Infrared Phys. Technol. 2006, 48, 192–201. [Google Scholar] [CrossRef]
  29. Waclawek, J.P.; Bauer, V.C.; Moser, H.; Lendl, B. 2f-wavelength modulation Fabry-Perot photothermal interferometry. Opt. Express 2016, 24, 28958–28967. [Google Scholar] [CrossRef] [PubMed] [Green Version]
  30. Hayden, J.; Baumgartner, B.; Waclawek, J.P.; Lendl, B. Mid-infrared sensing of CO at saturated absorption conditions using intracavity quartz-enhanced photoacoustic spectroscopy. Appl. Phys. B 2019, 125, 159. [Google Scholar] [CrossRef] [Green Version]
  31. Hayden, J. Novel Techniques of Cavity Enhanced Spectroscopy for Trace Gas Sensing; TU Wien: Vienna, Austria, 2019. [Google Scholar]
  32. Giusfredi, G.; Galli, I.; Mazzotti, D.; Cancio, P.; De Natale, P. Theory of saturated-absorption cavity ring-down: Radiocarbon dioxide detection, a case study. J. Opt. Soc. Am. B 2015, 32, 2223–2237. [Google Scholar] [CrossRef]
Figure 1. (Left) Schematic of the experimental setup for humidity dependent 2f-WM-QEPAS measurements of CO in humidified N2, see text. MFC: mass flow controller, DFB-QCL: Distributed feedback quantum cascade laser. (Right) Rendered image of the acoustic detection module and custom tuning fork.
Applsci 10 00843 g001
Figure 2. Amplitude (left) and phase (right) of the QEPAS signal of 20 ppm CO in N2 at 200 mbar and 800 mbar at varying humidities (given as volume fraction). The temperature of the gas was 296 K.
Applsci 10 00843 g002
Figure 3. Energy levels of CO, N2, and H2O involved in the collisional relaxation of CO. Straight arrows indicate energy transfer in collisions and the kind of transfer is given in parenthesis: {R-T, A} denotes rotational relaxation, {V-T, A (B)} denotes the vibrational-translational relaxation of A in collisions with B, and {V-V, A → B} denotes V–V transfer from A to B. The rates γ A B for each energy transfer, normalized to the partial pressure of the collision partner, is given for T = 298 K, compare Table 1.
Applsci 10 00843 g003
Figure 4. Simulation of the photothermal response H ^ and measured QEPAS signal of CO in N2 at varying humidities and conditions identical to those in Figure 2. The QEPAS phase was inverted and shifted with respect to Figure 2 to resemble the simulations (see text).
Applsci 10 00843 g004
Figure 5. Simulation of the humidity-dependent photothermal response H ^ of CO in N2 at wavelength modulated excitation at 32.8 kHz and 1.5 kHz (detection frequency, modulation frequencies were 16.4 kHz and 0.75 kHz, respectively). Simulations were carried out for varying overall pressure. Data were offset as indicated for better visibility.
Applsci 10 00843 g005
Table 1. Summary of processes involved in the relaxation of CO. Collision frequencies ZA-B were normalized to the partial pressure of the collision partner B. “R-T, A (B)” and “V-T, A (B)” denote R–T and V–T relaxation of A in collisions with B. “V-V, A → B” denotes the V–V transfer from A to B. Δ E denotes the energy released in the process (negative for energy uptake). Collision numbers Z ^ were obtained from [2,19,20,21,22]). All values are given for T = 298 K.
ProcessZA-B [109 s−1atm−1] Z ^ ZA-B/Ẑ [s−1atm−1] Δ E   [ cm 1 ]
R-T, CO (N2)7.032.3 × 10937
V-V, CO → N27.04.9 × 1041.4 × 105−188
V-V, N2 → CO7.02.0 × 1043.5 × 105188
V-V, CO → H2O6.01.1 × 1035.5 × 106548
V-V, N2 → H2O5.72.6 × 1042.2 × 105736
V-T, N2 (N2)6.84 × 1091.72331
V-T, H2O (N2)5.74.7 × 1021.2 × 1071595
V-T, H2O (H2O)4.541.1 × 1091595

