Article

Rolling Bearing Fault Diagnosis Based on Wavelet Packet Transform and Convolutional Neural Network

1
School of Mechanical Science and Engineering, Huazhong University of Science and Technology, Wuhan 430074, China
2
School of Naval Architecture and Ocean Engineering, Huazhong University of Science and Technology, Wuhan 430074, China
*
Authors to whom correspondence should be addressed.
Appl. Sci. 2020, 10(3), 770; https://doi.org/10.3390/app10030770
Submission received: 31 December 2019 / Revised: 16 January 2020 / Accepted: 21 January 2020 / Published: 22 January 2020

Abstract

:
Timely sensing the abnormal condition of the bearings plays a crucial role in ensuring the normal and safe operation of the rotating machine. Most traditional bearing fault diagnosis methods are developed from machine learning, which might rely on the manual design features and prior knowledge of the faults. In this paper, based on the advantages of CNN model, a two-step fault diagnosis method developed from wavelet packet transform (WPT) and convolutional neural network (CNN) is proposed for fault diagnosis of bearings without any manual work. In the first step, the WPT is designed to obtain the wavelet packet coefficients from raw signals, which then are converted into the gray scale images by a designed data-to-image conversion method. In the second step, a CNN model is built to automatically extract the representative features from gray images and implement the fault classification. The performance of the proposed method is evaluated by a real rolling-bearing dataset. From the experimental study, it can be seen the proposed method presents a more superior fault diagnosis capability than other machine-learning-based methods.

1. Introduction

Bearings are the core component of rotating machinery such as wind turbines, aircraft and automobiles. Bearing failures may cause great economical loss and pose threats to operator security. Thus, the effective fault diagnosis of bearings is an important measure to maintain proper operation and reduce downtime of rotating machinery [1,2,3,4,5]. Up to now, the development of efficient bearing fault diagnosis methods has attracted many investigations [6,7].
Fault diagnosis methods mainly include two types, namely, model-based methods and data-driven methods [8,9,10]. The model-based methods generally relied on an accurate failure mechanism model, in which the mathematical methods were applied to demonstrate the failure and phenomenon of the monitored components. The type of methods is appropriate for fault diagnosis when the mechanism model can be constructed for these monitored components. In fact, it is difficult to construct an accurate failure mechanism model to cater for the changes of operation environments and the physical structure of the machine. In contrast, a data-driven method, needs not to consider the failure mechanism, and the fault diagnosis can be achieved just based on the condition signals without any failure mechanism knowledge.
A data-driven method generally includes two main phases: feature extraction and model selection and construction [11,12]. For the feature extraction, it has been proved that the useful feature extraction could improve the performance of fault diagnosis. As common feature extraction methods, time domain, frequency domain, and time-frequency domain analysis methods have been widely used to obtain the features from signals. Time domain analysis method extracts features such as kurtosis and skewness as the condition features of bearings. Frequency domain analysis methods are applied to unveil features such as the hidden frequency information from time series signals. Popular time-frequency domain analysis methods like the short-time Fourier transform and Hilbert–Huang transform are able to extract the frequency component and retain the time domain information, which also build a relationship between time domain and frequency domain. However, there are some limitations in those mentioned methods, such as fault features and noise interference being still difficult to separate effectively. For the model selection and construction, machine learning models, such as hidden Markov models [13], Bayesian networks [14], neural networks, and support vector machines [15], are commonly employed as the classification tool in the flied of fault diagnosis. Those methods often need to consider the tradeoff between fault diagnosis training cost, training efficiency, and applicability performance.
In the past, development of fault diagnosis, deep learning methods have emerged as an effective tool to achieve feature extraction and fault recognition due to their easy trainability and accurate classification performance. Generally, in a deep learning-based method, the features are extracted by multiple stacked layers, and then, output probabilities are calculated based on the last high-level abstraction data through the non-linear fitting operation of classification layer. Popular deep learning methods, such as deep neural networks (DNNs) [16] and auto-encoder [17], have been investigated, and they have shown their promising capability to capture representative features from input data by the linear and non-linear fitting operations. Sun et al. [18] developed an end-to-end fault diagnosis method based on sparse auto-encoder and DNN to address the fault identification problem, in which the representative features were extracted automatically from condition signals by the auto-encoder. However, when more layers are added to the deep learning model, the network parameters explode, which might lead to overfitting.
As an excellent deep learning method, convolutional neural networks (CNNs) have attracted much attention because adoption of the kernel sharing mechanism greatly reduces the number of network parameters and makes network training easier. After CNNs were first investigated in the field of image recognition, they have been effectively employed in various applications such as computer version [19], face recognition [20] and target detecting [21]. A large number of investigations on fault classification have benefit from CNN’s ability to extract high-level abstraction features. Chen et al. [22] presented a CNN-based method, in which CNN was used to extract the representative features from the designed input data. Yang et al. [23] developed a fault classification method, in which the hierarchical symbolic analysis was used to form the input of CNN, and the proposed CNN was applied to extract fault features and implement fault classification.
CNN-based fault diagnosis approaches have been presented and achieved success, but they usually rely on the designed features or manually generated input without considering the appropriate input selection and noise information weakening. As a useful time-frequency analysis method, wavelet packet transform (WPT) has proved capable to obtain low-frequency and high-frequency information [24,25,26]. Meanwhile, the low-frequency information could be selected, and the noise information could be discarded from this time-frequency information in some way. In this regard, WPT is suitable for handling the condition signals to eliminate the effect of noise interference.
In this paper, a two-step fault diagnosis method is proposed. In the first step, the WPT is used to obtain the wavelet packet coefficients from vibration signal, and then, the obtained coefficients are converted into 2-D format gray scale images through a designed data-to-image conversion method and used as the inputs of the constructed CNN. In the second step, a designed CNN model is applied to further extract the sensitive and robust discernable feature from these gray images to realize the fault identification. From the experiment’s study result, the proposed fault diagnosis method achieves an excellent diagnostic accuracy. The diagnostic accuracy of each bearing condition is over 92%. Moreover, it also presents more superior fault diagnosis capability than other popular machine learning-based methods.
The rest of this paper is organized as follows. The related work is described in Section 2. Section 3 shows the details of the proposed fault diagnosis method. The experimental evaluation is presented in Section 4. The conclusion is drawn in Section 5.

2. Related Work

2.1. Convolutional Neural Networks

In general, a CNN consists of convolutional layers, pooling layers, and fully connected layers. The trainable convolutional layer and the fully connected layer involve linear and non-linear operations, and the pooling layer is a statistical operation.
A. Convolutional Layer
In a convolutional layer, a bank of learnable Gaussian kernel filters is used to convolve with the input data to generate the feature maps. It can be presented as:
X s k   =   f ( j = 1 J W j s k X j k 1   +   B s k )
where X s k is the j th feature map at (k−1)-th operation, W j s k is the kernel weight parameter in the k - th operation between the j - th input and the s - th output, and B s k denotes the corresponding bias. f ( · ) represents nonlinear activation function. The rectified linear unit (ReLU) is usually applied to execute the activation operation due to its superior gradient performance, which is described as:
y i j k l 1   =   max { 0 ,   x i j k l 1 }
where x i j k l 1 is the value of the coordinate (i, j) in k-th feature map of (l−1)-th layer.
B. Pooling Layer
The pooling layer is aimed to reserve spatial invariance and reduce the dimensionality of middle feature maps by using numerical statistics method. A customizable window of pooling operation is selected to slide it onto the input feature map to designate the operation area, and then, numerical statistic method is used to represent these values with a value and to reduce the resolution of the selected area. In this operation, the stride parameter of the pooling layer is needs to be chosen because it has a significant impact on the resolution reduction and the retention of numerical information. The max-pooling or average-pooling is usually used to execute the aggregation operation. The max-pooling is commonly applied in the CNN structure, and it can be defined as follows:
x i , j l   =   max ( x i , j l 1 )
where 0   <   i     n ;   0   <   j     m ; i   and   j     Z + ;   n is the length of the pooling window, and m is the width; and x i , j l 1 is covered data pooling window.
C. Fully-Connected Layer
The fully connected layer is aimed to nonlinearly fit its input. The fitting operation of fully connected layer can be described as:
Y   =   f F ( W X i l + b )
where Y is the output, W is the fully connection matrix, and X i l is the output of upper layer. f F denotes the activate function. The output channel of last fully connected layer is generally equal to the number of classification types.

2.2. Wavelet Packet Transform

The wavelet transform (WT) is a common method to obtain the local time-frequency information from signals. The wavelet transform is performed on the signal x ( t ) by analyzing the mother wavelet function ψ ( t ) and convolving x ( t ) with the scaling and conjugate wavelet function. This process can be described as:
W f ( a , s )   =   + x ( t ) 1 a ψ ( t s a ) d t
where ψ ( t ) denoted the Morlet wavelet function. a is the dilation and s is the translation. The factor 1 a is used to preserve energy. The a and s could be changed for obtaining different time-frequency segmentation.
WPT is a generalization of WT, which is used to approximate wavelet coefficients of different frequency bands. The node values for each level can be described as:
W j + 1 2 k   =   W j k ( n )     h ( 2 n )
W j + 1 2 k + 1   =   W j k ( n )     g ( 2 n )
where W j + 1 2 k is the coefficient value of j-th decomposed level at the frequency band of 2k. The h ( 2 n ) and g ( 2 n ) are the low-pass filter and the high-pass filter, respectively, which depend on the selected scaling function ϕ ( x ) and mother wavelet function ψ ( x ) . The relationship of the two functions can be described as:
ϕ j ( t )   =   k h ( k ) 2 j + 1 2 ϕ ( 2 j + 1   ×   t k )
ψ j ( t )   =   k g ( k ) 2 j + 1 2 ϕ ( 2 j + 1   ×   t k )
Admittedly, the fault features of the bearing are related to the low-frequency band of the condition signals. The low-frequency information of the condition signals can be obtained by using the WPT, which is useful for bearing fault diagnosis. In general, a 1-D time-frequency coefficients vector with length L could obtain through the WPT.

3. Proposed CNN-Based Fault Diagnosis Method

This section demonstrates the proposed two-step fault diagnosis method. In the first step, a data-to-image method is designed to obtain the 2-D gray image from conditional signals as the input of a CNN model. In the second step, a high-effective CNN model is built to implement the feature extraction and fault diagnosis.

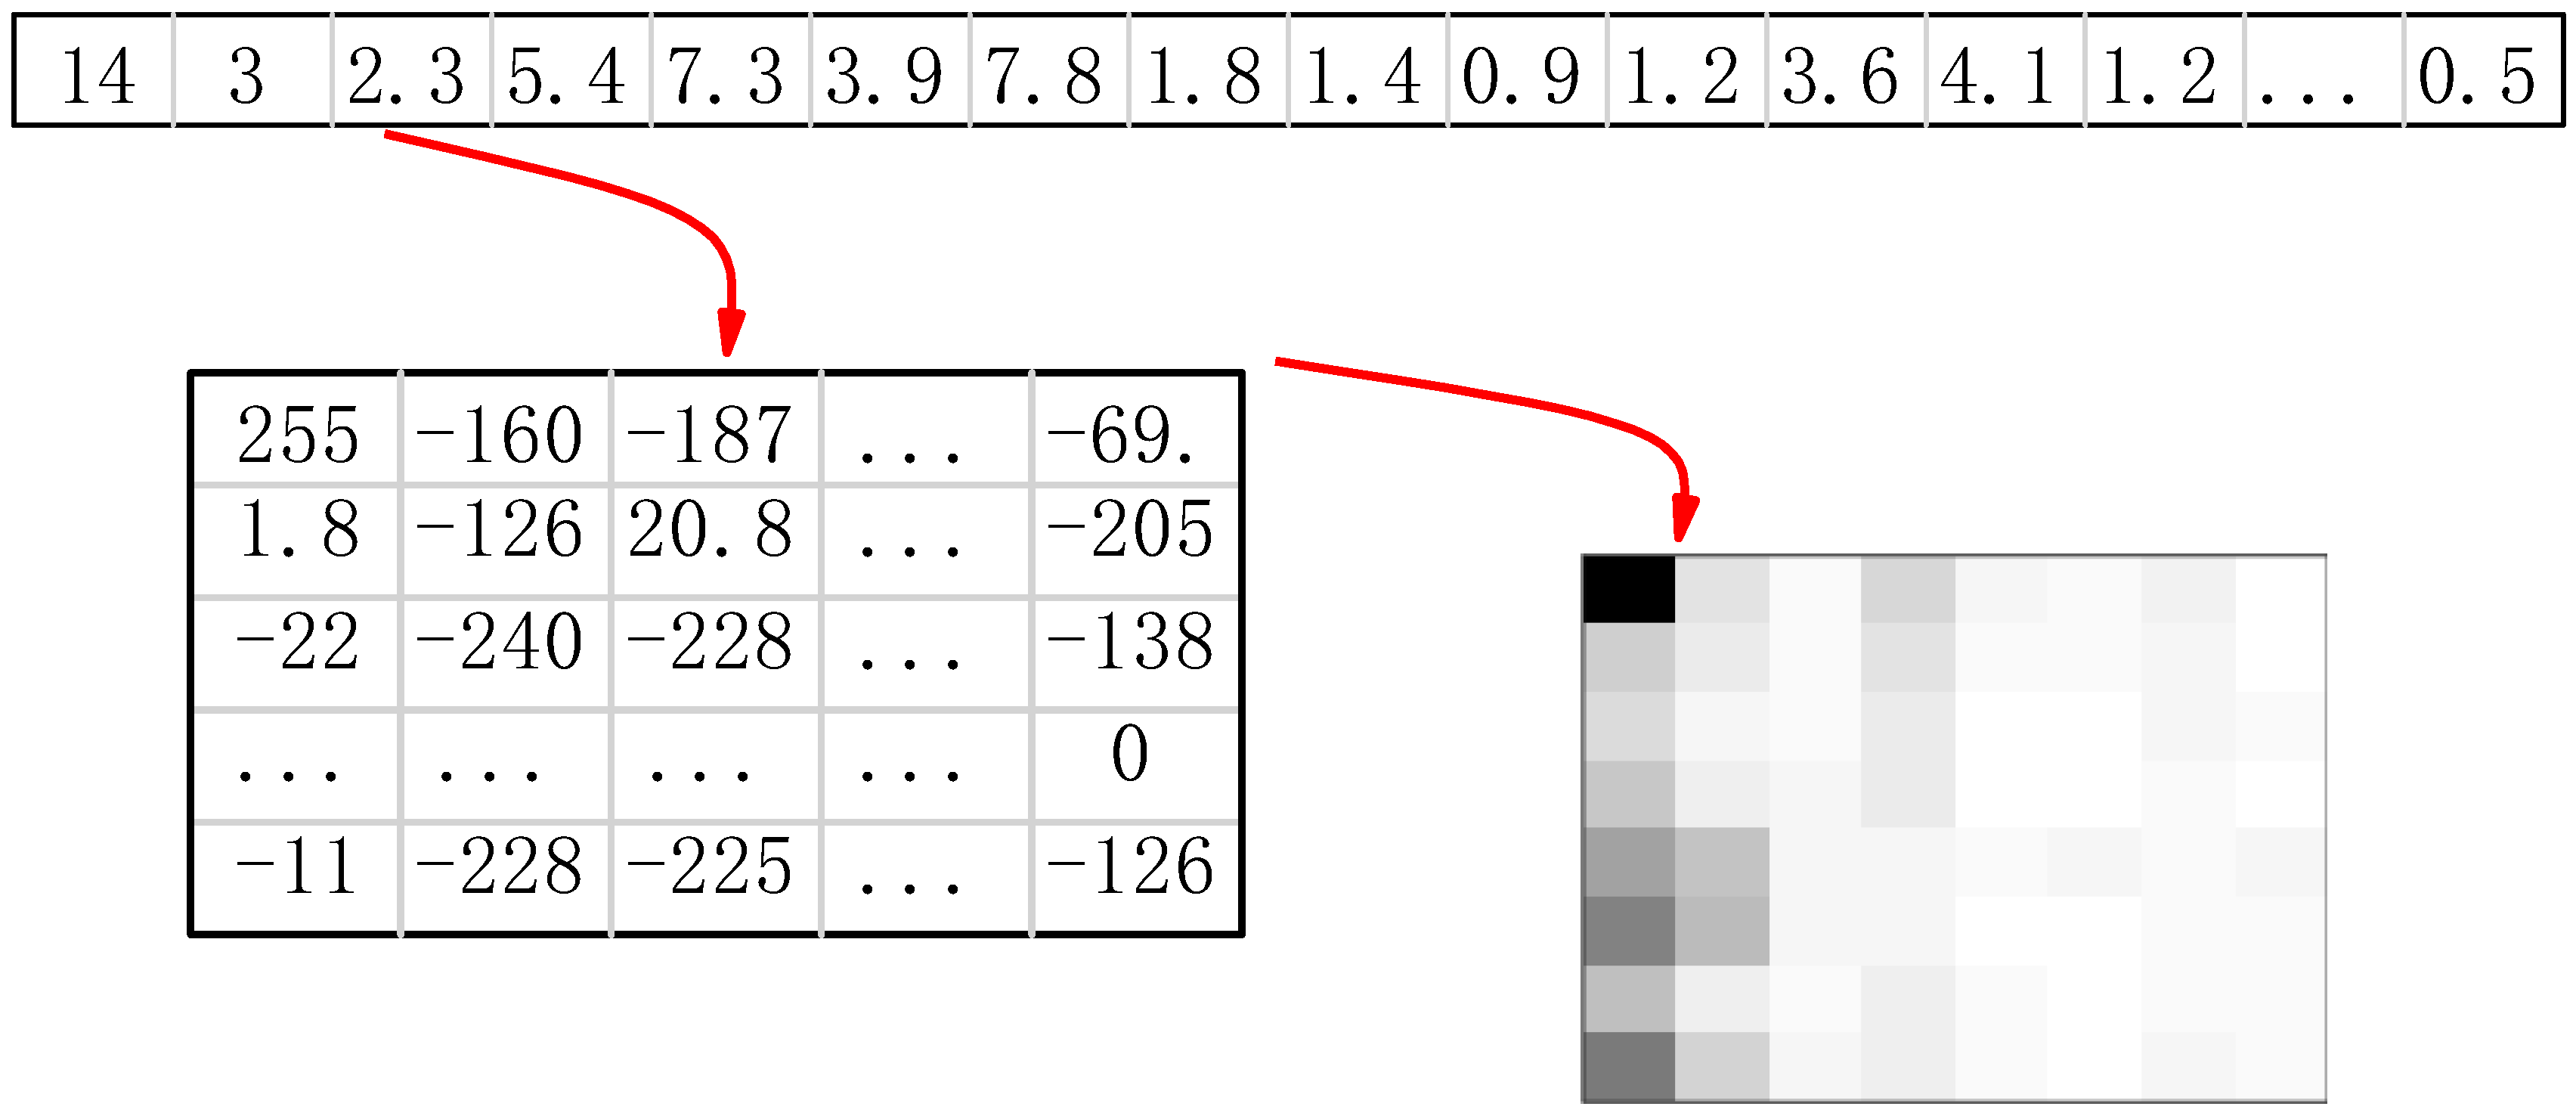
3.1. Data-to-Image Conversion Method

An effective way to improve the fault diagnosis performance is to extrude condition features and eliminate noise interference for input data. As discussed in Section 2.2, the WPT could capture the low-frequency information to obtain the fault information. Moreover, the noise component also can be filtered by manually discarding from obtained wavelet packet coefficients.
In this study, a 2-D CNN model is selected to achieve the fault diagnosis. However, the wavelet packet coefficient is not appropriate as the input of CNN model. In order to obtain the appropriate input, a data-to-image method is designed to form the two-dimension input data for CNN model. As shown in Figure 1, it consists of two steps. Firstly, the wavelet packet coefficient, which is obtained from the raw signal by using WPT, is reshaped into a 2-D matrix with a size of M   ×   N where M and N could be selected manually according to the length of wavelet packet coefficients. Then, the matrix elements are normalized to −255 to 255. Secondly, each element of obtained matrix is converted to a pixel, and a gray image with a size of M   ×   N is obtained. In this study, the n × n pooling window is commonly applied, and the length and width of feature map in each pooling layer is reduced by same, so it is recommended to get the gray image with a size of M   ×   M .

3.2. Fault Diagnosis Based on CNN

After condition signals are converted into gray images, a CNN model is built to identify these collected images. For the CNN model, the key is to determine the parameters of the convolutional layers and fully connected layers. In order to obtain the CNN model with the classification capacity, a part of gray images is used as the training dataset, which is applied to train the designed CNN by combining with the feedforward and backpropagation transform algorithm. Furthermore, a validation dataset is collected from these obtained gray images for evaluating the training performance and selecting the model parameters before possible overfitting. After the training process is completed, the generalization fault diagnosis capability of the trained CNN model is tested by the online monitoring signals.

4. Experiment Studies

In this section, a real-time bearing dataset from rolling bearing accelerated degradation tests is used to evaluate the effectiveness of the proposed method.

4.1. Experimental Setup and Data Description

The rolling bearing dataset generated by the Institute of Design Science and Basic Components at Xi’an Jiaotong University (XJTU) [27], is analyzed. The experimental setup is shown in Figure 2. The bearing testbed consists of an alternating current (AC) induction motor, a motor speed controller, a support shaft, two support bearings (heavy duty roller bearings), a hydraulic loading system, and so on. Fifteen rolling bearings of the type LDK UER204 were carried out in different degradation tests under three operating conditions. There exist five types of fault conditions with these tested bearings, which are inner race fault, outer race fault, cage fault, and two mixed faults. In order to collect the degradation signals, two PCB 352C33 accelerometers are placed on the horizontal and vertical directions of housing of the bearings, and signals are collected at a sampling frequency of 25.6 kHz. A total of 32768 run-to-failure sampling points are recorded every minute.
In each run-to-failure testing experiment, the accelerated deterioration test of the bearing was close to stop when the amplitude of the vibration signal was higher than 20 g. Based on this, the subsequent degradation vibration signals are selected as the complete fault signals when the acceleration exceeds 20 g for the first time. Figure 3 shows the result of complete fault signal selection of fifteen degradation tests. In this study, due to the load acts on horizontal direction, the horizontal monitored signals of the tested bearings are selected to evaluate the performance of the proposed method.
The types of bearing condition are only considered in this study, and the impact of different operating conditions was ignored. Therefore, the datasets of the different operating conditions of bearings with the same condition went into one dataset. Figure 4 shows the vibration signals of the six types of condition signals.
To increase the number of samples, the samples are resampled by using a sliding window from vibration signals, where each sample contains 1225 data points. There are six datasets, and each dataset contains 1200 samples. The details of the datasets are shown in Table 1. For each dataset, 660 samples are selected for the training dataset, 180 samples are randomly selected to compose the validation dataset, and 360 samples are used for the testing dataset.

4.2. Results and Discussion

There are in total 7200 bearing condition samples. As discussed in Section 3.1, all samples are converted into 1-D time-frequency coefficient vectors of size 64 by using the wavelet packet transform. To form the input of CNN model, the data-to image conversion method is used to convert these coefficient vectors into the gray images with a size of 8 × 8. Six types of Gray scale images from six conditions are shown in Figure 5. The main parameters of designed CNN model are presented in Table 2, which includes three trainable convolutional (Conv) layers and two max-pooling layers with two fully connected layers. The performance of the proposed CNN-based fault diagnosis model is evaluated by using ten trials. For each time trial, the training samples, validation samples, and testing samples are randomly selected. Figure 6 shows the confusion matrix of one trial result. Table 3 presents the diagnosis performance of the proposed method in ten trials. From the results, the proposed model presents an excellent diagnostic accuracy of 100% for normal bearing condition, and other fault types exceed 93%.
In addition, three common machine learning methods, complex trees, k-nearest neighbor (KNN), and support vector machine (SVM), are compared with the proposed method. The training and testing process of the mentioned models are conducted on a computer (Intel Core (TM) 3.6 GHz processor with 8 GB of RAM) and on an Ubuntu system platform. The comparison results are presented in Table 4. From the comparison results, it can be seen that the diagnosis performance of the proposed method is more stable and accurate than that of other methods.

5. Conclusions

This paper presented a two-step fault diagnosis method based on WPT and CNN. In the first step, the WPT is used to obtain 1-D time-frequency coefficients from vibration signals, which are converted into the 2-D gray images through a designed data-to-image conversion method. In this second step, a CNN model with three convolutional layers is designed to automatically learn representative fault features from the gray images, and the classification of these high-level abstraction representative features is achieved by using a logistic regression layer. A real-time rolling bearing fault dataset is applied to evaluate the diagnosis performance of the proposed method. From the test and comparison results, the proposed fault diagnosis method presents a more superior fault diagnosis capability than other machine learning-based methods.

Author Contributions

Methodology, G.L. and J.W.; algorithm design, G.L., C.D., and J.W.; validation, J.W., X.X., and G.L.; formal analysis, G.L., C.D., and Z.C.; writing—original draft preparation, G.L. and C.D.; writing—review and editing, J.W., C.D., G.L., and Z.C.; visualization, J.W., G.L., and C.D.; project administration, J.W. and Z.C.; funding acquisition, J.W., C.D., and Z.C. All authors have read and agreed to the published version of the manuscript.

Funding

This work is funded in part by the National Key Research and Development Program of China under the Grant No. 2018YFB1702300, in part by the National Natural Science Foundation of China under the Grant No. 51875225, and in part by the Key Research and Development Program of Guangdong Province under the Grant No. 2019B090916001.

Conflicts of Interest

The authors declare no conflict of interest.

References

  1. Esfahani, E.T.; Wang, S.; Sundararajan, V. Multisensor wireless system for eccentricity and bearing fault detection in induction motors. IEEE/ASME Trans. Mechatron. 2014, 19, 818–826. [Google Scholar] [CrossRef]
  2. Sun, Y.; Xiong, Z. An optimal weighted wavelet packet entropy method with application to real-time chatter detection. IEEE/ASME Trans. Mechatron. 2016, 21, 2004–2014. [Google Scholar] [CrossRef]
  3. Wu, J.; Wu, C.Y.; Cao, S.; Or, S.W.; Deng, C.; Shao, X.Y. Degradation data-driven time-to-failure prognostics approach for rolling element bearings in electrical machines. IEEE Trans. Ind. Electron. 2019, 66, 529–539. [Google Scholar] [CrossRef]
  4. Cheng, Y.W.; Zhu, H.P.; Wu, J.; Shao, X.Y. Machine health monitoring using adaptive kernel spectral clustering and deep long short-term memory recurrent neural networks. IEEE Trans. Ind. Inform. 2019, 15, 987–997. [Google Scholar] [CrossRef]
  5. Wu, J.; Hu, K.; Cheng, Y.; Zhu, H.; Shao, X.; Wang, Y. Data-driven remaining useful life prediction via multiple sensor signals and deep long short-term memory neural network. ISA Trans. 2019. [Google Scholar] [CrossRef]
  6. Li, G.Q.; Deng, C.; Wu, J.; Xu, X.B.; Shao, X.Y.; Wang, Y.H. Sensor data-driven bearing fault diagnosis based on deep convolutional neural networks and S-transform. Sensors 2019, 19, 2750. [Google Scholar] [CrossRef] [Green Version]
  7. He, Z.Y.; Shao, H.D.; Wang, P.; Janet, L.; Cheng, J.S.; Yang, Y. Deep transfer multi-wavelet auto-encoder for intelligent fault diagnosis of gearbox with few target training samples. Knowl.-Based Syst. 2019. [Google Scholar] [CrossRef]
  8. Wu, J.; Su, Y.H.; Cheng, Y.W.; Shao, X.Y.; Deng, C.; Liu, C. Multi-sensor information fusion for remaining useful life prediction of machining tools by adaptive network based fuzzy inference system. Appl. Soft Comput. 2018, 68, 12–23. [Google Scholar] [CrossRef]
  9. Wang, L.H.; Zhao, X.P.; Wu, J.X.; Xie, Y.Y.; Zhang, Y.H. Motor fault diagnosis based on short-time fourier transform and convolutional neural network. Chin. J. Mech. Eng. 2017, 30, 1–12. [Google Scholar] [CrossRef]
  10. Cheng, Y.W.; Zhu, H.P.; Hu, K.; Wu, J.; Shao, X.Y.; Wang, Y.H. Reliability prediction of machinery with multiple degradation characteristics using double-Wiener process and Monte Carlo algorithm. Mech. Syst. Signal Process. 2019, 134, 106333. [Google Scholar] [CrossRef]
  11. Zhao, M.H.; Tang, B.P.; Deng, L.; Pecht, M. Multiple wavelet regularized deep residual networks for fault diagnosis. Measurement 2020, 152, 107331. [Google Scholar] [CrossRef]
  12. Yang, Z.X.; Wang, X.B.; Wong, P.K. Single and Simultaneous Fault Diagnosis with Application to a Multistage Gearbox: A Versatile Dual-ELM Network Approach. IEEE Trans. Ind. Inform. 2018, 14, 5246–5255. [Google Scholar] [CrossRef]
  13. Tobon-Mejia, D.; Medjaher, K.; Zerhouni, N.; Tripot, G. A data-driven failure prognostics method based on mixture of Gaussians hidden Markov models. IEEE Trans. Rel. 2012, 61, 491–503. [Google Scholar] [CrossRef] [Green Version]
  14. Cai, B.; Huang, L.; Xie, M. Bayesian networks in fault diagnosis. IEEE Trans. Ind. Inform. 2017, 13, 2227–2240. [Google Scholar] [CrossRef]
  15. Soualhi, A.; Medjaher, K.; Zerhouni, N. Bearing health monitoring based on Hilbert–Huang transform support vector machine and regression. IEEE Trans. Instrum. Meas. 2015, 64, 52–62. [Google Scholar] [CrossRef] [Green Version]
  16. Shao, H.; Jiang, H.; Zhang, X.; Niu, M. Rolling bearing fault diagnosis using an optimization deep belief network. Meas. Sci. Technol. 2015, 26, 115002. [Google Scholar] [CrossRef]
  17. Cao, P.; Zhang, S.L.; Tang, J. Pre-processing-free gear fault diagnosis using small datasets with deep convolutional neural network-based transfer learning. IEEE Access 2017, 6, 26241–26253. [Google Scholar] [CrossRef]
  18. Sun, W.; Shao, S.; Zhao, R.; Yan, R.; Zhang, X.; Chen, X. A Sparse Auto-encoder-Based Deep Neural Network Approach for Induction Motor Faults Classification. Measurement 2016, 89, 171–178. [Google Scholar] [CrossRef]
  19. Zhang, H.; Li, D. Applications of computer vision techniques to cotton foreign matter inspection: A review. Comput. Electron. Agric. 2014, 109, 59–70. [Google Scholar] [CrossRef]
  20. Phillips, J.P.; O’toole, J.A. Comparison of human and computer performance across face recognition experiments. Image Vis. Comput. 2014, 32, 74–85. [Google Scholar] [CrossRef]
  21. Ren, S.Q.; He, K.M.; Ross, G.; Sun, J. Faster R-CNN: Towards Real-Time Object Detection with Region Proposal Networks. IEEE Trans. Pattern Anal. Mach. Intell. 2015, 39, 1137–1149. [Google Scholar] [CrossRef] [Green Version]
  22. Chen, Z.; Li, C.; Sanchez, R.-V. Gearbox Fault Identification and Classification with Convolutional Neural Networks. Shock Vib. 2015, 2015, 1–10. [Google Scholar] [CrossRef] [Green Version]
  23. Yang, Y.; Zheng, H.; Li, Y.; Xu, M.; Chen, Y. A fault diagnosis scheme for rotating machinery using hierarchical symbolic analysis and convolutional neural network. ISA Trans. 2019, 91, 235–252. [Google Scholar] [CrossRef]
  24. Hariharan, M.; Yaacob, S.; Awang, S.A. Pathological infant cry analysis using wavelet packet transform and probabilistic neural network. Expert Syst. Appl. 2011, 38, 15377–15382. [Google Scholar] [CrossRef]
  25. Vong, C.M.; Wong, P.K. Engine ignition signal diagnosis with Wavelet Packet Transform and Multi-class Least Squares Support Vector Machines. Expert Syst. Appl. 2011, 38, 8563–8570. [Google Scholar] [CrossRef]
  26. Chouakri, S.A.; Bereksi-Reguig, F.; Taleb-Ahmed, A. QRS complex detection based on multi wavelet packet decomposition. Appl. Math. Comput. 2011, 217, 9508–9525. [Google Scholar] [CrossRef]
  27. Wang, B.; Lei, Y.; Li, N.; Li, N. A Hybrid Prognostics Approach for Estimating Remaining Useful Life of Rolling Element Bearings. IEEE Trans. Rel. 2018, 1–12. [Google Scholar] [CrossRef]
Figure 1. Data-to-image conversion method.
Applsci 10 00770 g001
Figure 2. Experimental setup.
Applsci 10 00770 g002
Figure 3. The selection of fault vibration signals. The (a) to (o) represent the vibration signals for the fifteen degradation experiments.
Applsci 10 00770 g003
Figure 4. Six fault types of vibration signals. (a) normal signals, (b) inner race fault signals, (c) outer race fault signals, (d) cage fault signals, (e) inner and outer race fault signals, (f) inner race, ball, cage and outer race fault signals.
Applsci 10 00770 g004
Figure 5. Six fault types of gray scale image. (a) normal condition, (b) inner race fault, (c) outer race fault, (d) cage fault, (e) inner and outer race fault, (f) inner race, ball, cage and outer race fault.
Applsci 10 00770 g005
Figure 6. The fault diagnosis confusion matrix.
Applsci 10 00770 g006
Table 1. Description of used bearing dataset.
Condition TypeClass LabelSample Number
Normal01200
Inner race11200
Outer race21200
Cage31200
Inner race and outer race 41200
Inner race, ball, cage and outer race51200
Table 2. Layer parameter configurations.
Layer NameLayer Parameters
Conv 13 × 3 × 64
Max-pooling 12 × 2
Conv 21 × 1 × 16
Conv 31 × 1 × 16
Max-pooling 22 × 2
Table 3. The diagnosis accuracy of the proposed models (%).
Class Label012345
Max10096.1110099.4499.7299.72
Min10088.6193.0697.5097.5097.50
Mean10093.7897.1498.8698.7298.72
Std02.412.280.6390.6830.683
Table 4. The comparison of diagnosis accuracy of different models (%).
MethodClass Label
012345
Proposed method10092.7899.7299.4498.8998.06
Complex Tree10090.094.7297.2293.3395.83
KNN10091.3998.0695.0099.4494.44
SVM10098.3392.1197.7891.6795.98

