Article

Investigation of a Bragg Grating-Based Fabry–Perot Structure Inscribed Using Femtosecond Laser Micromachining in an Adiabatic Fiber Taper

1
School of Electrical and Electronic Engineering, Nanyang Technological University, Singapore 639798, Singapore
2
Institute for Infocomm Research, Agency for Science, Technology and Research, Singapore 138632, Singapore
*
Authors to whom correspondence should be addressed.
Appl. Sci. 2020, 10(3), 1069; https://doi.org/10.3390/app10031069
Submission received: 9 January 2020 / Revised: 25 January 2020 / Accepted: 27 January 2020 / Published: 5 February 2020
(This article belongs to the Special Issue Vibration-Based Structural Health Monitoring)

Abstract

:
This paper presents the fabrication of a fiber Bragg grating (FBG)-based Fabry–Perot (FP) structure (7 mm total length) in an adiabatic fiber taper, investigates its strain and temperature characteristics, and compares the sensing characteristics with a standard polyimide coated FBG sensor. Firstly, a simulation of the said structure is presented, followed by the fabrication of an adiabatic fiber taper having the outer diameter reduced to 70 μ m (core diameter to 4.7 μ m). Next, the sensing structure, composed of two identical uniform FBG spaced apart by a small gap, is directly inscribed point-by-point using infrared femtosecond laser (fs-laser) micromachining. Lastly, the strain and temperature behavior for a range up to 3400 μ ε and 225 ° C, respectively, are investigated for the fabricated sensor and the FBG, and compared. The fabricated sensor attains a higher strain sensitivity (2.32 pm/ μ ε ) than the FBG (0.73 pm/ μ ε ), while both the sensors experience similar sensitivity to temperature (8.85 pm/ ° C). The potential applications of such sensors include continuous health monitoring where precise strain detection is required.

1. Introduction

Fiber sensors have been replacing conventional electronic sensors at a rapid rate because of their high sensitivity, compactness, robustness, immunity to electromagnetic interferences [1], etc. Typical ways to make a fiber sensor are by writing grating or micro-structures within the fiber-core, splicing, etc. Different configurations of fiber sensors including Fiber Bragg Grating (FBG) [2], Long Period Grating (LPG) [3,4], Mach–Zehnder Interferometer (MZI) [5,6], Michelson Interferometer (MI) [7,8], Fabry–Perot Interferometer (FPI), etc. have been studied and developed for various applications from medical to military, oil and gas, structural health monitoring, chemical, etc. [9,10].
An FPI structure can either be of an intrinsic or extrinsic type, depending on whether the cavity is internal or external to the optical fiber [11]. An external FPI provides the flexibility of using an air cavity or polymer type cavity. In contrast, a section of fiber is used as the cavity in an intrinsic FPI, and can be realized by thin-film coating [12,13], mismatching of refractive index (RI) between two fibers [14], laser-irradiated points [15,16], etc. An FPI has also been developed by sandwiching a piece of hollow-core fiber [17] and/or photonic crystal fiber [18] in-between two optical fibers, and tested for high-temperature applications [19,20]. These methods have drawbacks of involving expensive equipment, special fiber type, use of toxic chemicals, etc. Compact MZI and MI using core-cladding mode interferometer without needing an extra optical fiber have also been reported. An inline FPI can simply be formed by using Bragg gratings instead of reflecting mirrors [21] which also enables the ease of packaging, array manufacturing, etc. Some applications making use of these configurations have been reported, such as cavity sensor for strain and temperature measurement [22]; strain measurement independent of temperature [23] (using KrF 2 excimer laser with phase mask); humidity and temperature measurement [24], for reducing cross-sensitivity between strain and temperature using polarization maintaining fiber [25,26]; etc. Microfiber or small-diameter fiber-based sensors [27], resonators [28], and gratings [29] have been reported recently because these fibers offer unique properties, such as tight confinement, low-transmission loss, higher evanescent fields, etc. [30,31,32]. A tip-FPI fabricated by splicing a microfiber with standard single-mode fiber (SMF), has been tested up to 1000 ° C [33]. Microfiber-based FP interferometer, for measuring temperature and RI simultaneously, is presented by Vienne et. al. [28] while the authors of [34,35,36] reported the strain characteristic of an FBG and FP structure written in a microfiber, by using ultraviolet (UV) laser and phase mask technique.
A standard way of sensor fabrication is by writing a sensing structure in an optical fiber using UV laser, which requires the optical fiber to be photosensitive. In the case of a coated fiber (e.g., polyimide), the coating has to be stripped off before writing the sensor and then recoated after inscribing the structure [37]. The fs-laser has become a flexible and efficient tool to directly write (without phase mask) a waveguide or sensing structure in glass materials and to make other lab-on-chip devices [38,39]. Recently, researchers have also used fs-laser to inscribe microstructures within the fiber cladding [40,41]. This article investigates the feasibility of point-by-point writing of the FP structure in a fiber taper using fs-laser micromachining because scalability is one of the foremost requirements in sensor fabrication and deployment for many industrial applications. In addition, this article also investigates the strain and temperature characteristics of the sensor experimentally and will compare the response with a standard FBG sensor, which is the most commonly used fiber sensor for various structural health monitoring applications. Since the FP structure is written using a fs-laser, it would potentially last longer in harsh or high-temperature environments during continuous monitoring applications, and would be advantageous where precise strain detection is crucial.
In this article, the fabrication and sensing characteristics of the FBG-based FP structure using infrared fs-laser exposure in a biconical fiber taper are presented. The simulation of the spectrum of the structure, in a conventional fiber, was performed using Python and Optigrating simulation tool (as discussed in Section 2). Fabrication of the biconical fiber taper (adiabatically) and the sensing structure within its core using fs-laser micromachining are discussed in Section 3. Next, strain and temperature characteristics were investigated for a range up to 3400 μ ε and 225 ° C, respectively, for both the fabricated sensor and standard FBG and compared (discussed in Section 4). The device was found to have a higher sensitivity to strain and has the potential to be used for structural health monitoring in harsh environments with long-term stability.

2. Theory

An FBG, by definition, is a regular perturbation of the RI within the fiber core [9] that reflects the wavelengths satisfying the Bragg criterion as in Equation (1), where λ B is the Bragg wavelength, η e f f is effective RI of the grating, and Λ is the pitch of the grating.
λ B = 2 . η e f f . Λ
As shown by Legoubin et. al. [42], when two separate and identical Bragg gratings are written in the fiber core, with a small gap between, they form an FP structure. This structure manifests unique properties of having two spectral peaks within its main reflection band [22] and has better measurement resolution than a single direct grating [43]. The structure of a grating-based FP in a standard fiber (125 μ m cladding diameter), is shown in Figure 1, which consists of two identical uniform Bragg gratings of length g, separated by a distance e.
Following are the coupled mode equations derived using the coupled mode theory [44], to study the behavior of the grating and related FP structure. Consider r g ( λ ) and t g ( λ ) to be the complex amplitude reflection and transmission coefficients, respectively, for a uniform grating, given by Equations (2) and (3):
r g ( λ ) = - k s i n h ( ( k 2 g 2 - σ 2 g 2 ) ) σ s i n h ( ( k 2 g 2 - σ 2 g 2 ) ) + j ( k 2 - σ 2 ) c o s h ( ( k 2 g 2 - σ 2 g 2 ) )
t g ( λ ) = 1 c o s h ( ( k 2 g 2 - σ 2 g 2 ) ) - j ( σ ( k 2 - σ 2 ) ) s i n h ( ( k 2 g 2 - σ 2 g 2 ) )
where g is the grating length. k and σ are the ac and dc coupling coefficients of the grating [45], respectively. The reflection spectrum r f p 1 ( λ ) of an FP structure with two identical Bragg gratings, separated by a distance e (the cavity length or gap), is given by Equation (4) [22]:
r f p 1 ( λ ) r g ( λ ) . f ( ϕ )
where f( ϕ ) is an interference function of the cavity, which depends on phase difference ϕ ( λ ) between the light reflected from the gratings, given by Equation (6), assuming η c is the RI of the cavity region (gap). Figure 2 shows the normalized reflection spectrum of the FP structure in a standard optical fiber.
f ( ϕ ) = 1 + c o s ( ϕ ( λ ) )
ϕ ( λ ) = 4 π η c e λ
Yulianti et al. [24] also provided a set of modeling equations for designing an FP structure based on complex reflection and transmission coefficients of the uniform grating, i.e., Equations (2) and (3). The amplitude reflection coefficient of the FP, r f p 2 ( λ ) is given by Equation (7), and its power reflection coefficient is defined by, R = ∣r f p 2 ( λ )∣ 2 . Figure 3 shows the normalized reflection spectrum of the sensor where the reflection coefficient is plotted against the wavelength.
r f p 2 ( λ ) = r g ( λ ) . ( 1 + [ t g 2 - r g 2 ] . exp ( - j ϕ ) ) ( 1 - r g 2 . exp ( - j ϕ ) )
As can be seen in Figure 2 and Figure 3, the FP structure results in extremely narrow reflection peaks within the grating spectrum. If the minimum of the interference function λ m i n lies in the grating reflection spectrum, the peak splits into two. There are two cases mentioned by Wei et.al. [22]: (i) when λ m i n coincides with λ B , the two peaks are of equal intensity; and (ii) when λ B > λ m i n , Peak 1 (shorter wavelength) has lower intensity than Peak 2 (longer wavelength), as shown in Figure 3. With the applied strain and temperature, the spectrum of the grating and interference function both vary as a function of the phase difference ( ϕ ( λ )). Furthermore, the change of wavelengths for a grating can be derived from Equation (1) as in Equation (8), where the first term constitutes the strain effect and the latter is the temperature effect.
Δ λ B = 2 Λ η e f f g + 2 η e f f Λ g Δ g + 2 Λ η e f f T + 2 η e f f Λ T Δ T

2.1. Optigrating Simulation

Another simulation of the FP structure was carried out using Optigrating, which is a de-facto standard and powerful design tool from Optiwave Inc and can model the light propagation based on coupled-mode theory and enable grating design, analysis, and synthesis. For a grating design, several segments are connected using a transfer matrix method. An FP structure can be realized by considering a phase difference between two gratings, in lengths (mm). Table 1 shows the parameters used to perform the simulation.

2.1.1. Effective Refractive Index

Figure 4 shows the variation of the effective RI of the various modes for both 125 μ m cladding diameter (standard fiber) and 70 μ m cladding diameter fiber. In total, 110 modes were considered, i.e., LP l , m where l: 0,1,2…10 and m: 1,2,3…10. We observed that the effective RI of the individual mode reduces with the reduced fiber diameter, as can be seen in Lee et. al. [46].

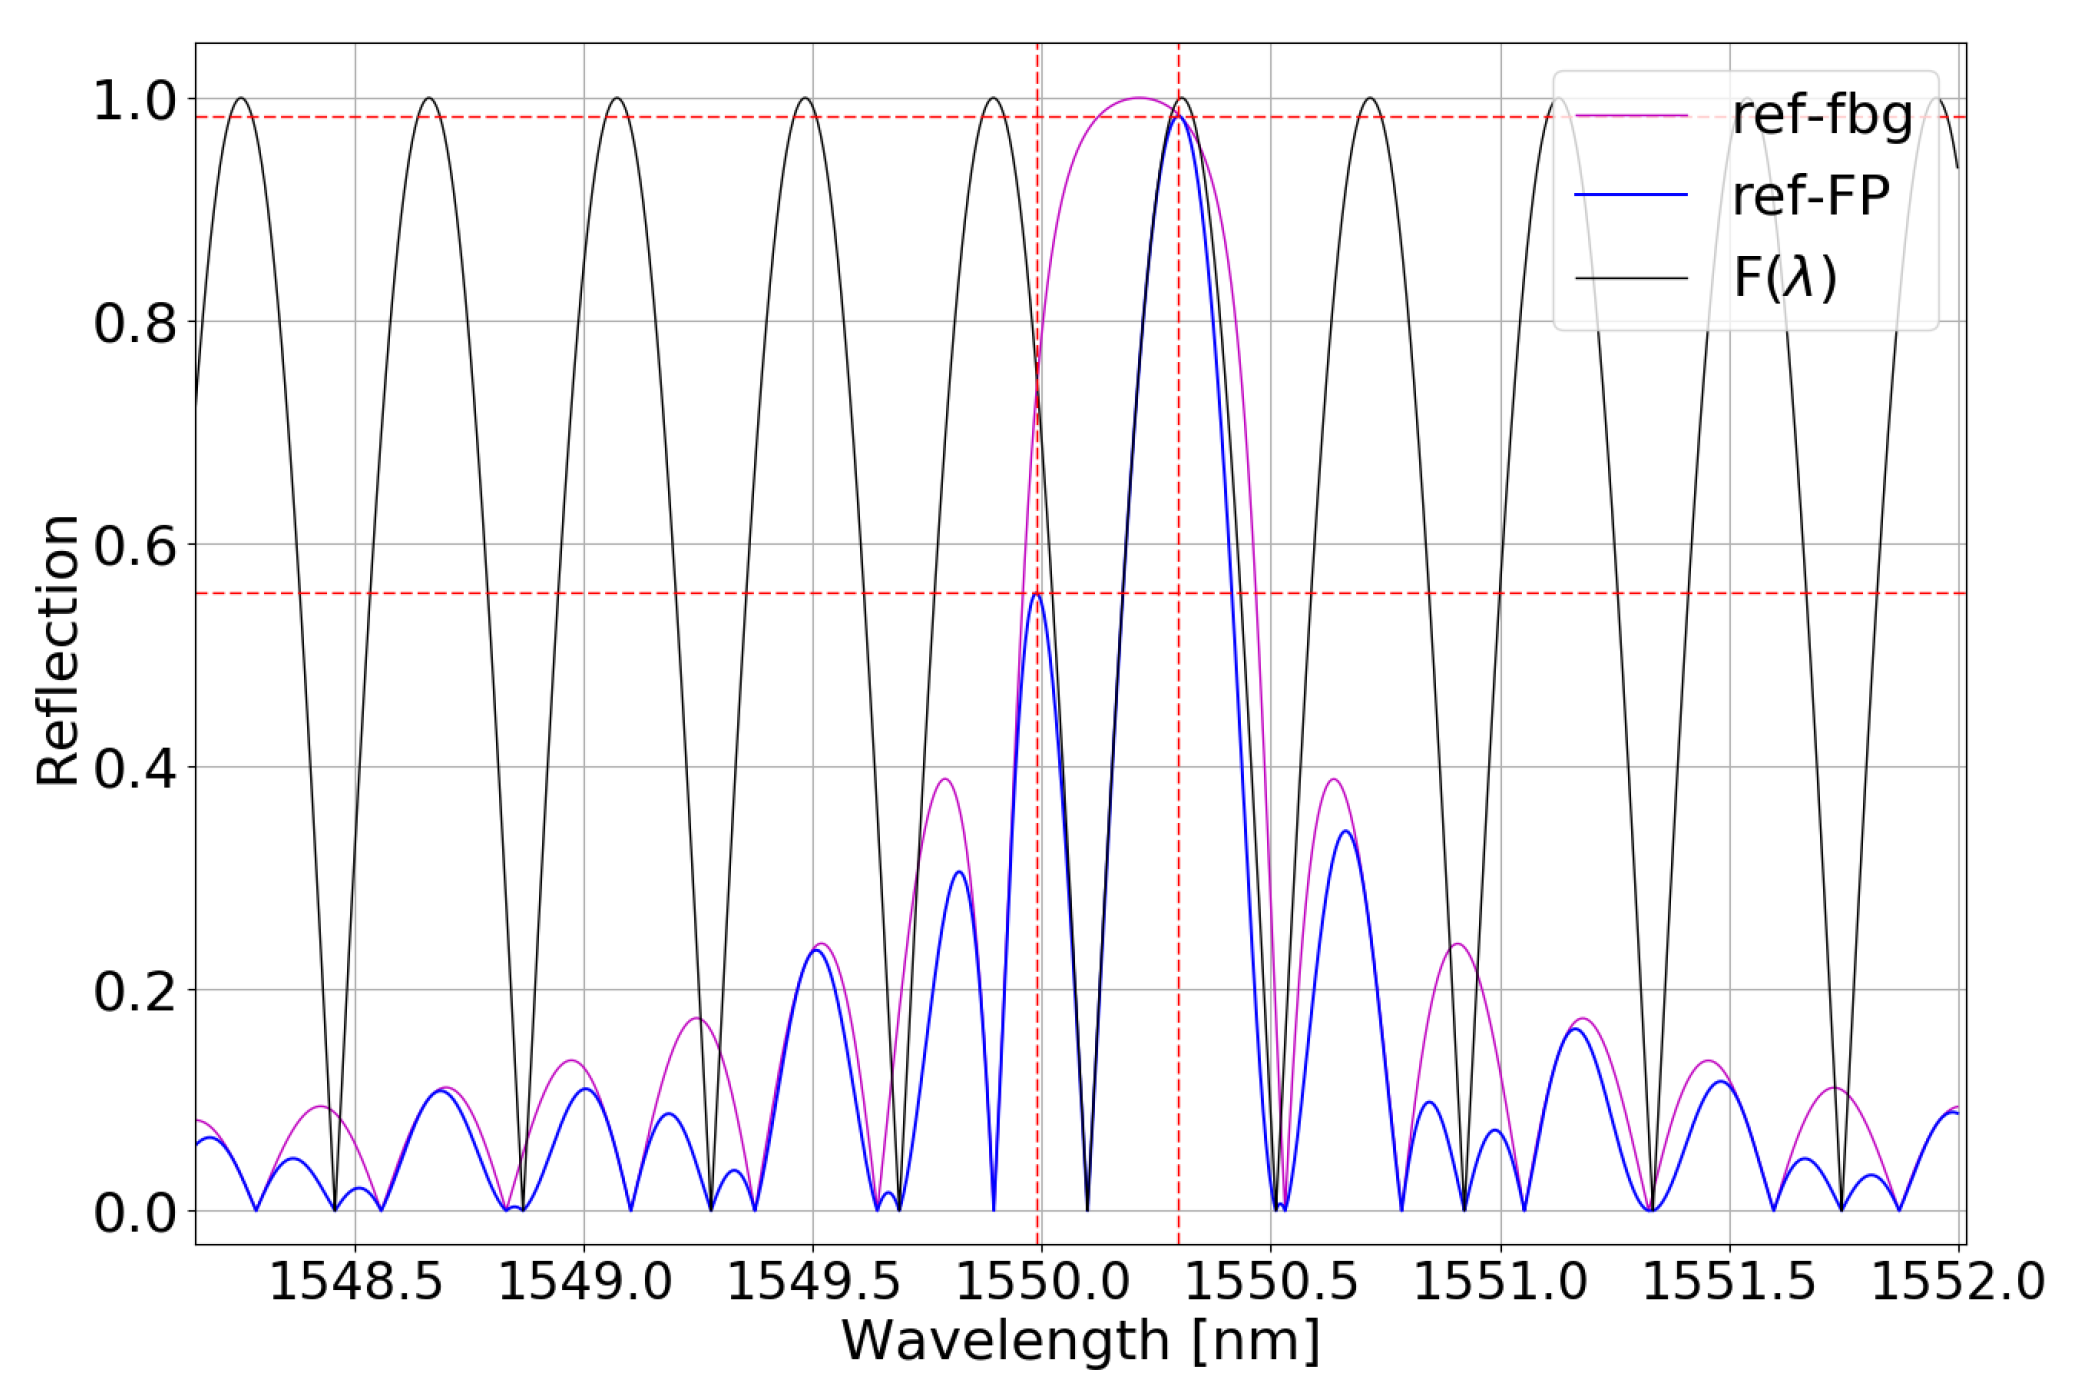
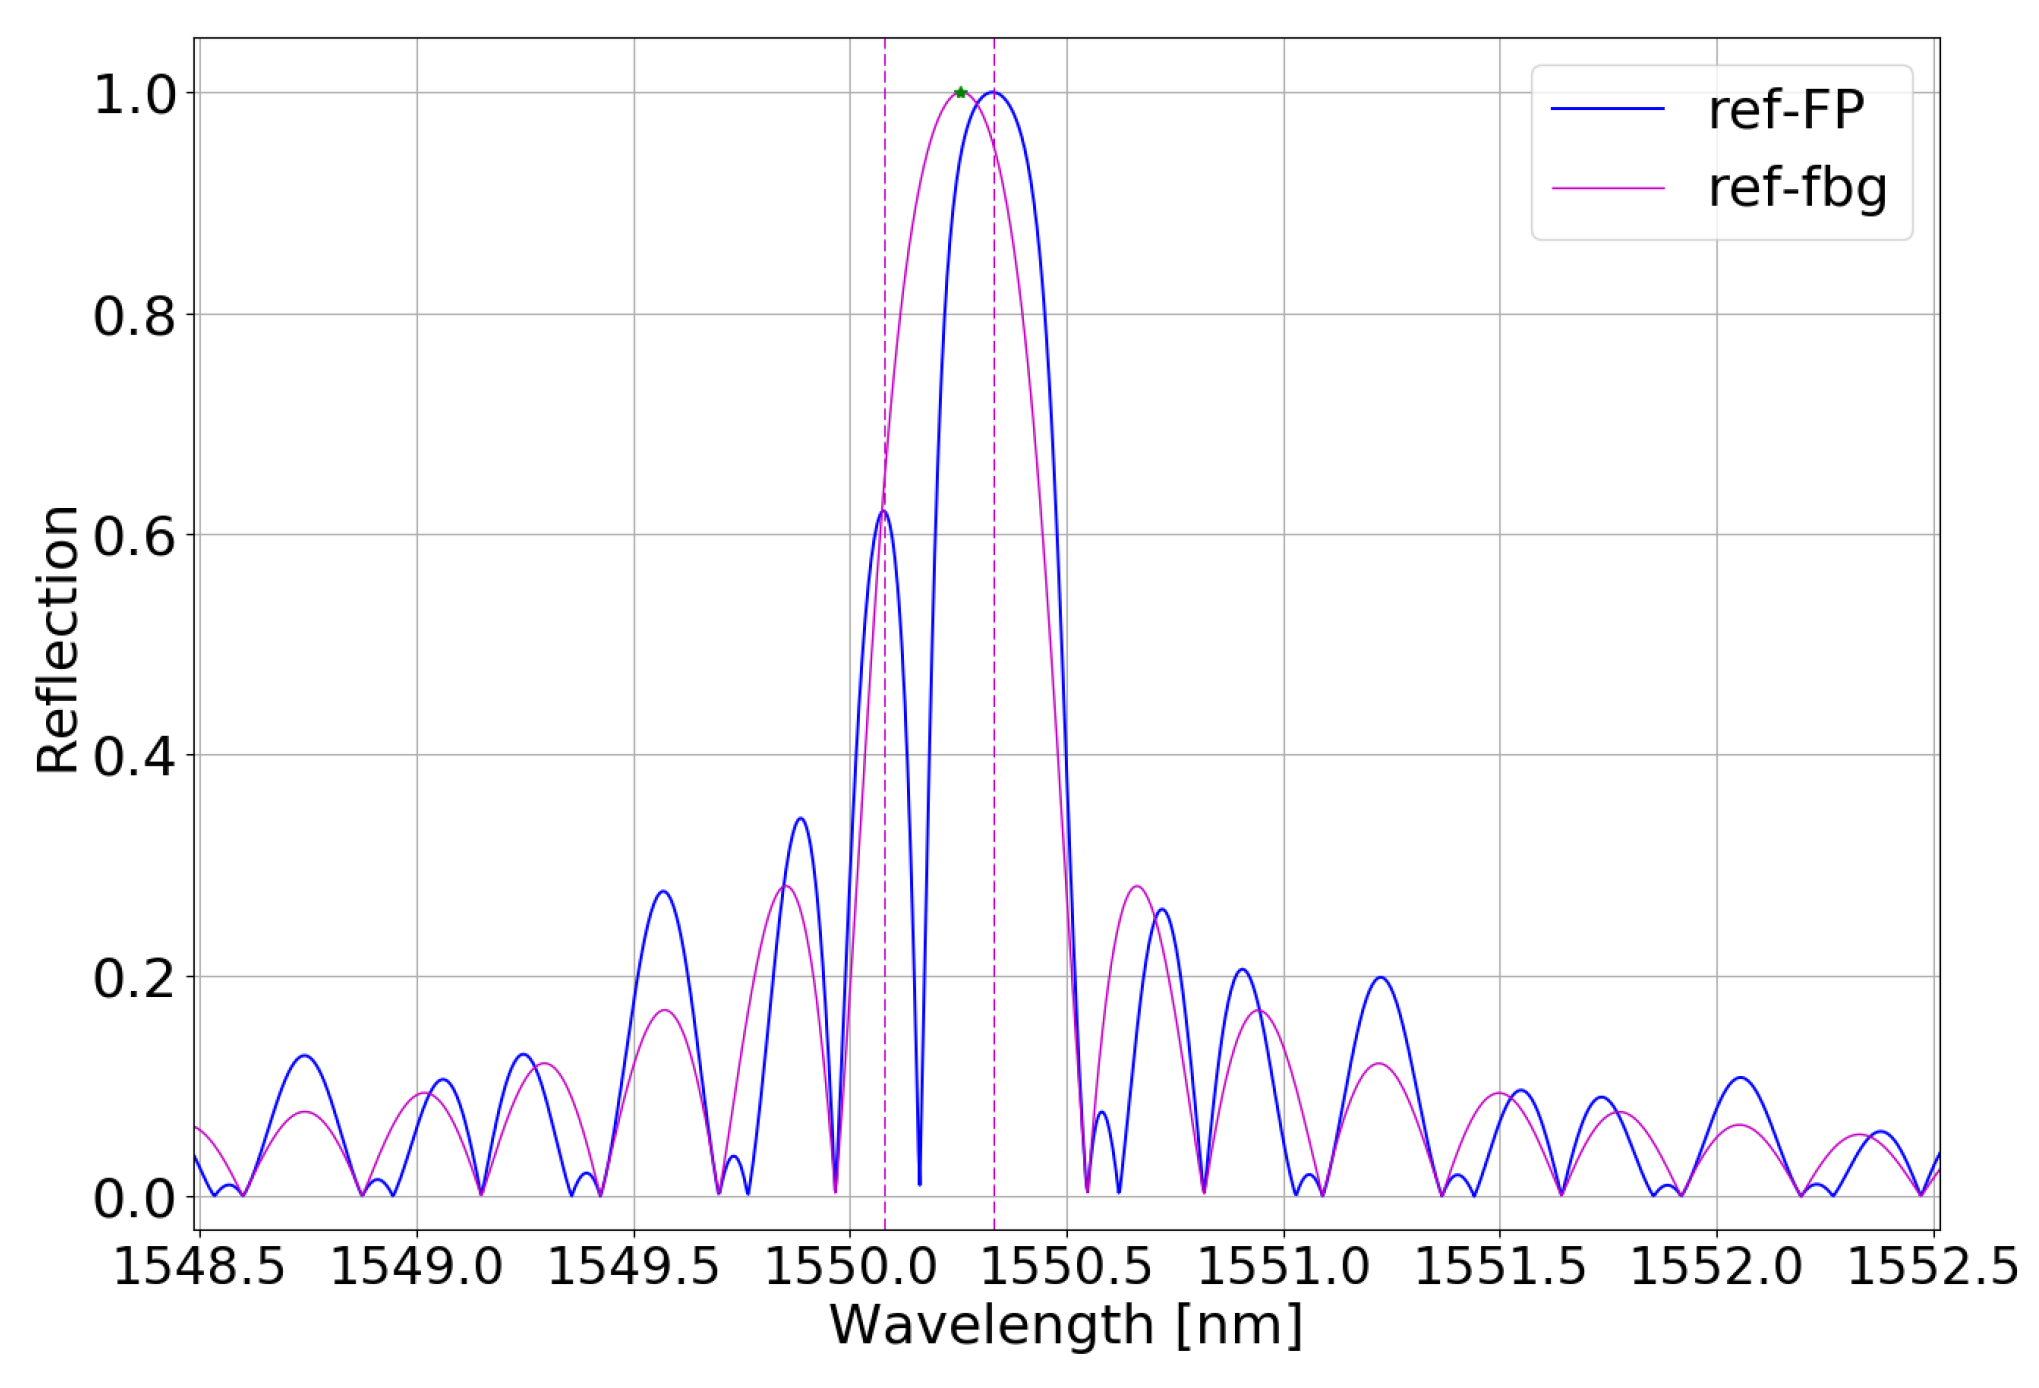
2.1.2. Transmission Spectrum

We also simulated the transmission spectrum of the FP structure in both 125 μ m cladding diameter and 70 μ m cladding diameter fiber, as shown in Figure 5. The spectrum possesses two transmission dips within the FBG main spectrum.
However, the aim is to fabricate the FP structure in an adiabatic fiber taper whose diameter has been tapered down to 70 μ m.

3. Device Fabrication

3.1. Making of a Fiber Taper

There are several fabrication techniques reported to make microfibers or fibers having diameter reduced down to few microns, such as by flame drawing [47], indirect laser drawing [48], flame brushing drawing [49], etc. We used the flame brushing technique described in [50], in which an SMF (Corning SMF-28 Ultra Optical Fiber) is placed horizontally on two translation stages after removing (stripping off) the coating from the section of the SMF to be tapered, and held by two holders (S1 and S2), as shown in Figure 6.
The flame underneath heats the fiber, which is being stretched by the translation stages at the same time, to make biconical fiber taper [51]. The fiber has two transition regions, which have a direct influence on the spectrum and losses, and a uniform waist [52]. The losses can be minimized if adiabaticity [53] is followed to make a good quality fiber taper. Figure 7a shows the schematic of the fiber after it is tapered down to 70 μ m waist diameter (d) with 13 mm waist length (l). A photograph (using a microscope) of the fiber waist after tapering is shown in Figure 7b. Next, we inscribe the sensing structure within the core of this fiber (≈4.7 μ m diameter) using a fs-laser.

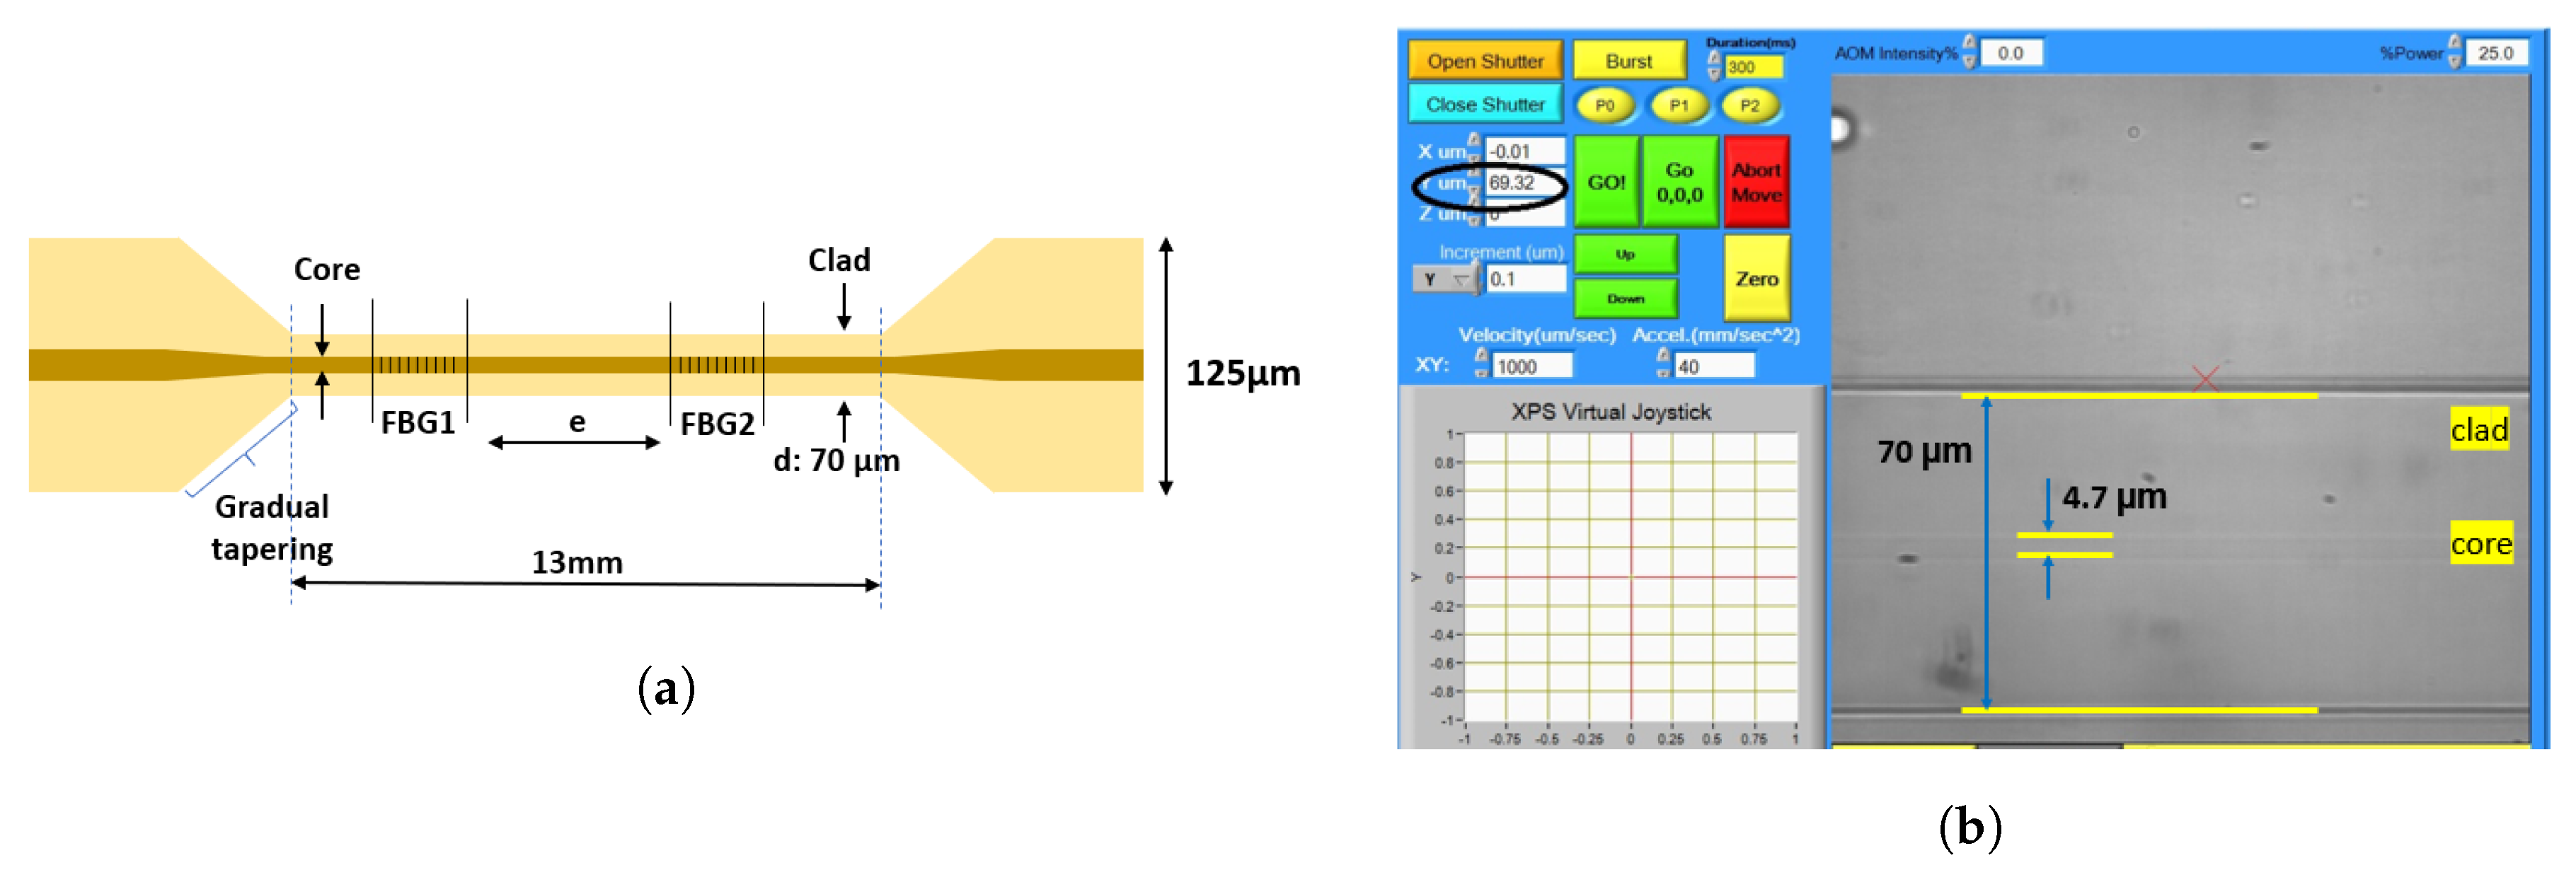
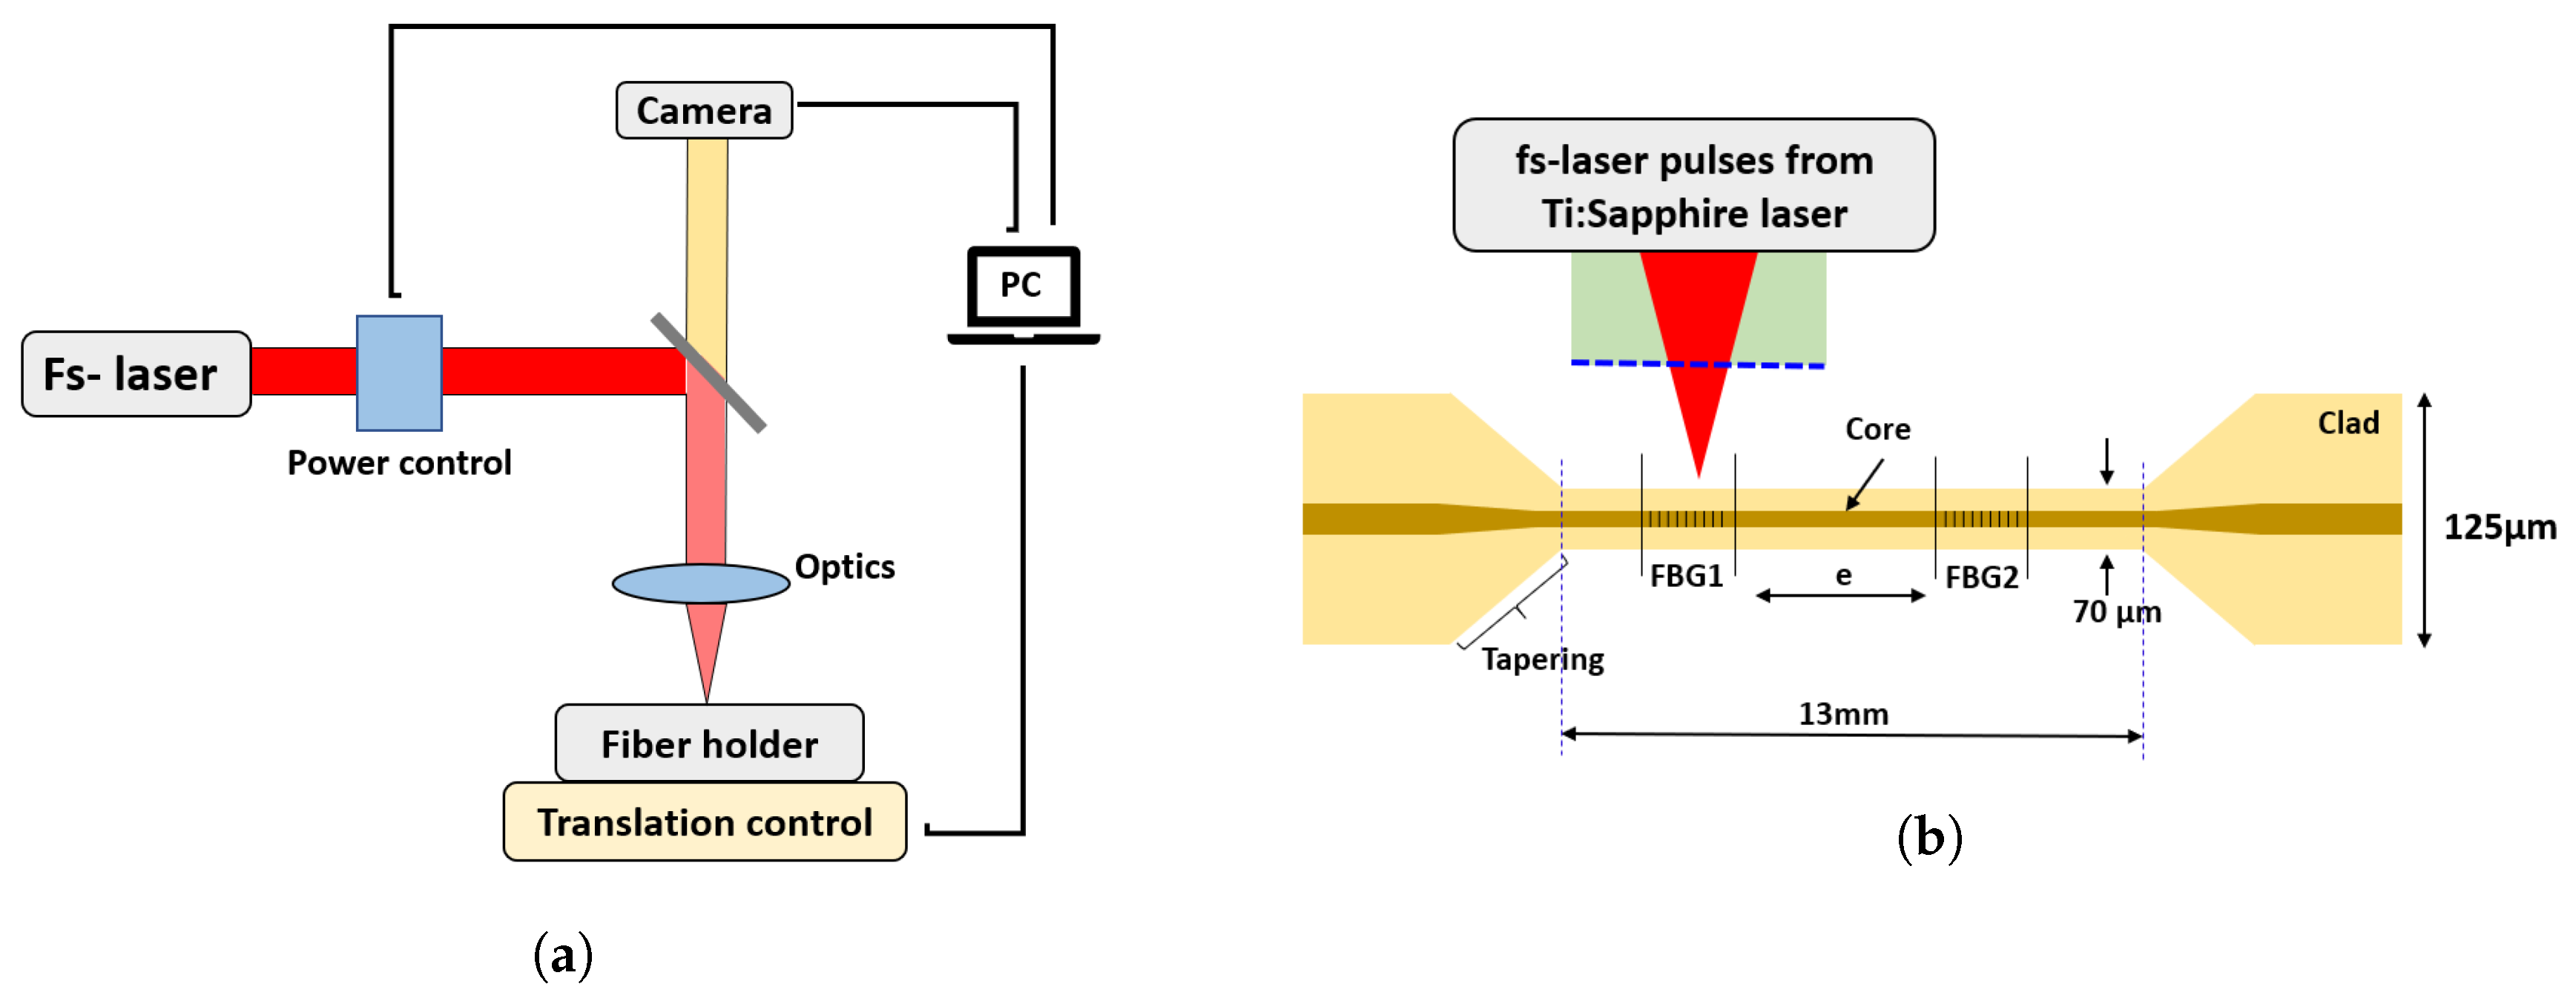
3.2. Inscription of the Sensing Structure

We irradiated the fiber core with the infrared fs-laser pulses to fabricate the sensing structure within it. Inscription with fs-laser is becoming a powerful technique because the fiber does not need to be photosensitive [54]. The technique produces a highly localized RI change [55] through the high-intensity laser pulse interaction across a tiny region in a shorter time-frame that will result in high-resolution inscription [56]. The fabricated sensors are relatively stable at higher temperatures than conventional UV laser-based sensors [57] because the change of index occurs as a result of high intensity nonlinear multiphoton process, which allows sensors to be durable up to approximately the glass transition temperature (t g ).
The fiber taper (see Figure 7a) is first placed on the fs-laser micromachining set-up (from Newport Corp.) shown in Figure 8a, having a precise control of movement (motion control) in three dimensions (X, Y, and Z axes). Next, the fiber alignment is performed using a three-dimensional translation controller. The fs-laser pulses, emitted from the Ti:sapphire laser source (from Spectra-Physics), are focused onto the fiber core. Each pulse creates a grating plane. The laser parameters [58] are shown in Table 2. The fiber is moved along its main axis with a translational speed ( ν ) to perform point-by-point writing (see Figure 8b). The period of a grating now depends on the translational speed ( ν ) and laser repetition rate (l f r ) as in Equation (9) [37]. In this way, the structure (total 7 mm in length), composed of two identical uniform FBG (each of 3 mm length) spaced apart by a small gap (1 mm), is directly inscribed within the core of the fiber waist.
Λ = ν l f r
The fabrication was performed in a standard fiber, followed by the fiber taper, using uniform apodization (45:45); the translational velocity was 103.1 μ m/s for the design wavelength of 1547.04 nm. Figure 9 shows the spectrum of the FP fabricated in the adiabatic fiber taper, where P1 and P2 are the two peaks, and d1 is the dip wavelength of the spectrum. Each wavelength was tracked for the applied strain and temperature during the experiment.

4. Strain and Temperature Testing
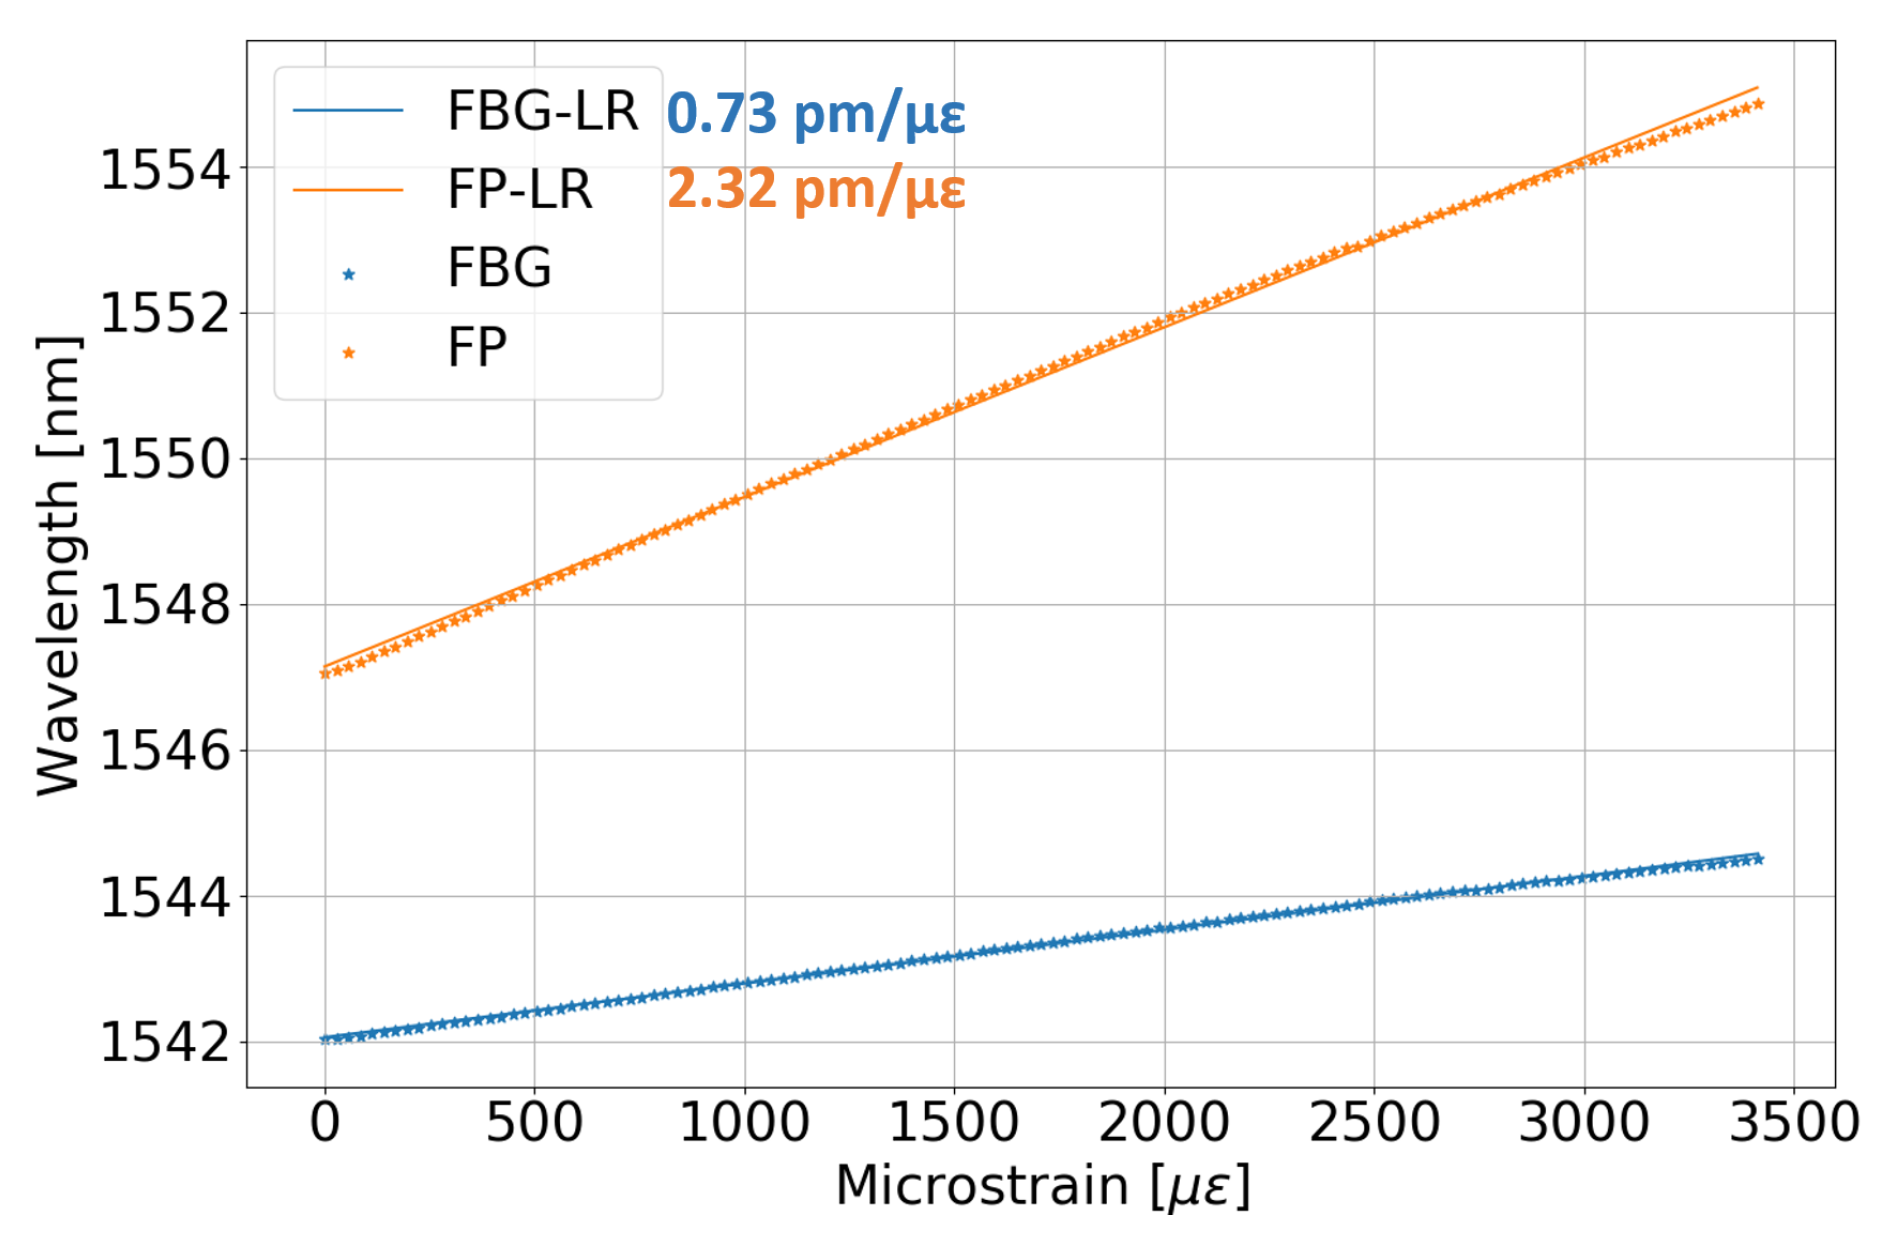
The strain and temperature sensing characteristics of the fabricated sensor, and an FBG sensor (polyimide coated, center wavelength: 1542.019 nm, length: 10 mm) in standard fiber, were investigated in succession and compared as explained in the following section.

4.1. Strain Testing

The experimental set-up for the strain testing is shown in Figure 10. The fiber sensor device under test (DUT) was held between Stages 1 and 2, using clamps C1 and C2. DUT refers to the FP and FBG sensing structure in the fiber. Stage 1 was fixed while Stage 2 can be moved precisely using a X-Y-Z axis controller. Fiber alignment was done using the controller, which later stretched the fiber in horizontal direction by 5.03 μ m per step. This stretching induced a strain in the fiber to be sensed by the DUT. The distance between the two stages (Stages 1 and 2) before stretching was set as 18 cm. The sensors’ peak wavelength and spectrum data were captured using an FBG interrogator (si155, from Micron Optics) at 1 kHz rate. The results of strain measurement and testing are presented in the form of peak wavelength response and spectrum evolution of the sensors.

4.1.1. Peak Wavelength Response

Figure 11 shows the variation of the average peak wavelength of both the sensors captured by the interrogator (might be the centroid-based mean of the two peaks in the spectrum), where LR is the linear regression line. The linear regression equations of the response of both FP and FBG sensors, respectively, are provided below:
Y = ( 0 . 00232 ) X + 1547 . 139   nm ; and
Y = ( 0 . 00073 ) X + 1542 . 049   nm

4.1.2. Spectrum Evolution

The spectrum of both the sensors shifts towards longer wavelengths after experiencing strain, as shown in Figure 12a,b for the FP and FBG, respectively. The variation of the peak and dip wavelengths can be derived from the spectrum, as shown in Figure 12c, with their linear regression is shown in Table 3. The sensitivity of the FP and FBG was found to be about 2.32 pm/ μ ε and 0.73 pm/ μ ε , respectively.

4.2. Temperature Testing

The temperature testing of both sensors was performed by putting them inside an oven and testing from room temperature up to a maximum temperature of 225 ° C for two thermal cycles, as shown in Figure 13a. Both sensors were connected to an interrogator (sm130, from Micron Optics) to collect the wavelength and spectrum data. The temperature data were collected using a thermocouple. The trend of the absolute wavelength response of both sensors is similar to that of variation in the temperature, as shown in Figure 13b, where the FP response is plotted on Y-axis and the FBG response on the Y2-axis. The variations in wavelength of both sensors were tracked separately for heating up and cooling down phase, under two thermal cycles. Figure 14a,b shows the sensor response for heating and cooling, respectively, under first temperature cycle. Figure 15a,b shows the corresponding response for the second temperature cycle. LR in all four diagrams stands for linear regression line. Both sensors behave linearly to the temperature with approximately similar sensitivity of 8.85 pm/ ° C. The linear regression of the sensor response for both the temperature cycles is shown in Table 4.

5. Conclusions

We present the detailed fabrication process of a Bragg grating-based FP sensor within the core of the biconical fiber taper (tapered adiabatically) using fs-laser. The sensing characteristics of the fabricated sensor were investigated for strain and temperature measurands, and compared with the response of an FBG, which is a widely used fiber sensor for continuous monitoring applications. The fabricated sensor attains a high strain sensitivity of 2.32 pm/ μ ε in comparison to the stain sensitivity experienced by the FBG in standard fiber (0.73 pm/ μ ε ). In contrast, both sensors demonstrate similar sensitivity to temperature (about 8.85 pm/ ° C). The sensor can be deployed in a high-temperature environment (after having a suitable outer coating depending on application scenario), as the fabrication is performed using fs-laser irradiation that makes the sensor more robust compared to conventional UV-written sensors. Such sensors would be highly desirable in structural health monitoring applications where precise strain detection is crucial. The advantages of this simple fabrication process enhance the scalability, ease of mounting, etc. during deployment. For future work, we will investigate the sensing characteristics and fabrication feasibility of sensors with fs-laser in further reduced waist diameter fibers or microfibers, and some specialty fibers, to monitor parameters enabling structural health monitoring applications.

Author Contributions

Conceptualization, A.M., W.C., P.P.S., and J.H.; Methodology, A.M., S.H.K.Y., W.C., and P.P.S.; Investigation, A.M. and V.P.; Resources, A.M., S.H.K.Y., V.P., P.P.S., and J.H.; Data curation, A.M., and V.P.; Writing—original draft, A.M.; Writing—review and editing, A.M., S.H.K.Y., V.P., W.C., P.P.S., and J.H.; Visualization, A.M., W.C., P.P.S., and J.H.; Supervision, W.C., P.P.S., and J.H.; Project administration, W.C., P.P.S., and J.H.; Funding acquisition, P.P.S. and J.H. All authors have read and agreed to the published version of the manuscript.

Funding

This research received no external funding.

Acknowledgments

The authors would like to thank Tommy Jin, Technica Advanced Technology Center Singapore, for providing his valuable suggestions and access to the design and fabrication facility.

Conflicts of Interest

The authors declare no conflict of interest.

References

  1. Hochberg, R.C. Fiber-optic sensors. IEEE Trans. Instrum. Meas. 1986, IM-35, 447–450. [Google Scholar] [CrossRef]
  2. Hill, K.O.; Fujii, Y.; Johnson, D.C.; Kawasaki, B.S. Photosensitivity in optical fiber waveguides: Application to reflection filter fabrication. Appl. Phys. Lett. 1978, 32, 647–649. [Google Scholar] [CrossRef]
  3. Liang, W.; Huang, Y.; Xu, Y.; Lee, R.K.; Yariv, A. Highly sensitive fiber Bragg grating refractive index sensors. Appl. Phys. Lett. 2005, 86, 151122. [Google Scholar] [CrossRef]
  4. Patrick, H.J.; Kersey, A.D.; Bucholtz, F. Analysis of the Response of Long Period Fiber Gratings to External Index of Refraction. J. Light. Technol. 1998, 16, 1606. [Google Scholar] [CrossRef]
  5. Hu, X.; Shen, X.; Wu, J.; Peng, J.; Yang, L.; Li, J.; Li, H.; Dai, N. All fiber M-Z interferometer for high temperature sensing based on a hetero-structured cladding solid-core photonic bandgap fiber. Opt. Express 2016, 24, 21693–21699. [Google Scholar] [CrossRef] [PubMed]
  6. Wang, Y.; Li, Y.; Liao, C.; Wang, D.N.; Yang, M.; Lu, P. High-Temperature Sensing Using Miniaturized Fiber In-Line Mach–Zehnder Interferometer. IEEE Photonics Technol. Lett. 2010, 22, 39–41. [Google Scholar] [CrossRef]
  7. Yin, J.; Liu, T.; Jiang, J.; Liu, K.; Wang, S.; Zou, S.; Wu, F. Assembly-Free-Based Fiber-Optic Micro-Michelson Interferometer for High Temperature Sensing. IEEE Photonics Technol. Lett. 2016, 28, 625–628. [Google Scholar] [CrossRef]
  8. Yuan, L.; Wei, T.; Han, Q.; Wang, H.; Huang, J.; Jiang, L.; Xiao, H. Fiber inline Michelson interferometer fabricated by a femtosecond laser. Opt. Lett. 2012, 37, 4489–4491. [Google Scholar] [CrossRef]
  9. Jung, J.; Nam, H.; Lee, B.; Byun, J.O.; Kim, N.S. Fiber Bragg grating temperature sensor with controllable sensitivity. Appl. Opt. 1999, 38, 2752–2754. [Google Scholar] [CrossRef]
  10. Zhuo, Z.C.; Ham, B.S. A temperature-insensitive strain sensor using a fiber Bragg grating. Opt. Fiber Technol. 2009, 15, 442–444. [Google Scholar] [CrossRef]
  11. Zhu, T.; Wu, D.; Liu, M.; Duan, D.-W. In-line fiber optic interferometric sensors in single-mode fibers. Sensors 2012, 12, 10430–10449. [Google Scholar] [CrossRef] [PubMed] [Green Version]
  12. Kao, T.W.; Taylor, H.F. High-sensitivity intrinsic fiber-optic Fabry—Perot pressure sensor. Opt. Lett. 1996, 21, 615–617. [Google Scholar] [CrossRef] [PubMed]
  13. Lee, C.E.; Gibler, W.N.; Atkins, R.A.; Taylor, H.F. In-line fiber Fabry-Perot interferometer with high-reflectance internal mirrors. J. Light. Technol. 1992, 10, 1376–1379. [Google Scholar] [CrossRef]
  14. Woo-Hu, T.; Chun-Jung, L. A novel structure for the intrinsic Fabry-Perot fiber-optic temperature sensor. J. Light. Technol. 2001, 19, 682–686. [Google Scholar] [CrossRef]
  15. Wei, T.; Han, Y.; Tsai, H.-L.; Xiao, H. Miniaturized fiber inline Fabry-Perot interferometer fabricated with a femtosecond laser. Opt. Lett. 2008, 33, 536–538. [Google Scholar] [CrossRef]
  16. Rao, Y.-J.; Deng, M.; Duan, D.-W.; Yang, X.-C.; Zhu, T.; Cheng, G.-H. Micro Fabry-Perot interferometers in silica fibers machined by femtosecond laser. Opt. Express 2007, 15, 14123–14128. [Google Scholar] [CrossRef]
  17. Rao, Y.J.; Zhu, T.; Yang, X.C.; Duan, D.W. In-line fiber-optic etalon formed by hollow-core photonic crystal fiber. Opt. Lett. 2007, 32, 2662–2664. [Google Scholar] [CrossRef]
  18. Choi, H.Y.; Mudhana, G.; Park, K.S.; Paek, U.-C.; Lee, B.H. Cross-talk free and ultra-compact fiber optic sensor for simultaneous measurement of temperature and refractive index. Opt. Express 2010, 18, 141–149. [Google Scholar] [CrossRef]
  19. Liu, D.; Wu, Q.; Mei, C.; Yuan, J.; Xin, X.; Mallik, A.K.; Wei, F.; Han, W.; Kumar, R.; Yu, C.; et al. Hollow Core Fiber Based Interferometer for High-Temperature (1000 °C) Measurement. J. Light. Technol. 2018, 36, 1583–1590. [Google Scholar] [CrossRef] [Green Version]
  20. Li, L.; Xia, L.; Xie, Z.; Liu, D. All-fiber Mach-Zehnder interferometers for sensing applications. Opt. Express 2012, 20, 11109–11120. [Google Scholar] [CrossRef]
  21. Jacobsson, B.; Pasiskevicius, V.; Laurell, F. Single-longitudinal-mode Nd-laser with a Bragg-grating Fabry-Perot cavity. Opt. Express 2006, 14, 9284–9292. [Google Scholar] [CrossRef] [PubMed]
  22. Wei-Chong, D.; Xiao-Ming, T.; Hwa-Yaw, T. Fiber Bragg grating cavity sensor for simultaneous measurement of strain and temperature. IEEE Photonics Technol. Lett. 1999, 11, 105–107. [Google Scholar] [CrossRef] [Green Version]
  23. Weichong, D.; Xiaoming, T.; Hwa-Yaw, T. Temperature independent strain measurement with a fiber grating tapered cavity sensor. IEEE Photonics Technol. Lett. 1999, 11, 596–598. [Google Scholar] [CrossRef] [Green Version]
  24. Yulianti, I.; Supa’at, A.S.M.; Idrus, S.M.; Anwar, M.R.S. Design of fiber Bragg grating-based Fabry–Perot sensor for simultaneous measurement of humidity and temperature. Optik 2013, 124, 3919–3923. [Google Scholar] [CrossRef]
  25. Uchimura, R.; Wada, A.; Tanaka, S.; Takahashi, N. Fiber Fabry-Perot Interferometric Sensor Using Bragg Gratings in Polarization Maintaining Fiber. J. Light. Technol. 2015, 33, 2499–2503. [Google Scholar] [CrossRef]
  26. Wada, A.; Tanaka, S.; Takahashi, N. Simultaneous measurement of strain and temperature using a Fabry–Perot interferometer consisting of Bragg gratings in polarization–maintaining fiber and current–modulated laser diodes. Jpn. J. Appl. Phys. 2017, 56, 032502. [Google Scholar] [CrossRef]
  27. Wang, P.; Bo, L.; Guan, C.; Semenova, Y.; Wu, Q.; Brambilla, G.; Farrell, G. Low–temperature sensitivity periodically tapered photonic crystal–fiber–based refractometer. Opt. Lett. 2013, 38, 3795–3798. [Google Scholar] [CrossRef]
  28. Vienne, G.; Coillet, A.; Grelu, P.; Amraoui, M.E.; Jules, J.-C.; Smektala, F.; Tong, L. Demonstration of a reef knot microfiber resonator. Opt. Express 2009, 17, 6224–6229. [Google Scholar] [CrossRef]
  29. Luo, H.; Sun, Q.; Xu, Z.; Jia, W.; Liu, D. Highly sensitive temperature sensor based on D–shaped microfiber with high birefringence. SPIE 2014, 9157, 915787. [Google Scholar] [CrossRef]
  30. Brambilla, G.; Finazzi, V.; Richardson, D.J. Ultra-low-loss optical fiber nanotapers. Opt. Express 2004, 12, 2258–2263. [Google Scholar] [CrossRef]
  31. Sumetsky, M.; Dulashko, Y.; Hale, A. Fabrication and study of bent and coiled free silica nanowires: Self-coupling microloop optical interferometer. Opt. Express 2004, 12, 3521–3531. [Google Scholar] [CrossRef]
  32. Leon-Saval, S.G.; Birks, T.A.; Wadsworth, W.J.; Russell, P.S.J.; Mason, M.W. Supercontinuum generation in submicron fibre waveguides. Opt. Express 2004, 12, 2864–2869. [Google Scholar] [CrossRef]
  33. Chen, Z.; Xiong, S.; Gao, S.; Zhang, H.; Wan, L.; Huang, X.; Huang, B.; Feng, Y.; Liu, W.; Li, Z. High–Temperature Sensor Based on Fabry–Perot Interferometer in Microfiber Tip. Sensors 2018, 18, 202. [Google Scholar] [CrossRef] [Green Version]
  34. Tian, J.; Liu, S.; Yu, W.; Deng, P. Microfiber Bragg grating for temperature and strain sensing applications. Photonic Sens. 2017, 7, 44–47. [Google Scholar] [CrossRef]
  35. Li, J.; Shen, X.; Sun, L.-P.; Guan, B.-O. Characteristics of microfiber Fabry-Perot resonators fabricated by UV exposure. Opt. Express 2013, 21, 12111–12121. [Google Scholar] [CrossRef]
  36. Wang, X.; Li, Z.; Lin, J.; Wang, W.; Tian, Y.; Pang, Y. The Characteristics in the Sensitivity of Microfiber Fabry-Perot Interferometric Transducers. IOP Conf. Ser. Earth Environ. Sci. 2018, 111, 012013. [Google Scholar] [CrossRef] [Green Version]
  37. Fiber Bragg Grating Manufacturing Workstation, Newport. Available online: https://www.newport.com/f/fiber-bragg-grating-workstation (accessed on 1 July 2019).
  38. Szameit, A.; Burghoff, J.; Pertsch, T.; Nolte, S.; Tünnermann, A.; Lederer, F. Two-dimensional soliton in cubic fs laser written waveguide arrays in fused silica. Opt. Express 2006, 14, 6055–6062. [Google Scholar] [CrossRef]
  39. Pospiech, M.; Emons, M.; Steinmann, A.; Palmer, G.; Osellame, R.; Bellini, N.; Cerullo, G.; Morgner, U. Double waveguide couplers produced by simultaneous femtosecond writing. Opt. Express 2009, 17, 3555–3563. [Google Scholar] [CrossRef]
  40. Lee, K.K.C.; Mariampillai, A.; Haque, M.; Standish, B.A.; Yang, V.X.D.; Herman, P.R. Temperature–compensated fiber optic 3D shape sensor using femtosecond laser direct–written Bragg grating waveguides. SPIE 2014, 8972. [Google Scholar] [CrossRef]
  41. Grenier, J.R.; Fernandes, L.A.; Herman, P.R. Femtosecond laser inscription of asymmetric directional couplers for in–fiber optical taps and fiber cladding photonics. Opt. Express 2015, 23, 16760–16771. [Google Scholar] [CrossRef] [Green Version]
  42. Legoubin, S.; Douay, M.; Bernage, P.; Niay, P.; Boj, S.; Delevaque, E. Free spectral range variations of grating–based Fabry–Perot filters photowritten in optical fibers. J. Opt. Soc. Am. A 1995, 12, 1687–1694. [Google Scholar] [CrossRef]
  43. Statkiewicz-Barabach, G.; Mergo, P.; Urbanczyk, W. Bragg grating-based Fabry–Perot interferometer fabricated in a polymer fiber for sensing with improved resolution. J. Opt. 2016, 19, 015609. [Google Scholar] [CrossRef]
  44. Huang, W.-P. Coupled–mode theory for optical waveguides: An overview. J. Opt. Soc. Am. A 1994, 11, 963–983. [Google Scholar] [CrossRef]
  45. Erdogan, T. Fiber grating spectra. J. Light. Technol. 1997, 15, 1277–1294. [Google Scholar] [CrossRef] [Green Version]
  46. Lee, H.J.; Abdullah, F.; Emami, S.D.; Ismail, A. Fiber modeling and simulation of effective refractive index for tapered fiber with finite element method. In Proceedings of the 2016 IEEE 6th International Conference on Photonics (ICP), Kuching, Malaysia, 14–16 March 2016; pp. 1–3. [Google Scholar]
  47. Birks, T.A.; Li, Y.W. The shape of fiber tapers. J. Light. Technol. 1992, 10, 432–438. [Google Scholar] [CrossRef]
  48. Dimmick, T.E.; Kakarantzas, G.; Birks, T.A.; Russell, P.S.J. Carbon dioxide laser fabrication of fused–fiber couplers and tapers. Appl. Opt. 1999, 38, 6845–6848. [Google Scholar] [CrossRef]
  49. Li, J.; Sun, L.-P.; Gao, S.; Quan, Z.; Chang, Y.-L.; Ran, Y.; Jin, L.; Guan, B.-O. Ultrasensitive refractive-index sensors based on rectangular silica microfibers. Opt. Lett. 2011, 36, 3593–3595. [Google Scholar] [CrossRef] [PubMed]
  50. Bilodeau, F.; Hill, K.O.; Faucher, S.; Johnson, D.C. Low–loss highly overcoupled fused couplers: Fabrication and sensitivity to external pressure. J. Light. Technol. 1988, 6, 1476–1482. [Google Scholar] [CrossRef]
  51. Lim, K.S.; Harun, S.W.; Arof, H.; Ahmad, H. Fabrication and Applications of Microfiber. In Selected Topics on Optical Fiber Technology; IntechOpen: London, UK, 2012. [Google Scholar] [CrossRef] [Green Version]
  52. Harun, S.W.; Ahmad, H.; Jasim, A.A.; Sulaiman, A. Microfiber structures and its sensor and laser applications. In Proceedings of the 2012 Photonics Global Conference (PGC), Singapore, 13–16 December 2012; pp. 1–3. [Google Scholar]
  53. Caspar, C.; Bachus, E. Fibre–optic micro–ring–resonator with 2 mm diameter. Electron. Lett. 1989, 25, 1506–1508. [Google Scholar] [CrossRef]
  54. Florea, C.; Winick, K.A. Fabrication and Characterization of PhotonicDevices Directly Written in Glass UsingFemtosecond Laser Pulses. J. Light. Technol. 2003, 21, 246. [Google Scholar] [CrossRef] [Green Version]
  55. Fang, X.; Liao, C.R.; Wang, D.N. Femtosecond laser fabricated fiber Bragg grating in microfiber for refractive index sensing. Opt. Lett. 2010, 35, 1007–1009. [Google Scholar] [CrossRef] [Green Version]
  56. Kalli, K.; Theodosiou, A.; Ioannou, A.; Lacraz, A. Femtosecond laser processing of optical fibres for novel sensor development. SPIE 2017, 10323. [Google Scholar] [CrossRef]
  57. Mihailov, S.J.; Grobnic, D.; Hnatovsky, C.; Walker, R.B.; Lu, P. Extreme Environment Sensing Using Femtosecond Laser-Inscribed Fiber Bragg Gratings. Sensors 2017, 17, 2909. [Google Scholar] [CrossRef] [Green Version]
  58. Spirit Setting a New Stabdard for High-Precision Micromachining Using High Power Femtosecond Lasers. Available online: https://www.spectra-physics.com/products/ultrafast-lasers/spirit (accessed on 1 July 2019).
Figure 1. Schematic of grating-based Fabry–Perot.
Applsci 10 01069 g001
Figure 2. Normalized reflection spectrum of the FP structure.
Applsci 10 01069 g002
Figure 3. Normalized reflection spectrum of the FP structure.
Applsci 10 01069 g003
Figure 4. Variation of effective refractive index.
Applsci 10 01069 g004
Figure 5. Transmission spectrum of FP structure: (a) 125 μ m diameter fiber; and (b) 70 μ m diameter fiber.
Applsci 10 01069 g005
Figure 6. Schematic: flame brushing technique.
Applsci 10 01069 g006
Figure 7. Adiabatic fiber taper: (a) schematic; and (b) microscopic view of fiber waist after taper.
Applsci 10 01069 g007
Figure 8. Inscription of sensing structure in fiber taper: (a) micromachining set-up; and (b) sensor writing.
Applsci 10 01069 g008
Figure 9. Spectrum of the fabricated FP in adiabatic fiber taper.
Applsci 10 01069 g009
Figure 10. Strain testing experimental set up.
Applsci 10 01069 g010
Figure 11. Peak wavelength response of the FP and FBG.
Applsci 10 01069 g011
Figure 12. Spectral response of both sensors: (a) FP sensor; (b) FBG sensor; and (c) wavelengths recovered from spectrum.
Applsci 10 01069 g012
Figure 13. Temperature testing: (a) thermal cycles; and (b) absolute wavelength response.
Applsci 10 01069 g013
Figure 14. Thermal Cycle I: (a) heating; and (b) cooling.
Applsci 10 01069 g014
Figure 15. Thermal Cycle II: (a) heating; and (b) cooling.
Applsci 10 01069 g015
Table 1. Simulation parameters.
ParameterValue
Core radius4.07 μ m
Cladding radius62.5 μ m
Surrounding medium radius20 μ m
Core RI1.46
Cladding RI1.44681
Surrounding medium RI1.0
Design wavelength1550 nm
Total number of LP l , m modes110 [l = 0,1,2…10; m = 1,2,3…10]
Grating shapeRectangle
ApodizationUniform
Grating length3 mm
Structure length7 mm
RI modulation3 × 10 - 4
Number of segments80
Table 2. Laser parameters.
ModelSpirit One 1040-8-SHG (Second Harmonic Generator)
Repetition rate200 KHz OR 1 MHz
Pulse energy>39 μ J at 200 KHz
Pulse width<400 fs (327 fs)
Pulse picker divider3230
Beam Diameter at exit2 ± 0.2 mm
Wavelength (SHG)520 ± 3 nm
Output power (SHG)>4 W at 200 KHz
Table 3. Linear Regression of Sensor Wavelength Tracked from Spectrum (Figure 12c).
WavelengthEquation
FBG-PeakY = 0.00073 X + 1542.033 nm
FP-P1Y = 0.00232 X + 1547.095 nm
FP-P2Y = 0.00233 X + 1547.265 nm
FP-d1Y = 0.00233 X + 1547.196 nm
Table 4. Linear Regression of Sensor Response to Temperature in Figure 14 and Figure 15.
CyclePhaseFPFBG
Cycle IHeatingY = (0.00886)X + 1546.89 nmY = (0.00881)X + 1541.789 nm
CoolingY = (0.00891)X + 1546.852 nmY = (0.00883)X + 1541.746 nm
Cycle IIHeatingY = (0.00886)X + 1546.883 nmY = (0.00877)X + 1541.773 nm
CoolingY = (0.00883)X + 1546.861 nmY = (0.00875)X + 1541.751 nm

