Article

Fiber Optic Sensor for Real-time Monitoring of Freezing–Thawing Cycle in Cryosurgery

by
Dimosthenis Spasopoulos
1,
George Rattas
1,
Archontis Kaisas
1,
Thomas Dalagiannis
1,
Ioannis D. Bassukas
2,
Nikolaos Kourkoumelis
3 and
Aris Ikiades
1,*
1
Department of Physics, University of Ioannina, 45110 Ioannina, Greece
2
Department of Skin & Venereal Diseases, School of Health Sciences, University of Ioannina, 45110 Ioannina, Greece
3
Department of Medical Physics, School of Health Sciences, University of Ioannina, 45110 Ioannina, Greece
*
Author to whom correspondence should be addressed.
Appl. Sci. 2020, 10(3), 1053; https://doi.org/10.3390/app10031053
Submission received: 13 November 2019 / Revised: 22 January 2020 / Accepted: 30 January 2020 / Published: 5 February 2020
(This article belongs to the Special Issue Optical Methods for Tissue Diagnostics)

Abstract

:

Featured Application

We developed an optical fiber-array sensor to monitor the depth of frozen skin tissue during freezing–thawing cycles in cryosurgery.

Abstract

Cryosurgery/cryotherapy is a widely used, freezing–thawing technique for the renewal or destruction of pathological tissues by applying localized rapid cooling; however, it still relies on the subjective “expert knowledge” of the physicians without, up to now, real-time monitoring of the treatment. This work focused on assessing the depth of freezing using optical transmission and backscattering measurements from frozen/unfrozen porcine ex-vivo skin samples. An optical fiber-array sensor was subsequently developed to determine the depth of freezing and the associated kill zone during freeze–thawing cycles with sub-millimeter accuracy within the skin tissue.

1. Introduction

Cryosurgery/cryotherapy is the medical application of controlled localized freezing to renew, remove or destroy pathological tissues [1]. It is achieved by local rapid cooling to extremely low temperatures, typically by liquid nitrogen injection or a cold “finger”, followed by a relatively slower thawing process. Tissue injury from a freeze–thaw procedure can broadly be attributed to three sequential, though overlapping, mechanisms: (a) an initial physical phase, where cell necrosis results directly from the exposure of the tissue to low temperature; the resulting intracellular micro-crystals and micro-bubbles as well as osmotic processes during thawing destroy the cell structures [2]; (b) a vascular phase, where tissue damage occurs from blood supply alterations [3]; and (c) an immunologic-inflammatory phase, where inflammatory processes are triggered by the cryo-injury and persist for a couple of weeks. The latter mechanism is suggested to be particularly important in tumor therapy [4].
After a cryosurgery session, the treated tissue will alter progressively over time due to the aforementioned mechanisms. It is therefore crucial to monitor, in real-time, the expansion and depth of the “ice-ball”, ideally by measuring physical state changes and/or dynamic temperature gradients (isotherms) of the tissue. To date, there is no easy real-time monitoring of the cooling process neither can the precise depth of the isotherms be routinely determined in vivo. Thus, clinical cryosurgery relies on the “expert knowledge” of the physicians. So far, monitoring techniques that are only used in experimental or in clinical trials, include direct temperature measurements utilizing infrared thermography [5] and single or multiple needle-mounted fiber Bragg gratings or thermocouples, inserted at appropriate tissue sites to measure local temperatures [6,7]. Ultrasound shadowing has also been employed [8]. Finally, imaging techniques such as optical coherent tomography (OCT), [9] vibroacoustography, [10] electrical impedance tomography [11], and magnetic resonance imaging (MRI) [8,12,13] have also been reported. In particular, OCT [9] is a well establish interferometric method that has been used experimentally in similar studies. However, in a recent clinical study Themstrup et al. [14] reported that in normal ex vivo skin and in skin lesions in vivo, the opaque ice ball induced by cryo-therapy treatment does not allow the determination of tissue freezing depth by OCT. Other remote optical imaging techniques such as camera or high-resolution multispectral imaging [15,16] may also be considered but could be handicapped by ambient light variations and the formation of frozen due during and immediately after cryogen applications, which obscures the treated area, thus impairing data collection in the initial stages of the treatment. In general, there are several disadvantages when using the above techniques: (a) in vivo skin remains frozen for a very short time making difficult to collect and process relevant data; (b) the contact instruments can’t be used due to thermal interference in cryo-therapy; (c) some methods rely on high cost instrumentation, which renders them impractical for routine cryosurgery. Here, we demonstrate a technique based on fiber optic-array geometry that exploits the differential optical backscattering and diffusion properties of frozen–unfrozen ex vivo porcine tissues to monitor the topology and depth of the frozen region in real time.

2. Background of Measurement Technique

During rapid freezing with liquid nitrogen, the water-rich living tissues change color and become pale white for a short time after the end of the cryogen application. This characteristic tissue “bleaching” is partly attributed to a transient blood vessels constriction and the subsequent reduction of the local blood content [3] and partly to the ice crystal and micro-babbles in the tissues. Work by Kletetschka et al. [17] showed that depending on the cell structures, which act as nucleation centers, the super-cooled inter-cellular fluids freeze instantaneously forming small crystalline structures. Furthermore, under these conditions of rapid freezing, dissolved gasses inside the cell cannot escape from solution, becoming trapped in the ice forming microscopic bubbles [18,19]. The dimensions of these micro-bubbles are similar or smaller than the wavelength of visible light and act as scattering centers. Depending on the size of the cell structures, Mie [20] or Rayleigh scattering dominate the optical diffusion processes in the tissues [21] and may also contribute to the characteristic white appearance of frozen tissues when illuminated with white light.
Our method exploits fiber optics parameters, such as spectral transmission, acceptance angle (numerical aperture, NA) small size, and low thermal mass to measure the local intensity variations due to changes in the effective scattering coefficient of frozen and unfrozen ex vivo tissue. Consequently, the dimension of the “ice ball” is determined by calibrating the optical transmission and diffusion in very small areas of normal and frozen skin tissues. The experiments are presented in two parts; the first focuses on the calibration procedure of the optical diffusion process using fiber optics in contact and embedded in a small thin section of porcine tissue. In the second part, a fiber-optic array sensor was developed and used ex vivo on cadaver porcine skin (pigskin) tissue samples (PS), undergoing freezing–thawing cycles, to measure the backscattered optical intensity distributions from near body temperatures skin tissue, and determine the depth of freezing.

3. Experimental Setup

3.1. Optical Transmission and Backscattering Setup

When in vivo tissue is subjected to rapid freezing, the intravascular fluids with its high-water content, form micro-crystals and micro-bubbles, giving a characteristic white appearance when illuminated with white light, attributed primarily to Mie scattering from the frozen microstructures in the tissue volume. Furthermore, in living tissue some transient alterations, such as blistering and inflammation persist, due to the processes described earlier. There is a similar “whitening” in ex vivo porcine tissue subjected to freeze thaw cycles, reverting to its original color after thawing without any visible degradation to its structure, making it ideal for our experimental work.
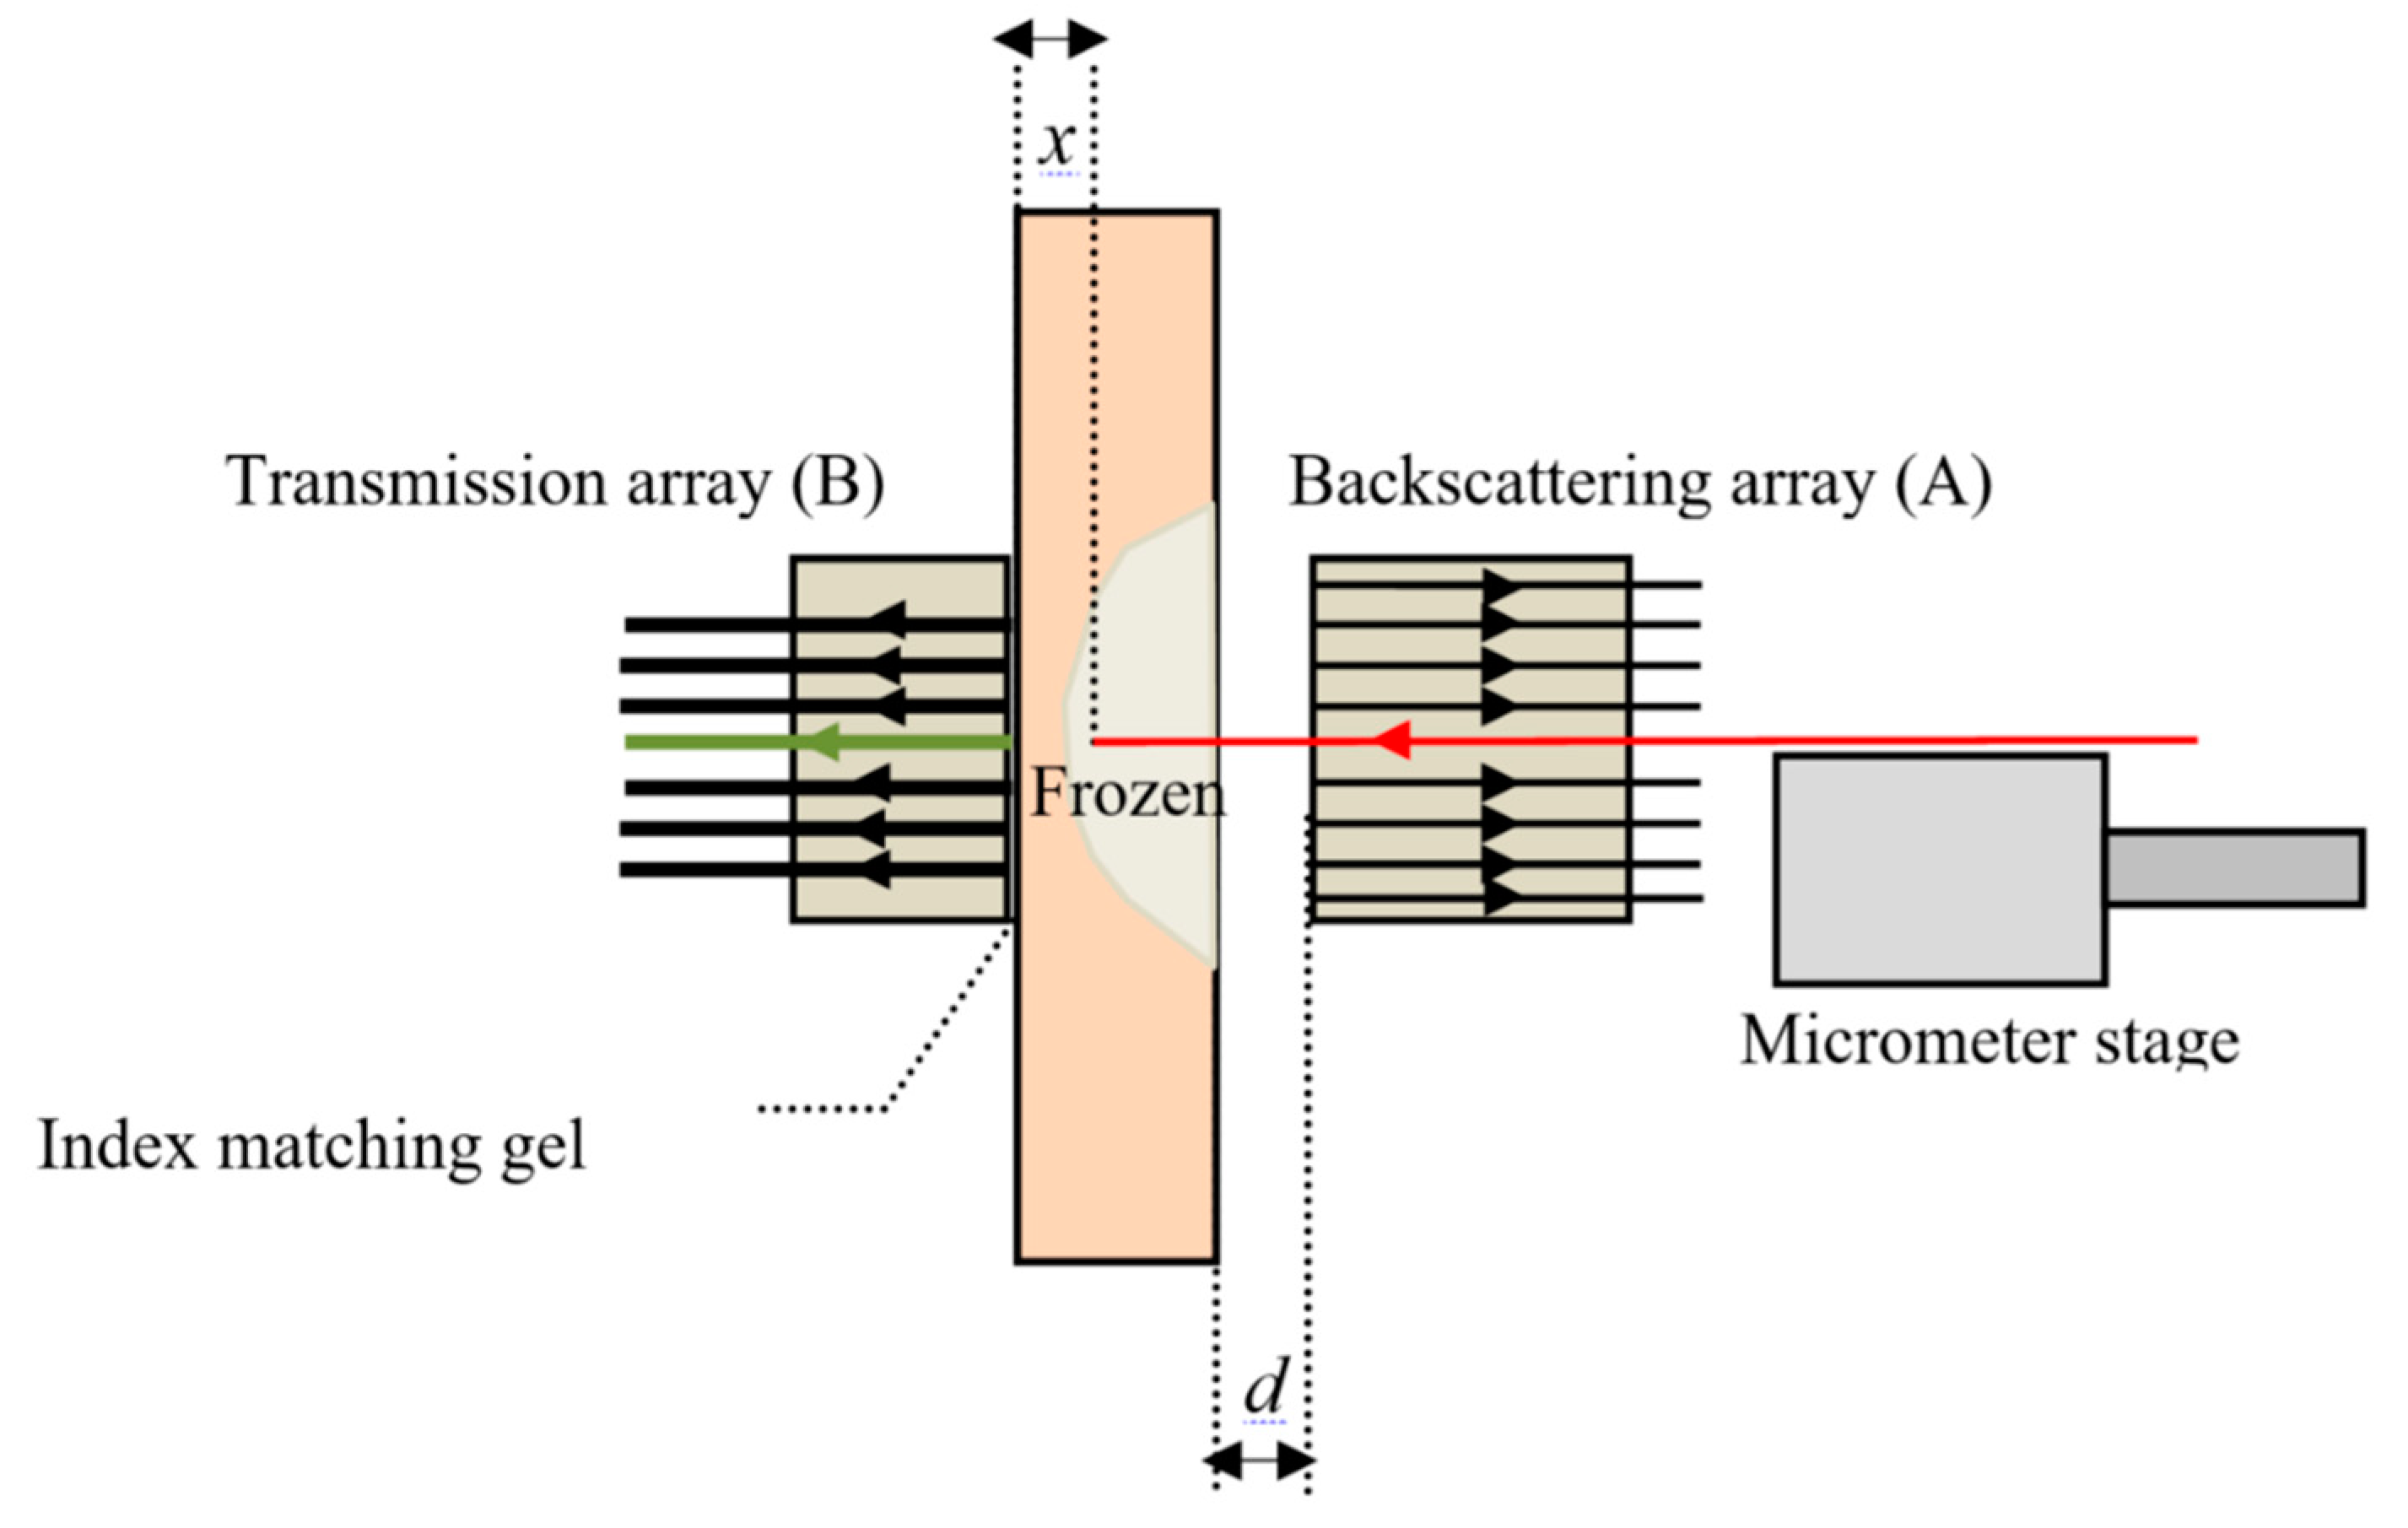
If ex vivo skin tissue is illuminated with a monochromatic light source, it will partially transmit, reflect and scatter light from its surface and volume. When tissue is rapidly frozen with the application of liquid nitrogen cryogen, the ratio of the light that is transmitted, reflected and scattered can be measured to determine its temporal and spatial characteristics. For a freezing/thawing cycle, cryogen was applied on side A for several seconds until the temperature of side B reached a temperature around −65 °C to −70 °C; the frozen region had a diameter of about 25 to 30 mm. Subsequently the tissue thawed, while taking measurements of the optical signals from both arrays, together with its front and back temperatures. The energy extracted from the tissue, determined by the weight of liquid nitrogen spent and the latent heat of evaporation. Both fiber-arrays were on the same horizontal plane with the central illumination and central detection fiber (T4) in array-B aligned, thus measuring the transmitted light through thickness x mm of tissue, as shown in Figure 1. Additionally, in order to eliminate transmission losses emanating from surface frozen dew, which appeared during freezing cycles, array-B was set in contact with the skin and index-matching gel (IMG) bridged the small surface anomalies between the skin and the array (Figure 1).
During the calibration stage, local transmitted and backscattered intensities, during a freezing/thawing cycle, were measured using a thin cross-section ex vivo porcine skin sample while they were correlated to the corresponding freezing depth using a procedure outlined below.
The experimental set up is shown schematically in Figure 1, with a 3 mm thick porcine skin, mounted vertically in a frame, which allowed access from both sides. An optical fiber array with eight detection fibers, (array-A), and a central illumination fiber (source fiber), was positioned in front of tissue surface, to measure backscattered light from the tissue volume. The illumination fiber was mounted on micrometer stage and could be moved freely inside the tissue volume along a small hole of comparable dimensions, emitting at wavelengths of 650 nm. Fiber arrays-A, used multimode fiber (MMF) with core/cladding diameters of 240/250 μm, with an NA of 0.37 and inter fiber separation was about 1 mm. A second fiber-array-B, with seven fibers, was placed on the back of the tissue and measured the transmitted light, as shown in Figure 1. This array had core/cladding diameters of 450 and 500 μm, respectively, with an NA of 0.43 and inter-fiber separation of 2 mm. A multichannel detector measured the optical signals from each of the fiber in the two arrays and thermocouples indicated the temperature on the tissue’s front and back surfaces. It worth noting that the low NA of the optical fibers, limit the illumination and “viewing” volume in the tissue as only light within the small acceptance cone can be detected, thus enchasing the resolution of the optical diffusion measurements in both fiber arrays.
The calibration procedure detected the optical diffusion and the maximum detection depth in the frozen/unfrozen tissue by measuring the variation in transmitted and backscattered intensities, for different embedded depths x in the tissue, which ranged from 0 to 3 mm of the illumination fiber. Thus, for the transmission measurements the moving illumination fiber in array-A, was carefully aligned with the central detection fiber (T4) in array-B. Similarly, for backscattering measurements the central and peripheral fibers in the fiber arrays-A were used to measure the optical diffusion in the tissue for different depths x of the illumination fiber. Therefore, with the source-fiber fully embedded in the tissue, and in near contact with the central fiber (fiber T4) of array 2, the tissue was subjected to freeze/thaw cycle. Data acquisition was initiated for ten seconds prior to cryogen application, so the transmitted and backscattered optical intensities for room temperature could be recorded. Liquid nitrogen was subsequently applied on side-A for about 20 s, reaching a surface temperature measured on side-A and side-B about −100 °C and −65 °C respectively. Subsequently, the source fiber was retrieved is steps of 100 μm and the process was repeated until the illumination fiber reached the surface of the PS. Using this calibration procedure, the optical data from the two arrays, could be used to correlate the transmission, and backscattering intensities and hence the depth of the frozen tissue. It should be noted that in real life experiments, transmission measurements cannot be obtained, and these calibration results assisted in developing a procedure based on backscattering intensities solely from array-A to determine the depth of freezing as will be outlined below.

3.2. Measurements of Frozen Depth Porcine Skin Tissue Using Backscattering Fiber Optic Sensor Array-A

In order to determine the depth of freezing in tissues, a nine fiber-array sensor was used, similar to the one described above, with MM fibers having NA of 0.37, arranged at ~2 mm pitch and a central source-fiber, coupling light from laser diodes (LD) at wavelengths of 650 nm and 405 nm and an output optical power of 3–4 mW.
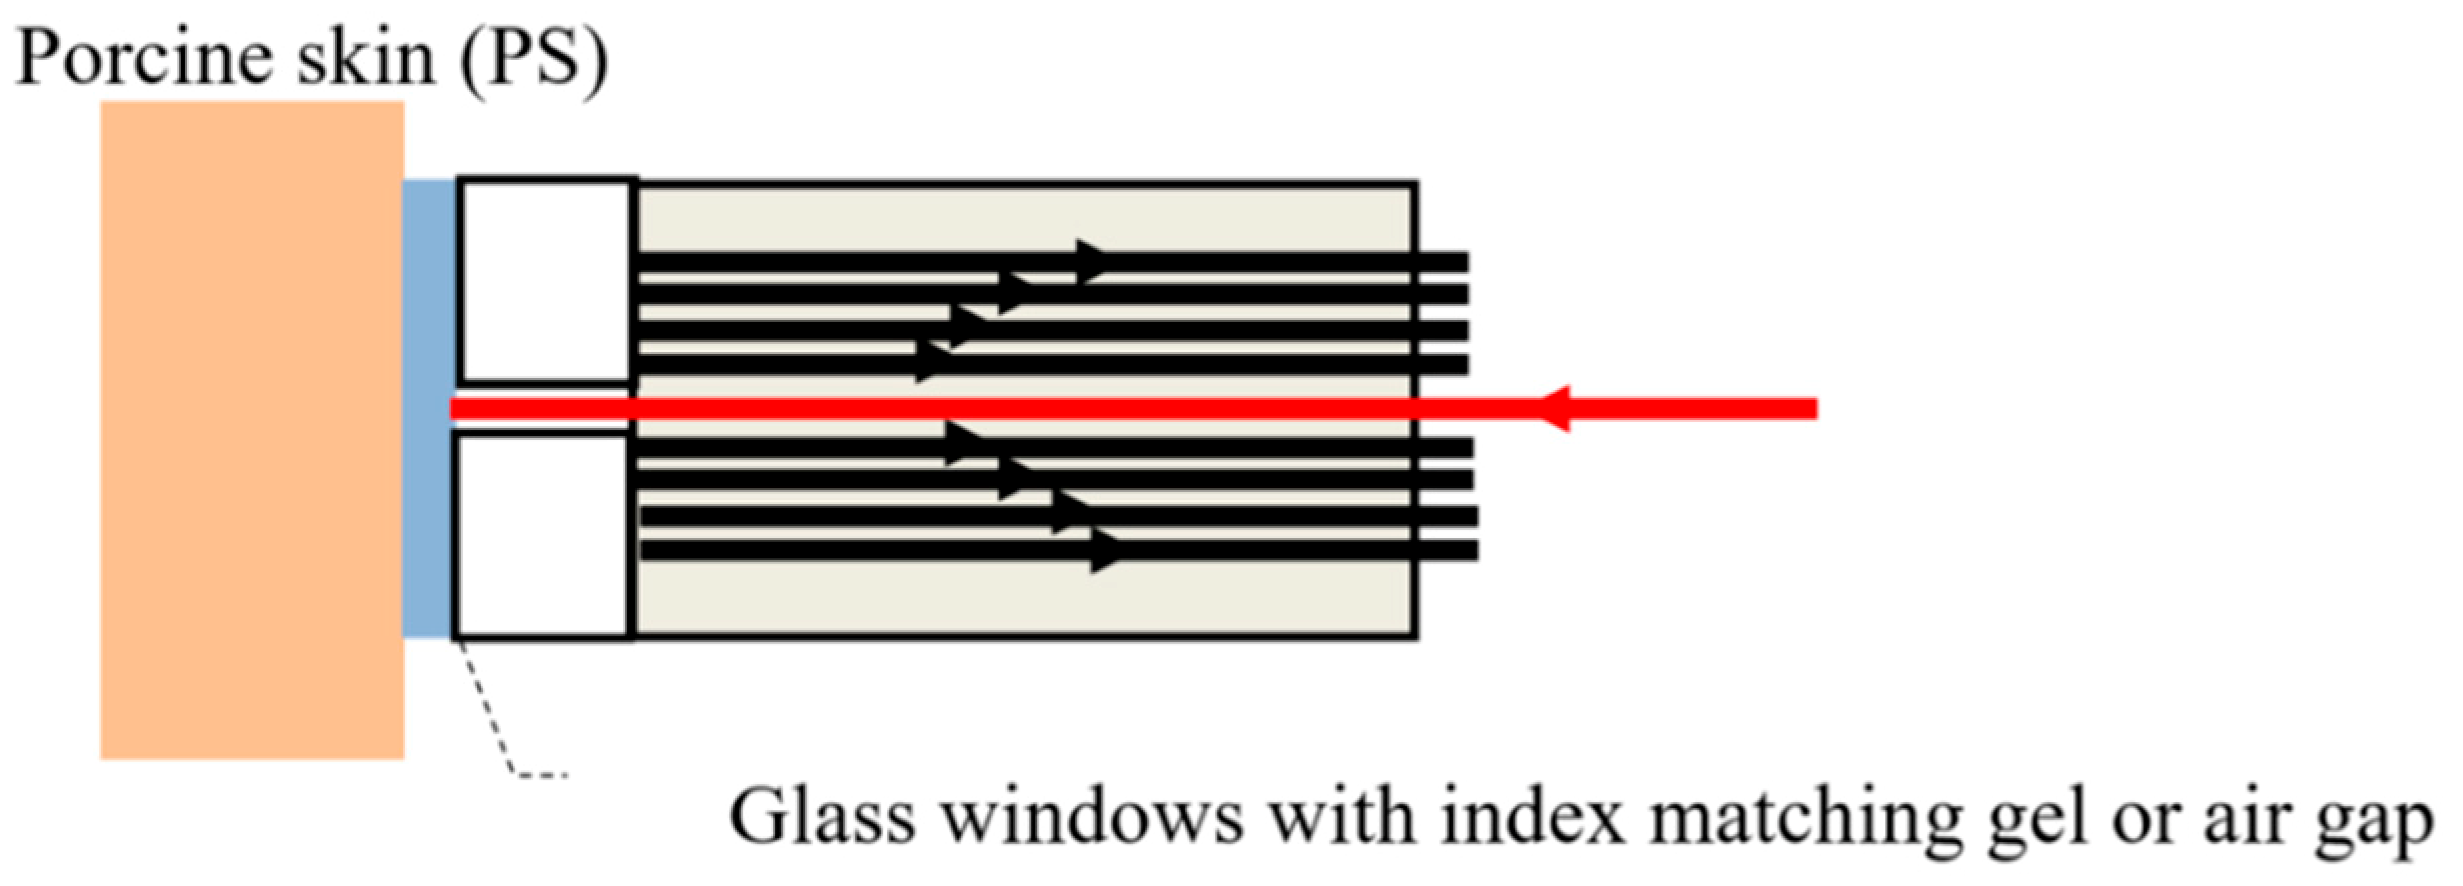
The axis of the array was set horizontally with a separation distance d from the surface of the PS (Figure 2).
The signal fibers transmitted the light to eight photodetectors connected to the data acquisition system. To optimize the illumination and detection area, the PS-sensor separation d was altered from 0 to 3 mm using either glass windows of various thicknesses, glued to the fiber array or an air gap as shown in Figure 2. Furthermore, the effect on the measurements by surface freezing dew, formed on the cold surfaces of the PS, was also investigated by using either IMG on the window of the fiber array, to prevent surface mist, or by eliminating it altogether with isopropanol (IPA) applied prior to data acquisition. The depth of freezing was determined from the variation in the backscattered optical intensities measured during thawing correlated with the transmission data from the calibrations process and will be discussed in the following section. To simulate constant body temperatures conditions, some tissue samples were mounted on a heated substrate using the same experimental protocol.

4. Results and Discussions

4.1. Depth and Temperature Calibrations of Samples

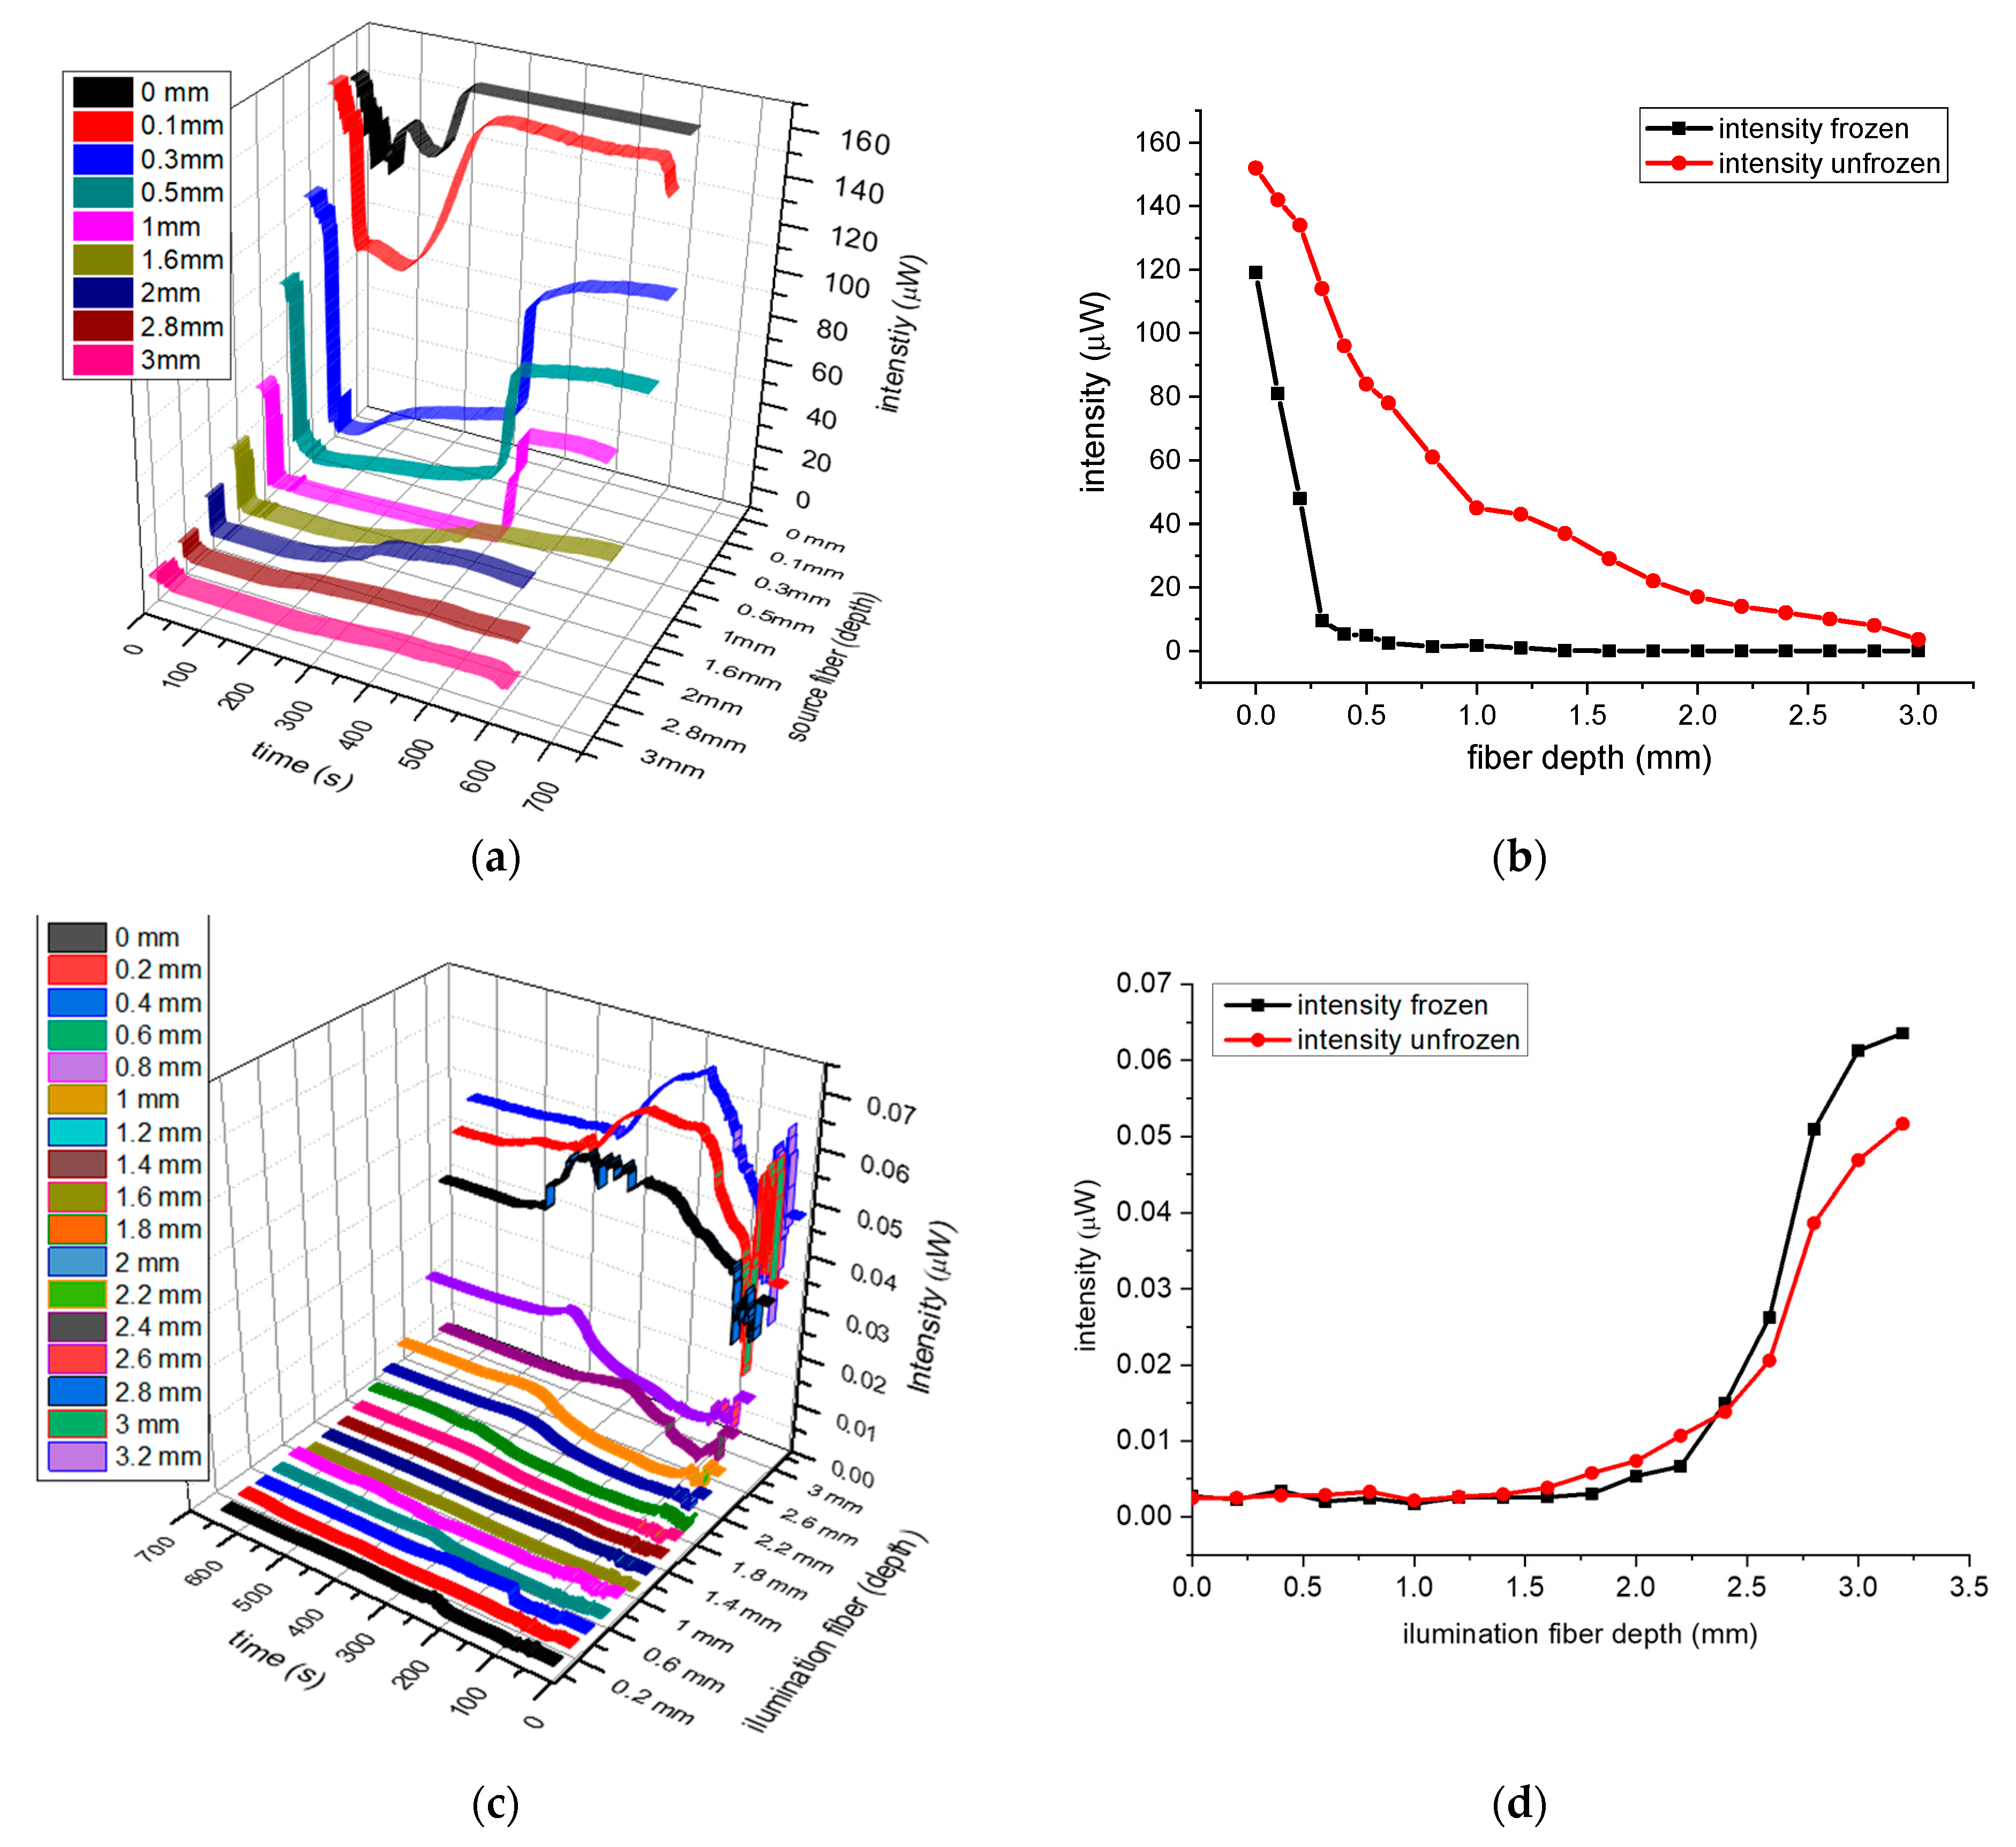
The calibration procedure, described previously, correlates backscattered and transmitted light detected by fiber arrays A and B for different skin depths of the illumination fiber. Initially the illumination fiber was in contact with detection fiber (T4 in array-B), i.e., to a distance of x = 0. The tissue was frozen measuring backscattered and transmitted intensities from arrays-A and -B. When the tissue thawed, the illumination fiber was retracted in steps by 0.1 to 0.2 mm, and the process was repeated until the fiber reached the surface of the tissue. Typical results for successive freeze/thaw cycles of a 3.0 mm thick tissue sample are shown in Figure 3a,c, with the transmitted signals from fiber-T4 in array-B and BS4 in array-A, are plotted as a function of time (timeline) for different tissue depths.
Generally, the traces in Figure 3a exhibiting an initial rapid reduction in intensity, due to the ice formation in the tissue which reduce the transmitted light, followed by a near constant low transmission, which is dependent on the skin separation x, between the two fibers. Thawing takes several minutes, with tissue gradually returning from pale white to its original color, and the transmitted intensity gradually returns to its initial value. The transmitted intensities as a function of skin thicknesses x for frozen and unfrozen tissue are plotted in Figure 3b, with the red trace being that of the unfrozen skin, while the black trace is for the frozen one. Based on the results in Figure 3b, it can be seen that light diffused much further in unfrozen tissue (red trace) in contrast to the optical diffusion in frozen tissue, which was greatly reduced reaching near zero when the depth was about 1.4 mm to 1.5 mm (black trace). Similarly, the graphs in Figure 3c show the backscattering timelines for the different depths x. Figure 3d shows the backscattered intensities for frozen (black) and unfrozen tissue (red) as a function of distances x. Here, the variation in intensities was reciprocal to those of transmitted signals, which is to be expected as light cannot be transmitted through frozen tissue, and therefore is backscattered.
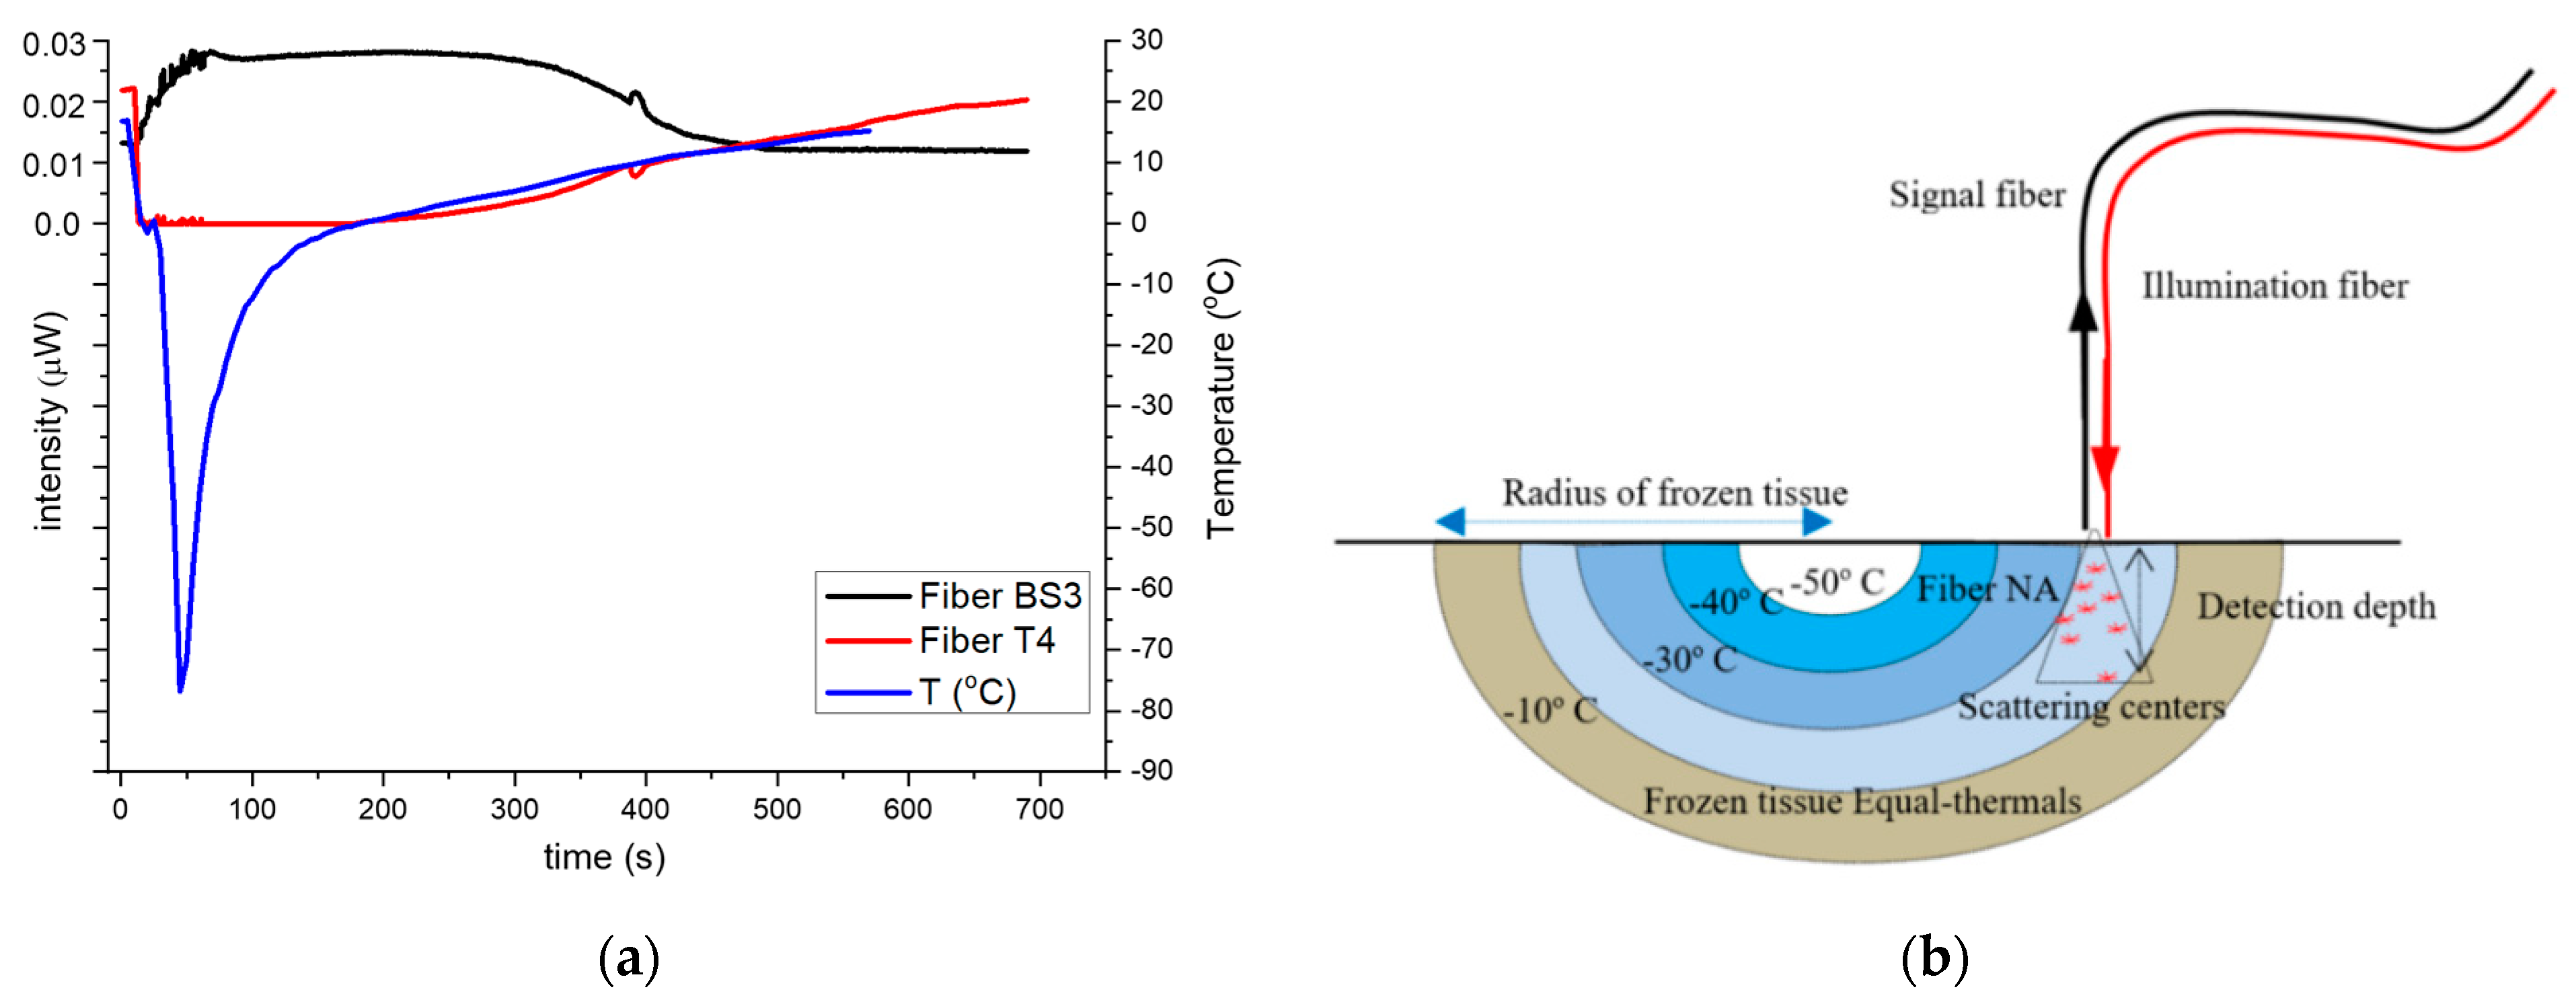
When the illumination fiber is fully retracted, x = 3.0 mm and in contact with the skin surface, the timeline for transmitted, backscattered intensities and temperature variation for a freeze/thaw cycle is shown in Figure 4a. When cryogen is applied, the temperature drops rapidly to about −80 °C followed by a rapid increase up to 0 °C, increasing slowly (around 0.05 deg/s) thereafter which attributed to the latent heat of freezing of the frozen tissue (blue trace Figure 4a). The backscattered intensity variations, (in black), can be roughly divided in three regions related to the temperatures of the tissue, ignoring the first 100 s where temperature equalization happens. It is high and nearly constant when the tissue is frozen in the temperature range of −70 °C to −3 °C (100–300 s), lower and constant for the unfrozen in the 5 °C to 20 °C temperature range (450–700 s) and finally, in the region of −2 °C to 3 °C, the optical signals exhibit a progressive drop (300–450 s).
Conversely, the transmitted timeline signal (red trace) is, as expected, the reciprocal of the backscattered signal. This is attributed to the shrinking ice-hemisphere “ice ball” under the fiber sensor, as shown schematically in Figure 4b, which leads to a corresponding gradual reduction in scattering. In other words, the reducing frozen volume under the detection cone (NA) of the fiber array due to the shrinking ice-hemisphere emulates a progressive reduction in the frozen tissue thickness. During thawing, both signals remain constant, as the maximum detectible optical transmission in frozen tissue is about 1.5 mm (based on the transmission calibration procedure, Section 4.1), as light emanating from lower depths cannot be detected. Therefore, irrespective of the frozen skin depth, the backscattered signal that can be detected by array-A, comes from a maximum depth of 1.5 mm or less, while for the same reason the transmitted signal remains low until the frozen tissue also retreats to 1.5 mm or less.
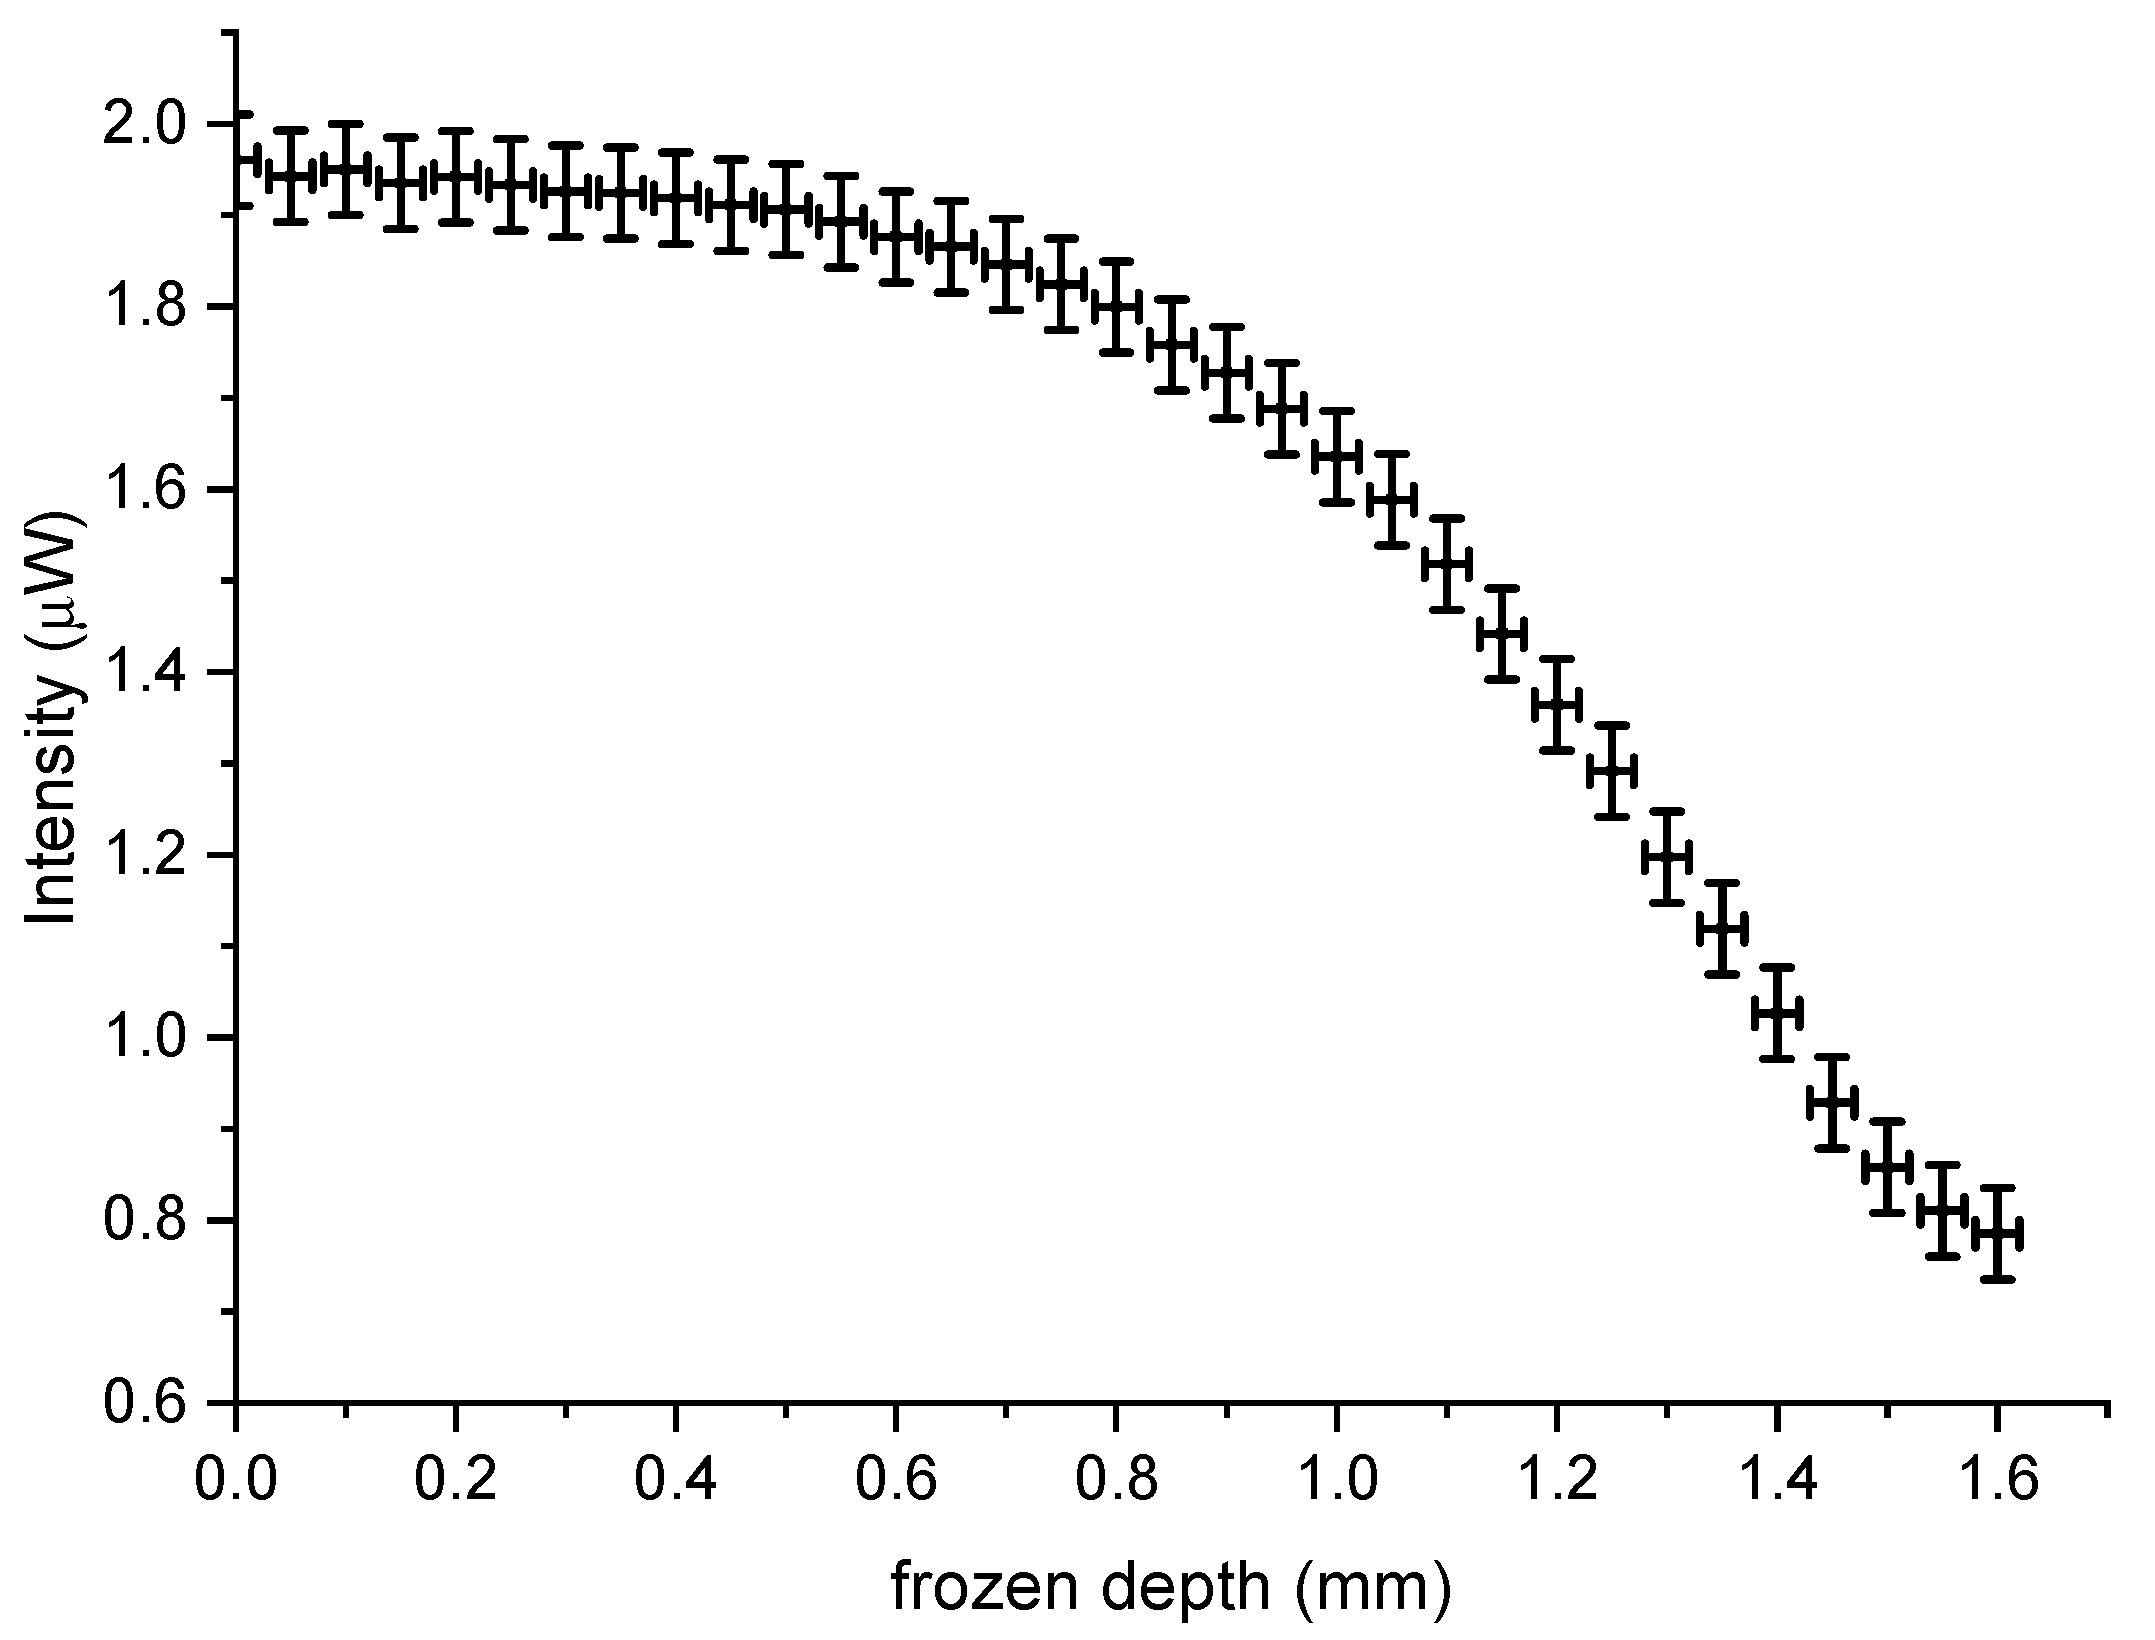
Hence, the freezing depth can be determined as a function of backscattering intensity and used to measure primarily the thawing process for a maximum 1.5 mm to 0 mm (tissue surface) with an accuracy of about ±0.1 mm, which was based on the transmission calibration (Section 4.1) and are shown in Figure 5. The detectable depth of freezing is thus dependent on the optical diffusion in frozen and unfrozen tissue and the sensitivity of the data acquisition system.

4.2. Measurement of the Frozen Skin Thickness Based on Backscattering Intensity Variations

In living tissue there is only access to the skin’s surface; therefore, only backscattered signals can be used for determining the frozen depth and the sensor architecture includes fiber array-A only. For these experiments, the sensor head, shown in Figure 2, was positioned in contact with the skin’s surface. The signal fibers were placed behind a 2 mm window, while the illumination fiber was level with the front facet. To eliminate frozen dew, the fiber array was placed in contact with the tissue, and IPA was applied prior to data acquisition to minimize surface backscattering. Based on these results and the calibration procedure described previously (Figure 4b), the depth of thawing could be measured from the backscattering signal, from a maximum depth of 1.5 mm up to the surface of the skin.
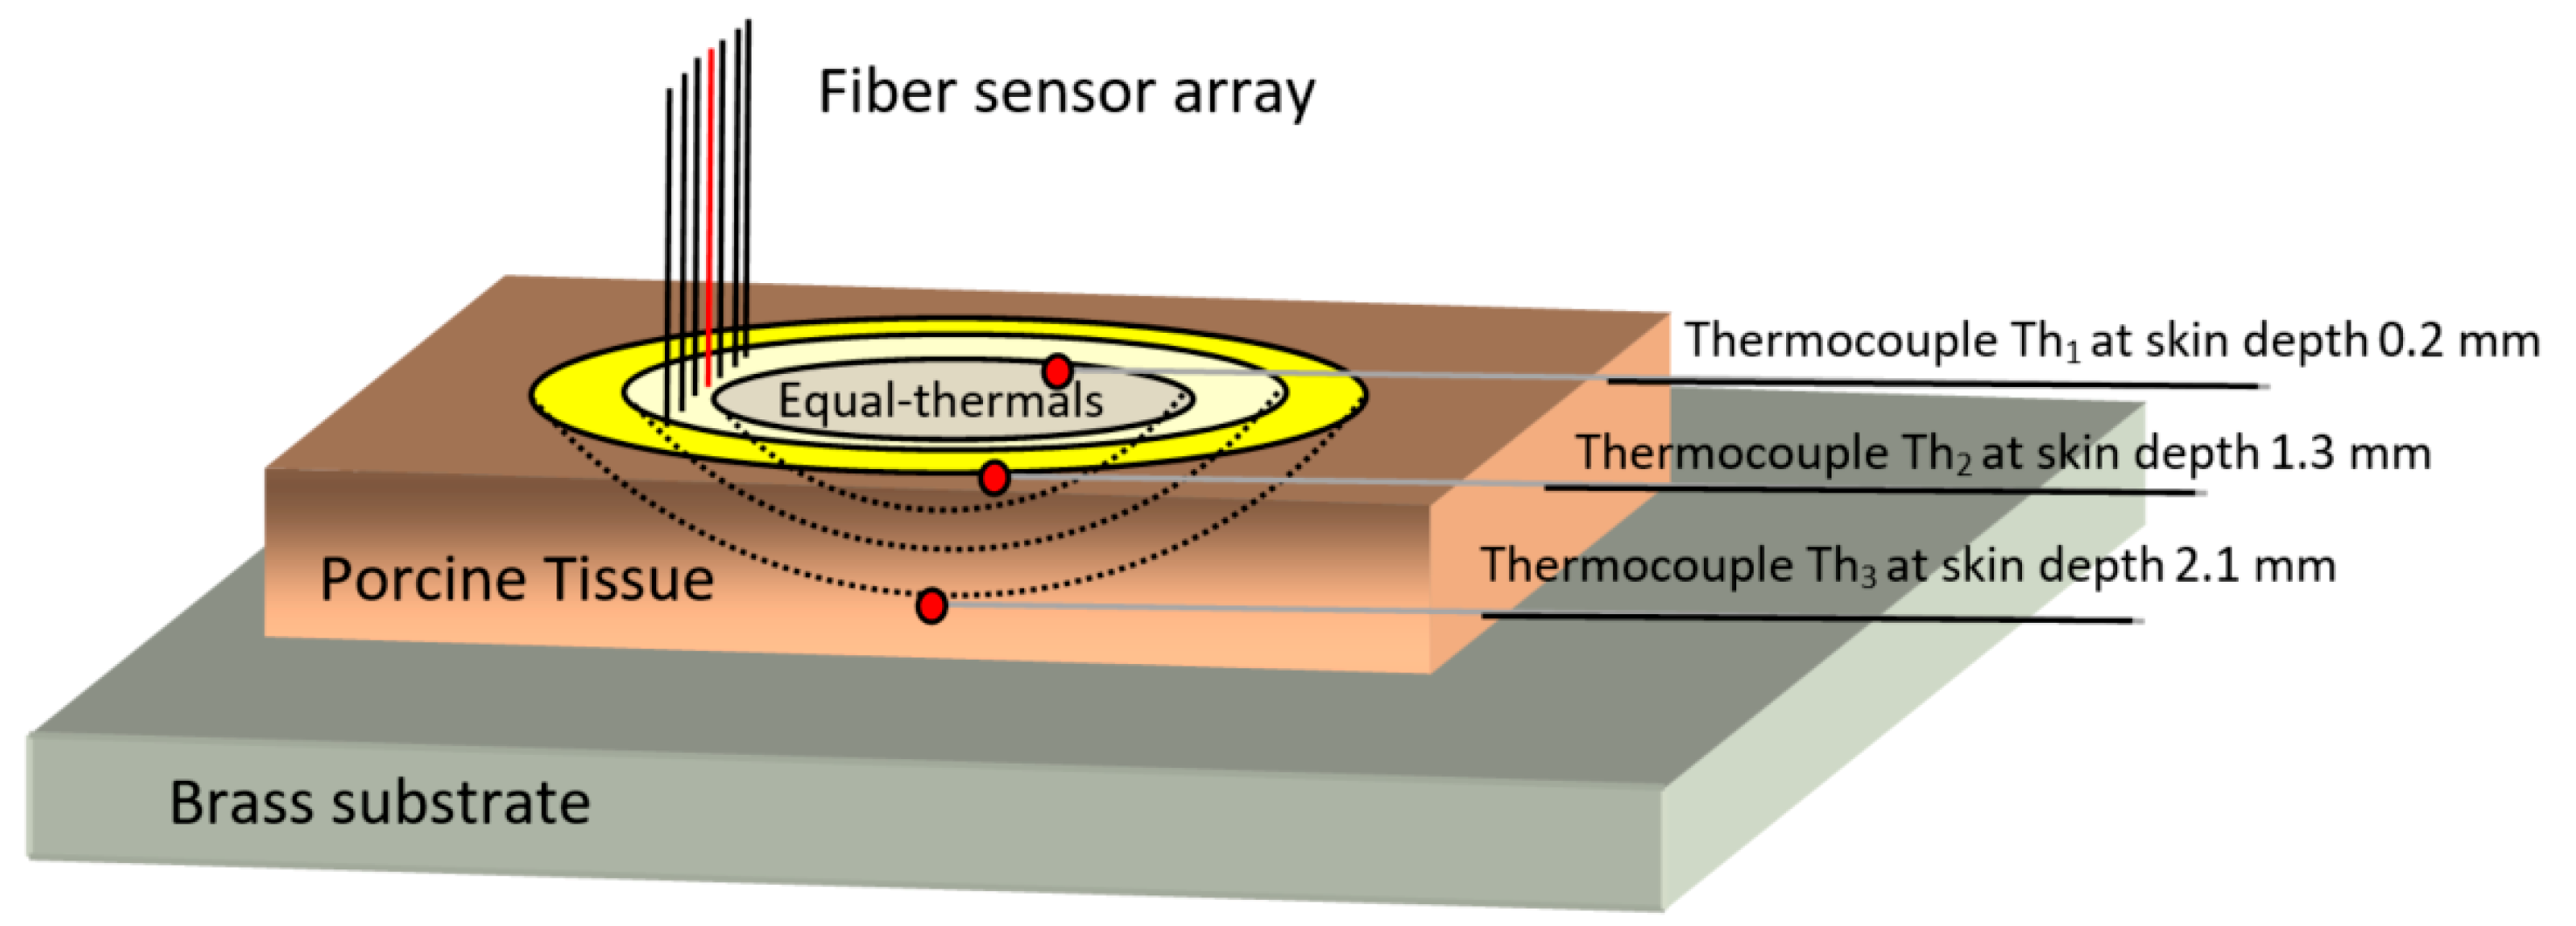
To further study the thawing process, the tissue was mounted in contact with a brass substrate, maintained at a constant 34 °C as shown schematically in Figure 6. Porcine ex vivo skin tissue samples, consisting of the epidermis/dermis and a thin subcutaneous fatty layer, approximately 3 mm thick, were cut in sections of 5 × 4 cm. Three modified thermocouples (0.3 mm heads) were embedded at different vertical depths from the skin surface, as measured from the surface by a bespoke needle gauge micrometer, with Th1 at a depth of 0.2 mm, Th2 at 1.3 mm, and Th3 at 2.1 mm being deepest and in close proximity to the brass plate. The lateral separation was 3 mm as shown in Figure 6. The fiber-array axis was vertical and positioned laterally about 2 mm away from the thermocouples, to avoid any optical interference or reflections from the embedded metallic wires.
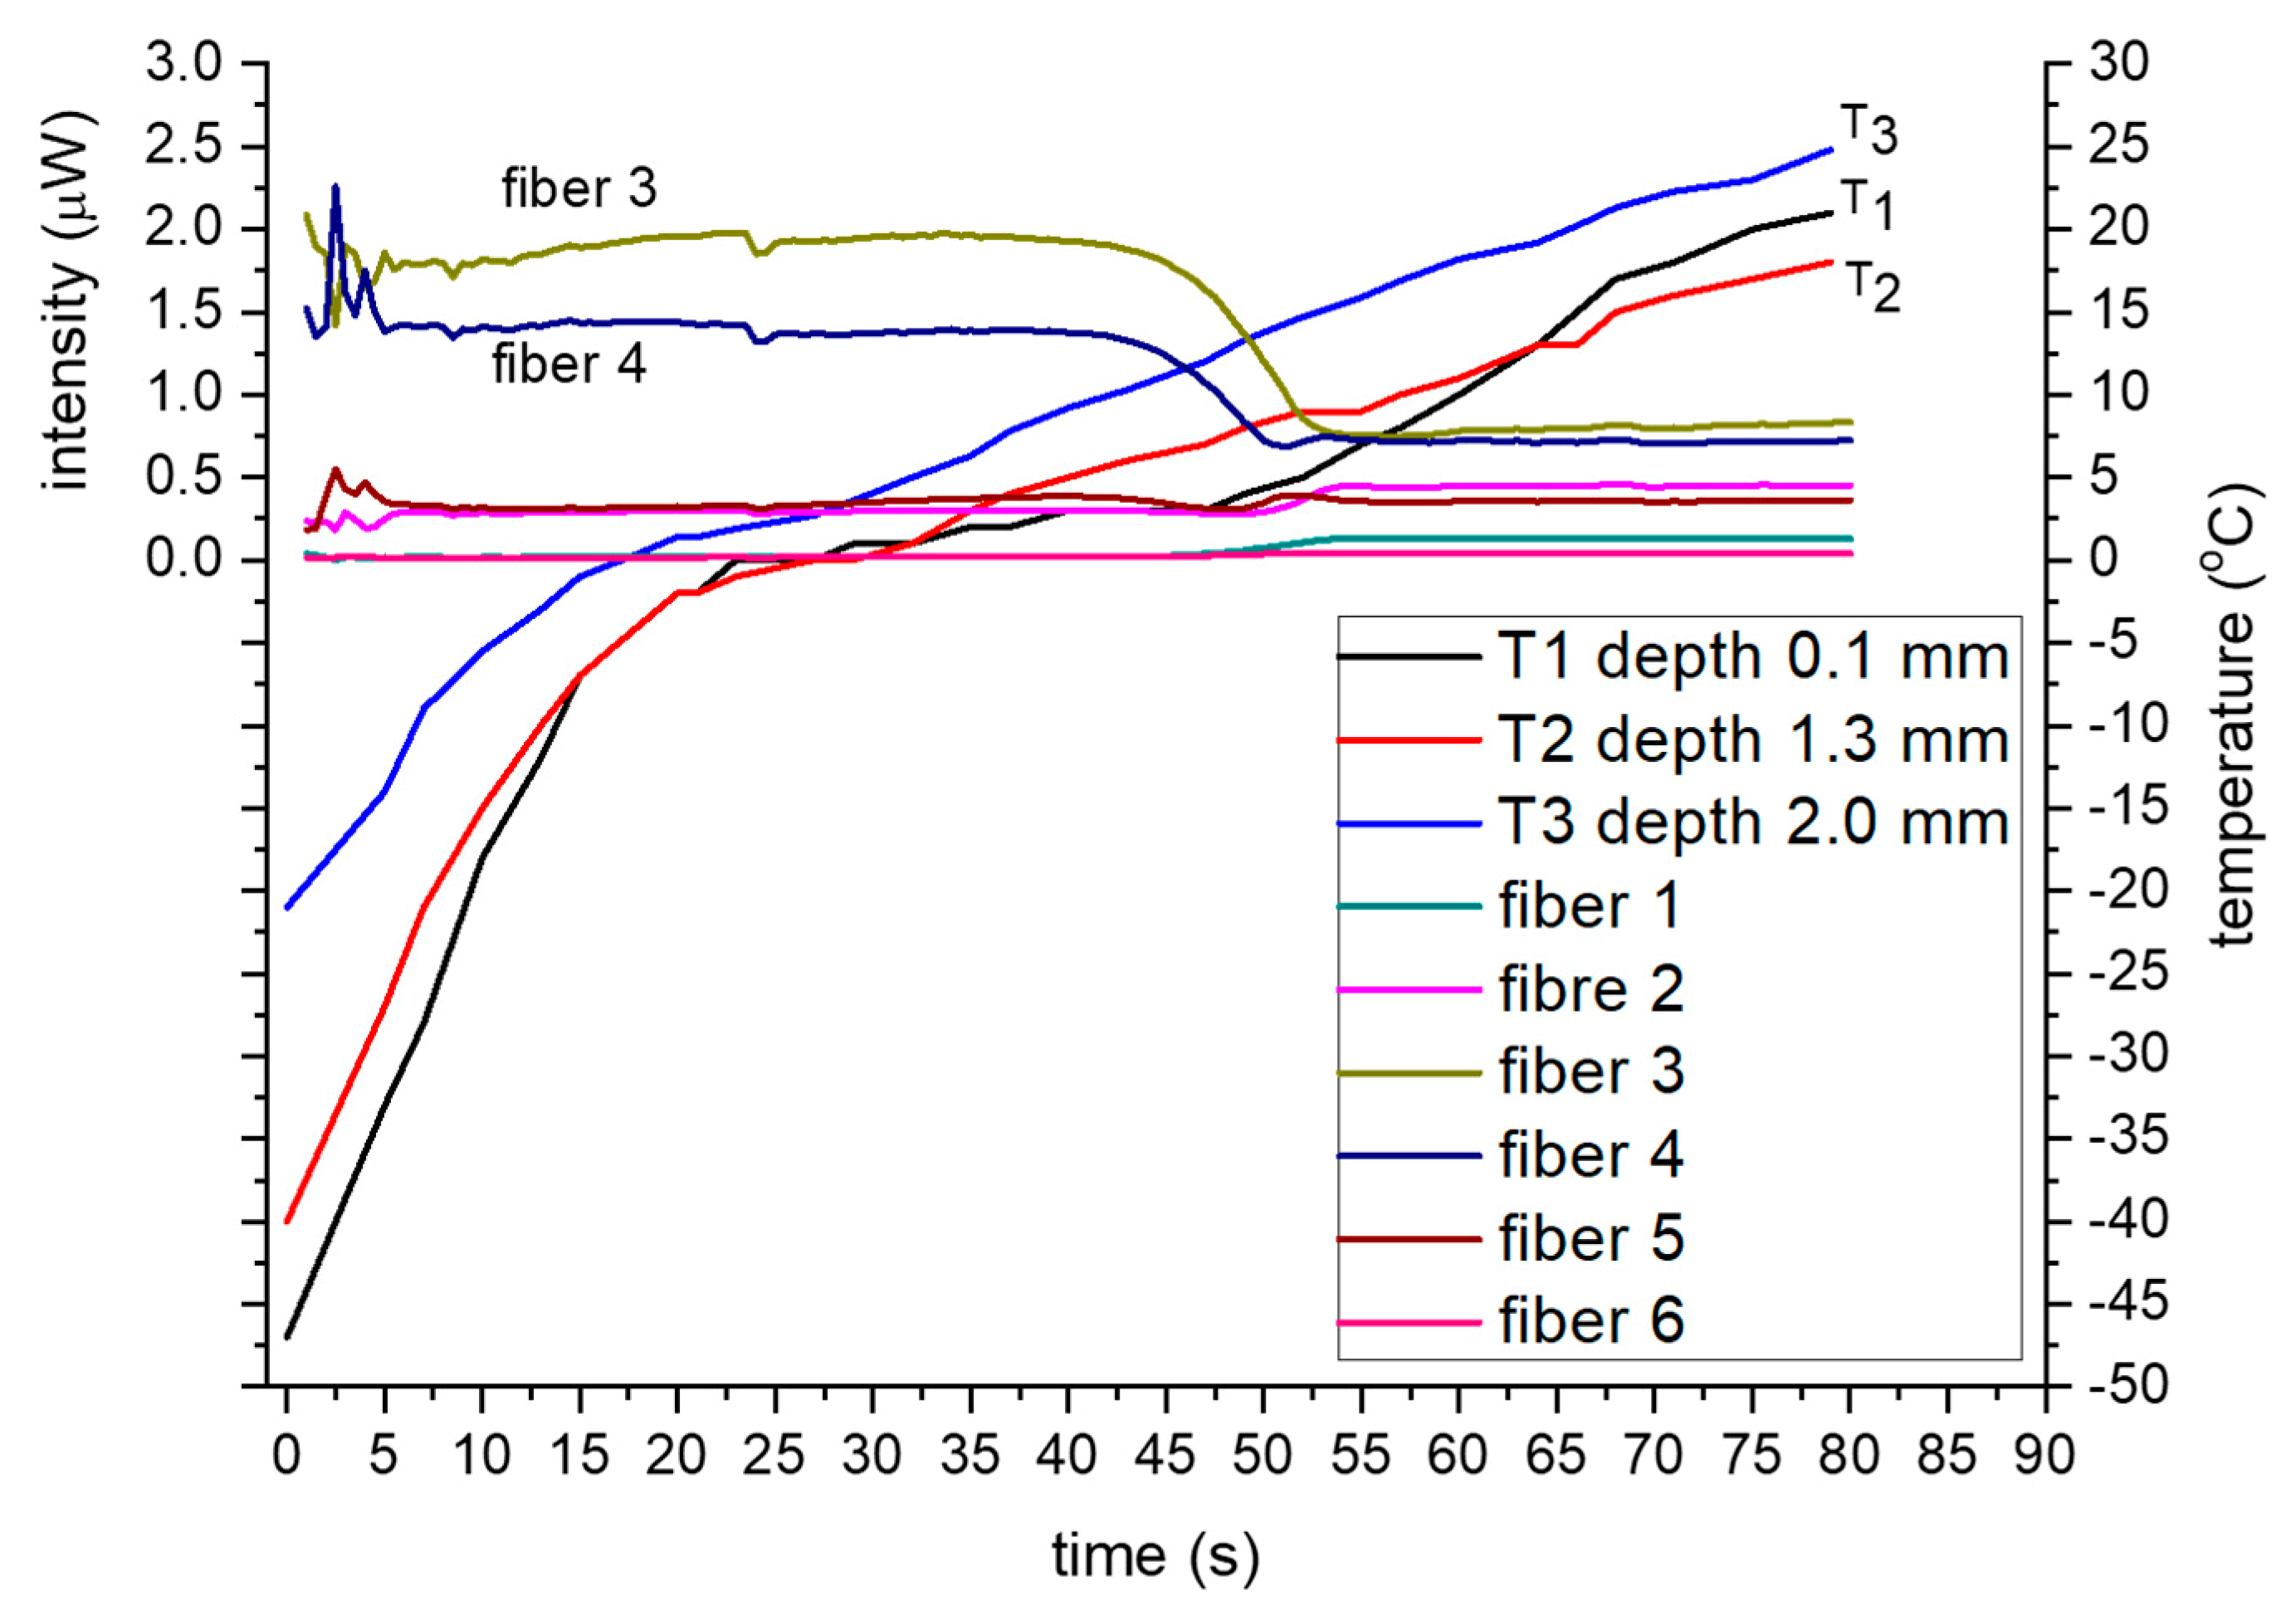
The experimental procedure involved retracting the fiber-array, to allow access of cryogen, and freezing an area of about 2.5 to 3 cm2 of tissue, to about −80 °C. After applying IPA, the fiber array-sensor was re-positioned on the skin surface, and data from the signal-fibers and the embedded thermocouples were obtained. Thawing lasted about 85 to 100 s, with the skin’s surface temperature, as measured by Th1, changing from −80 °C to +10 °C. The process was repeated over ten times in different positions of the skin and different skin sections yielding near identical results. As in the previous experiments, the signals from the inner fibers gave higher intensities, dropping off with time as the sample thaws [10,11]. However, the intensity timelines of the outer signal-fibers displayed decreasing signals as the tissue freezes and increasing as the tissue thaws. This is attributed to increased backscattering, which reduces optical diffusion in frozen tissue with less light reaching the outer fibers.
Figure 7 shows the timelines of the backscattering intensity together with the temperature variations ranging from about −50 °C to +10 °C.
In all experiments, Th1 reached the lowest temperature, which was expected, as it is virtually on the skin surface hence closer to the application point of the cryogen. Similarly, the temperature gradient around 0 °C was low and nearly constant, for all the thermocouples, which is attributed to the latent heat of ice melting, i.e., remained constant until the ice was melted. According to Figure 7, the intensity timelines for the two inner fibers (3,4) are higher and nearly constant when the tissue is frozen, temperature range −50 °C to 0 °C as measured at near surface by T1 (0–25 s), and lower and constant for the unfrozen (5 °C to 20 °C, 55–80 s) temperature range. However, for the near 0 °C region (0 °C to 3 °C, 40–55 s), the optical signals exhibit a distinct and progressive reduction with time, i.e., from the high intensity, associated with frozen tissue, to a low intensity associated with unfrozen.
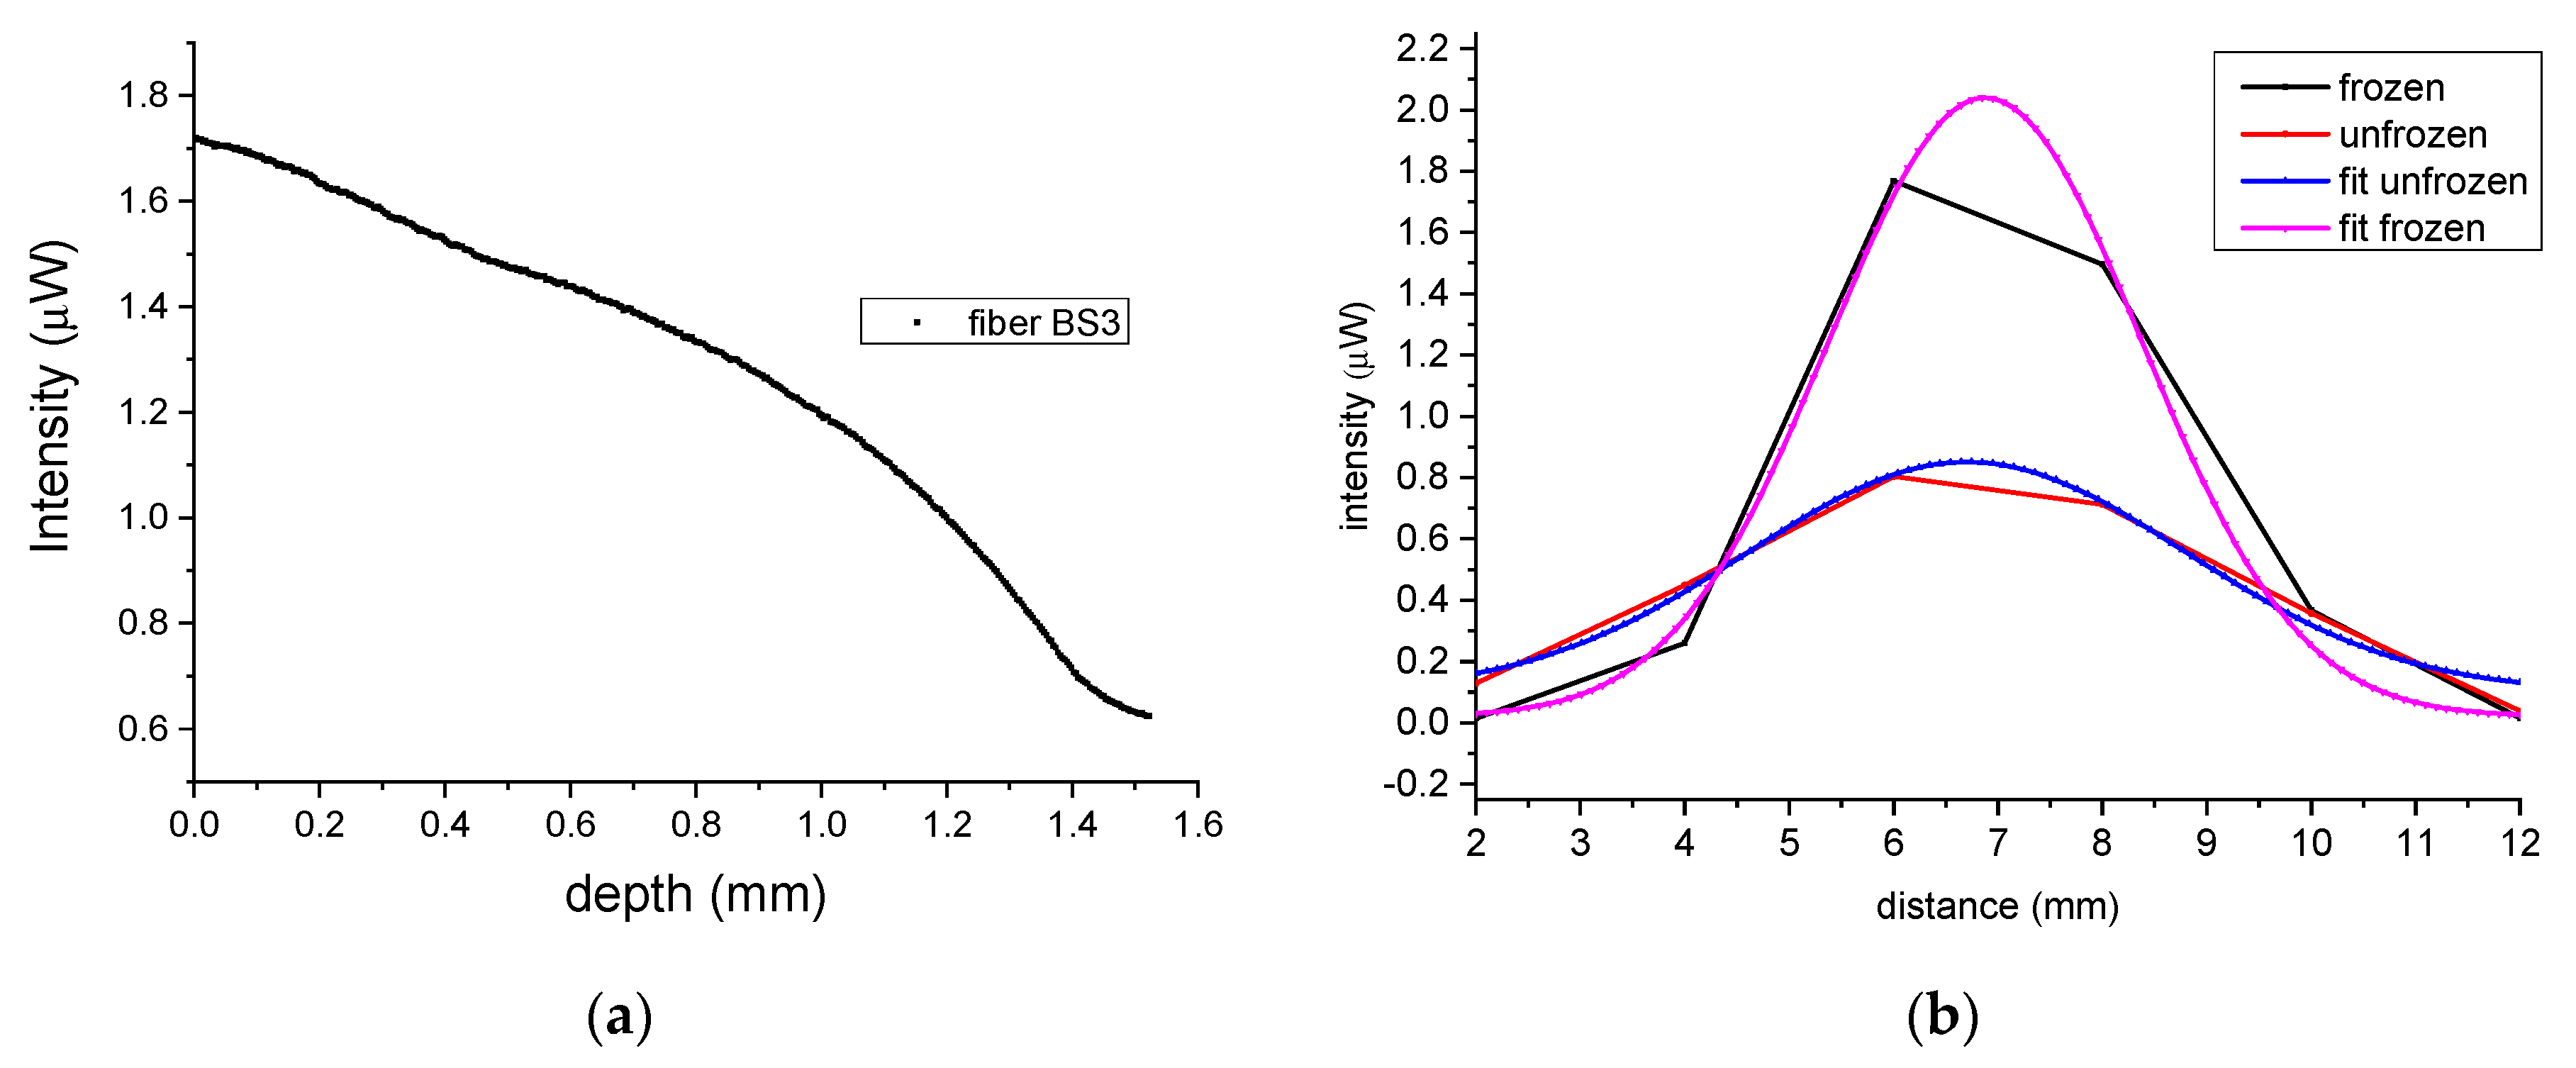
Based on the above results and the calibration of transmission (Figure 3b) and backscattered timelines (Figure 3d), the depth of freezing for the fiber array sensor was determined to be within 1.5 ± 0.2 mm as shown in Figure 8a. This result can be deduced by the correlation of the calibration curve (Figure 5) which defined the maximum depth as 1.5 mm and the equivalent region of 40–45 s in Figure 7 and is also verified in an independent experiment outlined below (Section 4.3). Given that human skin is about 1.5 mm thick, the method can therefore be used to determining the frozen depth during thawing using a similar configuration and methodology as described above.
In addition, the optical diffusion in tissue can also be determined by analyzing the geometry and the intensities timelines of the outer signal fibers during the freeze/thaw cycle. As light backscatters more in frozen tissue, it diffuses less so the outer fibers of the array have lower intensities when the tissue is frozen. In Figure 8b, as the inter-fiber separation is known, the relative intensities are directly related to the optical diffusion via the FWHM measured by the fiber array, which for frozen tissue is 3.5 mm while in unfrozen tissue this extends to nearly 5 mm.

4.3. Verification of Optical Method Using Ultra-Sound Measurements

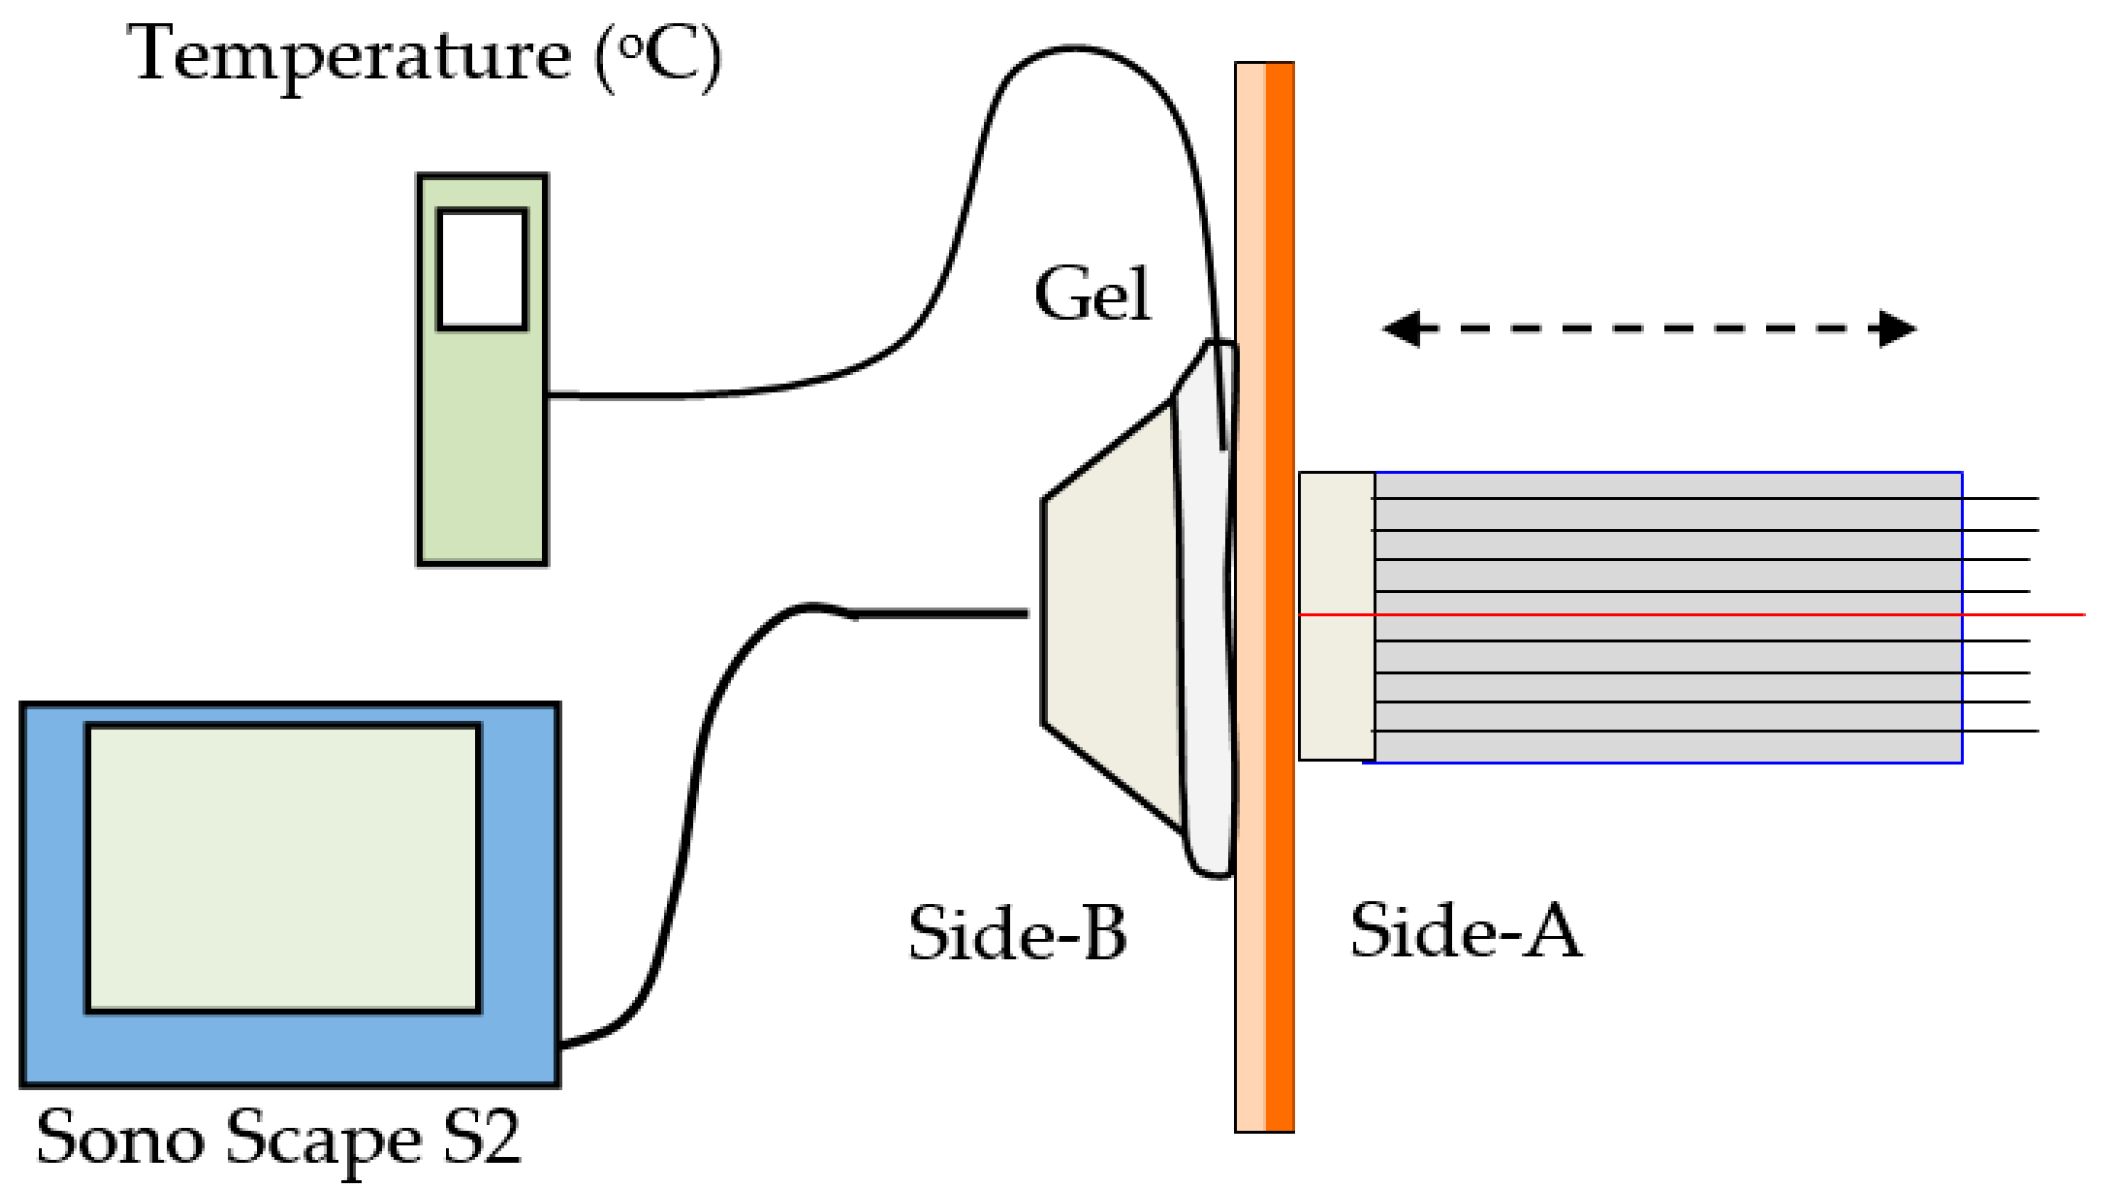
To verify the measurements obtained with the optical backscattering technique an independent measurement was implemented, using a dermatological ultrasound unit in conjunction with the fiber optical sensor. In a similar experimental arrangement, as the one distributed is Section 3, a tissue consisting of the epidermis and a fatty layer with a combined thickness of about 3.1 mm, and held tight on a frame, allowing access from both sides. The fiber array sensor was positioned in contact with the tissue, on side-A, while an ultrasonic sensor (model SonoScape S2, ShenZhen Sonoscape Co. Ltd., Shenzhen, China), was positioned directly opposite on side-B of the tissue, as shown schematically in Figure 9. Coupling gel on side-B, bridged the small gap of the acoustic sensor, transmitting the ultrasound in the tissue. As in the previous experiments, the tissue was frozen by cryogen spray, applied on side-A. During freezing, the fiber sensor was retracted and repositioned on the frozen tissue after the application of IPA which eliminated frozen dew on the surface. The temperature was monitored by a thermocouple, mounted on side-B, in contact with the skin and inside the gel between the tissue and the ultrasound head as shown in Figure 9.
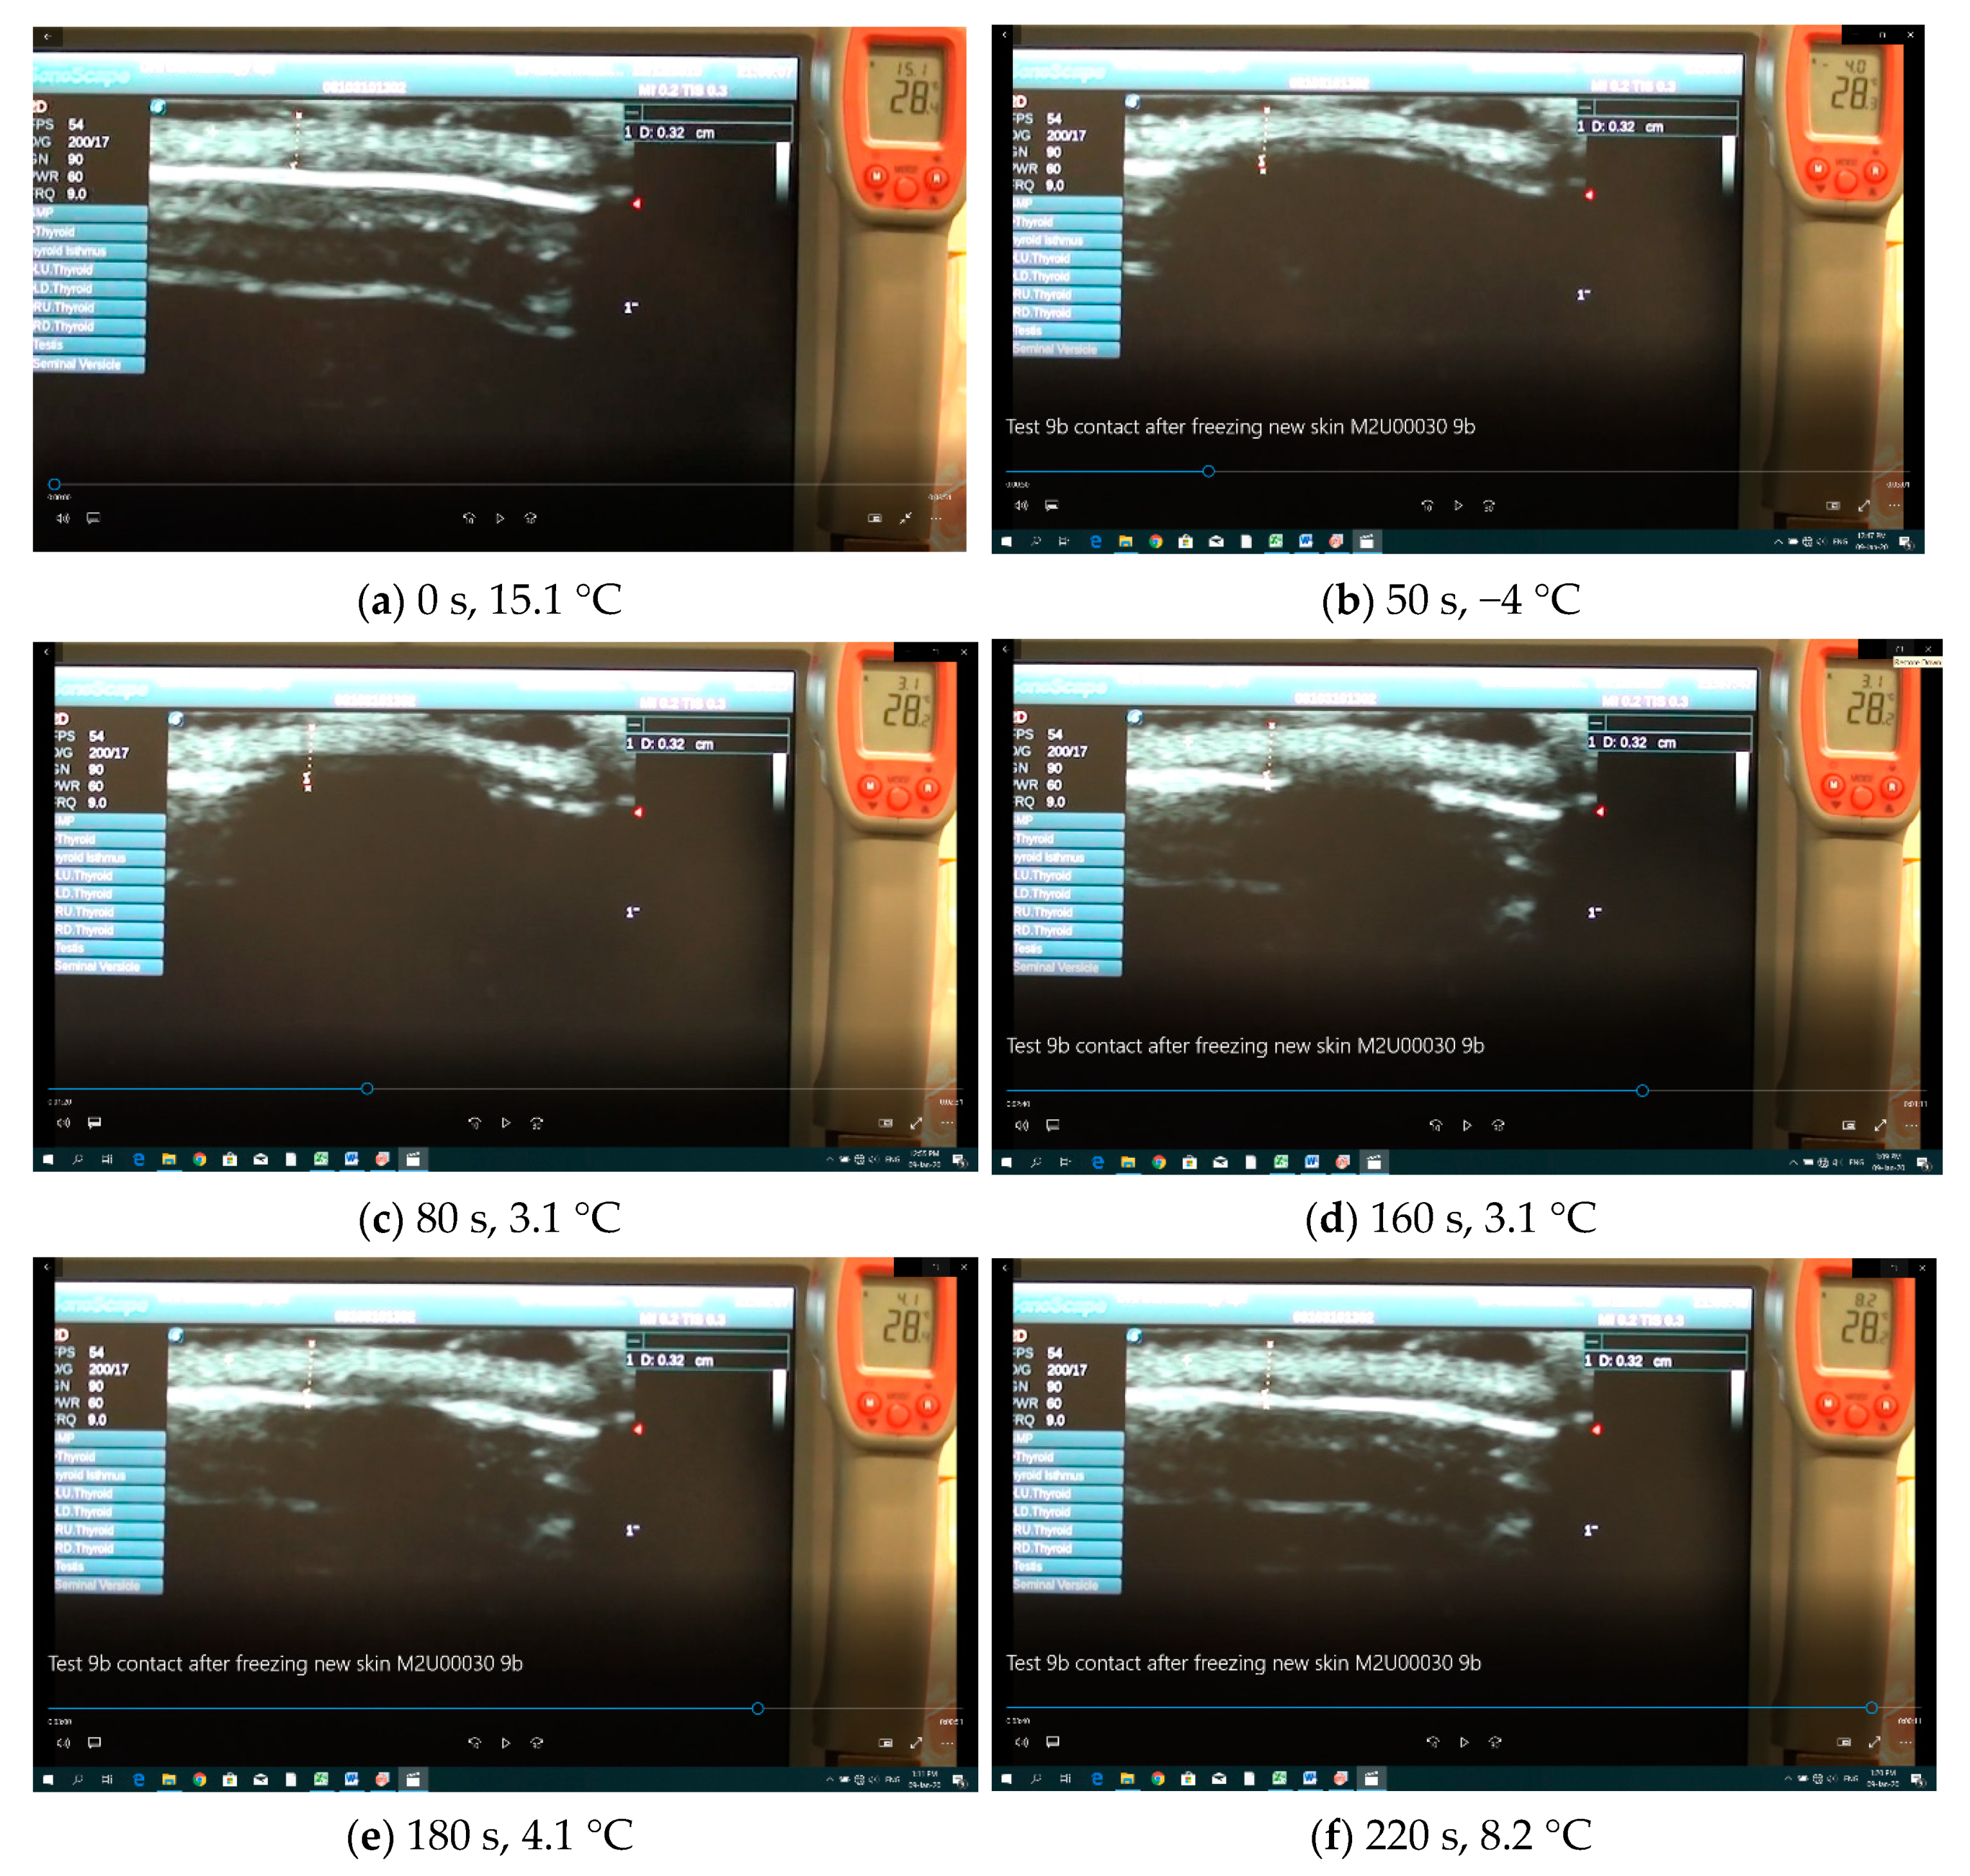
As before, the optical data from the fiber array sensor were detected by the data acquisition system stored in a computer. However, due to the limited memory of the ultrasound unit, the screen of the unit was continuously recorded by a digital video camera which also recorded the temperature of the thermometer. By synchronizing the optical signals with the video from the ultrasound unit, it was possible to correlate the results from the two systems and measure the depth of freezing. Specifically, by isolating sequential screen shots, taken every 10 s, we measured the frozen structures of the tissue with ImageJ (https://imagej.nih.gov/ij/, v.1.52, U.S. National Institutes of Health, Bethesda, Maryland, USA). The resolution of this ultrasound system was about 0.1 mm to 0.2 mm with typical results shown in Figure 10a–f.
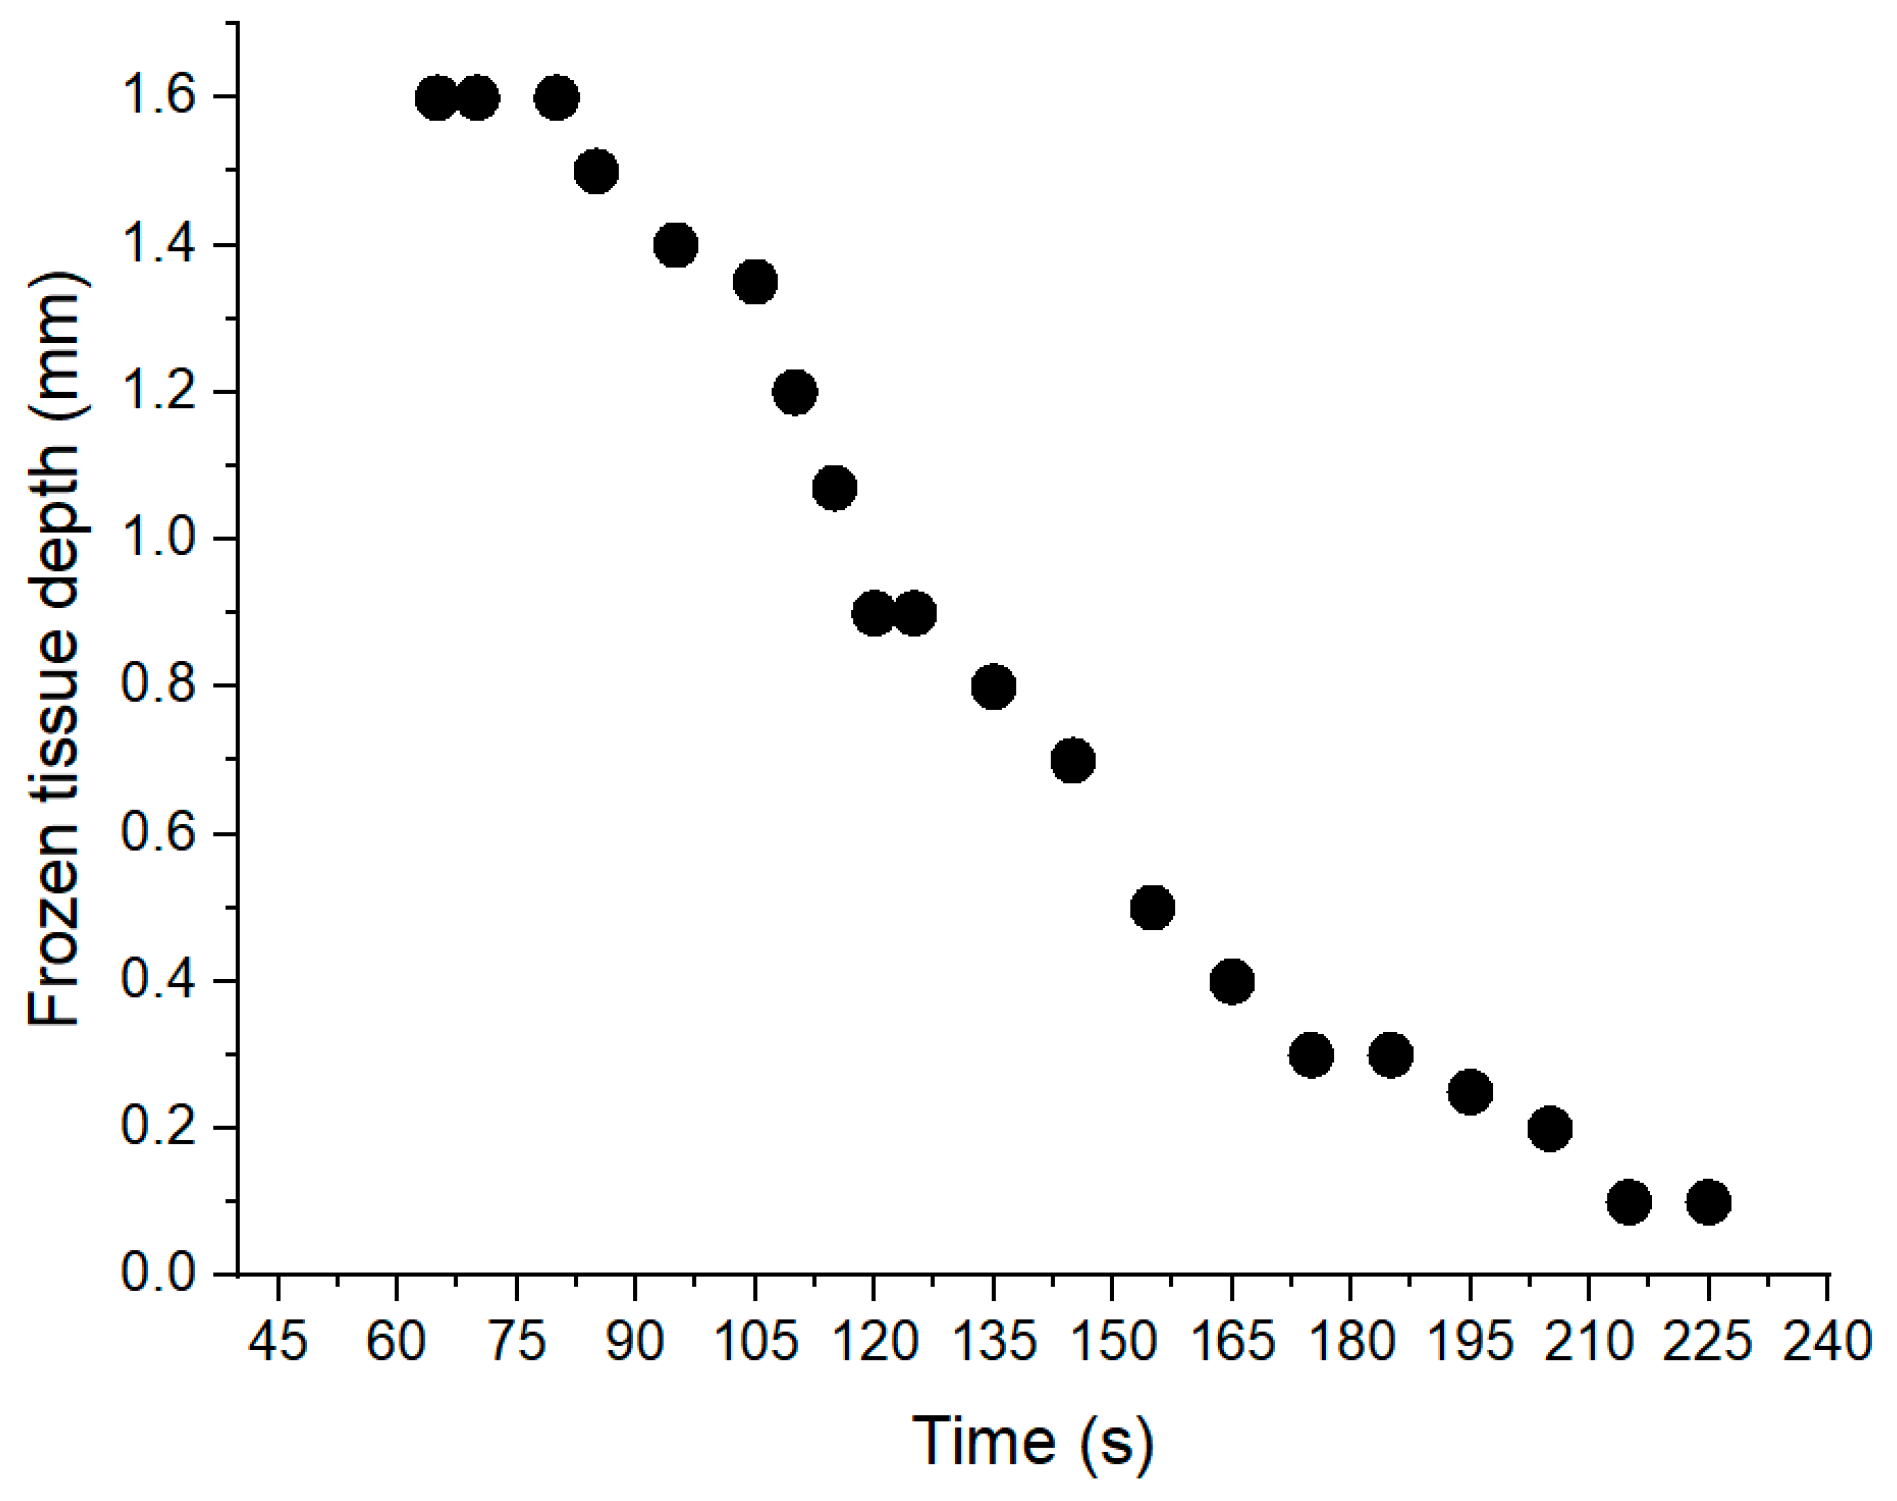
Specifically, Figure 10a–f shows distinct frames of the video taken before freezing (Figure 10a) and during thawing (Figure 10b–f). Furthermore, in Figure 10a, the two red markers designate the unfrozen tissue which was about 3.2 mm thick (also indicated by the vertical trace). The white dense layer is the epidermis while the less dense region above is the fatty layer of the porcine specimen. The faint white structures below the epidermis are artifacts related to ultrasound reflections. The temperature behind the specimen was measured by a radio sparer (RS) digital dual thermometer measuring both Infrared (IR) radiation, (large digits) and temperature from the K-type thermocouple (small digits), used in these experiments. The ultrasound detector was placed on the upper side of the tissue and the fiber optic sensor on the lower side. Figure 10b shows the same specimen after it was frozen and the fiber optic sensor was repositioned in contact with the tissue having reached front (side-A) and back (side-B) temperatures of about −7 °C and a −110 °C, respectively. There are several observations to be noted in these frames: (a) as the tissue freezes, ultrasound does not reflect back to the sensor and the frozen tissue appears dark thus designating the depth of freezing; (b) to avoid freezing the gel, which is water based, cooling was terminated when the temperature on the back facet reached −5 °C to −7 °C; (c) as the tissue thawed it reappeared on the ultrasound screen (Figure 10c–f). Using ImageJ, the frozen tissue boundaries were measured, and the results are shown in Figure 11, where the depth of frozen tissue is shown as a function of time. It is important to note, that as can be seen from this graph the maximum depth measured by ultrasound was also about 1.6 mm.
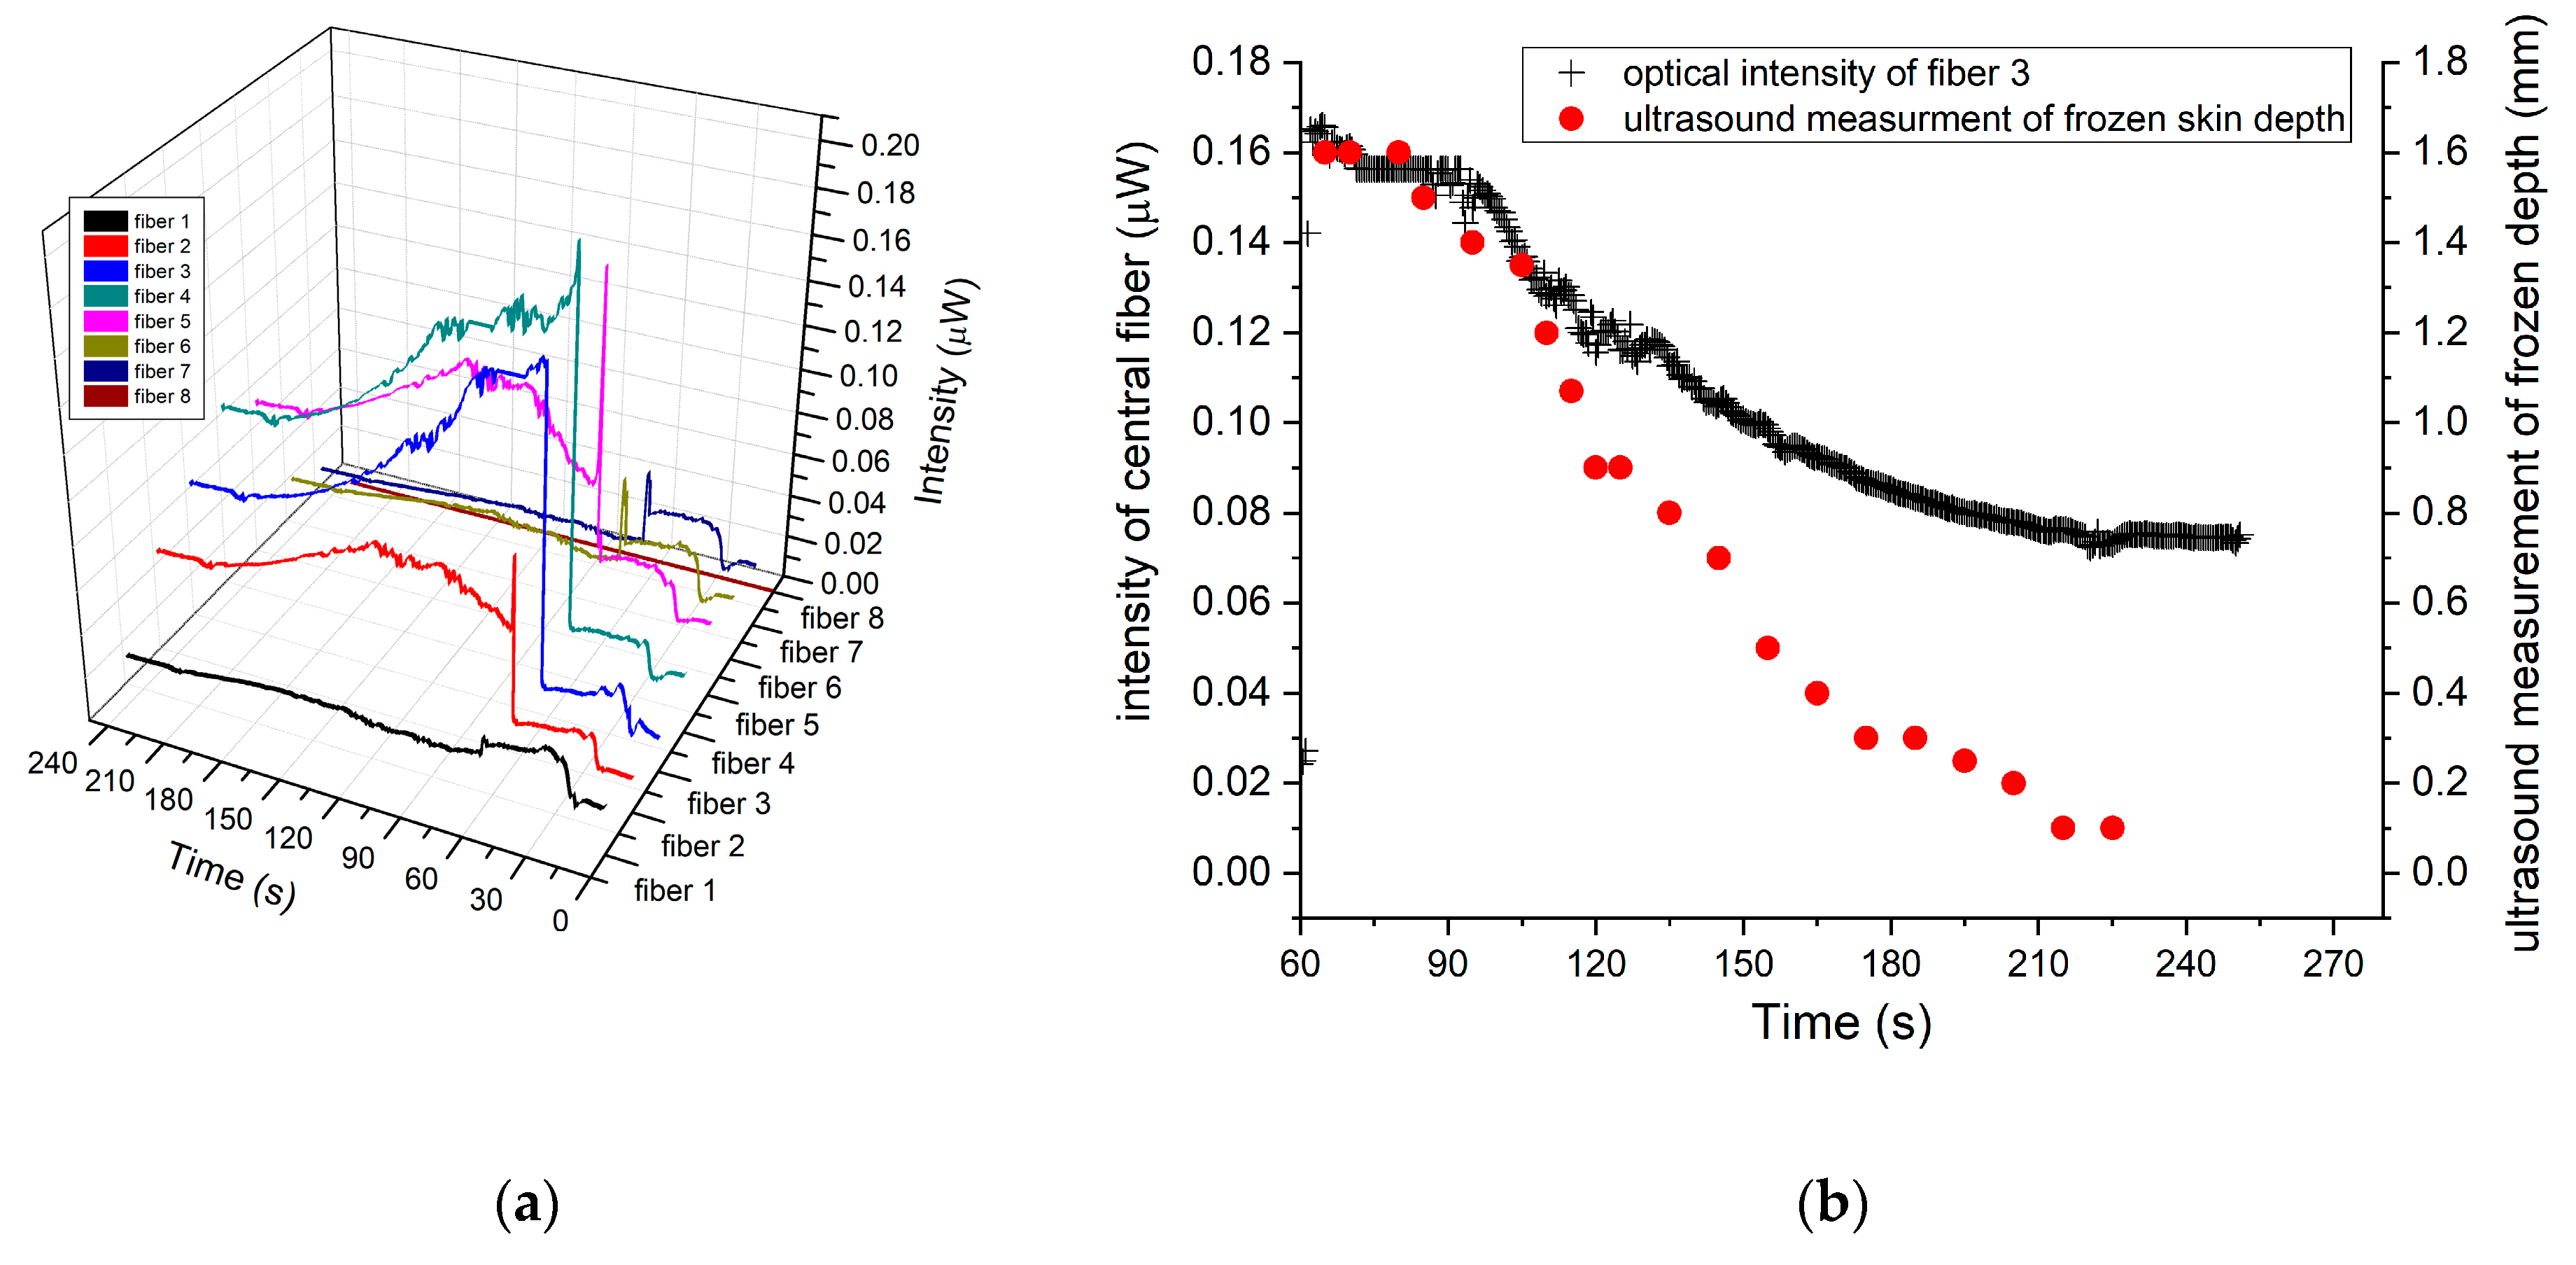
To correlate the ultrasound measurements with the backscattering optical intensity, the fiber optic sensor on side-A was placed in contact with the frozen tissue, and the synchronized intensity timeline for both measurements were recorded. In Figure 12a, the backscattering optical intensity timeline for the fibers array sensor is shown, while Figure 12b shows the synchronized timelines for both the backscattering intensity and the depth of frozen tissue measured by ultrasound.
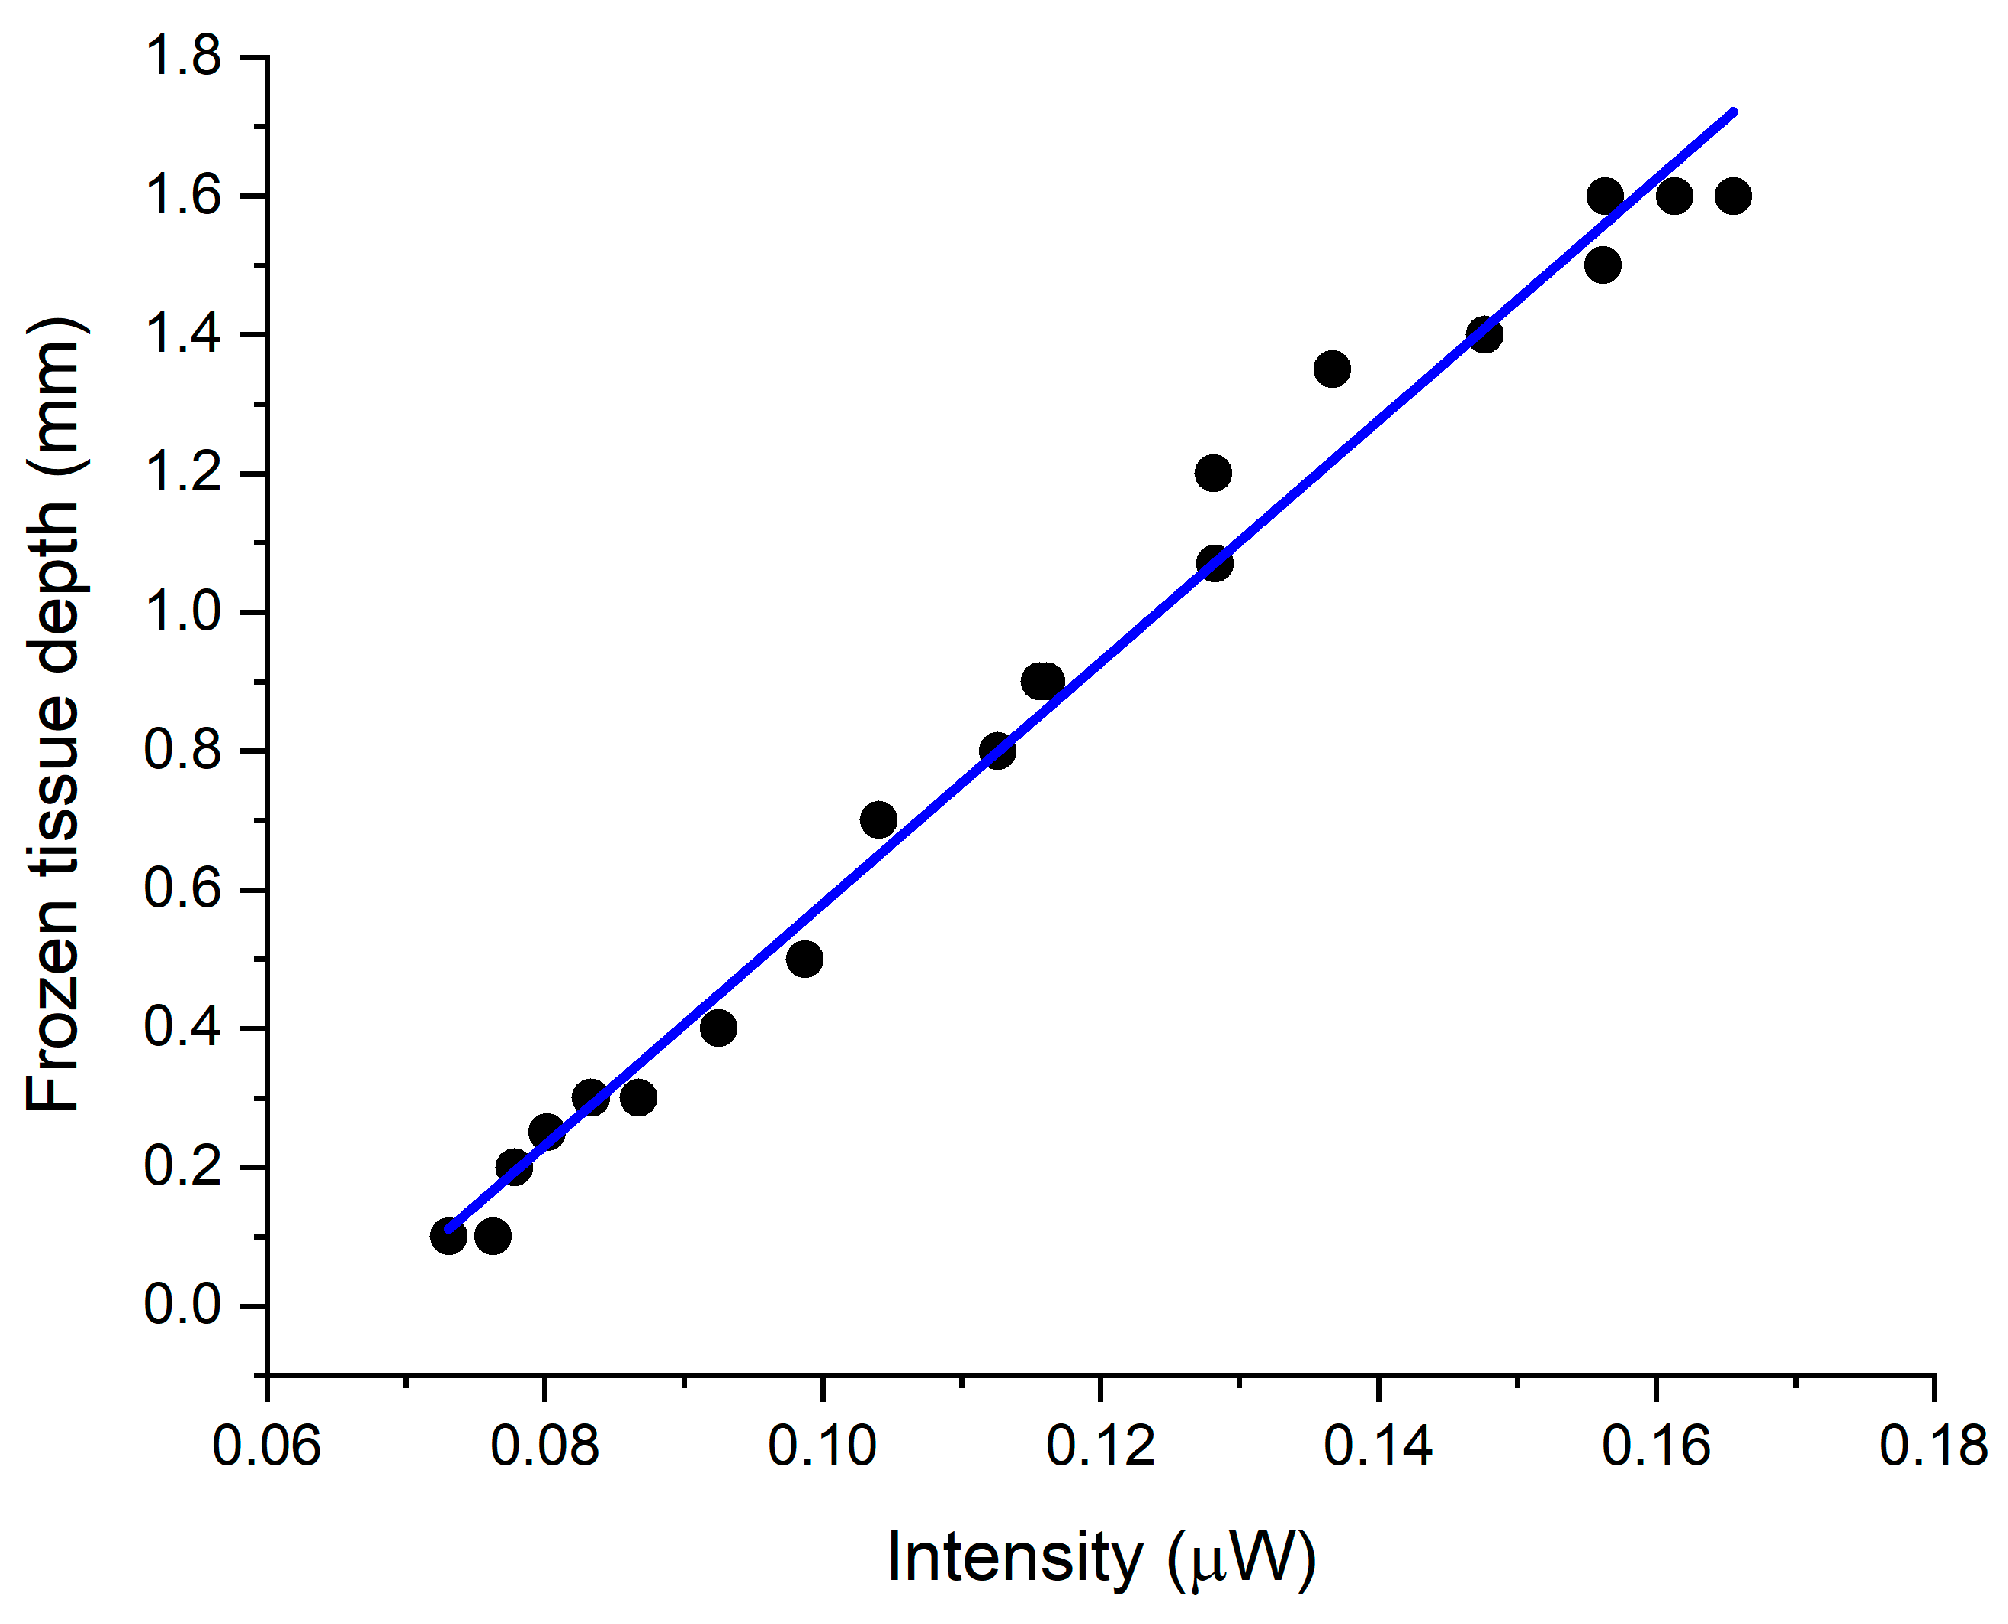
In Figure 12b, the synchronized timelines begin at 60 s which was the time the fiber array sensor was placed in contact with the frozen skin. Furthermore, no changes in intensity were recorded in the central fibers (3 and 4), until 90 s, corresponding to the time required for the frozen depth, under the fiber array sensor, to be reduced to about 1.6 mm which is the maximum detectible frozen depth. Moreover, the ultrasound frozen skin depth measurements exhibited a similar timeline which was linearly correlated (R2 = 0.98) to the optical intensity measured by fiber sensor (Figure 13).
The results shown in Figure 13 are in agreement with the previous calibrations experiments in Figure 8a, and effectively verify, by an independent method, that the backscattered intensity from the frozen tissue can be used to accurately measure the depth of freezing.
5. Conclusions

(i) Backscattering from the frozen tissue sections was higher and confined near the source; consequently, optical diffusion was initially lower and further extended into the skin tissue during thawing; (ii) the location and dimensions of the frozen depth measured with a monochromatic source can be determined to within 0.1 mm based on the optical intensity after the calibration measurements; (iii) using an independent depth measuring method with ultrasound, it was possible to verify the capability of the optical method to measure the depth of freezing in skin tissue to within 0.1 mm and up to a depth of 1.5 mm.

Author Contributions

A.I. conceptualized the project and wrote the manuscript. All authors performed the experiments and the analysis, and All authors have read and agreed to the published version of the manuscript.

Funding

This research received no external funding.

Acknowledgments

We would like to acknowledge: (i) the optical communication group of Informatics Department of the National and Kapodistrian University of Athens and in particular D. Syvridis for the use of the data acquisition system and discussions and (ii) ETIDE project/EU ‘‘ELI-LASERLAB Europe Synergy, HiPER and IPERION-CH.gr” (MIS 5002735).

Conflicts of Interest

The authors declare no conflict of interest.

References

  1. Gage, A.A.; Baust, J.G. Cryosurgery for Tumors. J. Am. Coll. Surg. 2007, 205, 342–356. [Google Scholar] [CrossRef] [PubMed]
  2. Toner, M.; Cravalho, E.G.; Karel, M. Thermodynamics and Kinetics of Intracellular Ice Formation during Freezing of Biological Cells. J. Appl. Phys. 1990, 67, 1582–1593. [Google Scholar] [CrossRef]
  3. Hoffmann, N.E.; Bischof, J.C. The Cryobiology of Cryosurgical Injury. Urology 2002, 60, 40–49. [Google Scholar] [CrossRef]
  4. Gaitanis, G.; Nomikos, K.; Vava, E.; Alexopoulos, E.; Bassukas, I. Immunocryosurgery for Basal Cell Carcinoma: Results of a Pilot, Prospective, Open-Label Study of Cryosurgery during Continued Imiquimod Application. J. Eur. Acad. Dermatol. 2009, 23, 1427–1431. [Google Scholar] [CrossRef]
  5. Yan, J.; Wang, H.; Liu, J.; Deng, Z.; Rao, W.; Xiang, S. Feasibility Study on Using an Infrared Thermometer for Evaluation and Administration of Cryosurgery. Minim. Invasive Ther. Allied Technol. 2007, 16, 173–180. [Google Scholar] [CrossRef]
  6. Samset, E.; Mala, T.; Edwin, B.; Gladhaug, I.; Søreide, O.; Fosse, E. Validation of Estimated 3D Temperature Maps during Hepatic Cryo Surgery. Magn. Reson. Imaging 2001, 19, 715–721. [Google Scholar] [CrossRef]
  7. Torre, D. Cryosurgical Instrumentation and Depth Dose Monitoring. Clin. Dermatol. 1990, 8, 48–60. [Google Scholar] [CrossRef]
  8. Tacke, J.; Speetzen, R.; Heschel, I.; Hunter, D.W.; Rau, G.; Günther, R.W. Imaging of Interstitial Cryotherapy—An in Vitro Comparison of Ultrasound, Computed Tomography, and Magnetic Resonance Imaging. Cryobiology 1999, 38, 250–259. [Google Scholar] [CrossRef]
  9. Choi, B.; Milner, T.E.; Kim, J.; Goodman, J.N.; Vargas, G.; Aguilar, G.; Nelson, J.S. Use of Optical Coherence Tomography to Monitor Biological Tissue Freezing during Cryosurgery. J. Biomed. Opt. 2004, 9, 282–286. [Google Scholar] [CrossRef] [PubMed]
  10. Mitri, F.G.; Davis, B.J.; Alizad, A.; Greenleaf, J.F.; Wilson, T.M.; Mynderse, L.A.; Fatemi, M. Prostate Cryotherapy Monitoring Using Vibroacoustography: Preliminary Results of anEx VivoStudy and Technical Feasibility. IEEE Trans. Biomed. Eng. 2008, 55, 2584–2592. [Google Scholar] [CrossRef] [PubMed]
  11. Edd, J.F.; Ivorra, A.; Horowitz, L.; Rubinsky, B. Imaging Cryosurgery with EIT: Tracking the Ice Front and Post-Thaw Tissue Viability. Physiol. Meas. 2008, 29, 899–912. [Google Scholar] [CrossRef] [PubMed] [Green Version]
  12. Butts, K.; Sinclair, J.; Daniel, B.L.; Wansapura, J.; Pauly, J.M. Temperature Quantitation and Mapping of Frozen Tissue. J. Magn. Reson. Imaging 2001, 13, 99–104. [Google Scholar] [CrossRef]
  13. Overduin, C.G.; Fütterer, J.J.; Scheenen, T.W.J. 3D MR Thermometry of Frozen Tissue: Feasibility and Accuracy during Cryoablation at 3T. J. Magn. Reson. Imaging 2016, 44, 1572–1579. [Google Scholar] [CrossRef] [PubMed]
  14. Themstrup, L.; Banzhaf, C.; Mogensen, M.; Jemec, G.B.E. Cryosurgery Treatment of Actinic Keratoses Monitored by Optical Coherence Tomography: A Pilot Study. Dermatology 2012, 225, 242–247. [Google Scholar] [CrossRef] [PubMed]
  15. Zuzak, K.J.; Schaeberle, M.D.; Lewis, E.N.; Levin, I.W. Visible Reflectance Hyperspectral Imaging: Characterization of a Noninvasive, in Vivo System for Determining Tissue Perfusion. Anal. Chem. 2002, 74, 2021–2028. [Google Scholar] [CrossRef] [PubMed]
  16. Spigulis, J.; Jakovels, D.; Rubins, U. Multi-Spectral Skin Imaging by a Consumer Photo-Camera. In Multimodal Biomedical Imaging V; Azar, F.S., Intes, X., Eds.; SPIE: Bellingham, WA, USA, 2010. [Google Scholar] [CrossRef]
  17. Kletetschka, G.; Hruba, J. Dissolved Gases and Ice Fracturing During the Freezing of a Multicellular Organism: Lessons from Tardigrades. BioResearch Open Access 2015, 4, 209–217. [Google Scholar] [CrossRef] [PubMed]
  18. Petrenko, V.F.; Whitworth, R.W. Physics of Ice; Oxford University Press: Oxford, UK; New York, NY, USA, 1999. [Google Scholar]
  19. Lipp, G.; Körber, C.; Englich, S.; Hartmann, U.; Rau, G. Investigation of the Behavior of Dissolved Gases during Freezing. Cryobiology 1987, 24, 489–503. [Google Scholar] [CrossRef]
  20. Bohren, C.F.; Huffman, D.R. Absorption and Scattering of Light by Small Particles; Wiley and Sons: New York, NY, USA, 1983. [Google Scholar]
  21. Jacques, S.L. Optical properties of biological tissues: A review. Phys. Med. Biol. 2013, 58, R37–R61. [Google Scholar] [CrossRef] [PubMed]
Figure 1. Experimental set up of calibration setup.
Applsci 10 01053 g001
Figure 2. Fiber array with glass window and index-matching gel (IMG) or air gap, in front of the signal fibers and extended source fiber.
Applsci 10 01053 g002
Figure 3. (a) Typical transmission and (c) backscattering through 0.0 mm, 3.2 mm embedded fiber in skin tissue; (b) collective transmission; and (d) collective backscattering in frozen and unfrozen tissue.
Applsci 10 01053 g003
Figure 4. (a) Typical backscattering (black) and transmission intensities (red) and temperature (blue) timeline during freeze/thaw cycle for the illumination fiber near the surface of tissue depth x = 3.0 mm. (b) Sideview showing the fiber illumination cone and detection depth in the “ice hemisphere” of the tissue.
Applsci 10 01053 g004
Figure 5. Calibration curve of freezing depth.
Applsci 10 01053 g005
Figure 6. Top view schematic representation of experimental arrangement of the porcine tissue in brass substrate together with thermocouples.
Applsci 10 01053 g006
Figure 7. 2D timelines of intensities and temperature showing the temporal, temperature, and optical backscattering intensities for 3 depths (0.2 mm, 1.3 mm, and 2.1 mm).
Applsci 10 01053 g007
Figure 8. (a) Backscattering intensity variation with depth of freezing for the fiber array sensor. (b) Optical diffusion in mm.
Applsci 10 01053 g008
Figure 9. Verification setup with ultrasound.
Applsci 10 01053 g009
Figure 10. (af) Distinct sequential frames of the video taken during thawing.
Applsci 10 01053 g010
Figure 11. Measurement of frozen depth (mm) with ultrasound as a function of thawing time (s) measured from side-A.
Applsci 10 01053 g011
Figure 12. (a) Intensity timeline; (b) optical intensity and frozen tissue depth using ultrasound.
Applsci 10 01053 g012
Figure 13. Correlated data from the backscattering intensity from fiber 3, plotted as function of frozen skin depth as measured by the ultrasound.
Applsci 10 01053 g013