The Effect of Light Intensity on Vegetative Propagation Efficacy, Growth, and Morphology of “Albion” Strawberry Plants in a Precision Indoor Propagation System

Abstract
1. Introduction
2. Materials and Methods
2.1. Material Preparation
2.2. Environmental Control and Growing Conditions
2.3. Experimental Design and Data Collection
2.4. Crop Specific Efficacy to Light Calculations
2.4.1. Propagation Efficacy of Strawberry Plants
2.4.2. Estimation of Number of Fixtures for Commercial PIP
2.4.3. Aerial Power Consumption and Electricity Cost per Mole of Light
2.4.4. Electricity Cost per Daughter Plant
3. Results and Discussion
3.1. Daughter Plants and Stolons
3.2. Daughter Plants Classification and Stolon Morphology
3.3. Relation between Flower Development and Stolon Generation
3.4. Stock Plant Growth, Morphology, and Net Photosynthetic Rate
4. Conclusions
Author Contributions
Funding
Acknowledgments
Conflicts of Interest
References
- AGMRC. Strawberries. Available online: https://www.agmrc.org/commodities-products/fruits/strawberries (accessed on 12 December 2019).
- Bolda, M.P.; Tourte, L.; Murdock, J.; Sumner, D.A. Sample Costs to Produce and Harvest Strawberries; University of California: Oakland, CA, USA, 2016. [Google Scholar]
- Debode, J.; Van Hemelrijck, W.; Xu, X.M.; Maes, M.; Creemers, P.; Heungens, K. Latent entry and spread of Colletotrichum acutatum (species complex) in strawberry fields. Plant Pathol. 2015, 64, 385–395. [Google Scholar] [CrossRef]
- Garcia, K.; Kubota, C. Flowering responses of North American strawberry cultivars. Acta Hortic. 2017, 1156, 483–490. [Google Scholar] [CrossRef]
- Kubota, C. (The Ohio University, Columbus, OH, USA); Durner, E.F. (Rutgers University, New Brunswick, NJ, USA). Personal communication, 2019.
- Mobini, S.H.; Lulsdorf, M.; Warkentin, T.D.; Vandenberg, A. Low red: Far-red light ratio causes faster in vitro flowering in lentil. Can. J. Plant Sci. 2016, 96, 908–918. [Google Scholar] [CrossRef]
- Mishra, Y.; Johansson Jänkänpää, H.; Kiss, A.Z.; Funk, C.; Schröder, W.P.; Jansson, S. Arabidopsisplants grown in the field and climate chambers significantly differ in leaf morphology and photosystem components. BMC Plant Biol. 2012, 12, 6. [Google Scholar] [CrossRef] [PubMed]
- Yokoi, S.; Goto, E.; Kozai, T.; Nishimura, M.; Taguchi, K.; Ishigami, Y. Effects of planting density and air current speed on the growth and uniformity of qing-geng-cai and spinach plug seedlings in a closed transplant production system. ECB 2008, 46, 103–114. [Google Scholar] [CrossRef]
- Park, Y.; Runkle, E.S. Investigating the merit of including far-red radiation in the production of ornamental seedlings grown under sole-source lighting. Acta Hortic. 2016, 1134, 259–266. [Google Scholar] [CrossRef]
- Wollaeger, H.M.; Runkle, E.S. Growth of Impatiens, Petunia, Salvia, and Tomato Seedlings under Blue, Green, and Red Light-emitting Diodes. Hortscience 2014, 49, 734–740. [Google Scholar] [CrossRef]
- Hernández, R.; Eguchi, T.; Deveci, M.; Kubota, C. Tomato seedling physiological responses under different percentages of blue and red photon flux ratios using LEDs and cool white fluorescent lamps. Sci. Hortic. 2016, 213, 270–280. [Google Scholar] [CrossRef]
- Sato, F.; Okada, K. Daily red LED illumination improves the quality of cabbage plug seedlings during low-temperature storage. J. Hortic. Sci. 2014, 89, 179–184. [Google Scholar] [CrossRef]
- Yao, X.-y.; Liu, X.-y.; Xu, Z.-g.; Jiao, X.-l. Effects of light intensity on leaf microstructure and growth of rape seedlings cultivated under a combination of red and blue LEDs. J. Integr. Agric. 2017, 16, 97–105. [Google Scholar] [CrossRef]
- Hernández, R.; Kubota, C. Physiological responses of cucumber seedlings under different blue and red photon flux ratios using LEDs. Environ. Exp. Bot. 2016, 121, 66–74. [Google Scholar] [CrossRef]
- Song, J.X.; Meng, Q.W.; Du, W.F.; He, D.X. Effects of light quality on growth and development of cucumber seedlings in controlled environment. Int. J. Agric. Biol. Eng. 2017, 10, 312–318. [Google Scholar]
- Simlat, M.; Ślęzak, P.; Moś, M.; Warchoł, M.; Skrzypek, E.; Ptak, A. The effect of light quality on seed germination, seedling growth and selected biochemical properties of Stevia rebaudiana Bertoni. Sci. Hortic. 2016, 211, 295–304. [Google Scholar] [CrossRef]
- Urairi, C.; Shimizu, H.; Nakashima, H.; Miyasaka, J.; Ohdoi, K. Optimization of light-dark cycles of lactuca sativa L. in plant factory. ECB. 2017, 55, 85–91. [Google Scholar] [CrossRef]
- Kjaer, K.H.; Ottosen, C.-O.; Jørgensen, B.N. Cost-efficient light control for production of two campanula species. Sci. Hortic. 2011, 129, 825–831. [Google Scholar] [CrossRef]
- Wu, C.C.; Hsu, S.T.; Chang, M.Y.; Fang, W. Effect of light environment on runner plant propagation of strawberry. Acta Hortic. 2011, 907, 297–302. [Google Scholar] [CrossRef]
- Kim, S.; Jeong, M.-S.; Park, S.-W.; Kim, M.J.; Na, H.-Y.; Chun, C. Improvement of runner plant production by increasing photosynthetic photon flux during strawberry transplant propagation in a closed transplant production system. Korean J. Hortic. Sci. 2010, 28, 535–539. [Google Scholar]
- Lopez, R.; Runkle, E. Light Management in Controlled Environments; Meister Media Worldwide: Willoughby, OH, USA, 2017. [Google Scholar]
- Hidaka, K.; Dan, K.; Imamura, H.; Miyoshi, Y.; Takayama, T.; Sameshima, K.; Kitano, M.; Okimura, M. Effect of supplemental lighting from different light sources on growth and yield of strawberry. ECB 2013, 51, 41–47. [Google Scholar] [CrossRef]
- Oda, Y. Effects of light intensity, CO2 concentration and leaf temperature on gas exchange of strawberry plants—feasibility studies on CO2 enrichment in japanese conditions. Acta Hortic. 1997, 439, 563–574. [Google Scholar] [CrossRef]
- Sønsteby, A.; Heide, O.M. Dormancy relations and flowering of the strawberry cultivars Korona and Elsanta as influenced by photoperiod and temperature. Sci. Hortic. 2006, 110, 57–67. [Google Scholar] [CrossRef]
- Sorkel, K.; Gaganpreet, S.; Kassim, A.-K. Strawberry (Fragaria ×ananassa duch.) growth and productivity as affected by temperature. HortScience 2006, 41, 1423–1430. [Google Scholar] [CrossRef]
- Verheul, M.J.; Sønsteby, A.; Grimstad, S.O. Influences of day and night temperatures on flowering of Fragaria x ananassa Duch, cvs. Korona and Elsanta, at different photoperiods. Sci. Hortic. 2007, 112, 200–206. [Google Scholar] [CrossRef]
- Heide, O.M. Photoperiod and temperature interactions in growth and flowering of strawberry. Physiol. Plant. 1977, 40, 21–26. [Google Scholar] [CrossRef]
- Kubota, C.; Kroggel, M.; Both, A.J.; Whalen, M. Does supplemental lighting make sense for my crop?-Empirical evaluations. Acta Hortic. 2016, 1134. [Google Scholar] [CrossRef]
- Acock, B.; Thornley, J.H.M.; Warren-Wilson, J. Photosynthesis and energy conversion. In Potential Crop Production; Wareing, P.F., Cooper, J.P., Eds.; Heinemann Educational Books: London, UK, 1971; pp. 43–75. [Google Scholar]
- Cockshull, K.E.; Graves, C.J.; Cave, C.R.J. The influence of shading on yield of glasshouse tomatoes. J. Hortic. Sci. 1992, 67, 11–24. [Google Scholar] [CrossRef]
- Aldrich, R.A.; Bartock, J.W. Greenhouse Engineering; NRAES-Natural Resources, Agriculture, and Engineering Service: Ithaca, NY, USA, 1994; Volume 33. [Google Scholar]
- Current-GE. Arize Element, Top Lighting. 2019. Available online: https://hortamericas.com/wp-content/uploads/2018/05/GE2033-1128-GE-Arize-Element-Top-Lighting-Spec-Sheet.pdf (accessed on 10 October 2019).
- Hernández, R.; Kubota, C. Physiological, morphological, and energy-use efficiency comparisons of LED and HPS supplemental lighting for cucumber transplant production. HortScience 2015, 50, 351–357. [Google Scholar] [CrossRef]
- Lewis, M.; Kubota, C.; Tronstad, R.; Son, Y.-J. Scenario-based cost analysis for vegetable grafting nurseries of different technologies and sizes. HortScience 2014, 49, 917–930. [Google Scholar] [CrossRef]
- Eric, B.B.; Daniel, J.C.; Craig, K.C. A system for producing large quantities of greenhouse-grown strawberry plantlets for plug production. HortTech 2001, 11, 636–638. [Google Scholar] [CrossRef]
- Takeda, F.; Hokanson, S.C. Strawberry fruit and plug plant production in the greenhouse. Acta Hortic. 2003, 626, 283–285. [Google Scholar] [CrossRef]
- Marcelis, L.F.M.; Broekhuijsen, A.G.M.; Meinen, E.; Nijs, E.M.F.M.; Raaphorst, M.G.M. Quantification of the growth response to light quantity of greenhouse grown crops. Acta Hortic. 2006, 711, 97–104. [Google Scholar] [CrossRef]
- Kozai, T.; Niu, G.; Takagaki, M. Plant Factory: An Indoor Vertical Farming System for Efficient Quality Food Production; Elsevier Science: Amsterdam, The Netherlands, 2019. [Google Scholar]
- Ohyama, K.; Kozai, T.; Keita, Y. Electric energy, water and carbon dioxide utilization efficiencies of a closed-type trans plant production system. In Transplant Production in the 21st Century; Springer: Dordrecht, The Netherlands, 2000. [Google Scholar]
- Park, S.; Kwack, Y.; Chun, C. Growth of runner plants grown in a plant factory as affected by light intensity and container volume. Hortic. Sci.Technol. 2017, 35, 439–445. [Google Scholar]
- Lemoine, R.; La Camera, S.; Atanassova, R.; Dédaldéchamp, F.; Allario, T.; Pourtau, N.; Bonnemain, J.-L.; Laloi, M.; Coutos-Thévenot, P.; Maurousset, L.; et al. Source-to-sink transport of sugar and regulation by environmental factors. Front. Plant Sci. 2013, 4, 272. [Google Scholar] [CrossRef] [PubMed]
- Heuvelink, E. Dry matter production in a tomato crop: Measurements and simulation. Ann. Bot. 1995, 75, 369–379. [Google Scholar] [CrossRef]
- Li, T.; Heuvelink, E.; Marcelis, L.F.M. Quantifying the source–sink balance and carbohydrate content in three tomato cultivars. Front. Plant Sci. 2015, 6, 416. [Google Scholar] [PubMed]
- Heuvelink, E. Effect of fruit load on dry matter partitioning in tomato. Sci. Hortic. 1997, 69, 51–59. [Google Scholar] [CrossRef]
- Heuvelink, E. Dry matter partitioning in tomato: Validation of a dynamic simulation model. Ann. Bot. 1996, 77, 71–80. [Google Scholar] [CrossRef]
- Heuvelink, E.; Buiskool, R.P.M. Influence of sink-source interaction on dry matter production in tomato. Ann. Bot. 1995, 75, 381–389. [Google Scholar] [CrossRef]


 ,
,  , ○) represent data collected for the 01 to 12 week cycle, and closed symbols (
 ,
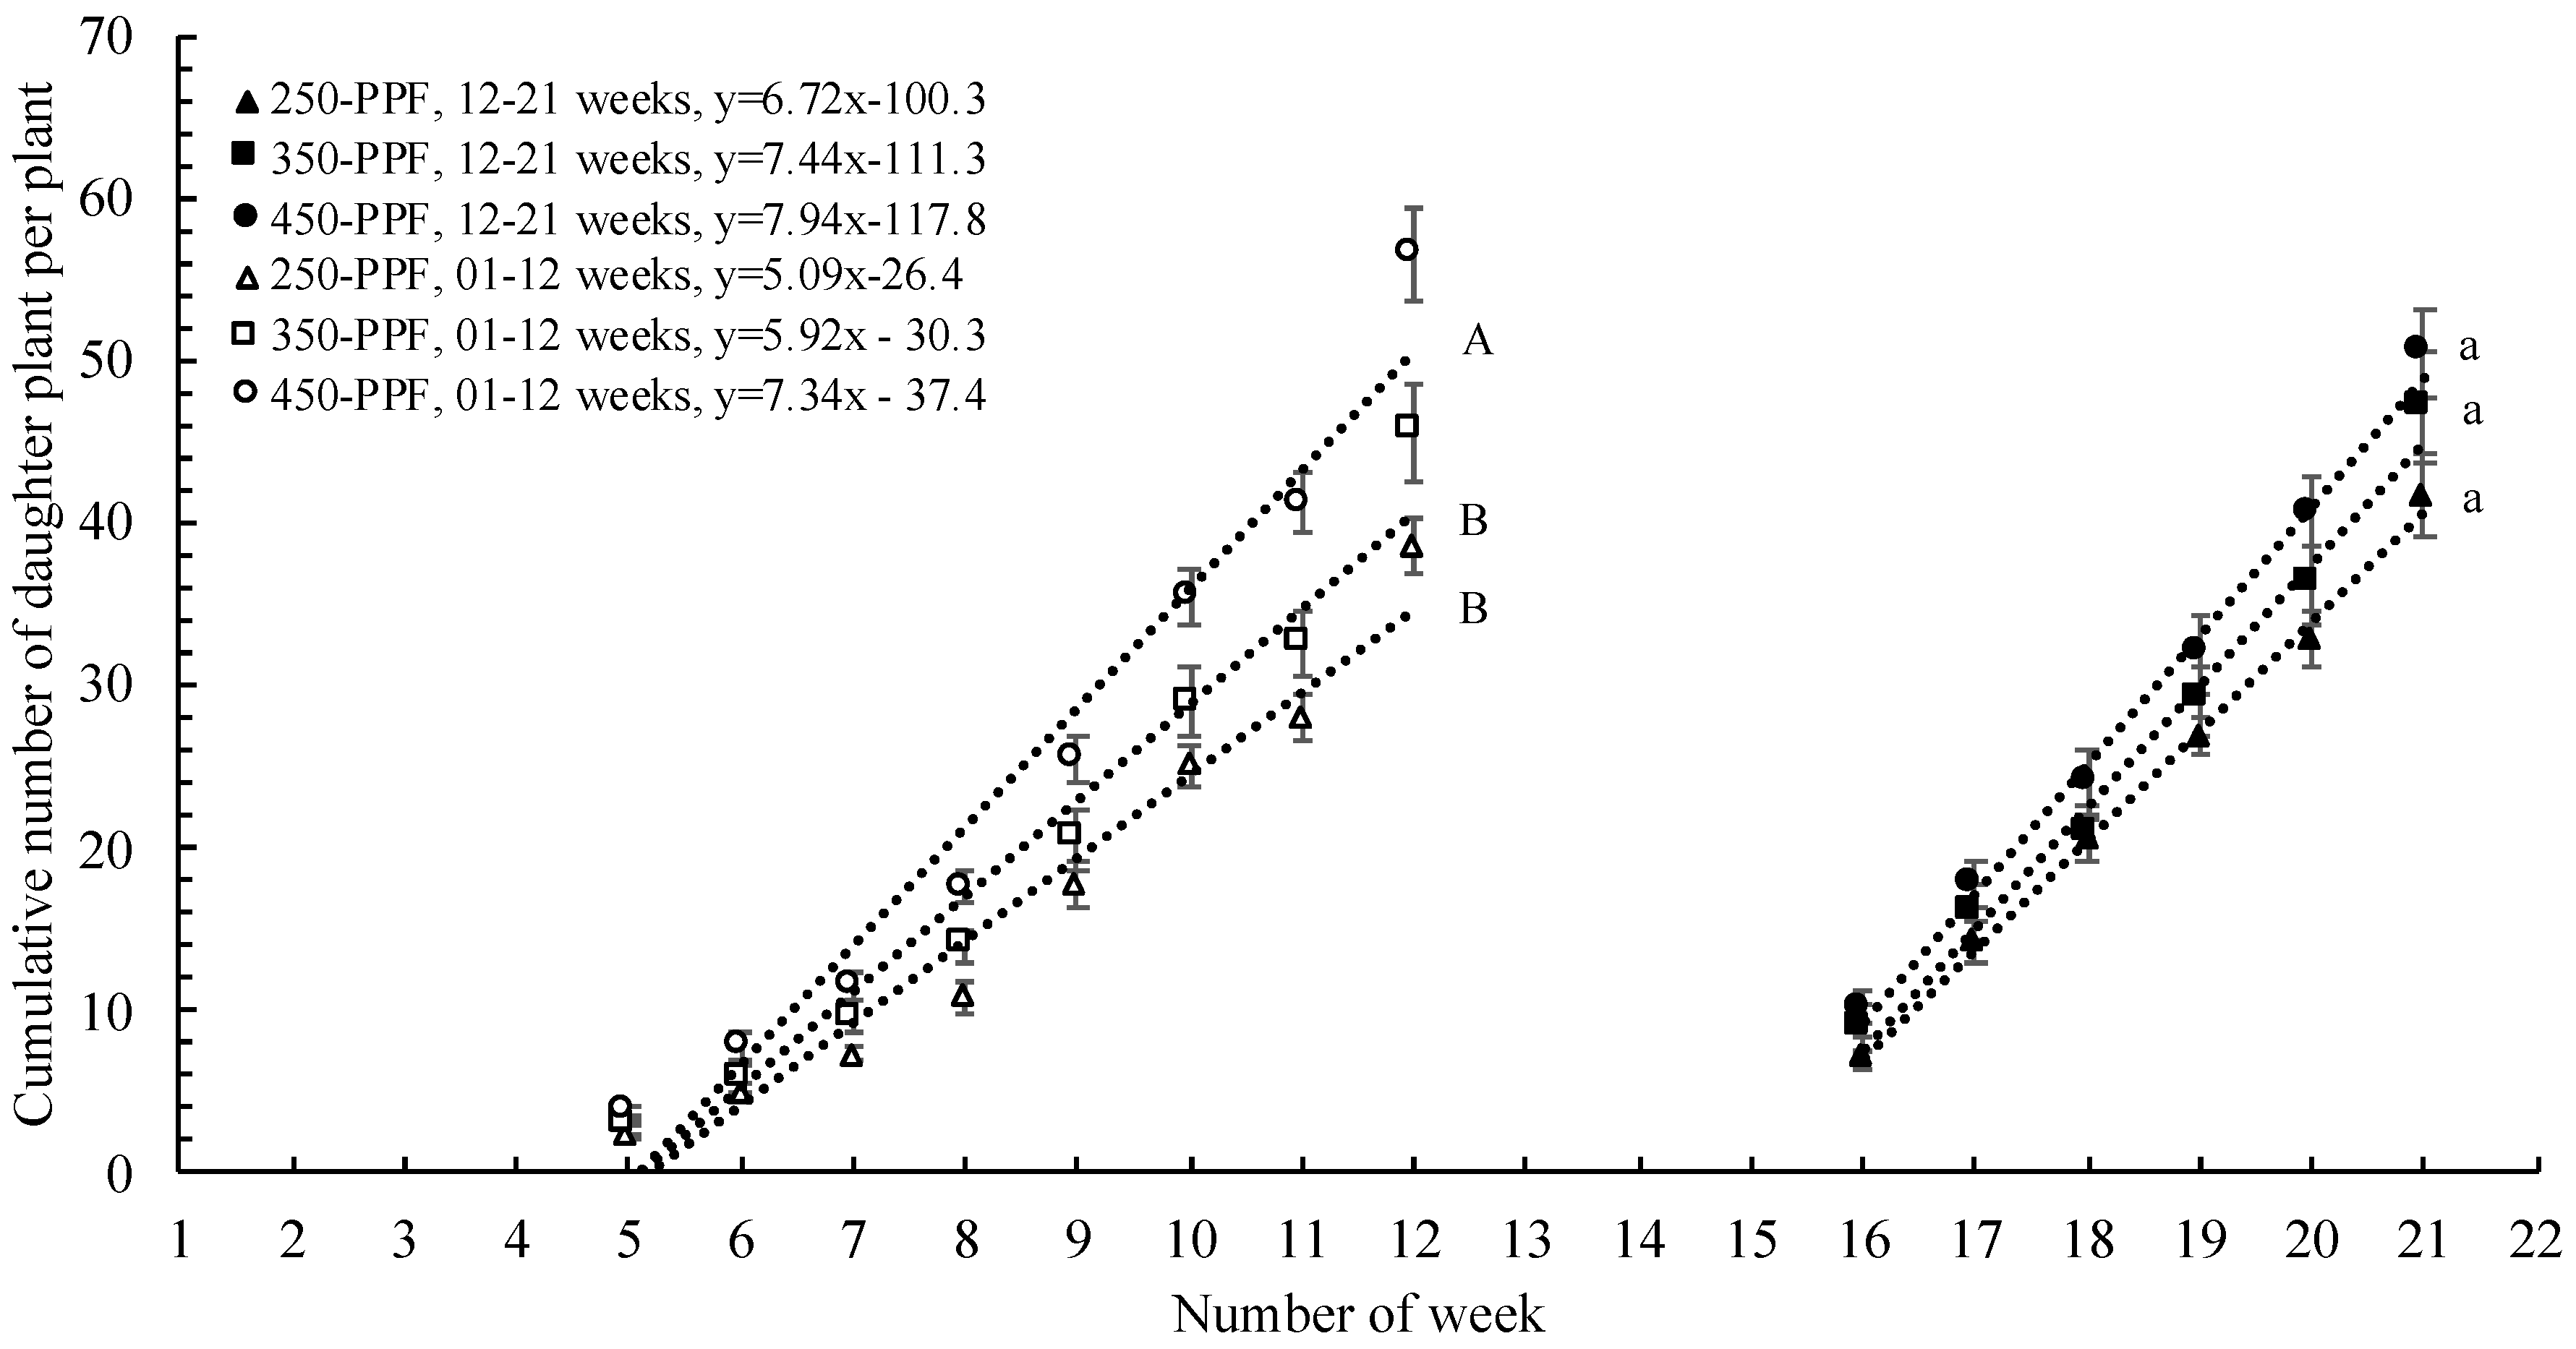
,  , ●) represent data collected for the 12 to 21 week cycle. Triangles (, ), squares (, ), and circles (●, s○) represent plants grown under 250, 350, and 450 µmol m−2 s−1 light intensity, respectively. Dotted line represents significant linear regression p ≤ 0.05. Letters (A, B, C, and a, b) represent significant differences between slopes p ≤ 0.05.
, , ○) represent data collected for the 01 to 12 week cycle, and closed symbols (, , ●) represent data collected for the 12 to 21 week cycle. Triangles (, ), squares (, ), and circles (●, s○) represent plants grown under 250, 350, and 450 µmol m−2 s−1 light intensity, respectively. Dotted line represents significant linear regression p ≤ 0.05. Letters (A, B, C, and a, b) represent significant differences between slopes p ≤ 0.05.
, ●) represent data collected for the 12 to 21 week cycle. Triangles (, ), squares (, ), and circles (●, s○) represent plants grown under 250, 350, and 450 µmol m−2 s−1 light intensity, respectively. Dotted line represents significant linear regression p ≤ 0.05. Letters (A, B, C, and a, b) represent significant differences between slopes p ≤ 0.05.
, , ○) represent data collected for the 01 to 12 week cycle, and closed symbols (, , ●) represent data collected for the 12 to 21 week cycle. Triangles (, ), squares (, ), and circles (●, s○) represent plants grown under 250, 350, and 450 µmol m−2 s−1 light intensity, respectively. Dotted line represents significant linear regression p ≤ 0.05. Letters (A, B, C, and a, b) represent significant differences between slopes p ≤ 0.05.

 ,, ○) represent data collected for weeks 01 to 12, and filled markers (, , ●) represent data collected for weeks 12 to 21. Triangles (, ), squares (, ), and circles (●, ○) represent plants grown under 250, 350, and 450 µmol m−2 s−1 light intensity, respectively.
,, ○) represent data collected for weeks 01 to 12, and filled markers (, , ●) represent data collected for weeks 12 to 21. Triangles (, ), squares (, ), and circles (●, ○) represent plants grown under 250, 350, and 450 µmol m−2 s−1 light intensity, respectively.
,, ○) represent data collected for weeks 01 to 12, and filled markers (, , ●) represent data collected for weeks 12 to 21. Triangles (, ), squares (, ), and circles (●, ○) represent plants grown under 250, 350, and 450 µmol m−2 s−1 light intensity, respectively.


| Treatment | PPFD * | Photoperiod | Temp. | VPD | RH | CO2 | Irrigation | Drainage | |||
|---|---|---|---|---|---|---|---|---|---|---|---|
| μmol m−2 s−1 | h | °C | kPa | % | Μmol mol−1 | pH | EC | pH | EC | % | |
| 01–12 weeks | |||||||||||
| 250-PPF | 241 ± 13 | 12 | 25.7 ± 0.2 | 0.98 ± 0.24 | 70.6 ± 8.0 | 438 ± 37 | 6.8 ± 0.7 | 1.2 ± 0.2 | 5.0 ± 0.9 | 1.0 ± 0.3 | 29 ± 14 |
| 350-PPF | 337 ± 13 | 25.8 ± 0.2 | |||||||||
| 450-PPF | 443 ± 17 | 25.7 ± 0.2 | |||||||||
| 12–21 weeks | |||||||||||
| 250-PPF | 241 ± 8.0 | 12 | 25.8 ± 0.1 | 0.92 ± 0.05 | 76.9 ± 2.3 | 450 ± 41 | 5.5 ± 0.3 | 1.1 ± 0.2 | 5.7 ± 0.4 | 1.3 ± 0.3 | 15 ± 12 |
| 350-PPF | 336 ± 12 | 25.7 ± 0.2 | |||||||||
| 450-PPF | 440 ± 15 | 25.7 ± 0.2 | |||||||||
| Wavelength (nm) | 300–400 | 400–500 | 500–600 | 600–700 | 700–800 |
|---|---|---|---|---|---|
| UV (%) | B (%) | G (%) | R (%) | FR (%) | |
| PFD | 0.51 ± 0.18 | 17.9 ± 0.86 | 41.1 ± 0.42 | 35.6 ± 0.44 | 4.7 ± 0.64 |
| Plant Stage | Percent Daughter Plant Dry Mass | Percent Stolon Dry Mass |
|---|---|---|
| 01–12 weeks | 63.8 ± 2.1% | 36.2 ± 2.0% |
| 12–21 weeks | 55.0 ± 1.4% | 45.0 ± 1.4% |
| p-value | p < 0.0001 | p < 0.0001 |
| Treatment | Percent Daughter Plant | Percent Stolon | Percent Stock Plant |
|---|---|---|---|
| 250-PPF | 45.8 ± 2.6% | 30.7 ± 1.3% | 23.4 ± 1.8% |
| 350-PPF | 45.4 ± 1.6% | 30.5 ± 1.2% | 24.2 ± 0.5% |
| 450-PPF | 45.3 ± 0.8% | 30.5 ± 0.8% | 24.1 ± 0.4% |
| p-value | p = 0.959 | p = 0.9604 | p = 0.7477 |
© 2020 by the authors. Licensee MDPI, Basel, Switzerland. This article is an open access article distributed under the terms and conditions of the Creative Commons Attribution (CC BY) license (http://creativecommons.org/licenses/by/4.0/).
Share and Cite
Xu, X.; Hernández, R. The Effect of Light Intensity on Vegetative Propagation Efficacy, Growth, and Morphology of “Albion” Strawberry Plants in a Precision Indoor Propagation System. Appl. Sci. 2020, 10, 1044. https://doi.org/10.3390/app10031044
Xu X, Hernández R. The Effect of Light Intensity on Vegetative Propagation Efficacy, Growth, and Morphology of “Albion” Strawberry Plants in a Precision Indoor Propagation System. Applied Sciences. 2020; 10(3):1044. https://doi.org/10.3390/app10031044
Chicago/Turabian StyleXu, Xiangnan, and Ricardo Hernández. 2020. "The Effect of Light Intensity on Vegetative Propagation Efficacy, Growth, and Morphology of “Albion” Strawberry Plants in a Precision Indoor Propagation System" Applied Sciences 10, no. 3: 1044. https://doi.org/10.3390/app10031044
APA StyleXu, X., & Hernández, R. (2020). The Effect of Light Intensity on Vegetative Propagation Efficacy, Growth, and Morphology of “Albion” Strawberry Plants in a Precision Indoor Propagation System. Applied Sciences, 10(3), 1044. https://doi.org/10.3390/app10031044