Abstract
We theoretically investigated a polyethylene-based rectangular and guided mode resonance (GMR) structure with a circular pattern by using the finite-difference time-domain (FDTD) method in the terahertz region. As the refractive index of the grating decreased, the resonance frequency increased, and the Q-factor significantly increased because of the change in the effective refractive index. In addition, GMR was investigated with a sensing layer for sensing applications. The resonance frequency and Q-factor could be perfectly modulated by varying the complex refractive index and thickness of the sensing layer. These results indicate that GMR could be applied to highly sensitive label-free detection, using low-cost GMR sensing platforms based on dielectric materials.
1. Introduction
The guided mode resonance (GMR) is a unique resonant phenomenon in which incident waves on a diffraction grating layer are diffracted and converted into a leaky guided mode, depending on conditions such as the wavelength of incident light, incident angle, waveguide thickness, and effective refractive index. Hence, when the conditions are optimized as per the GMR peak, highly resolved resonant peaks and high efficiencies can be achieved. Moreover, depending on the type of GMR sensor, the sensitivity and spectral dynamic ranges of the sensor can be easily customized by controlling the refractive index of the grating and waveguide layers, as determined by the requirements of the applications. Based on these properties, GMR devices have been widely studied for label-free sensing [1,2,3], optical band pass filters [4,5,6], and communication [7].
Recently, GMR devices operating at the terahertz (THz) frequency have received much attention for THz bandpass filters [8,9] and biological- or chemical-sensing applications [10] because a GMR device in the THz range has many advantages. For example, various conformational energies of biochemical sensing molecules can be traced to a specific GMR peak design, based on their fingerprint patterns in the THz region, which can be determined by inter- and intra-molecular energies of rotational and vibrational modes in those frequency ranges. Thus, the molecular dynamics of proteins and drugs and the sensing mechanism of target molecules have been successfully investigated in this range [11,12,13,14,15,16]. Second, because of the long wavelengths of THz waves, the GMR sensor can be easily designed and manufactured by using inexpensive processing equipment, compared with those at other frequency ranges, such as visible or infrared. As a result, low-cost and highly sensitive devices based on the GMR sensing platform in the THz range can be applied to various smart packaging fields.
Here, we report on the theoretical simulation of the GMR device in the THz region, using a finite-difference time-domain (FDTD) method to investigate its sensing properties toward highly sensitive and low-cost sensing platforms. We focus on dielectric materials based on a freestanding GMR sensing platform and modulate the structural geometry and the refractive index of the grating layer. Accordingly, we propose an inexpensive freestanding THz GMR sensing device with a high-quality factor (Q-factor) for various biochemical-sensing applications.
2. Simulation Method
When incident waves are propagated and reflected by the GMR structure via normal incidence, the waves can be scattered because of the high refractive index of the grating layer. Subsequently, the incident waves are coupled to the leaky mode and propagated through the waveguide layer under resonance conditions [17,18,19,20]. Generally, the grating and waveguide layers can have different refractive indices to satisfy the GMR condition. The schematic details are shown in Figure 1. Particularly, from the effective medium theory, the grating layer in the GMR structure has the following effective refractive index [10,21]:
where nH and nL are the respective refractive indexes of the grating region and air, and F indicates the filling factor, which can be defined as the ratio of the length of grating particles to the period, Λ. Figure 1 shows the simulated geometry of the GMR structure in our studies. The symbols dg and dwg denote the thicknesses of the grating and waveguide layers, respectively. We extracted the spectrum of the GMR structure in the range from 700 to 1000 GHz for all results, using a commercial FDTD program, where the periodic boundary condition used for the horizontal direction is shown in Figure 1, and the perfect matched layer boundary condition was used for the vertical direction. In our FDTD simulation, the unit cell was periodically extended in one-dimensional direction on the surface. The refractive index of the substrate was assigned a constant value of 1.52, which is the same as that of polyethylene. The absorption coefficient of polyethylene is significantly lower than that of other polymers [22]. The thickness of the grating layer was set to 0.1 mm, and the waveguide was considered to have a thickness of 0.279 mm. In addition, the width of the grating layer depended on the filling factor and the period. The input THz waves were set to TM (Transverse Magnetic) mode plane waves, and all the simulated results were obtained through reflectance mode detection.
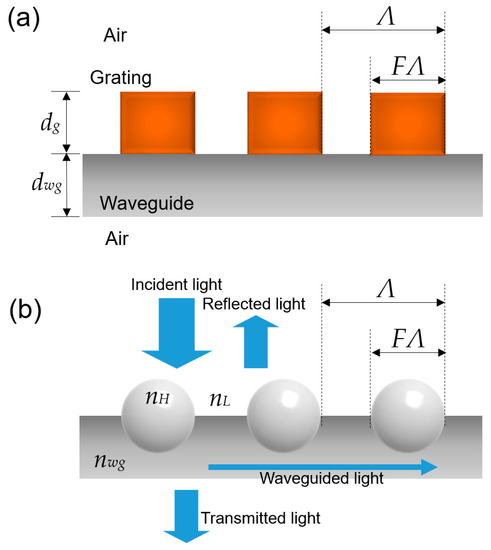
Figure 1.
Simulated structure of the GMR device of (a) rectangular and (b) spherical shapes.
3. Results and Discussion
Figure 2 shows the results of the simulation on the freestanding GMR device under variations in the refractive index of the rectangular grating. As can be seen in Figure 2a, because of the same refractive index of the substrate, we changed the refractive index (neff) of the grating layer from 1.55 to 2.05, with the filling factor, F = 0.25. Thus, as the refractive index of the grating was increased, the resonance frequency was red shifted. In our previous study, a model for the wavelength sensitivity of GMR structures was proposed [23]. When the incident waves pass through a grating layer, the equation for the diffraction grating becomes [24] the following:
where Λ is the grating period, θd is the diffraction angle, θi is the incident angle, and mg is the order of the diffracted wave, respectively. Under the conditions used in our simulation, nL equals 1, and θi equals 0, because light is considered to pass through free space with normal incidence. As the refractive index of the grating layer changes, neff also varies and vice versa. As a result, the resonance frequency can be shifted. Moreover, when neff decreases, the quality factor (Q-factor) increases dramatically. As shown in Figure 2b, the Q-factor at neff = 1.55 is almost seven times higher than 2.05.
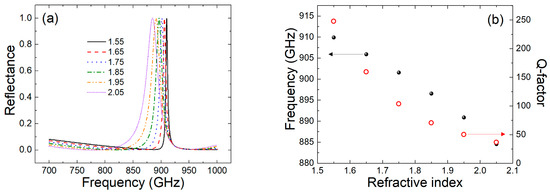
Figure 2.
(a) Scheme of the simulated THz reflectance with varying refractive index of the grating layer; (b) peak frequency and Q-factor for the rectangular pattern, where F = 0.25.
Thereafter, we calculated the reflectance of the GMR structure by varying the filling factor of the grating, as shown in Figure 3a.
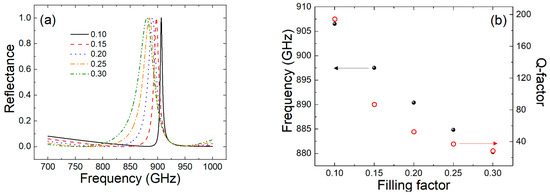
Figure 3.
(a) Scheme of the simulated THz reflectance with size dependency of the grating layer, where neff = 2.05; (b) peak frequency and Q-factor for the rectangular pattern.
Figure 3 shows the results of the simulation under varying grating size (neff = 2.05). As the filling factor decreased, which denotes a decreased grating size, the resonance frequency shifted to a higher frequency. Furthermore, the Q-factor increased from 28 to 194. For both the resonance peak and Q-factor, the resonance frequency showed almost a linear relation with refractive index and grating size. However, the Q-factor indicated a slightly different trend, i.e., a nonlinear relation, compared with the resonance-frequency variation. This is because the Q-factor is more applicable to the sensitive detection of such materials than the frequency change.
GMR structures usually have a rectangular grating layer; otherwise, spherically shaped structures can be applied as the grating layer. To realize the spherically shaped grating for the GMR structure, the spherical particle should be embedded in the waveguide or sensing layers. This is because the particles cannot firmly lie at the top of the waveguide. Shin et al. demonstrated a GMR sensor for humidity, using a spherically shaped GMR device [10]. In this study, ZrO2 particles, which are spherically shaped particles, were adopted for the grating layer, and good experimental results were reported when compared with the theoretical results. Thus, we calculated the THz spectrum of the GMR structure with a circular pattern, as shown in Figure 1b. Figure 4 and Figure 5 show the THz spectrum of the GMR structure, with the circular pattern with the dependency on the refractive index and size of the grating layer. The figures indicate that the spectral trends of the GMR structure with a circular pattern were similar to those of the rectangular-shaped GMR structure. However, as the refractive index decreased, the resonance frequency changed from 860 to 910 GHz. The rate of change with the circular-shaped GMR structure was greater than that with the rectangular pattern. In addition, the Q-factor was significantly sharpened. This variation was well observed in the results that were obtained by varying the grating size. When the filling factor decreased, the resonance frequency was blue shifted from 844 to 912 GHz, and the Q-factor significantly increased to almost 700. By modulating the refractive index and the grating size, the resonance peak and Q-factor can be modulated perfectly. In particular, broad resonance-frequency modulation and very high Q-factors can be achieved by using the GMR structure with the circular shape. Consequently, our simulated results can provide highly sensitive and low-cost biochemical sensing platforms, using the GMR device.
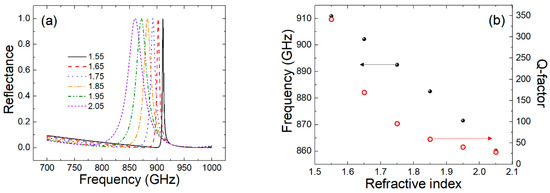
Figure 4.
(a) Scheme of the simulated THz reflectance with varying refractive index of the grating layer; (b) peak frequency and Q-factor for the circular pattern, where F = 0.25.
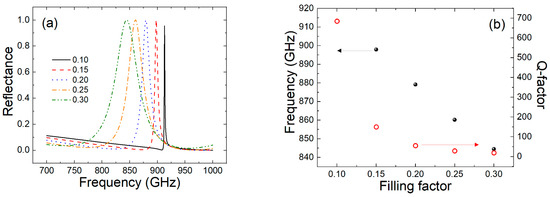
Figure 5.
(a) Scheme of the simulated THz reflectance with size dependency of the grating layer, where neff = 2.05; (b) peak frequency and Q-factor for the circular pattern.
To apply the results to sensing platforms, however, GMR devices with a sensing layer must be considered. Such a sensing material or receptor for target material detection can be coated onto the GMR device. In a previous study, humidity sensing was conducted by using the GMR device with polymer and ceramic balls [10]. The mechanism of humidity sensing can be explained as follows: when the water vapor attaches to the sensing layer due to humidity, the refractive index of the sensing layer changes. Subsequently, the THz spectrum of the GMR device at high humidity is different from that at low humidity. We simulated the GMR device depending on thickness (t), and the real (n) and imaginary (k) parts of the refractive index of the sensing layer, because the optical parameters of the sensing layer could be changed by the properties of the sensing materials. The GMRs with the sensing layer were analyzed under the same boundary conditions as those used to obtain previous results.
Figure 6 shows the simulated results as a function of the thickness of the layer. In this case, we fixed the refractive index of the layer to 1.4 and varied the thickness of the sensing layer from 0 to 30 µm. As the thickness of the layer increased, the resonance frequency was significantly shifted to a lower frequency. In addition, the change of the ratio was slightly altered at thicker layers more than at thinner layers, which indicates that the sensing resolution would be good with thin layers of sensing material. The refractive index of the layer is another important factor that affects the detection of materials.
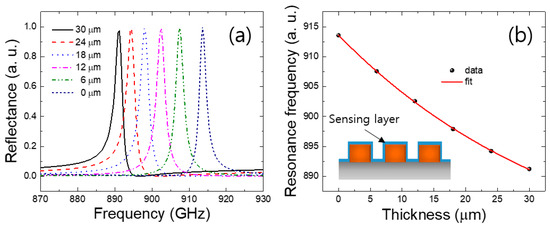
Figure 6.
Dependence of the sensing-layer thickness on the (a) THz reflectance of the GMR device and (b) the resonance frequency. The inset shows the scheme of the sensing layer (blue layer) on the GMR structure.
We calculated the dependence of the refractive index on the thickness of the sensing layer, as shown in Figure 7. The refractive index changed from 1.4 to 1.5 (t = 10 um); however, when the refractive index of the layer was changed to a high value, the resonance frequency slightly decreased. Possibly, the resonance frequency was affected by the thickness of the material more than by the refractive index. The reflectivity of the GMR device was also affected by the absorption coefficient.
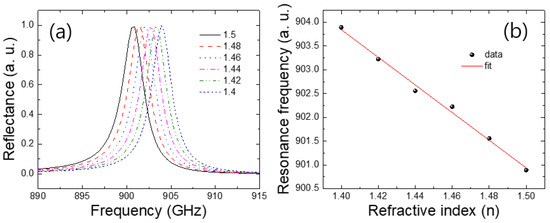
Figure 7.
Dependence of the refractive index on the thickness of the sensing layer: (a) THz reflectance and (b) the resonance frequency.
The variation in the absorption coefficients of the sensing layer was calculated from 0 to 0.1, where the thickness was 10 µm; the real part of the refractive index was 1.45 for the GMR device, as shown in Figure 8. Interestingly, the resonance frequency was not changed as the absorption coefficient of the layer increased. However, variation in the absorption coefficient dramatically changed the Q-factor of the GMR device, indicating that when the absorption coefficient of the sensing materials is high in the THz region, then GMR with a high Q-factor can be applied for highly sensitive detection.
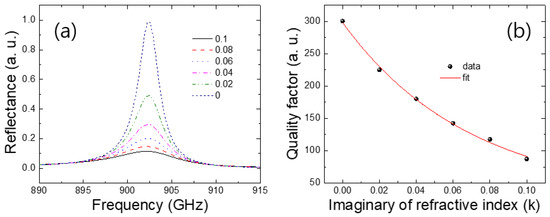
Figure 8.
Dependence of the imaginary refractive index on the thickness of the sensing layer: (a) THz reflectance and (b) the quality factor.
4. Conclusions
In this study, we observed and calculated GMR devices based on dielectric materials, and determined the effective refractive index of the structure, depending on the refractive index and the size of the grating layer for two grating patterns—rectangular and circular. The simulated results of the shift in the resonance peak and Q-factor were very well explained based on the changes in the effective refractive index of the GMR structure. In the case of the circular-shaped GMR structure, the resonance peak was demonstrated to have a wide range of variation and extremely high Q-factor, depending on the grating size, compared with those for the rectangular shaped GMR. These simulated results consequently indicate that highly sensitive and low-cost dielectric biochemical sensing platforms can be fabricated by using our GMR sensing devices.
Author Contributions
G.O. conceived of and designed the concept of the simulations; H.J.S. wrote the manuscript and analyzed the simulation results. All authors have read and agreed to the published version of the manuscript.
Acknowledgments
This work was supported financially by the Main Research Program of the Korea Food Research Institute funded by the Ministry of Science, ICT & Future Planning (E0152201-03, E0187303-02). H.J.S. was supported by the National Research Foundation of Korea (NRF) grant, funded by the Korean government (2019R1F1A1063378).
Conflicts of Interest
The authors declare no conflicts of interest.
References
- Jia, K.; Zhang, D.; Ma, J. Sensitivity of guided mode resonance filter-based biosensor in visible and near infrared ranges. Sens. Actuators B Chem. 2011, 156, 194–197. [Google Scholar] [CrossRef]
- Wei, X.; Weiss, S.M. Guided mode biosensor based on grating coupled porous silicon waveguide. Opt. Express 2011, 19, 11330–11339. [Google Scholar] [CrossRef] [PubMed]
- Wawro, D.; Tibuleac, S.; Magnusson, R.; Liu, H. Optical fiber end face biosensor based on resonances in dielectric waveguide gratings. Proc. SPIE 2000, 3911, 86–94. [Google Scholar]
- Uddin, M.J.; Magnusson, R. Efficient guided-mode-resonant tunable color filters. IEEE Photonics Tech. Lett. 2012, 24, 1552–1554. [Google Scholar] [CrossRef]
- Peters, D.W.; Boye, R.R.; Wendt, J.R.; Kellogg, R.A.; Kemme, S.A.; Carter, T.R.; Samora, S. Demonstration of polarization-independent resonant subwavelength grating filter arrays. Opt. Lett. 2010, 35, 3201–3203. [Google Scholar] [CrossRef]
- Buet, X.; Daran, E.; Belharet, D.; Lozes-Dupuy, F.; Monmayrant, A.; Gauthier-Lafaye, O. High angular tolerance and reflectivity with narrow bandwidth cavity-resonator-integrated guided-mode resonance filter. Opt. Express 2012, 20, 9322–9327. [Google Scholar] [CrossRef]
- Niederer, G.; Herzig, H.P.; Shamir, J.; Thiele, H.; Schnieper, M.; Zschokke, C. Tunable, oblique incidence resonant grating filter for telecommunications. Appl. Opt. 2004, 43, 1683–1694. [Google Scholar] [CrossRef]
- Bark, H.S.; Jeon, T.I. Tunable terahertz guided-mode resonance filter with a variable grating period. Opt. Express 2018, 26, 29353–29362. [Google Scholar] [CrossRef] [PubMed]
- Ferraro, A.; Zografopoulos, D.C.; Caputo, R.; Beccherelli, R. Guided-mode resonant narrowband terahertz filtering by periodic metallic stripe and patch arrays on cyclo-olefin substrates. Sci. Rep. 2018, 8, 17272. [Google Scholar] [CrossRef]
- Shin, H.J.; Kim, S.H.; Park, K.; Lim, M.C.; Choi, S.W.; Ok, G. Free-standing guided-mode resonance humidity sensor in terahertz. Sens. Actuators A Phys. 2018, 26, 27–31. [Google Scholar] [CrossRef]
- Kim, S.J.; Born, B.; Havenith, M.; Gruebele, M. Real-time detection of protein–water dynamics upon protein folding by terahertz absorption spectroscopy. Angew. Chem. Int. Ed. 2018, 47, 6486–6489. [Google Scholar] [CrossRef] [PubMed]
- Sibik, J.; Löbmann, K.; Rades, T.; Zeitler, J.A. Predicting crystallization of amorphous drugs with terahertz spectroscopy. Mol. Pharm. 2015, 12, 3062–3068. [Google Scholar] [CrossRef] [PubMed]
- Debus, C.; Bolivar, P.H. Frequency selective surfaces for high sensitivity terahertz sensing. Appl. Phys. Lett. 2007, 91, 184102. [Google Scholar] [CrossRef]
- Ebbinghaus, S.; Kim, S.J.; Heyden, M.; Yu, X.; Gruebele, M.; Leitner, D.M.; Havenith, M. Protein sequence-and pH-dependent hydration probed by terahertz spectroscopy. J. Am. Chem. Soc. 2008, 130, 2374–2375. [Google Scholar] [CrossRef] [PubMed]
- Shin, H.J.; Oh, S.J.; Kim, S.I.; Kim, H.W.; Son, J.H. Conformational characteristics of β-glucan in laminarin probed by terahertz spectroscopy. Appl. Phys. Lett. 2009, 94, 111911. [Google Scholar] [CrossRef]
- Son, J.H. Terahertz bio-sensing techniques. In Handbook of Terahertz Technology for Imaging, Sensing and Communications; Elsevier: Amsterdam, The Netherlands, 2016; pp. 217–230. [Google Scholar]
- Sang, T.; Wang, Z.; Zhu, J.; Wang, L.; Wu, Y.; Chen, L. Linewidth properties of double-layer surface relief resonant Brewster filters with equal refractive index. Opt. Express 2007, 15, 9659–9665. [Google Scholar] [CrossRef]
- Magnusson, R.; Wang, S.S. New principle for optical filters. Appl. Phys. Lett. 1992, 61, 1022–1024. [Google Scholar] [CrossRef]
- Ding, Y.; Magnusson, R. Band gaps and leaky-wave effects in resonant photonic-crystal waveguides. Opt. Express 2007, 15, 680–694. [Google Scholar] [CrossRef]
- Wang, S.S.; Magnusson, R. Theory and applications of guided-mode resonance filters. Appl. Opt. 1993, 32, 2606–2613. [Google Scholar] [CrossRef]
- Liu, W.X.; Lai, Z.Q.; Guo, H.; Liu, Y. Guided-mode resonance filters with shallow grating. Opt. Lett. 2010, 35, 865–867. [Google Scholar] [CrossRef]
- Vieweg, N.; Rettich, F.; Deninger, A.; Roehle, H.; Dietz, R.; Göbel, T.; Schell, M. Terahertz-time domain spectrometer with 90 dB peak dynamic range. J. Infrared Millimeter Terahertz Waves 2014, 35, 823–832. [Google Scholar] [CrossRef]
- Lin, S.F.; Wang, C.M.; Tsai, Y.L.; Ding, T.J.; Yang, T.H.; Chen, W.Y.; Yeh, S.F.; Chang, J.Y. A model for fast predicting and optimizing the sensitivity of surface-relief guided mode resonance sensors. Sens. Actuators B Chem. 2013, 176, 1197–1203. [Google Scholar] [CrossRef]
- Lin, S.F.; Wang, C.M.; Ding, T.J.; Tsai, Y.L.; Yang, T.H.; Chen, W.Y.; Chang, J.Y. Sensitive metal layer assisted guided mode resonance biosensor with a spectrum inversed response and strong asymmetric resonance field distribution. Opt. Express 2012, 20, 14584–14595. [Google Scholar] [CrossRef] [PubMed]
© 2020 by the authors. Licensee MDPI, Basel, Switzerland. This article is an open access article distributed under the terms and conditions of the Creative Commons Attribution (CC BY) license (http://creativecommons.org/licenses/by/4.0/).