Article

Interferometric Measurement of TGF-β Induced Epithelial-Mesenchymal Transition of Tumor Cells

1
Computer Engineering Department, Bogazici University, İstanbul 34342, Turkey
2
Electrical and Electronics Departments, Marmara University, İstanbul 34722, Turkey
3
Mechatronics Engineering Department, Yildiz Technical University, İstanbul 34349, Turkey
*
Author to whom correspondence should be addressed.
Appl. Sci. 2020, 10(24), 9107; https://doi.org/10.3390/app10249107
Submission received: 15 October 2020 / Revised: 21 November 2020 / Accepted: 23 November 2020 / Published: 20 December 2020
(This article belongs to the Section Applied Biosciences and Bioengineering)

Abstract

:
A three-dimensional profile reconstruction of live cells in dynamic cell cultures is a challenging problem due to the highly scattering nature of cell mediums. Furthermore, it is an interesting problem since these cultures present the optimal in vitro conditions that most closely resemble the cells’ natural conditions. In this paper, we report a holographic method used for imaging during the process of treatment of dynamic cell cultures with transforming growth factor beta (TGF- β ) and the subsequent epithelial-mesenchymal transition (EMT). The imaging of dynamic cell cultures presents many challenges for holographic techniques due to the highly scattering and high speed nature of the environment. Here we report the algorithmic workflow we used for decreasing the imaging noise due to the presence of cell medium and achieving high speed reconstruction rates in real time. We also report the prominent morphological features we extracted from the obtained depth maps throughout the experiment. We conducted experiments on four different cell lines: ONCO-DG1, HCT-116, MDA-MB-231, and HUVEC. We observed the EMT process throughout a 48 h period after treatment with TGF- β with 6 h intervals for each sample. We show some examples of the reconstructed depth maps of tumor cells during the EMT phase. From these depth maps we extract some morphological parameters and report how they change after the EMT process is completed. The obtained results indicate that the proposed method presents certain advantages from an optical perspective particularly for applications where a dynamical medium is present. These advantages are lower signal-to-noise ratio (SNR) values and a simple setup compared to the setups used in similar studies. Future studies on this application could lead to the development of a model for the EMT process and its effects on cell to cell interactions.

1. Introduction

Biological specimens are often highly transparent and differ only slightly from their environment in terms of light permeability. This renders them hard to image via standard light microscopy techniques and necessitates the use of phase-imaging methods to obtain information about their morphology. While phase-contrast microscopy techniques allows the phase information to be observed, it does not give the quantitative measurements that is critical for cell research [1]. Interferometric techniques such as the digital holographic microscopy (DHM) method are the most promising methods of observation in this regard. They allow for the accurate quantitative measurement of cell morphology [2], a highly adaptive focusing methodology [3], and they hold potential for imaging deep inside living tissues [4,5]. Imaging of cell cultures is an indispensable part of cell research and is one of the primary application areas of the digital holographic microscopy method. In recent studies, two-dimensional cell culturing methodology is being replaced by the three-dimensional (3D) dynamic cell culture methodology which presents a more similar environment to the human body for the cells in the culture [6]. 3D visualization via the DHM methodology may have some problems to deal with because of the scattering nature of the tissue and noises introduced by the medium flow in the fluidic chips.
Morphological analysis of cells in vitro has been studied widely before. An early study by Carl et al. used a discrete Fresnel transformation for the automatic parameter selection for a DHM method which was used for high-resolution living cell analysis [7]. Bukowska et al. used a time domain optical coherence approach for the assessment of the flow velocity of red blood cells [8]. A following study by Zakrisson et al. used the Rayleigh–Sommerfeld backpropagation method for the identification of the shape of a given cell [9]. A more recent study by Lam et al. used telecentric DHM to obtain quantitative phase maps of MDA-MB-231 cells to assess their motility characteristics [10]. Similar studies that investigate cellular processes based on DHM methodology can be found in the literature [11,12,13]. However these studies use polystrene beads in their experiments and there is no medium that interfered with the light. The presence of a cellular medium creates significantly more complex scattering patterns and renders the backpropagation of the scattered light harder [14]. However, in real-life applications, cell cultures are almost always examined in cellular mediums which requires the proposed methodologies to be robust to these noises. To the best of our knowledge, there exists no study that investigates and compares different noise reduction methodologies for eliminating interferometric noises in cellular mediums.
A recent study by Lam et al. is based on a singular value decomposition (SVM) classifier on the phase features of cancer cells to score and classify cells according to their morphologies [15]. They used a Mach–Zehnder-based optical method to obtain the height maps of epithelial (Gie-No3B11) and fibroblast (human gingival) cell lines, as well as MDA-MB-231 and MCF-7 breast cancer cell lines. They used linear SVMs as binary classifiers of the non-cancerous cells that graded the cancer cells by transfer learning. The resulting classifier was able to classify epithelial and mesenchymal cells with about a 96% accuracy.
In this study, we propose an interferometric measurement method for the observation of the epithelial-mesenchymal transition process. A phase-stepping Mach–Zehnder-based optical setup is employed to obtain a reconstruction of the phase information inside a dynamic cell culture. To this end, we use a high frequency piezo actuator and a coupled high speed complementary metal oxide semiconductor (CMOS) camera sensor. The piezo motor is used for phase stepping and the integrated CMOS sensor captures the interferogram synchronously with the motion of the actuator. The latest captured interferograms are then used to reconstruct the depth map using the Fresnel transformation method as proposed by Yamaguchi et al. [16]. This methodology provides better noise cancellation in real-time compared to state-of-the-art methods. This ability enables us to monitor live cells without compromising their viability in real time. Using the proposed methodology, we were able to monitor the epithelial to mesenchymal transition of different cell cultures and report the morphological transformations experienced during this process. We used four different cell lines during the experiments: HCT-116, ONCO-DG-1, MDA-MB-231, and HUVEC. The observation of the cell cultures are done over the course of 48 h after treatment with the TGF- β growth factor. The TGF- β is known to induce the epithelial to mesenchymal transition process by acting as a tumor promotor. It has been shown in various studies that the application of TGF- β results in the delocalization, degradation, and downregulation of cell to cell junctions [17,18,19]. This in turn causes a loss in the epithelial functions and stimulates the metastasis process. A depth map of the sample is obtained every 6 h during this period and surface area, eccentricity and height parameters are calculated for each observation. We compare the changes in these parameters for each cell line. The primary motive of this study is to show the advantages of using quantitative phase imaging methods where the observation of morphological transformation of the sample is important. Obtained results indicate that cells become more spherical during this process which is attributed to the decrease in cells adhesive properties. The extraction of such morphological parameters will lead to a better understanding of the metastasis process. The proposed methodology allows such an observation for living cells in vitro.

2. Materials and Methods

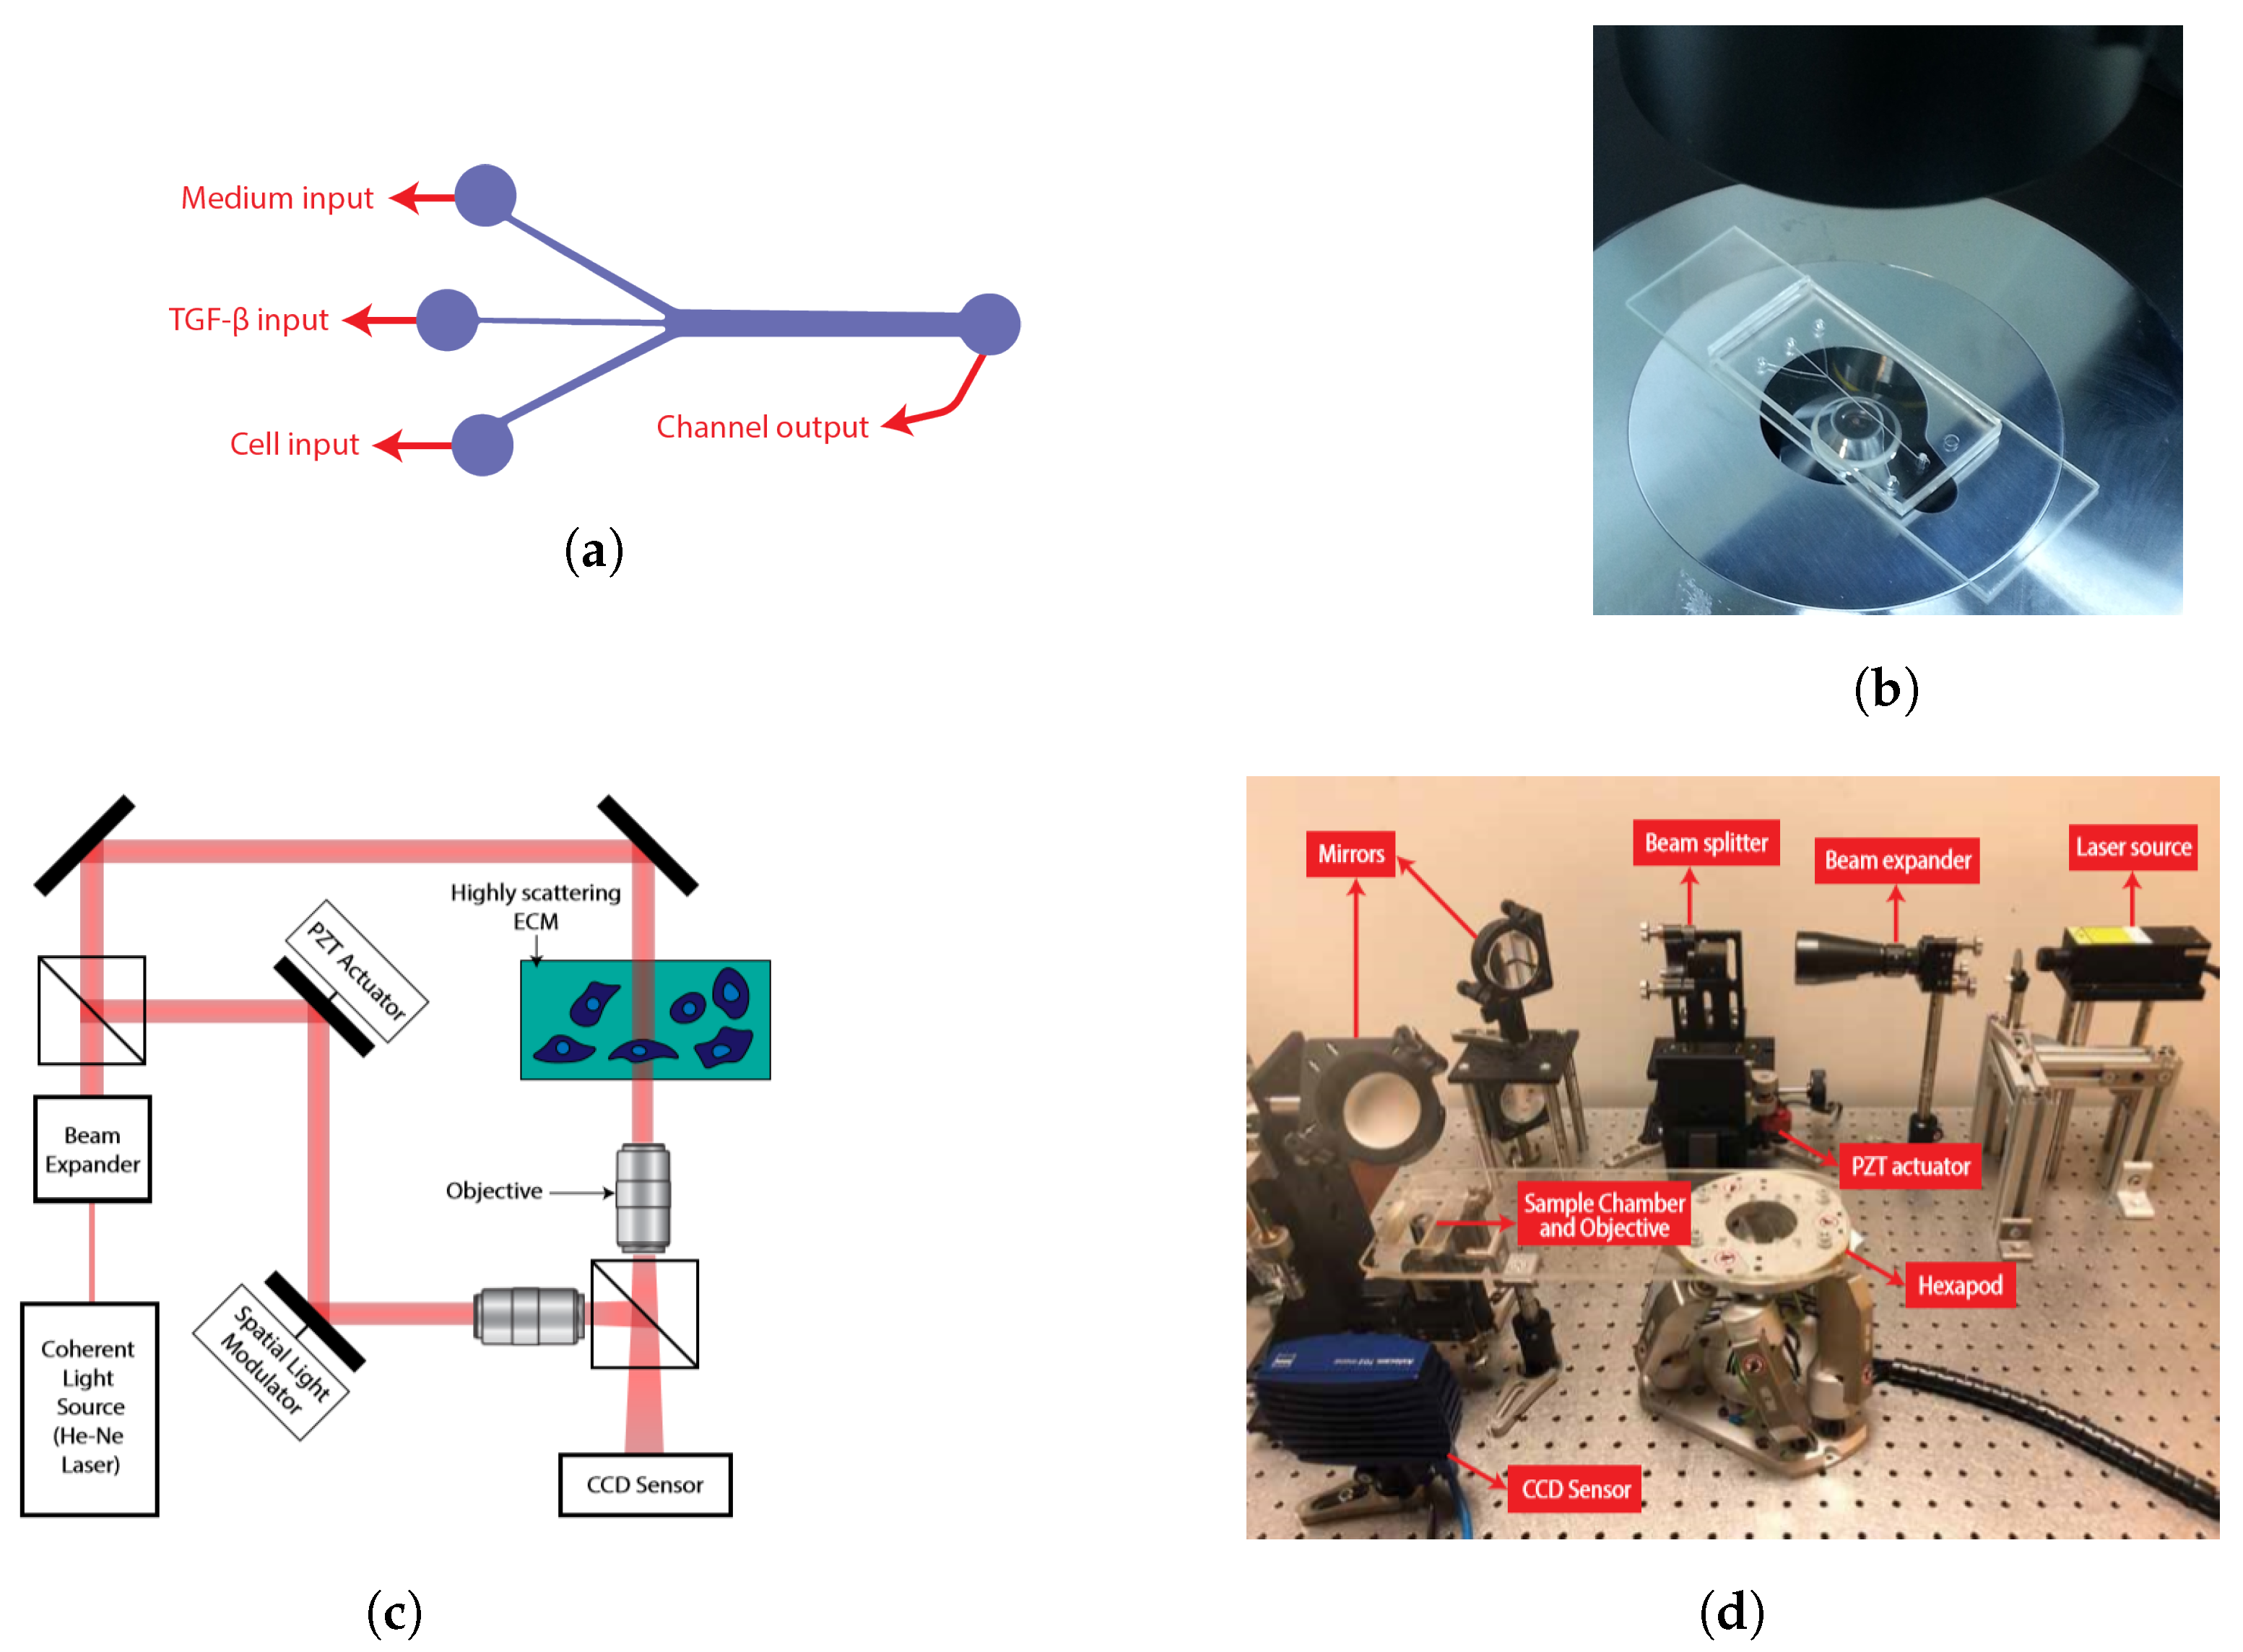
2.1. Cell Culturing and Manufacturing of Fluidic Chambers

A descriptive schematic of the used fluidic chip, in which the cells were cultured, is shown in Figure 1a. Three entrances of the fluidic chip were used for seeding the cells inside the channel, providing the cells with cellular medium and treating the cells with TGF- β respectively. The inlet channels had a thickness of 50 µm and a length of 5 mm, the main channel had a thickness of 150 µm and a length of 7 mm. The channel had a height of 250 µm. All inlets and the outlet had a diameter of 1 mm. Overall, the fluidic chip had a surface area of 1.8 × 106 µm2 and a volume of 4.5 × 108 µm3. The fluidic chip was fabricated by replica molding from an SU-8 (MicroChem)/silicon master based on a ratio of 10:1 to curing agent. The master mold was produced by ultraviolet (UV) lithography. After pouring polydimethylsiloxane (PDMS) on a mold, the mixture was degassed in a vacuum chamber for air bubble removal and cured at 80 °C for 1 h in the oven. Bonding to a glass slide was done after oxygen plasma of both surfaces and conformal contact (Harrick Plasma cleaner/sterilizer, 4 mbar, 120 s). Assembly quality control and characterization were done by optical 3D profilometry (VK-X250, KEYENCE, Germany). An image of the manufactured fluidic chip is shown in Figure 1b.
During the sample preparation procedure, cancer cells were suspended in their respective mediums with a density of 10 × 107 cells/mL, injected in the lower inlet of the fluidic chip using a syringe. Concentration of the cells inside the chip were 25,000 cells per cubic millimeter when the cells were first seeded. The cells were then left to incubate for 15 min in CO2 at 37 °C for cross-linking. Then, the fluidic chips were modified by polydopamine (Sigma-Aldrich, St. Louis, MO, USA) and 3-Aminopropyl triethoxysilane (Sigma-Aldrich) for immobilization of circulating tumor cells (CTCs). A homogeneous cell solution was added to the modified surfaces in a sterile environment. After 8 h, the modified surface was washed with cell culture medium and all non-adherent cells were removed. The cells were then cultured inside these fluidic chips for 24 h and subsequently treated with the TGF- β enzyme which starts the epithelial-mesenchymal transition process. After this process, the cell culture was observed throughout a 48 h period with 6 h intervals. The cells were only taken out of the incubator for imaging during the 48 h process. The imaging of a single sample took approximately 7 min and the cells were kept in sterile conditions in order to prevent apoptosis. The used cell lines were HCT-116, ONCO-DG-1, MDA-MB-231, and HUVEC. These cell lines were obtained from ATCC (American Type Culture Collection, https://www.atcc.org/) except for the ONCO-DG-1 cell line which was obtained from DSMZ GmbH (Deutsche Sammlung von Mikroorganismen und Zellkulturen GmbH, https://www.dsmz.de/). These cell lines were cultured in McCoy’s 5A, RPMI 1640, Leibovitz’s L-15, and DMEM-F12 mediums respectively.

2.2. Quantitative Phase Imaging Setup and Phase Reconstruction

Our holographic imaging setup is based on a phase shifting inline Mach–Zehnder interferometer. A schematic view of the setup is given in Figure 1c. As a coherent light source, we used a 527 nm, 10 mW He-Ne laser. A high-frequency piezo actuator (New Focus, Irvine, CA, USA, Picomotor 8302) actuated in 1000 steps per second was used for phase-stepping. We developed an algorithm for real-time holographic reconstruction using a continuously shifting piezo actuator and a high speed CMOS camera (ZEISS, Oberkochen, Germany, AxioCam 702 mono). The CMOS camera was synchronized to the motion of the piezo actuator and at each step captured an image. For each frame, we predicted the phase difference between the last two consecutive frames and used the last period of the captured interferograms for holographic reconstruction. Our method is particularly advantageous for dynamic cell cultures where the present fluid flow creates transient deformations in the fringe patterns. In addition, the noise due to commonly-used cell culture containers can be decreased by using several types of filtering algorithms. A watershed algorithm was then applied, based on superpixel segmentation algorithm to continuously track the morphological evolution of individual cells and evaluate the morphological transition during the EMT phase [20]. Assembled experimental setup can be seen in Figure 1d.
The intensity distribution of a given interferogram obtained from the Mach–Zehnder interferometer can be expressed as follows [21]:
I i j = A i j + B i j cos ( θ j + δ j )
where i represents the ith phase-shifted interferogram ( i = 1 , 2 , , M ) and j denotes the individual pixel locations in each image ( j = 1 , 2 , , N ). Here A i j is the background intensity, B i j is the modulation amplitude, Φ j is the angular phase information, and δ i is the phase-shift amount of each frame.
We assume that the background intensity and modulation amplitude does not have intraframe variation, which is a reasonable assumption under stable imaging conditions. Then, Equation (1) can be expressed as [17]:
I i j t = a j + b j cos ( δ j ) + c j sin ( δ j )
by defining a j = A i j , b j = B i j cos ( Φ j ) , and c j = B i j sin ( Φ j ) . Using M images and N pixels we can use an over-determined least-squares method to solve for the unknown variables. The least-squares error S j can be written as:
S j = i = 1 M ( I i j t I i j ) 2 = i = 1 M ( a j + b j cos ( δ i ) + c j sin ( δ i ) I i j ) 2
where I i j is the experimentally measured intensity of the interferogram.
Least-squares criteria can be written as:
S j a j = 0 , S j b j = 0 , S j c j = 0 ,
which yields:
{ X j } = [ A ] 1 { B j }
where,
A = M i = 1 M cos δ i i = 1 M sin δ i i = 1 M cos δ i i = 1 M cos 2 δ i i = 1 M cos δ i sin δ i i = 1 M sin δ i i = 1 M sin δ i cos δ i i = 1 M sin 2 δ i
{ X j } = { a j b j c j } T ,
{ B j } = i = 1 M I i j i = 1 M I i j cos δ i i = 1 M I i j sin δ i T .
From these equations, the unknowns a j , b j and c j can be solved using:
Φ j = t a n 1 ( c j / b j )
Additionally, the amplitude term is found as,
D j = ( i = 1 N I i j ) / N Δ 2
where
Δ = ( i = 1 N I i j N 1 ) .

2.3. Noise Reduction Methodology

In order to reduce the noise content of the reconstructed depth maps, different filtering techniques are applied and the obtained results are compared. Particularly, we compared the wavelet based filtering approaches and a BM3D-based filtering approach. Our approach was to apply these filters onto individual interferograms and obtain a reconstruction from the filtered set of interferograms. To demonstrate the validity of our noise reduction method, we estimated the depth maps for a reference slide (Malvern, Cambridge, UK, PVS 5113) and reference beads (Thermo Scientific, Waltham, MA, USA, 4K100). These reference objects have pre-defined shapes and are suitable for measuring the error rates of the obtained depth maps.
While measuring the noise content of the cell cultures, we had to follow different techniques since the ground truth depth information was not available. We conducted experiments on four different cell lines: ONCO-DG1, HCT-116, MDA-MB-231 and HUVEC. To measure the effectiveness of the noise reduction method, for each observation we capture the culture twice, once with the medium flow and once after the medium flow stopped and the remaining medium was withdrawn from the system. This allowed us to evaluate the noise introduced by the fluid flow. After the observation, the medium flow started again so as not to disturb the dynamic culture.

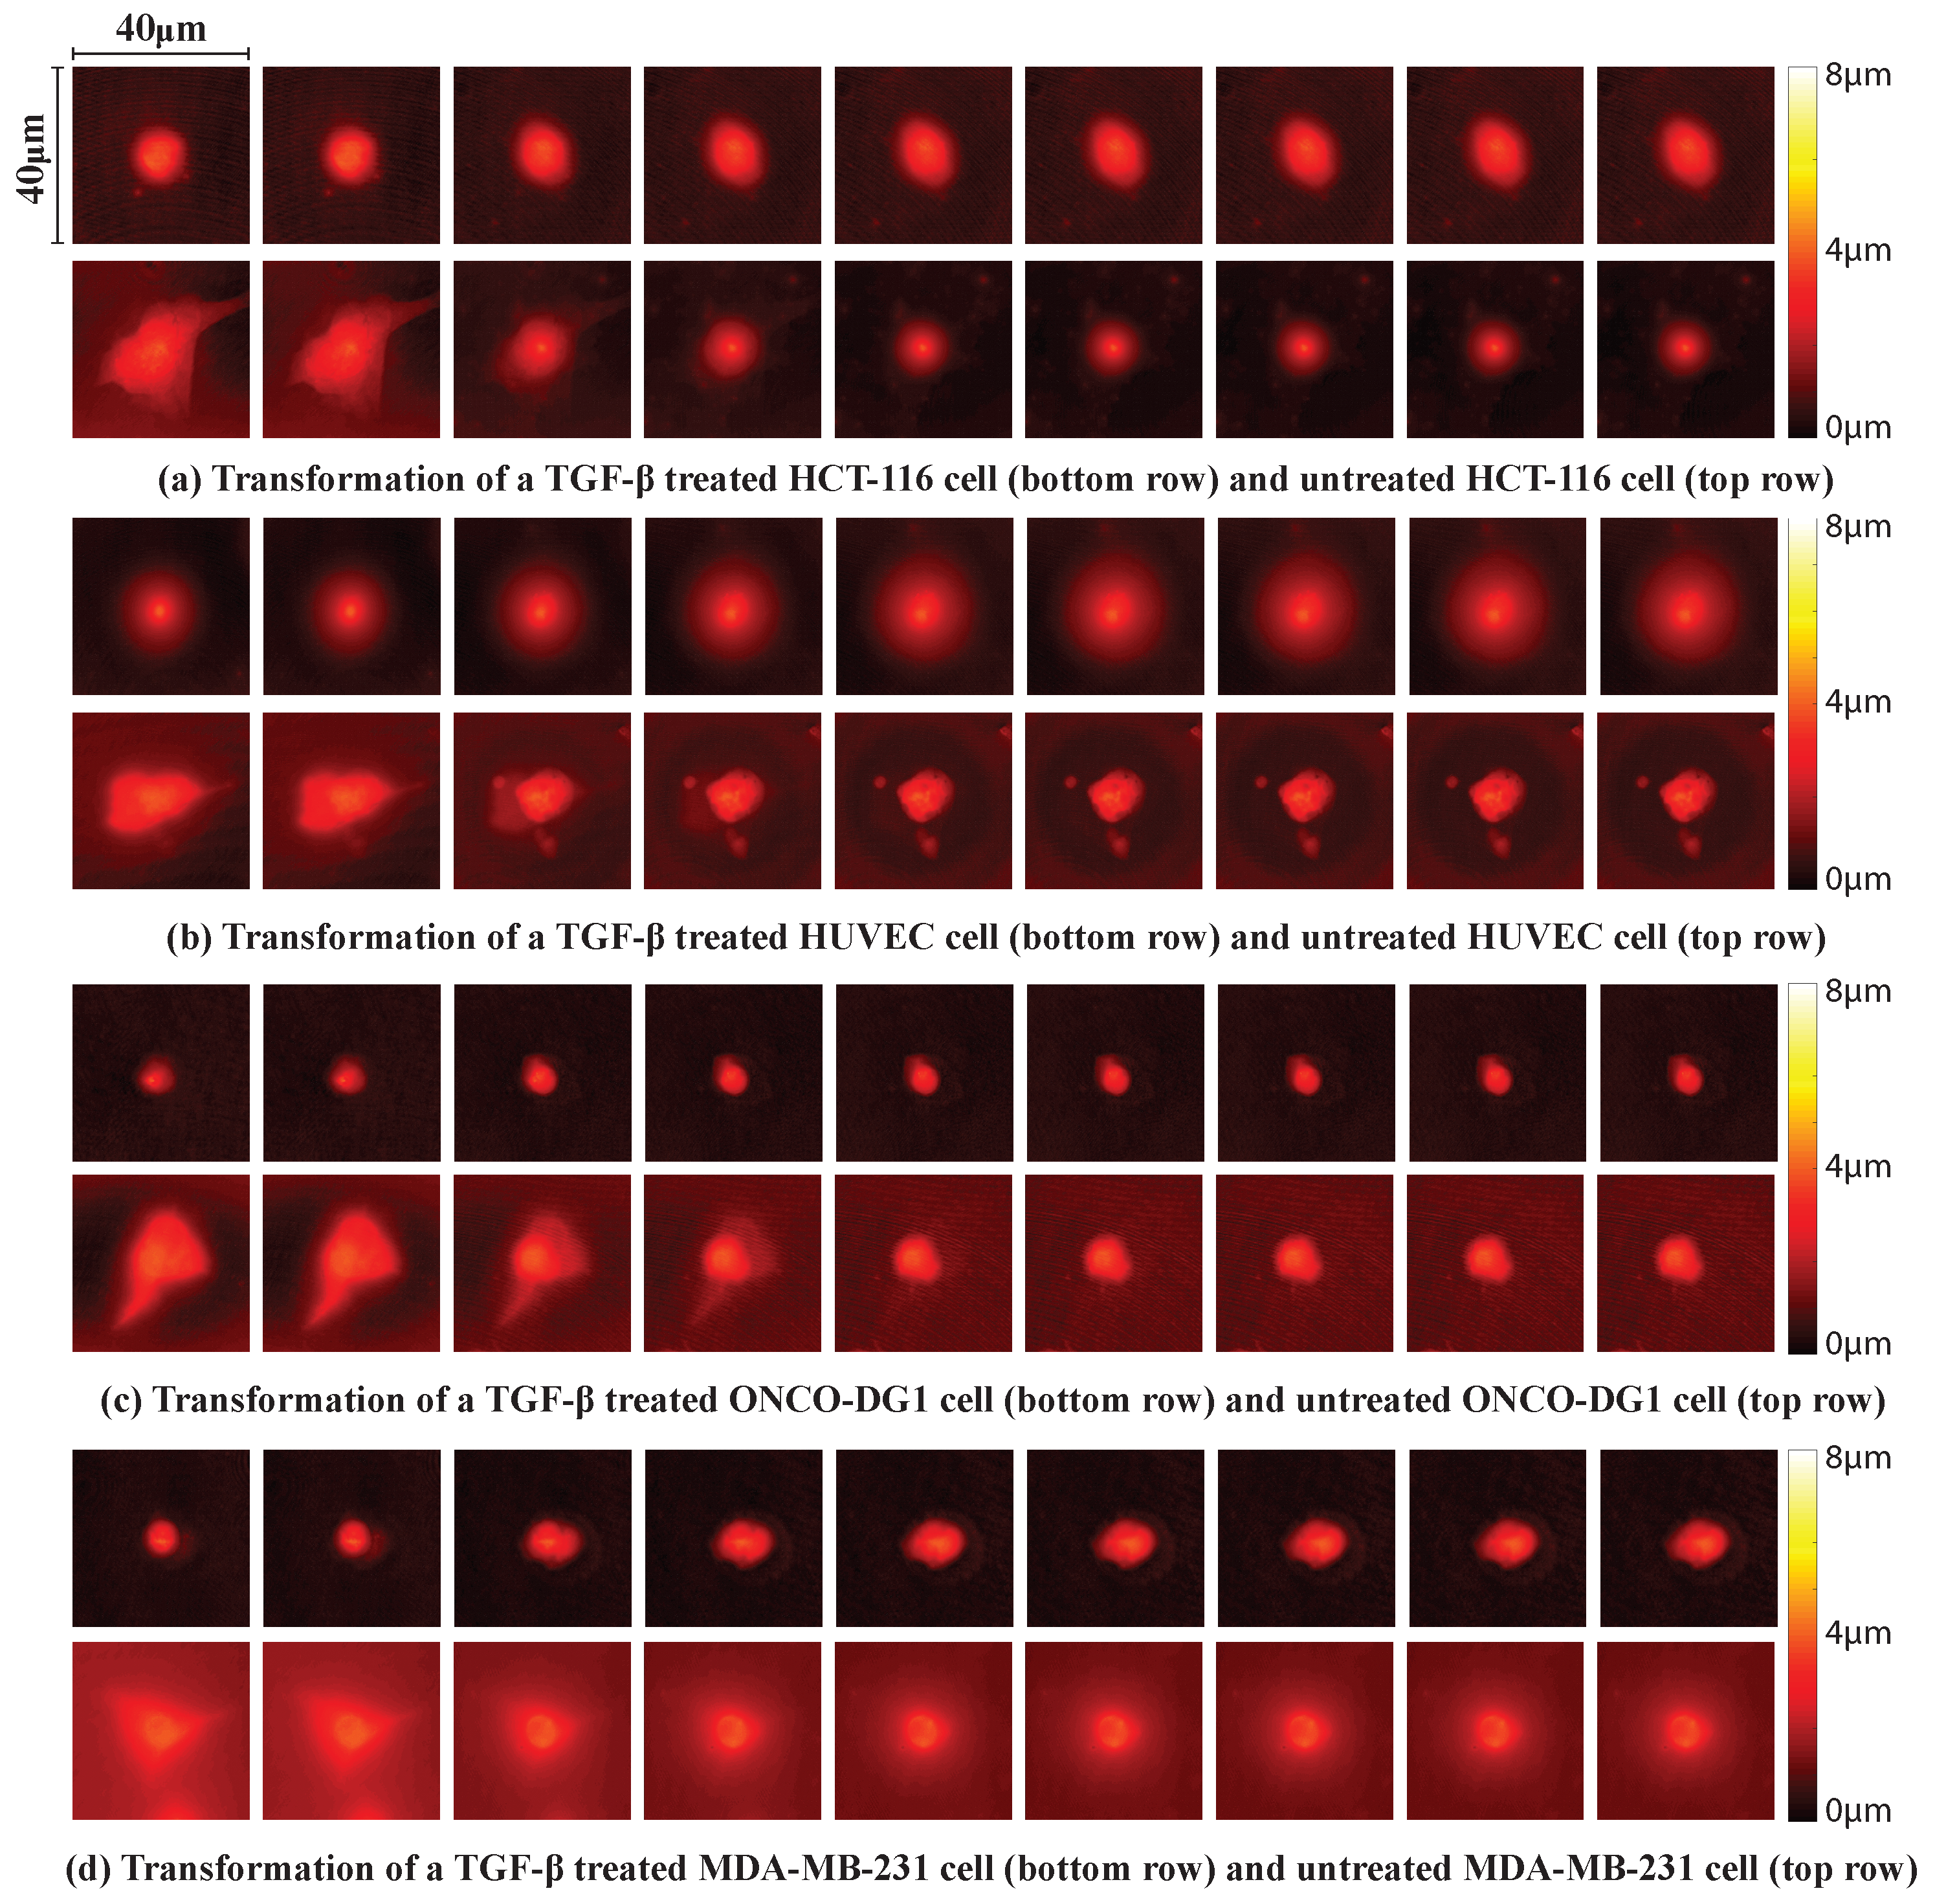
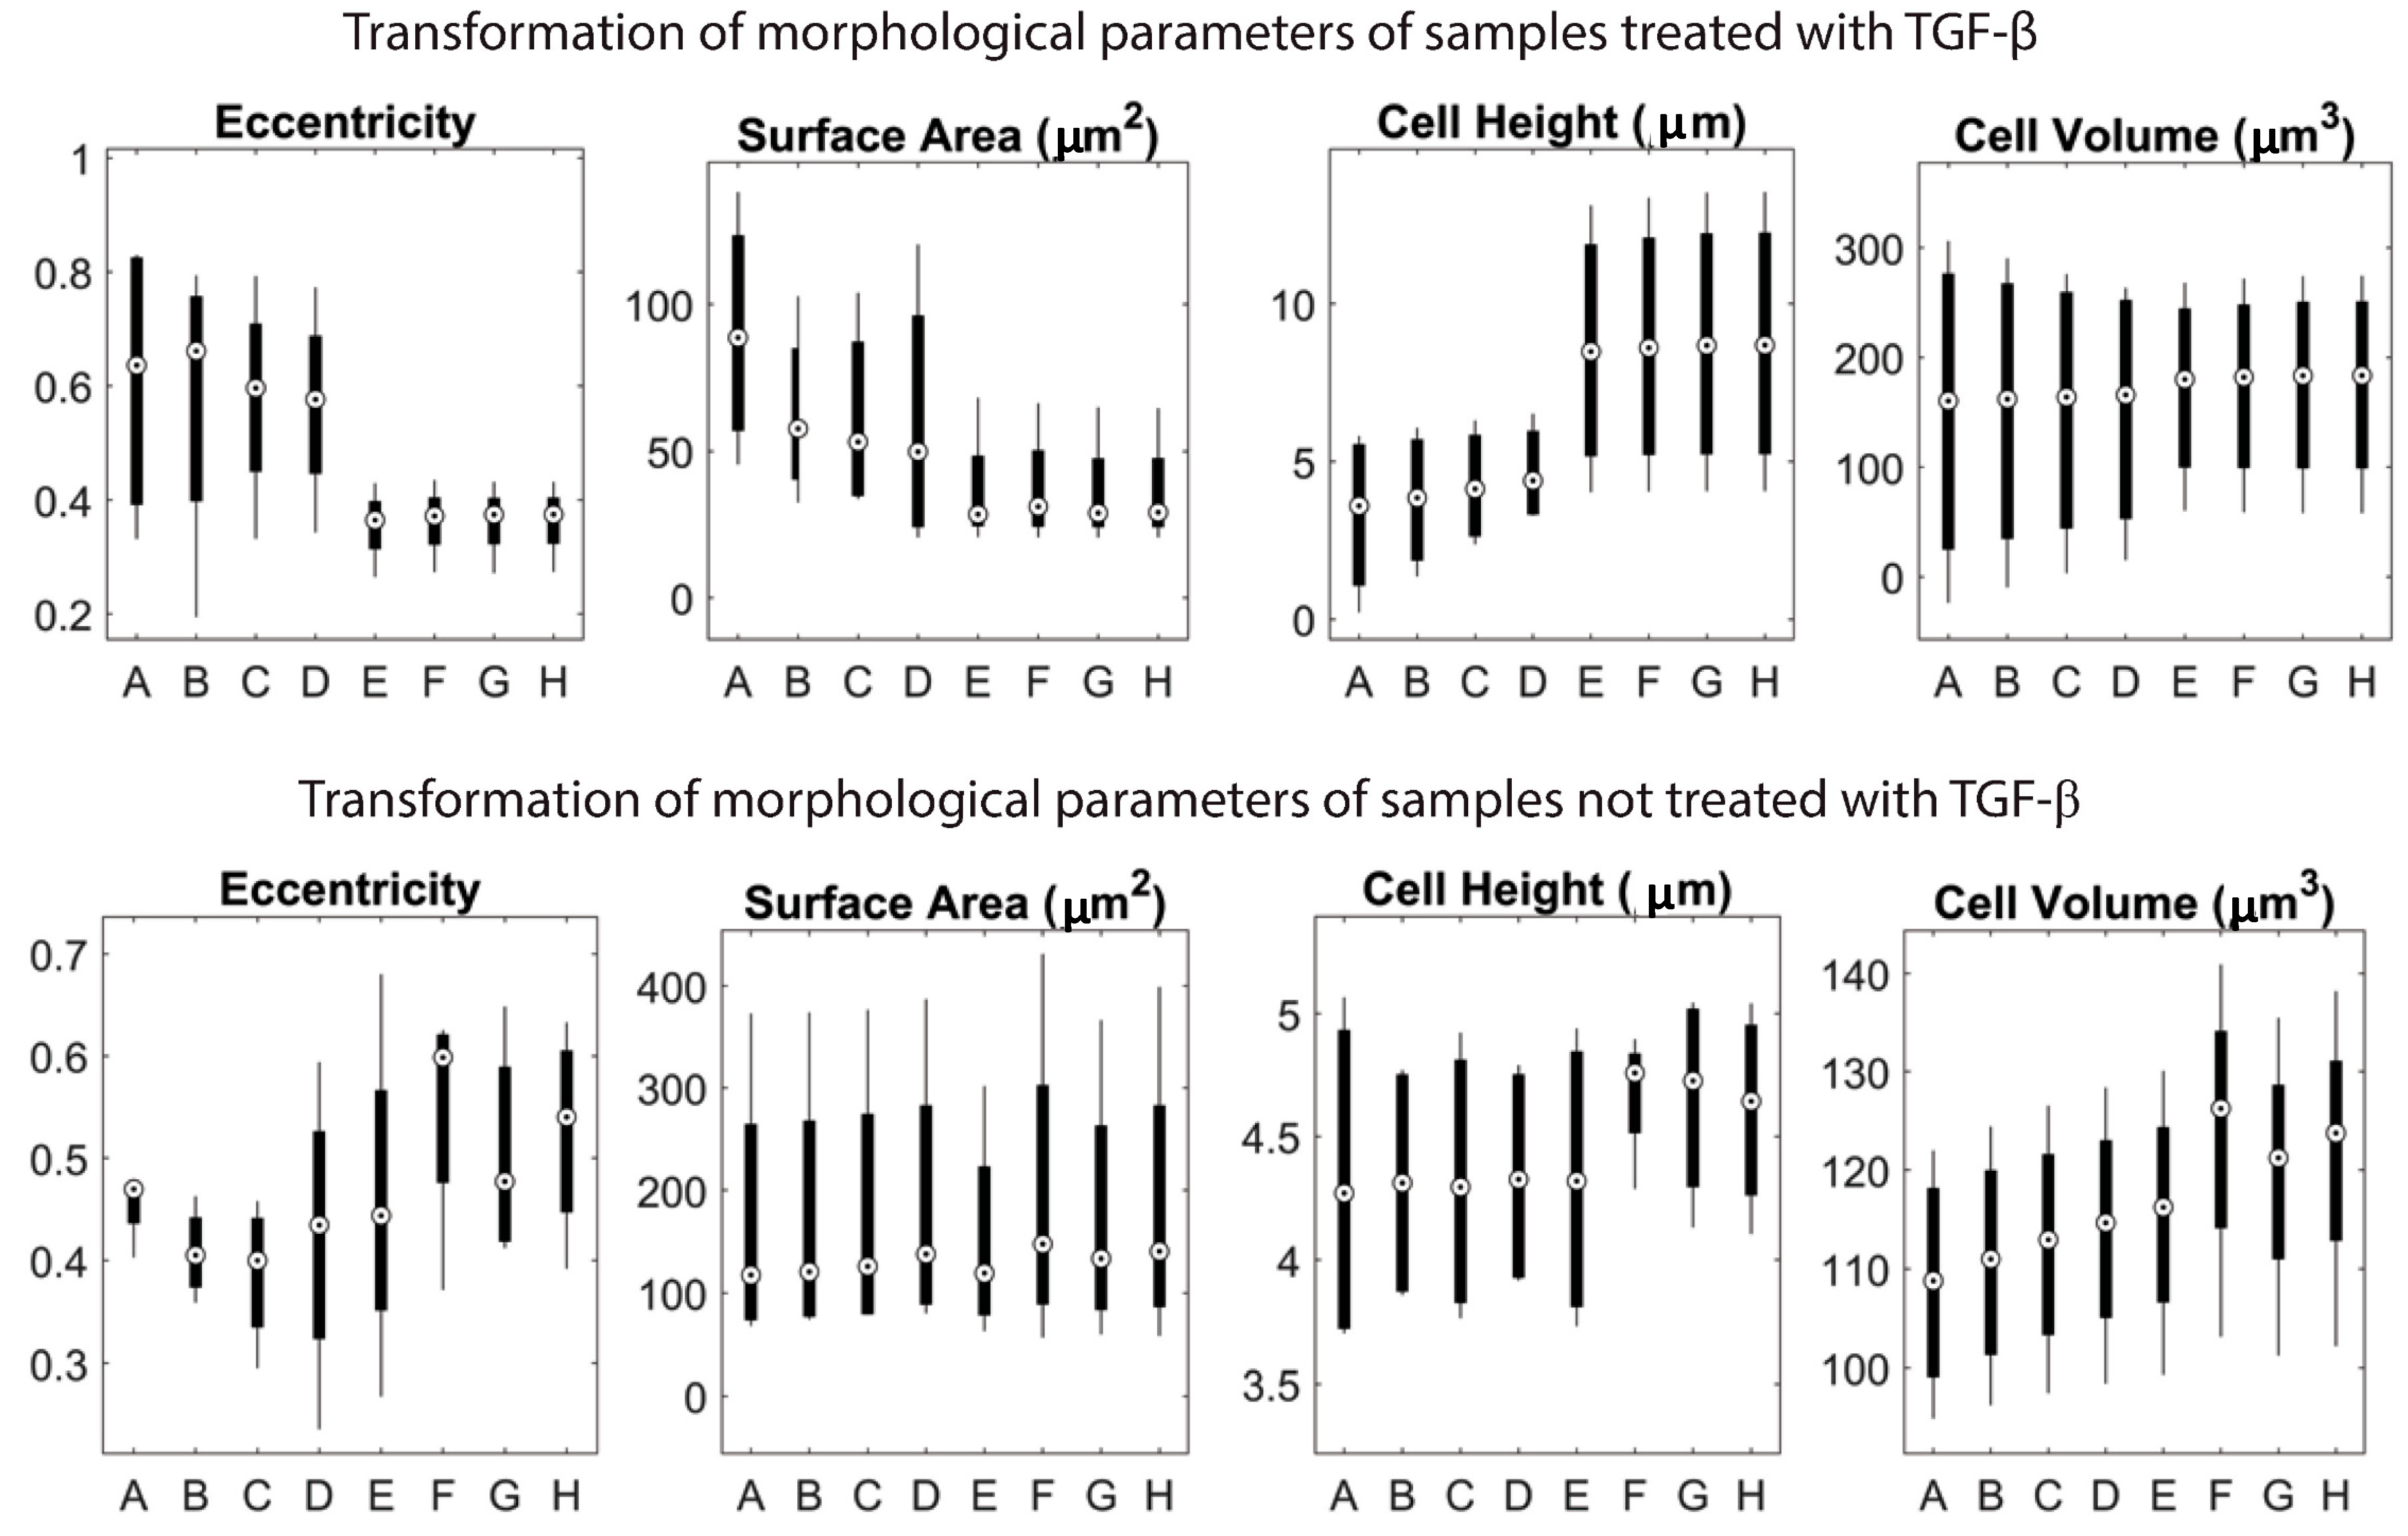
3. Results and Discussion

We conducted experiments on four different cell lines: ONCO-DG1, HCT-116, MDA-MB-231 and HUVEC. For each cell line, 20 cells were observed for 48 h after treatment with TGF- β . After a reconstruction of the depth maps we applied the BM3D-based noise reduction method to decrease the noise due to fluid flow in the dynamic environment. To measure the effectiveness of the noise reduction method, for each observation we captured the culture twice, once with the medium flow and once after the medium flow stopped and the remaining medium was withdrawn from the system. This allowed us to evaluate the noise introduced by the fluid flow. After the observation, the medium flow started again so as not to disturb the dynamic culture. The obtained SNR values for different filtering methods are given in Table 1 for the microbeads and the reference slide and in Table 2 for the cell cultures. It was observed that the best performing noise reduction strategy was the BM3D-based method in all of the cases.
Using a Watershed transform-based segmentation method, we resolved the cell depth map from background and show that modified surface structures increase the ability of CTCs to cling to a flat surface and hinders its mesenchymal characteristic. The results obtained by our method clearly shows the morphological transformation of the epithelial cells throughout the EMT phase. During this phase, it can be seen that the surface adhesion capability of the cells diminish and morph into a spherical shape. It can also be observed that the mobility of the cells increased due to this transformation. The demonstrated application clearly shows that holographic imaging techniques present valuable information that gives insights into the physiological underlying nature of the behavioral patterns that cancer cells typically undergo. In order to better understand the morphological transformation that occurs during the EMT process, we reconstructed the depth map of the observed cells at 0, 12, 24, 36, and 48 h after treatment with TGF- β . These depth maps are given in Figure 2. In these depth maps, it is seen that the EMT process distorts the adherent form of the cells within the first 24 h. An important observation that can be made from these depth maps is that the variations in the shape of the mesenchymal cells are much more limited than their epithelial counterparts. For each cell line, the epithelial cells tend to be more elongated and flat. As they gained a more mesenchymal characteristic they gained a more rounded shape. An accurate measurement of this characteristic is the eccentricity value that is a measure of the circularity of a given shape. For each cells line, the mesenchymal cells had a lower eccentricity value. Along with eccentricity, the cell base surface area, cell height, and cell volume was measured for each sample as can be seen in Figure 2. A comparison of these parameters before and after the EMT process are given in Figure 3. The extracted morphological features indicate that each cell line transforms into a more spherical shape. The eccentricity value, which is calculated as the ratio of the largest and smallest lengths along the cells’ axes, decreased for each cell line after the treatment. A similar yet less significant decrease was observed in the cell surface areas. The surface area of a cell is one of the most important measures of its adhesive properties. This decrease indicates a significant drop in the adhesion capabilities of cells. In addition, the variation in the eccentricity and surface area values decreased. An increase in the measured cell height values was observed, however the variance also increased for these parameters. No significant change was observed in the cell volume parameter.

4. Conclusions and Future Studies

In this study we proposed an interferometric measurement methodology of the morphological transformation of epithelial cell lines during the epithelial-mesenchymal transition process. The problem is a well suited application of the digital holographic microscopy method due to the importance of precise measurement of the observed sample’s depth map. It is also an interesting problem from the perspective of cancer research which may help better understand the metastasis process. The results obtained in this study gives insights into the critical parameters that effect the EMT process. The results indicate that cells undergo a spherical morphology transition during this process which is attributed to the decrease in cells adhesive properties. The future studies on this application could lead to the development of a model for the EMT process and its effects on cell to cell interactions.

Author Contributions

Conceptualization, R.V., G.B.E. and H.U.; methodology, R.V. and G.B.E.; software, R.V.; validation, R.V. and G.B.E.; formal analysis, R.V. and G.B.E.; investigation, R.V.; resources, H.U.; data curation, R.V.; writing—original draft preparation, R.V.; writing—review and editing, G.B.E. and H.U.; visualization, R.V.; supervision, G.B.E. and H.U.; project administration, G.B.E. and H.U.; funding acquisition, H.U. All authors have read and agreed to the published version of the manuscript.

Funding

This work is funded by the Scientific and Technological Research Council of Turkey (TUBITAK) under project number 116E867.

Conflicts of Interest

The authors declare no conflict of interest.

References

  1. Zernike, F. Phase contrast, a new method for the microscopic observation of transparent objects. Physica 1942, 9, 686–698. [Google Scholar] [CrossRef]
  2. Marquet, P.; Rappaz, B.; Magistretti, P.J.; Cuche, E.; Emery, Y.; Colomb, T.; Depeursinge, C. Digital holographic microscopy: A noninvasive contrast imaging technique allowing quantitative visualization of living cells with subwavelength axial accuracy. Opt. Lett. 2005, 30, 468. [Google Scholar] [CrossRef] [Green Version]
  3. Langehanenberg, P.; Kemper, B.; Dirksen, D.; Von Bally, G. Autofocusing in digital holographic phase contrast microscopy on pure phase objects for live cell imaging. Appl. Opt. 2008, 47, D176–D182. [Google Scholar] [CrossRef]
  4. Wang, Y.M.; Judkewitz, B.; Dimarzio, C.A.; Yang, C. Deep-tissue focal fluorescence imaging with digitally time-reversed ultrasound-encoded light. Nat. Commun. 2012, 3, 928. [Google Scholar] [CrossRef] [Green Version]
  5. Liu, Y.; Lai, P.; Ma, C.; Xu, X.; Grabar, A.A.; Wang, L.V. Optical focusing deep inside dynamic scattering media with near-infrared time-reversed ultrasonically encoded (TRUE) light. Nat. Commun. 2015, 6, 5904. [Google Scholar] [CrossRef] [PubMed]
  6. Asghar, W.; El Assal, R.; Shafiee, H.; Pitteri, S.; Paulmurugan, R.; Demirci, U. Engineering cancer microenvironments for in vitro 3-D tumor models. Mater. Today 2015, 18, 539–553. [Google Scholar] [CrossRef] [PubMed]
  7. Carl, D.; Kemper, B.; Wernicke, G.; Von Bally, G. Parameter-optimized digital holographic microscope for high-resolution living-cell analysis. Appl. Opt. 2004, 43, 6536–6544. [Google Scholar] [CrossRef] [PubMed]
  8. Bukowska, D.M.; Derzsi, L.; Tamborski, S.; Szkulmowski, M.; Garstecki, P.; Wojtkowski, M. Assessment of the flow velocity of blood cells in a microfluidic device using joint spectral and time domain optical coherence tomography. Opt. Express 2013, 21, 24025. [Google Scholar] [CrossRef] [PubMed]
  9. Zakrisson, J.; Schedin, S.; Andersson, M. Cell shape identification using digital holographic microscopy. Appl. Opt. 2015, 54, 7442. [Google Scholar] [CrossRef] [PubMed] [Green Version]
  10. Lam, V.K.; Nguyen, T.C.; Chung, B.M.; Nehmetallah, G.; Raub, C.B. Quantitative assessment of cancer cell morphology and motility using telecentric digital holographic microscopy and machine learning. Cytom. A 2018, 93, 334–345. [Google Scholar] [CrossRef] [PubMed] [Green Version]
  11. Mihailescu, M.; Popescu, R.C.; Matei, A.; Acasandrei, A.; Paun, I.A.; Dinescu, M. Investigation of osteoblast cells behavior in polymeric 3D micropatterned scaffolds using digital holographic microscopy. Appl. Opt. 2014, 53, 4850. [Google Scholar] [CrossRef] [PubMed]
  12. Dubey, V.; Singh, G.; Singh, V.; Ahmad, A.; Mehta, D.S. Multispectral quantitative phase imaging of human red blood cells using inexpensive narrowband multicolor LEDs. Appl. Opt. 2016, 55, 2521. [Google Scholar] [CrossRef] [PubMed]
  13. Li, Y.; Di, J.; Wu, W.; Shang, P.; Zhao, J. Quantitative investigation on morphology and intracellular transport dynamics of migrating cells. Appl. Opt. 2019, 58, G162. [Google Scholar] [CrossRef] [PubMed]
  14. Hoang, V.T.; Stȩpniewski, G.; Czarnecka, K.H.; Kasztelanic, R.; Long, V.C.; Xuan, K.D.; Shao, L.; Śmietana, M.; Buczyński, R. Optical Properties of Buffers and Cell Culture Media for Optofluidic and Sensing Applications. Appl. Sci. 2019, 9, 1145. [Google Scholar] [CrossRef] [Green Version]
  15. Lam, V.K.; Nguyen, T.; Bui, V.; Chung, B.M.; Chang, L.C.; Nehmetallah, G.; Raub, C.B. Quantitative scoring of epithelial and mesenchymal qualities of cancer cells using machine learning and quantitative phase imaging. J. Biomed. Opt. 2020, 25, 1–17. [Google Scholar] [CrossRef] [PubMed]
  16. Yamaguchi, I.; Zhang, T. Phase-shifting digital holography. Opt. Lett. 1997, 22, 1268. [Google Scholar] [CrossRef] [PubMed]
  17. Xu, J.; Lamouille, S.; Derynck, R. TGF-β-induced epithelial to mesenchymal transition. Nat. Cell Res. 2009, 19, 156–172. [Google Scholar] [CrossRef] [PubMed]
  18. Hao, Y.; Baker, D.; ten Dijke, P. TGF-β-mediated epithelial-mesenchymal transition and cancer metastasis. Int. J. Mol. Sci. 2019, 20, 2767. [Google Scholar] [CrossRef] [PubMed] [Green Version]
  19. Wendt, M.K.; Allington, T.M.; Schiemann, W.P. Mechanisms of the epithelial-mesenchymal transition by TGF-β. Future Oncol. 2009, 5, 1145–1168. [Google Scholar] [CrossRef] [PubMed] [Green Version]
  20. Grau, V.; Mewes, A.U.; Alcañiz, M.; Kikinis, R.; Warfield, S.K. Improved watershed transform for medical image segmentation using prior information. IEEE Trans. Med. Imaging 2004, 23, 447–458. [Google Scholar] [CrossRef]
  21. Goodman, J.W. Introduction to Fourier Optics; Roberts and Company Publishers: Greenwood Village, CO, USA, 2005; p. 491. [Google Scholar]
Figure 1. (a) A descriptive figure of the used fluidic chip. Three entrances of the fluidic chip were used for seeding the cells inside the channel, providing the cells with cellular medium and treating the cells with TGF-β respectively. (b) An image of the manufactured fluidic chip. (c) A schematic view of the used digital holographic microscopy (DHM) setup. A 527 nm He-Ne laser is used as a coherent light source. The piezo motor is used for phase stepping and the integrated charge coupled device (CCD) sensor for capturing the interferogram which is synchronized with the motion of the actuator. (d) Our experimental setup based on a phase-stepping Mach–Zehnder interferometry. A 6-axis Hexapod is used to move the observed sample in the lateral axis in order to focus on different cells during a single experiment.
Applsci 10 09107 g001
Figure 2. A reconstruction of the depth maps for each cell line throughout a 48 h period in 6 h intervals. This figure show exemplary depth maps from (a) HCT-116, (b) HUVEC, (c) ONCO-DG1, and (d) MDA-MB-231 cell lines for 0, 6, 12, 18, 24, 30, 36, 42, and 48 h intervals respectively from left to right. All units of the axis scales are in µm. For each cell line, we observed a transformation to a more spherical shape, which indicates a decrease in the adherent characteristic of the cells. For each sample, A is the surface area of the cell in µm2, h is cell height in µm, and E is the eccentricity value which is unitless.
Applsci 10 09107 g002
Figure 3. Eccentricity, surface area, cell height, and cell volume parameters are calculated and summarized in these graphs. Samples treated with TGF- β are given at the top graphs and the control groups are given at the bottom graph. The labels A, B, C, and D labels respectively represent HCT-116, HUVEC, ONCO-DG1, and MDA-MB-231 cells before EMT and E, F, G, and H labels respectively represent HCT-116, HUVEC, ONCO-DG1, and MDA-MB-231 cells after EMT. For each cell line, the most notable morphological change was the decrease in the eccentricity and increase in cell height parameters. Also notable is the decrease in the variance in eccentricity and surface area values.
Applsci 10 09107 g003
Table 1. SNR values resulting from the application of different filters to depth maps obtained from microbeads and the reference slide.
Slide without
Medium
Slide with
Medium
Beads without
Medium
Beads with
Medium
Median filter35.6734.7835.7934.66
Wiener filter37.7837.2337.9037.12
Haar37.1235.6437.3435.76
Daubechies37.8937.8937.9237.02
Symlets39.1238.5639.1938.43
Biorthogonal37.9636.5437.8836.34
Noiselets38.8737.9138.8937.72
Fresnelet39.4538.0339.2538.23
Beamlet38.7937.9938.5537.79
Coiflet38.8537.1539.0037.27
Discrete Meyer37.7537.0438.1437.14
Table 2. SNR values resulting from the application of different filters to depth maps obtained from cell cultures.
HCT-116ONCO-DG-1HUVECMDA-MB-231
Median filter34.6734.6234.8633.80
Wiener filter36.7836.6636.7035.69
Haar36.1235.9835.9934.87
Daubechies36.8936.7536.8635.81
Symlets38.1237.9238.2337.06
Biorthogonal36.9636.7837.0636.03
Noiselets37.8737.7638.0536.92
Fresnelet38.4538.3038.2837.10
Beamlet37.7937.6737.8136.63
Coiflet37.8537.7237.8036.75
Discrete Meyer36.7536.5736.6835.63
BM3D filter39.0238.9738.9637.80
Publisher’s Note: MDPI stays neutral with regard to jurisdictional claims in published maps and institutional affiliations.

