1. Introduction
Worldwide cement production in 2019 was 4.2 billion metric tons, while China alone produced 2.2 billion metric tons and India 320 million metric tons. Overall cement production is estimated to increase from 3.27 billion metric tons in 2010 to 4.83 billion metric tons by 2030 [
1]. Cement production is responsible for about 8% of the anthropogenic CO
2 emissions [
2]. The Intergovernmental Panel on Climate Change (IPCC) proposes that global anthropogenic CO
2 emissions need to lower by 45% from 2010 by 2030 to limit global warming to 1.5 °C [
3]. The use of alkali-activated materials (AAM) can reduce CO
2 emissions up to 80% compared to Portland cements materials by using blast furnace slag (BFS) or fly ash (FA), among other precursors [
4].
In 2018, the steel industry’s worldwide slag production was around 600 million tons, of which 58% was BFS, and 42% was steelworks slag [
5]. Recycling BFS in developed countries (e.g., Germany) is nearly 100%, but utilization rates differ from country-to-country [
5]. In developed countries, changing construction procedures to more innovative processes is very difficult because the inertia of the construction industry is set, and there is no growing market, unlike developing countries. This represents a golden opportunity to develop a more ecological construction industry in developing countries by increasing BFS use in construction and reducing CO
2 emissions by lowering Portland cement production. The use of BFS for AAM applied to structures being used is already a reality in countries like Australia [
6].
Alkali-activated slag (AAS) as cementing material was first investigated in the 1930s by Khul, a German researcher [
7]. Later, AAS was further studied in the former Soviet Union by V.D. Glukhovskii in the 1950s, with the first application in 1958, which was formally patented in 1974. Many eastern European countries and China undertook many projects with AAS (road slabs, air-field runways and precasting) in the 1970s and 1980s with excellent durability [
8,
9]. In the 1980s, the term geopolymer was introduced by Davidovits [
10], who first mixed alkali with a calcined mixture of kaolinite, limestone and dolomite. In the 1990s, when environmental concerns surged, interest in AAM increased because these materials can reduce CO
2 emissions [
4,
11,
12]. In 1996, Shi published one of the first scientific papers to assess the strength, porosity and permeability of AAS mortar activated with different activators (NaOH, Na
2SiO
3 and Na
2CO
3) [
13]. This author concluded that the mortars activated with Na
2SiO
3 presented the highest strength, the lowest porosity and the finest pore structure. Fernández-Jiménez et al. [
14] studied the influence of various factors, such as specific slag surface, curing temperature, activator concentration and the nature of activators. They concluded that an alkaline nature was the most significant factor in obtaining better mechanical strength. The best-employed activator as a mixture of Na
2SiO
3 and NaOH to obtain mortars with compressive strength values over 100 MPa and flexural strength at around 12 MPa.
BFS was classified as a moderately calcium-rich material that can be activated under relatively moderate alkaline conditions [
15]. The main reaction products are gels CSH (calcium silicate hydrate) and CASH (calcium silico-aluminate hydrate), with the minor formation of hydrotalcite and some zeolites like gismondine [
15,
16]. Generally speaking, the most widely used activators are NaOH and Na
2SiO
3, or a mixture of both. For the BFS system, optimal pH values are around 13–13.6, and the addition of Na
2SiO
3 normally causes greater development of mechanical strength compared to those systems activated with only NaOH. The silicate source reacts with Ca
+2 from dissolved slag to form denser products [
16].
The use of Na
2CO
3 instead of other activators can be an environment-friendly and economical alternative for developing countries because it is 2–3 times cheaper than Na
2SiO
3 and NaOH [
17]. Awoyera and Andesina [
18] made a review on the application of alkali-activated slag and also considered Na
2CO
3 the most appropriate activator. However, the long setting time and/or slow strength development make their use less appealing than the other activators [
17]. Combining Na
2CO
3 with other activators can improve AAS performance. For example, the use of MgO and Na
2CO
3 mixture improves early strength and drying shrinkage in relation to those mortars that use only Na
2CO
3 as an activator [
19]. Ke et al. [
20] studied the effectiveness of employing calcined-layered double hydroxides to control the kinetics reaction of slags activated with Na
2CO
3. These authors concluded that the addition of this reagent resulted in a faster setting and a better hardening process. Kovtun et al. [
21] explored the use of NaOH, Portland cement, and a mixture of silica fume and slaked lime as accelerators for systems BFS-Na
2CO
3. Employing accelerators brought about an enhancement of 12 MPa in the mortars cured for 48 h vs. the control mortar.
The majority of recent AAS research works have been conducted in developed countries rather than developing AAS to be used in developing countries with specifications of high-level technology and many material resources, especially chemical reagents. This paper aims to formulate an AAS that adapts to the specificities of developing countries, which exhibits rapid urbanization and considers local human and materials resources and existing infrastructures; for example, Sub-Saharan Africa. The ONU memberships formulated the Sustainable Development Agenda and included 17 Sustainable Development Goals (SDG) to protect the planet and to eradicate poverty [
22]. SDG 11 proposes making cities inclusive, safe, resilient and sustainable, while SDG 13 is about climate action and claims regulating CO
2 emissions. To this end, AAS was formulated to be used in precasting as blocks or tiles that take into account the specifications of developing countries.
The present paper investigates employing NaOH, Na2CO3, and a mixture of both to prepare mortars with BFS as a precursor and preparing AAM to be utilized in developing countries.
2. Materials and Methods
The BFS herein used was provided by Cementval SL (Puerto de Sagunto-Valencia, Spain). BFS was dry-milled in a ball mill for 30 min (450 g of BFS were milled with 98 alumina balls). The commercial reagents (NaOH and Na2CO3) were supplied by PANREAC QUIMICA SLU (Barcelona, Spain).
Some characteristics of the used BFS are detailed using techniques like XRF (X-ray fluorescence) or FESEM (field emission scanning electron microscopy).
The chemical composition of BFS was measured in a Magix Pro spectrometer (Philips) by the XRF technique.
Table 1 provides the oxide composition per weight percent (wt %).
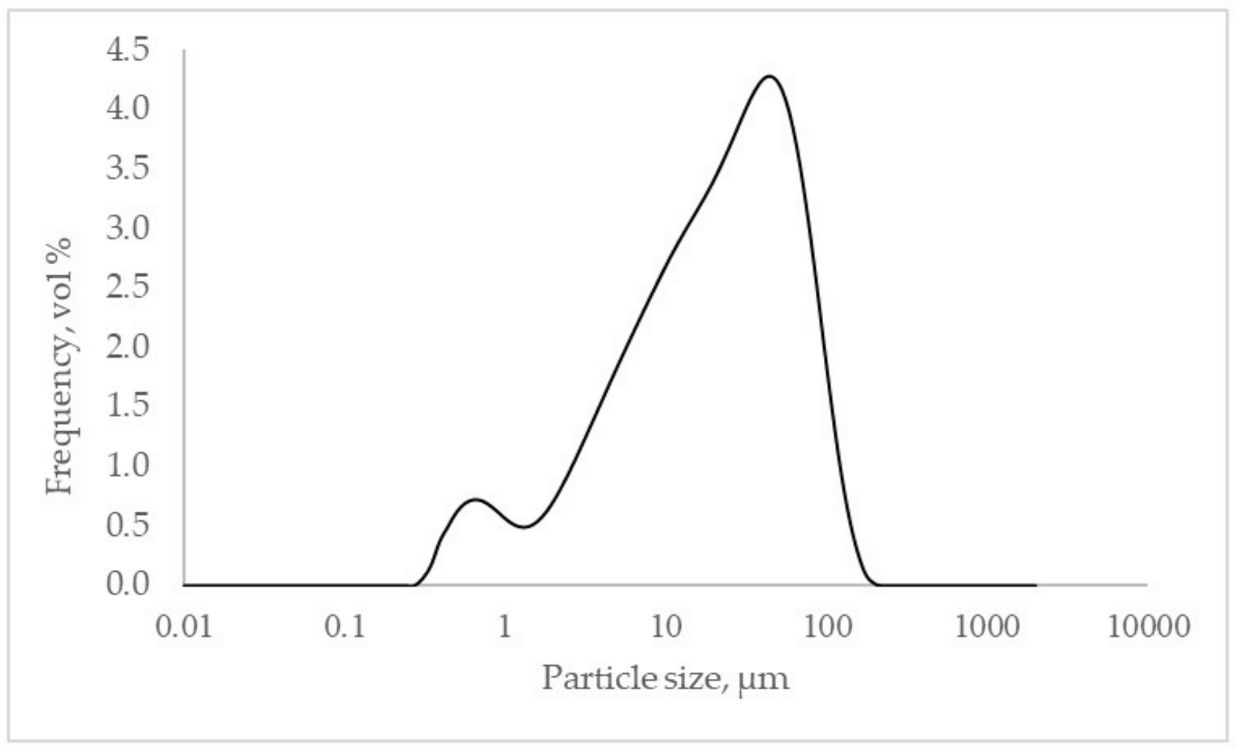
The equipment used to measure granulometric distribution was a Mastersizer 2000 (Malvern Instruments, Malvern, UK). The technique followed by the equipment was laser diffraction. BFS was dispersed in water and stirred at 1200 rpm by applying a 1-min ultrasound before measurements. The milled BFS presented a unimodal curve with a narrower shoulder of particles below 1 µm (
Figure 1).
Brucker AXS D8 (Billerica, MA, USA) Advance equipment was employed to carry out X-ray diffraction (XRD) analyses. The range went from 5 to 70 2θ degrees using Cu Kα radiation at 20 mA and 40 kV, with a 2 s accumulation time and a 0.02 angle step. The XRD diffractogram of BFS is represented in
Figure 2. The halo located within 20–35 2θ degrees was attributed to the amorphous phase of BFS. A crystalline phase attributed to the presence of calcite (C, CaCO
3, PDF#050586) can also be observed.
Finally, the morphology of the milled BFS was observed by FESEM. The equipment employed was ULTRA 55 ZEISS equipment. BFS was carbon-coated to observe it, and the image was taken at 2 kV. The micrograph of the BFS particle morphology is represented in
Figure 3. The milled BFS presented an irregular morphology with different size particles as a result of the milling process.
Two types of alkali activators were used: NaOH, Na
2CO
3, and a mixture of both. The samples activated with only NaOH were called SH, and the chosen molarities were 3, 4 and 5 M. The samples activated with Na
2CO
3 were named SC, and the chosen molarities were 1.5, 2, 2.5, 3 and 3.5 M. Finally, the samples that used the mixture of two reagents were called SHC, and the chosen molarities differed for both products. For example, the mixture named SHC 2/1 had molarity of 2 M for NaOH and a molarity of 1 M for Na
2CO
3. All the combinations of activators are represented in
Table 2. In this research, mortars were prepared at a BFS/sand weight ratio of 1:3 (450:1350 g) and at a BFS/water ratio of 0.4 (180 g of H
2O). The humidity of the natural siliceous sand (from the company Caolines Lapiedra, Liria, Valencia, Spain) was less than 1% with a specific weight of 2.71 ± 0.15 g/cm
3. Mortars were cast in 4 × 4 × 16 cm
3 molds.
Mortars were cured in a conditioned chamber (at 20 °C, 100% RH), demolded after 24 h, weighed and returned to the conditioned chamber until mechanical testing commenced (7, 28 and 90 curing days), which was performed in a universal Instron Model 3382 machine with the charge rate set at 1 mm/min according to EN 196-1 [
23].
Microstructural analyses were done only on some selected pastes (without sand) cured under the same conditions as mortars. On the testing day, the hardened paste was ground, submerged in acetone to stop hydration reactions, and were filtered and dried for 30 min at 65 °C before being passed through a 125 µm sieve. For the microstructural analysis of XRD, thermogravimetry (TG) and Fourier-transform infrared spectroscopy (FTIR) was performed. The XRD and FESEM equipment are previously described. The TG analysis was run in a Mettler Toledo TGA 850 module. Samples were placed in alumina crucibles with sealed lids and heated from 50 °C until 1000 °C at a heating rate of 20 °C/min in an open-air atmosphere. The FTIR analysis was conducted in a Brucker model Tensor 27 spectrometer (medium infrared rank from 7800 to 370 cm−1). In the present work, the analysis rank went from 2000 to 400 cm−1.
As both the economic and environmental aspects play one of the most important roles for the present research work, a detailed study was conducted. The cost and kgCO2 emissions of the activators per ton of the prepared mortar (€/kg), and mechanical behavior (€/ton × MPa), were determined. The results obtained for the selected assessed mortars allowed us to compare the use of the different activators herein studied.
3. Results
3.1. Mechanical Strength
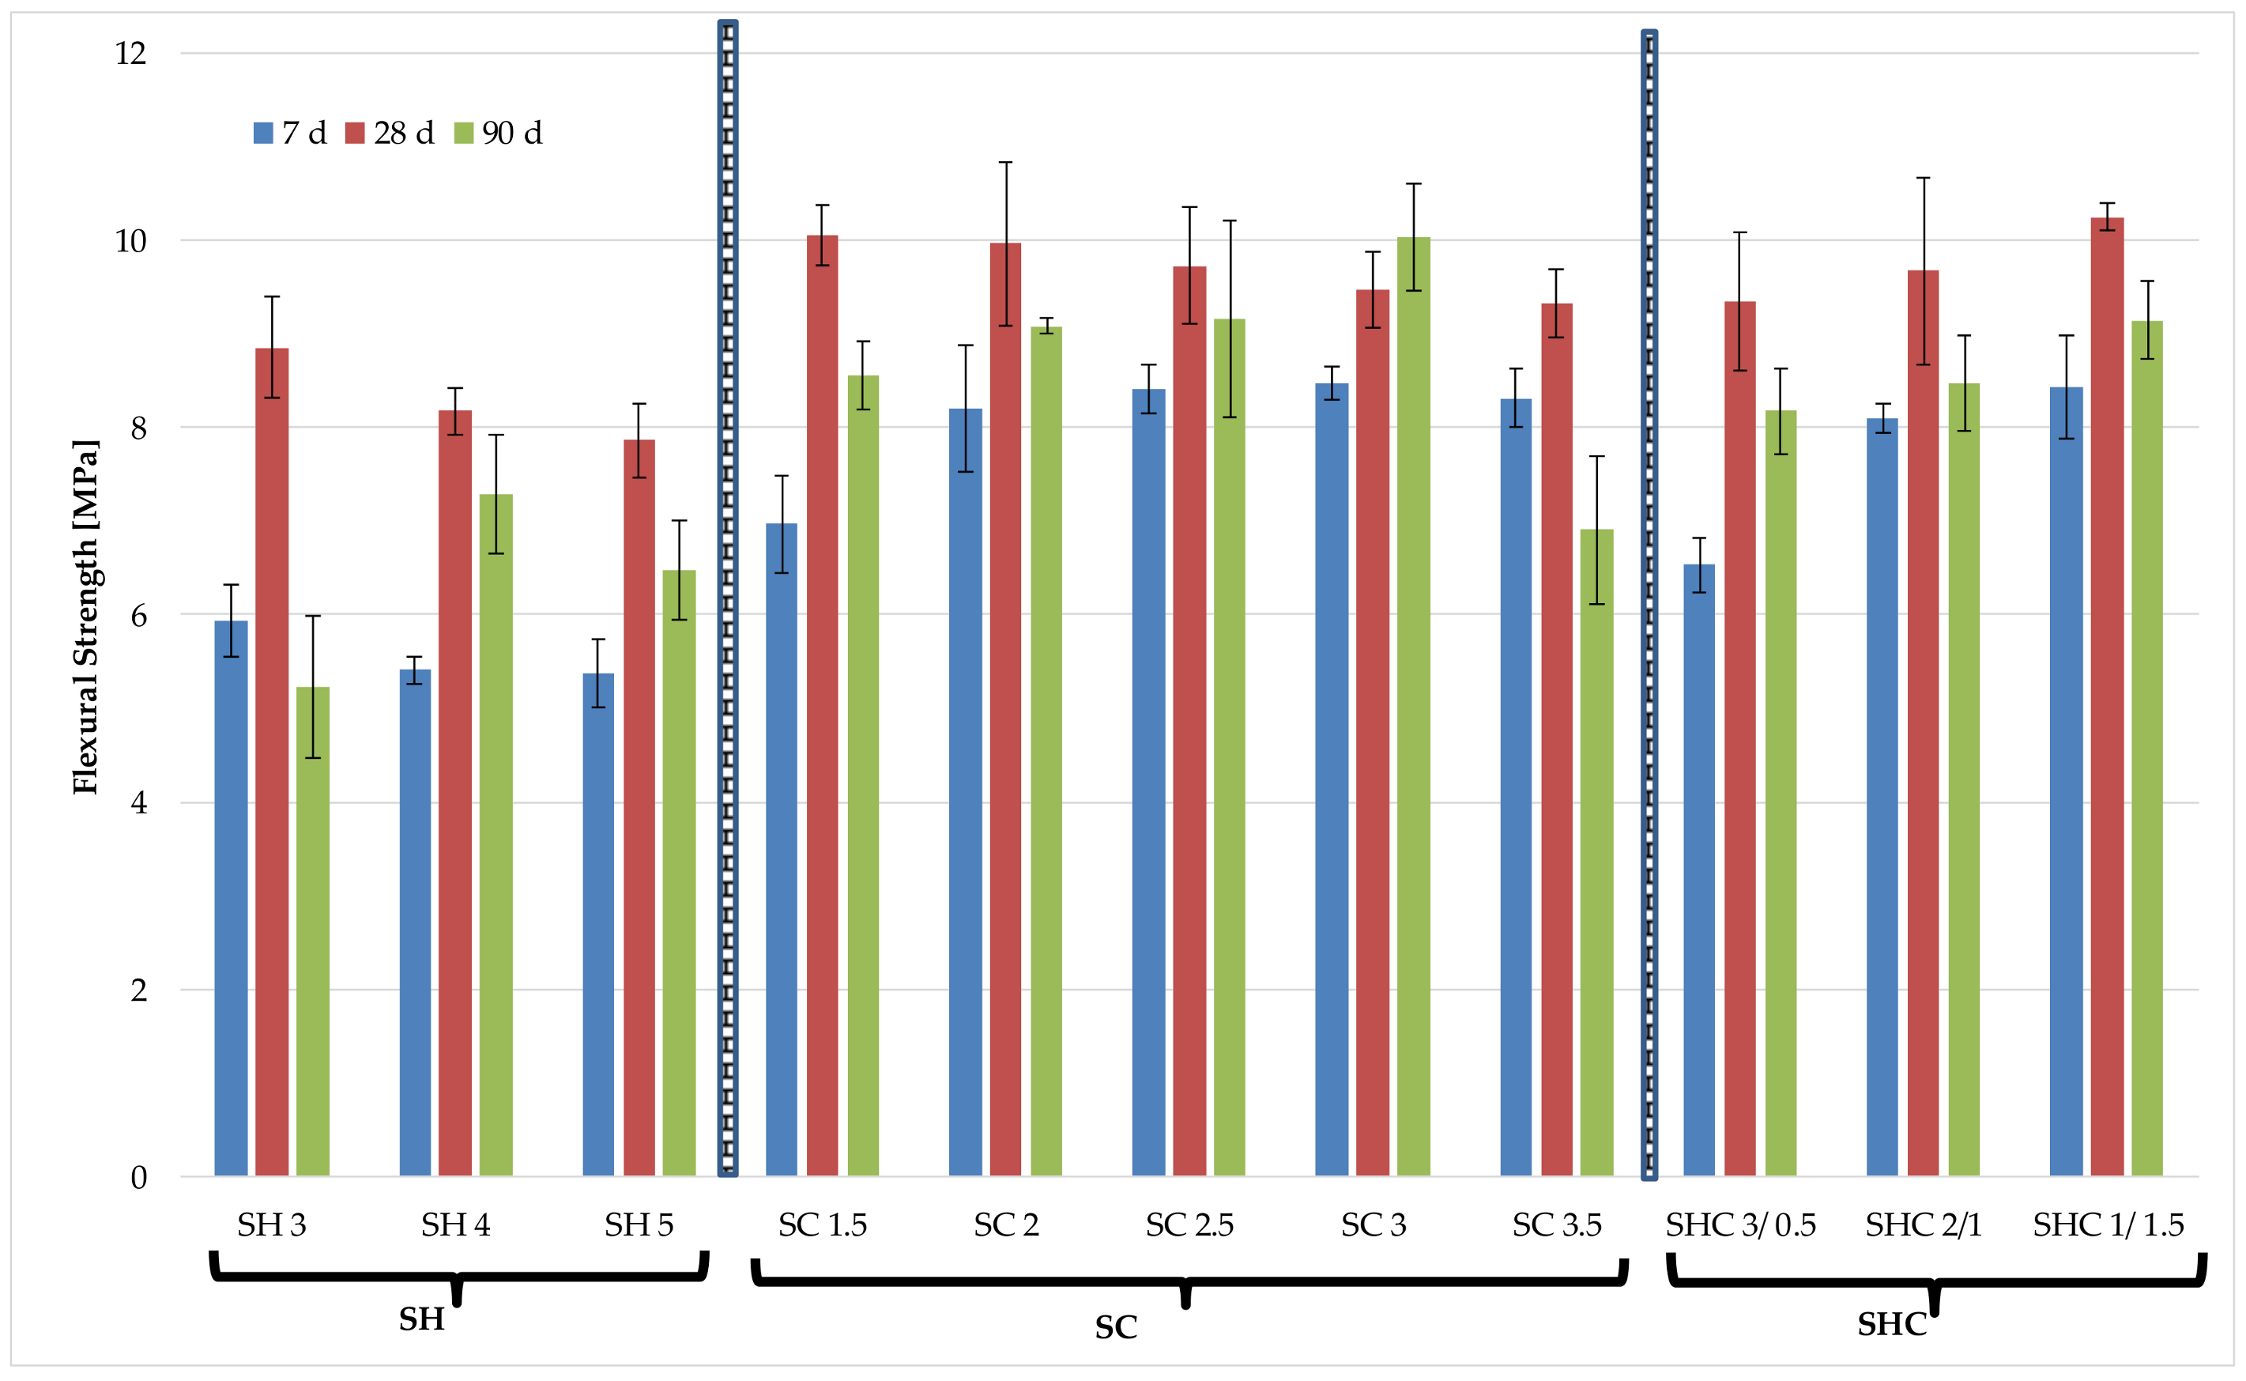
Figure 4 and
Figure 5 represent the flexural (Rf) and compressive (Rc) strengths of all the mortars studied for 7, 28 and 90 days curing, respectively.
After analyzing the flexural strength results separately for the three studied mixtures, namely NaOH (SH series), Na
2CO
3 (SC series), and NaOH and Na
2CO
3 mixtures (SHC series), it highlights the following results: (a) for NaOH, an increase in Rf took place between 7 and 28 curing days. For the 90 days curing time, Rf decreased with increased activator molarity; (b) for Na
2CO
3 as an activator after 7 curing days, all the mortars had similar flexural strength values, except for the mortar with the lower quantity activator. After 28 curing days, all the values were similar, and strength slightly decreased in all the mortars after 90 curing days except for the mortar SC3; (c) when the NaOH and Na
2CO
3 mixture was used as the activator, the mortar with the lesser Na
2CO
3 quantity obtained the lower strength value at 7 curing days, but no significant difference among the three types of mortars was observed after 28 and 90 curing days. The flexural strengths after 28 curing days of the mortars were higher than after 90 curing days. The decreased flexural strength from 28 days to 90 days was attributed to the shrinkage cracks, in line with what Pacheco-Torgal et al. [
24] suggested. Many of the mortars with the three different activators reached a flexural strength between 8 and 10 MPa.
When the three activator mixtures types were compared to one another, it concluded that the mortars containing Na2CO3 had higher flexural strength than those activated with only NaOH.
Figure 5 represents the Rc of all the studied mortars. The obtained results showed that Na
2CO
3 was the activator that yielded the highest Rc values. After studying the results for each tested activator, we highlight the following observations:
When NaOH is used, for the studied molarities range, there was no global correlation between the molarity of the NaOH solution and the Rc for the three studied curing days. An increase in Rc was observed with curing time. For any mortar, the compressive strength at 90 days exceeded 30 MPa. Wang et al. [
25] reported for NaOH that variation in the quantity of NaOH within 3–11% of the range (per slag weight) had very little effect on strength. In the present study, the NaOH percentages varied between 4.8% (SH3) and 8% (SH5). For the wider variations in the NaOH concentration, other authors obtained significant differences in compressive strength. For example, de Mores Pinheiro et al. [
26] made mortars with BFS activated with NaOH and KOH: for the NaOH-activated mortars, those activated with 4 M of NaOH (6.4% per slag weight) at 65 °C for 7 days obtained a compressive strength of 17.47 MPa compared to 31.11 MPa obtained by the mortar activated with 12 M of NaOH (19.2% per slag weight).
The Na
2CO
3-activated mortars displayed much better mechanical performance than the corresponding NaOH-activated ones. The Rc values at 90 curing days fell within the 40–55 MPa range; that is, about twice that for NaOH. An increase in Rc was observed when increasing the quantity of Na
2CO
3 as the activator (SC 2.5, SC 3 and SC 3.5). These results are consistent with other authors, such as Yuan et al. [
27], who obtained the best compressive strengths for the mortars with the biggest Na
2CO
3 quantity (analyzed range between 3 and 5% for Na
2O wt %). It is remarkable that for 7 curing days, the Rc values were higher than those for the NaOH-activated mortars after 90 days. This means that the activation rate of slag by Na
2CO
3 was high, and good early age mechanical performance was achieved. The maximum Rc for 7 curing days corresponded to 3.5 M the concentration of Na
2CO
3 (SC 3.5), and this value was higher than 40 MPa.
When the NaOH and Na
2CO
3 mixtures were used as activating reagents, Rc was enhanced when the quantity of Na
2CO
3 in the mixture was increased. Although all the mortars of SHC the series had the same quantity of Na
2O in relation to BFS weight, the best results were obtained for the mortars with the largest quantity of Na
2CO
3 (SHC 1/1.5). Collins and Sanjayan [
28] demonstrated the benefits of using Na
2CO
3 in combination with NaOH, but we observed that the NaOH/Na
2CO
3 mixture was much less efficient in terms of compressive strength development. In all cases, Rc was lower than the values obtained in the series with only Na
2CO
3.
In order to compare the role of both the activator’s nature and concentration, a 28-day curing time for compressive strength versus the percentage in weight of Na
2O to respect slag is plotted in
Figure 6. The range of the studied Na
2O percentages went from 3.72% to 8.68%.
The importance of anion nature in the compressive strength development for a given Na
2O content was demonstrated: the mortars activated with carbonate had higher compressive strengths than those activated with hydroxide. This was observed for all the Na
2O contents studied in the present study. Li et al. [
29], Fernandez-Jiménez and Puertas [
30], and Bernal et al. [
31] assumed that the anion group in alkaline solution was the dominant factor. The mixtures activated with Na
2CO
3 have a lower pH in a solution, and this factor can affect the setting time and strength development, but only at early ages (the first four days). Moreover, at mid- and long-term ages, pH values do not negatively affect strength development.
Although some authors suggest an optimum Na
2O range within the range from 3% to 5% [
14], it was demonstrated that this range depends on the activator’s nature: with NaOH, no significant differences were found for the studied Na
2O contents, but the best results were obtained by the highest Na
2O percentage for Na
2CO
3.
Jiao et al. [
32] stated that the OH
−ion dissolves the glassy structure of BFS. When Na
2CO
3 was added, the OH
− concentration lowered. However, the highly cross-linked structure of the carbonated compounds enhanced compressive strength.
3.2. Thermogravimetric Analysis (TGA/DTG)
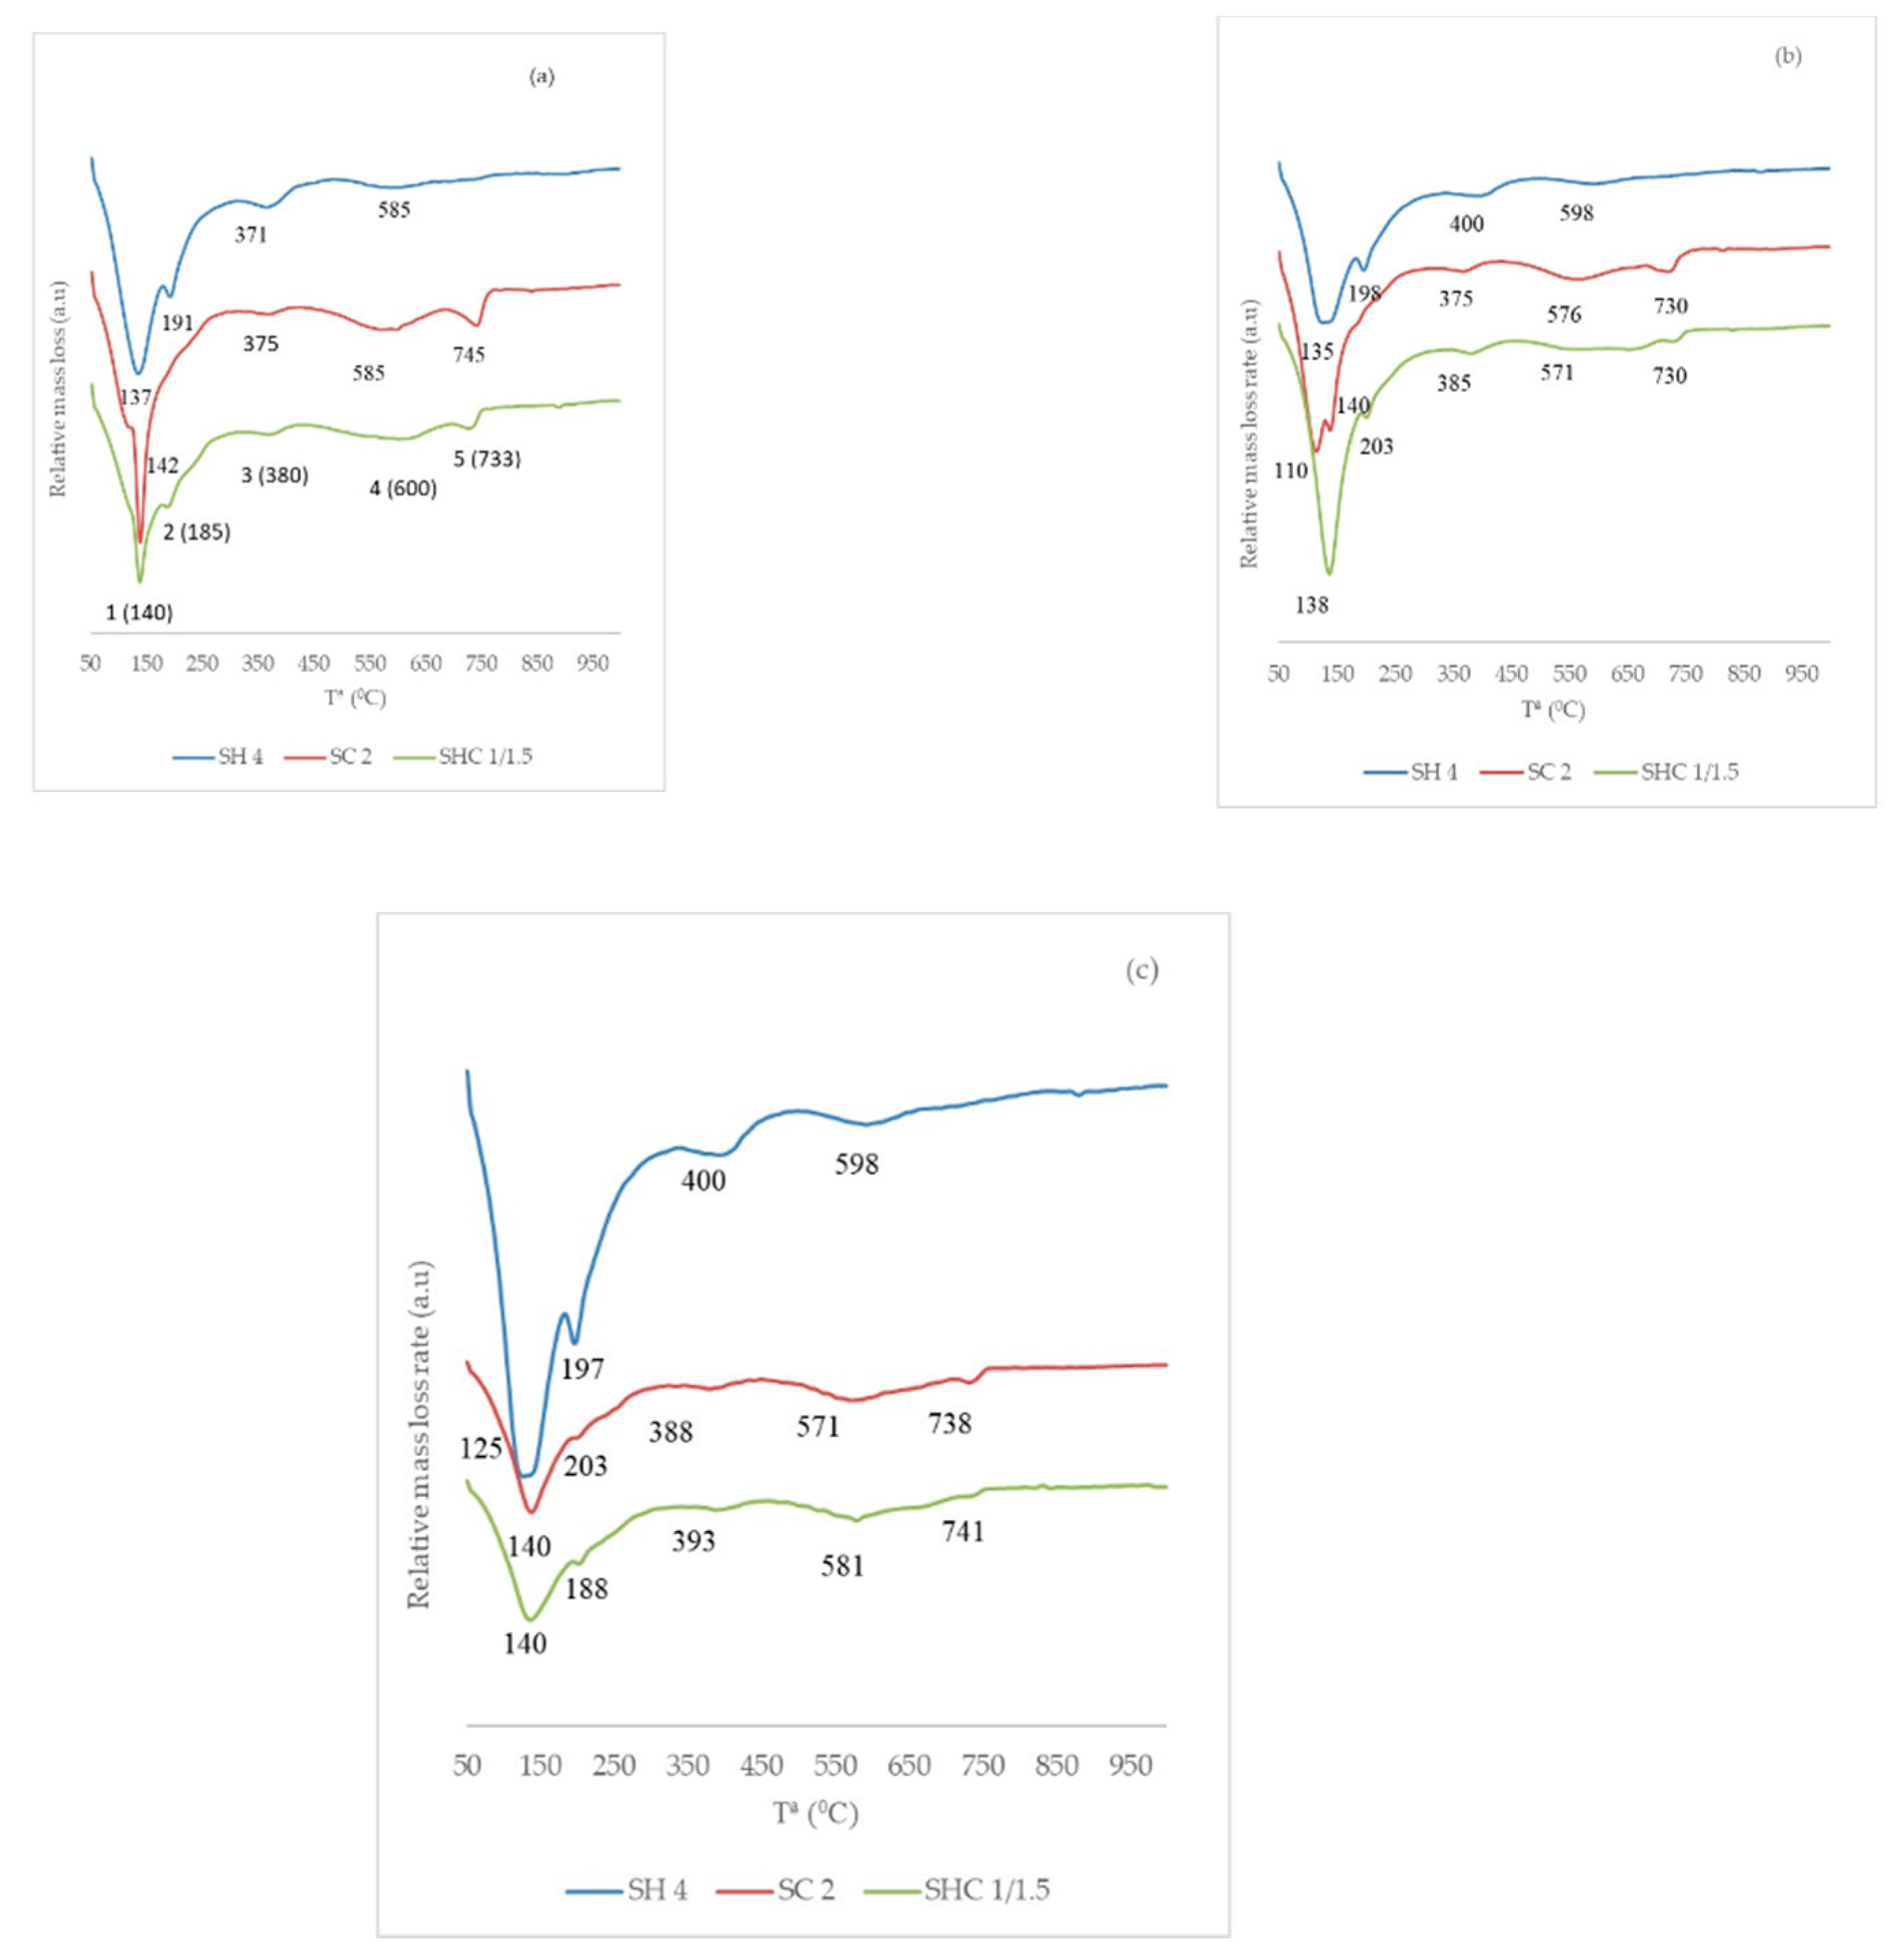
To simplify the microstructural analysis, only a specific Na
2O percentage was chosen. The chosen pastes were SH 4, SC 2 and SHC 1/1.5. They all had a Na
2O weight percentage of 4.96% in relation to the BFS. Paste SHC 1/1.5 was chosen because it had the highest mechanical strength of its series. The DTG curves at the different curing ages are represented in
Figure 7. On the DTG curves, three mass loss intervals were selected: (a) the first interval was below 300 °C and showed two peaks. Peak 1 can be attributed to the loss of the combined water of CSH gel and peak 2 to the loss of the combined water of the CASH gel [
19,
33,
34]. The main peak was the CSH gel; (b) the second was 300–500 °C, in which peak 3 developed (attributed to the decomposition of the hydrotalcite phase [
19,
33]); (c) the last interval was between 500 and 1000 °C (it contained peaks 4 and 5) and was attributed to carbonate phases like calcium and sodium carbonates or carboaluminates [
19].
As shown in
Figure 7, peaks 1, 2 and 3 appeared at practically all the curing time and for all the activators, but with different heights and width peaks. Peaks 4 and 5 were more visible for series SC and SHC that contained Na
2CO
3 as an activator. The pastes with CO
3−2 ions produce compounds of type carboaluminate (C
3A.CaCO
3.12H
2O) [
20]. The partial and total mass losses for all the studied pastes are summarized in
Table 3 for the different curing ages. The mass loss in the interval 50–300 °C presented a great evolution between 7 and 28 curing days; these data confirm that the most developed products within this time interval are CSH and CASH gel.
The study of mass loss within different temperature intervals corroborated the more marked presence of the carbonated phases in pastes SC and SHC. The mass loss derived from the hydrotalcite phase was greater in paste SH. The total mass loss increased with curing time and demonstrated the hydration reaction evolution.
3.3. FTIR Analysis of Pastes
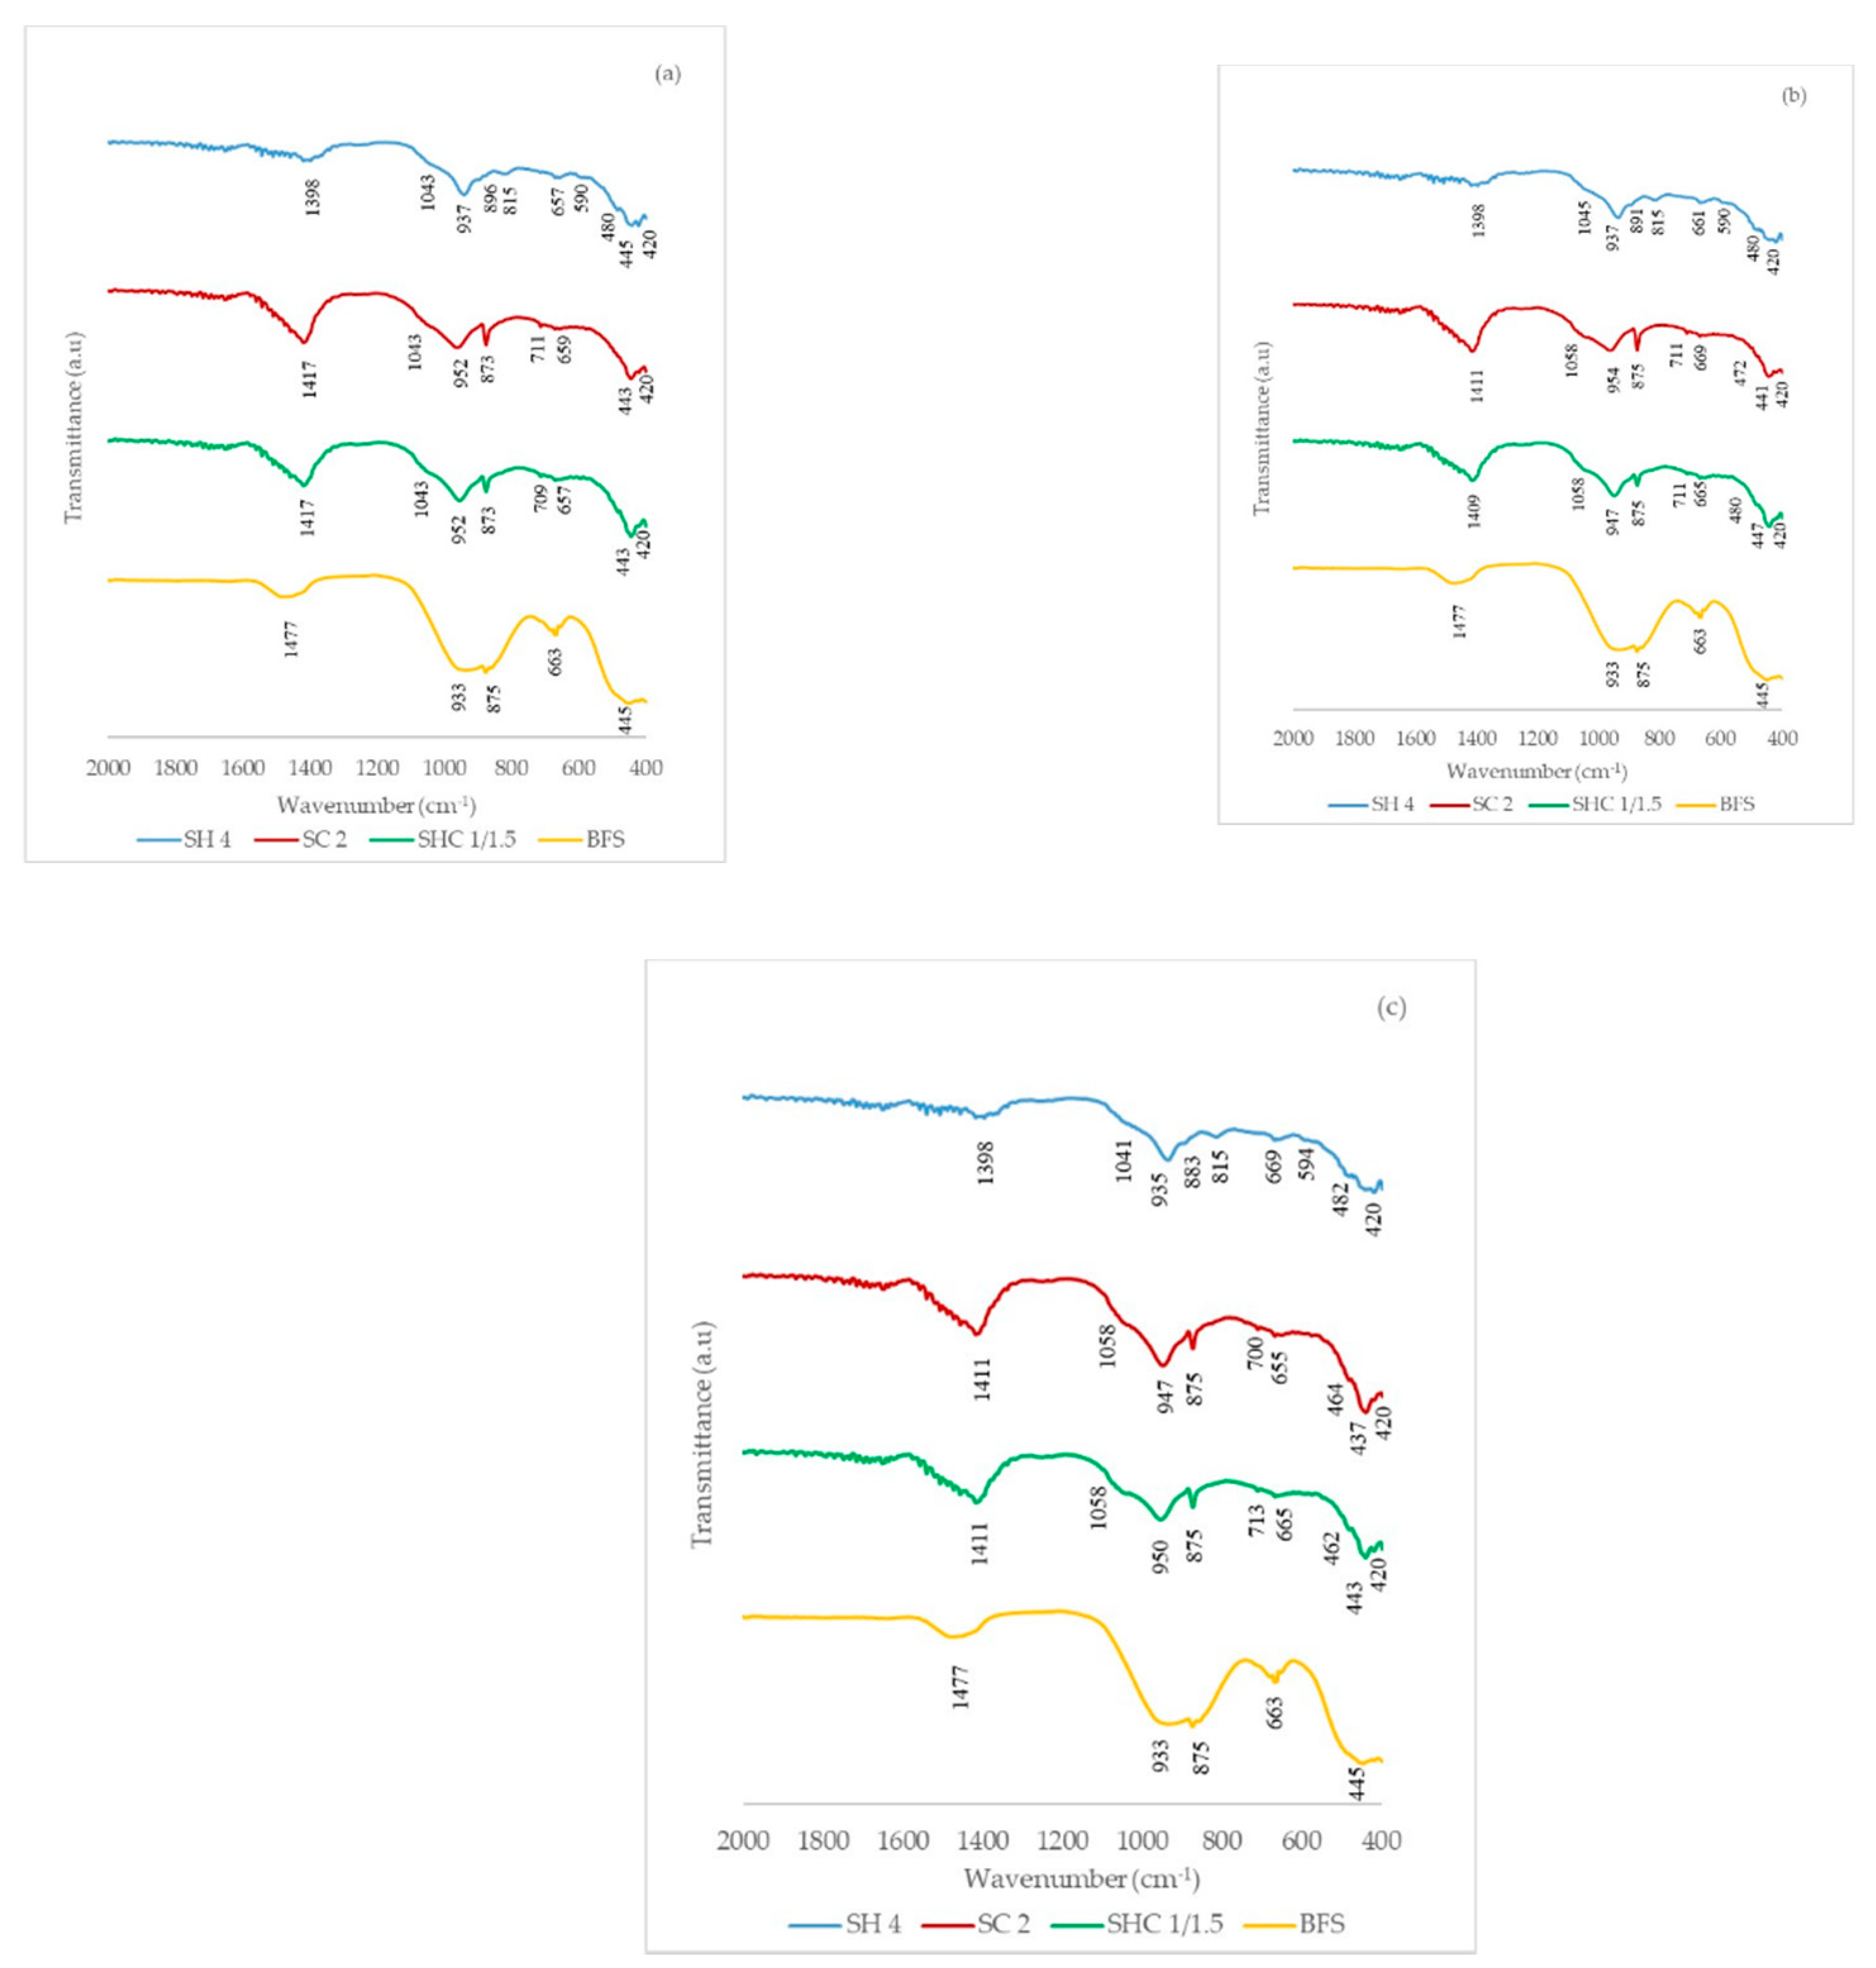
Figure 8 shows the FTIR spectra of the pastes cured at 7, 28 and 90 days at ambient temperature.
Table 4 presents the main assignations of the vibrations on the FTIR curves. The assignment was based on some research works by different authors [
35,
36,
37,
38].
The unreacted BFS presented various peaks: (a) at around 1477 cm−1, the peak was identified as the asymmetric stretching mode of O-C-O in CO3−2 due to the presence of calcite; (b) the broadband centered at 933 cm−1 corresponded to the asymmetric stretching vibration mode of Si-O-T (T: Si or Al); (c) the shoulder at 875 cm−1 was attributed to the asymmetric stretching of the AlO4 groups; (d) the peak at 663 cm−1 corresponded to vibration modes of sulfate, (e) finally at around 445 cm−1 the band assigned to the Si-O-Si bending vibrations appeared.
When analyzing the peaks in the bands near 1400 cm−1, which are affected by asymmetric stretching bond C-O (CO3−2), we can conclude that these bands were strong in pastes SC and SHC, derived by the presence of calcium or sodium carbonates. The presence of carbonates of different natures was corroborated by the DTG analysis. The formation of the hydrotalcite phase was identified by the presence of the stretching vibration mode of Al-O and Mg-O at around 1050 cm−1, and this peak was identified in all the pastes for all three curing ages.
The band within the 933–954 cm−1 range was attributed to the asymmetric stretching vibration of the Si-O-T units (T: Si or A, tetrahedral) of CSH and CASH. This band was found in all the FTIR of the pastes. The bands at 875 and 711 cm−1 were visible only in pastes SC and SHC, and these bands were attributed to the carbonated phases. The bands located within the lowest wavenumber range were attributed to the bending bands associated with products such as CSH, CASH or NASH. The FTIR of pastes SC and SHC were similar and only differed slightly from paste SH, especially in the vibration bands corresponding to the carbonated phases.
3.4. XRD Analysis
The pastes cured for 28 and 90 days were analyzed by XRD.
Figure 9 shows the XRD diffractograms of SH4, SC2 and SHC1/1.5 for both these curing ages.
Table 5 represents the abbreviation for the crystalline phases found in XRD, their PDF card number and the pastes that presented this phase.
As seen in
Figure 9, calcite is presented in all the pastes. The presence of calcite in the pastes of SC and SHC is logical given the presence of carbonate in the alkaline activator, as corroborated by the FTIR and TG analyses. The presence of calcite in the SH pastes could be due to unreacted slag. The akermanite, monticellite and rankinite peaks may be attributed to the undissolved phases from BFS. Hydrotalcite was present in all the pastes, but the main peak intensity of this phase in the SH paste was higher than that of the other pastes. Moreover, in the SH paste, another peak of the hydrotalcite phase appeared. Tobermorite-11A appeared in the SH pastes at 28 and 90 curing days. There were other differences between pastes that presented carbonates as an activator and the paste with the only hydroxide. Katoite appeared in paste SH, and more intensity appeared signals from the carbonated phases in pastes SC and SHC, with phases vaterite and thermonatrite, and the presence of this type of carbonated phases is common in pastes activated with Na
2CO
3 [
27,
31].
3.5. Economic and Environmental Aspects
The use of chemical reagents to prepare AAM can be taken into account in economic and environmental terms. The selection of a given chemical reagent has repercussions on both the cost and CO2 emissions associated with mortar or concrete preparation.
Regarding economic savings, the selection of NaOH, Na
2CO
3, or a mixture of both, influences the cost of chemical reagents. For this study, 712 €/ton of NaOH and 556 €/ton of Na
2CO
3 were selected as the cost of reagents (these data were provided by a chemical company). Accordingly, the cost of the activator per ton of prepared mortar was calculated (
Table 6). Obviously, when the amount of activator is increased, the cost per ton rises. For a given Na
2O%, SC mixtures are the most costly because, although the cost of Na
2CO
3 is lower, the quantity of Na
2CO
3 is larger. All SHC mixtures contain Na
2O% at 4.96 in relation to the BFS content and 1.11 in relation to the prepared mortar. Hence the cost per ton of mortar increases when the Na
2CO
3 proportion does.
As the strength developed for the prepared mortars was different, the variable cost per ton of mortar and MPa was calculated by taking into account mechanical behavior after 90 curing days (
Table 6). It was noticed that the mortars containing Na
2CO
3 (SC and SHC series) were less costly (range: 0.19–0.34 €/ton × MPa) than the mortars containing NaOH (SH series, range: 0.33–0.49 €/ton × MPa). This means that selecting Na
2CO
3 as an activator is preferable from an economic point of view. The best mixture in relative cost terms per MPa was SC 1.5, which had a value of 0.19 €/ton × MPa. This mortar presented an excellent mechanical performance at 90 curing days (41.4 MPa) for a mixture containing only a little Na
2CO
3 (14.2 kg Na
2CO
3/ton of prepared mortar).
Regarding CO
2 emissions, several data were taken from the bibliography and technical reports. The value of kgCO
2 emitted per ton of NaOH was 1.12, as reported by Mellado et al. [
12]. Na
2CO
3 synthesis is usually carried out by two methods: from natural carbonate ore (usually trona, Na
3(HCO
3)(CO
3)·2H
2O) and by the Solvay process.
In the first case, Na
2CO
3 production is carried out by means of trona calcination [
39]:
During this process, carried out at ≈160 °C, two moles of trona produced one mole of CO
2 and yielded 3 moles of Na
2CO
3. From the stoichiometric calculations, 176.7 kg of CO
2 were emitted for each ton of synthesized Na
2CO
3. Moreover, fuel consumption must be taken into account: it is reported [
40] that 48.7% of the total CO
2 emissions related to Na
2CO
3 synthesis from trona corresponds to stationary combustion emissions. Thus, for each ton of Na
2CO
3, 168.0 kg of CO
2 is emitted. Hence, the sum of both contributions is 344.7 kgCO
2/ton of Na
2CO
3.
In the second case, by the Solvay process, no CO
2 emissions were produced when the global chemical reaction was taken into account [
41]:
In modern industries, the synthesis of 1 ton of Na
2CO
3 by the Solvay process produces 700 kg of CO
2 [
41] because of the energy used in the several steps followed for synthesis. This value is significantly higher than that corresponding to the process for trona calcination (103% more emitted CO
2). The CO
2 values associated with the activator in the mortar, and the quantity of CO
2 emitted per ton of mortar and megapascal, are summarized in
Table 7.
When the amount of activator increases in the mortar dose, the CO2 associated with this also increases. Once again, the mixtures for the SC and SHC series gave lower kgCO2 values per ton of mortar and the megapascal prepared mortar (range: 0.12–0.41 kgCO2/ton mortar for Na2CO3 obtained from trona; range: 0.24–0.46 kgCO2/ton mortar by the Solvay process). These values are significantly more advantageous from the environmental point of view than those for the SH series (range: 0.52–0.77 kgCO2/ton mortar). This means that employing Na2CO3 is preferable to NaOH. Moreover, this reagent is less alkaline, and its handling is safer than it is for NaOH. Thus, selecting Na2CO3 would be the best choice.

 ,
, 


