Article

Sandwich Panels with Polymeric Foam Cores Exposed to Blast Loading: An Experimental and Numerical Investigation

1
Structural Impact Laboratory (SIMLab), Department of Structural Engineering, NTNU—Norwegian University of Science and Technology, 7491 Trondheim, Norway
2
Centre for Advanced Structural Analysis (CASA), NTNU—Norwegian University of Science and Technology, 7491 Trondheim, Norway
3
Department of Civil Engineering and Energy Technology, Oslo Metropolitan University, 0130 Oslo, Norway
*
Author to whom correspondence should be addressed.
Appl. Sci. 2020, 10(24), 9061; https://doi.org/10.3390/app10249061
Submission received: 29 October 2020 / Revised: 10 December 2020 / Accepted: 11 December 2020 / Published: 18 December 2020
(This article belongs to the Special Issue Armour and Protection Systems)

Abstract

:
Sandwich panels have proven to be excellent energy absorbents. Such panels may be used as a protective structure in, for example, façades subjected to explosions. In this study, the dynamic response of sandwich structures subjected to blast loading has been investigated both experimentally and numerically, utilizing a shock tube facility. Sandwich panels made of aluminium skins and a core of extruded polystyrene (XPS) with different densities were subjected to various blast load intensities. Low-velocity impact tests on XPS samples were also conducted for validation and calibration of a viscoplastic extension of the Deshpande-Fleck crushable foam model. The experimental results revealed a significant increase in blast load mitigation for sandwich panels compared to skins without a foam core, and that the back-skin deformation and the core compression correlated with the foam density. Numerical models of the shock tube tests were created using LS-DYNA, incorporating the new viscoplastic formulation of the foam material. The numerical models were able to capture the trends observed in the experimental tests, and good quantitative agreement between the experimental and predicted responses was in general obtained. One aim of this study is to provide high-precision experimental data, combined with a validated numerical modelling strategy, that can be used in simulation-based optimisation of sandwich panels exposed to blast loading.

1. Introduction

Cellular materials such as honeycombs, open and closed cell foams and hollow metal spheres, have excellent characteristics as energy absorbers under extreme conditions such as blast and impact due to their ability to deform uniformly over a long stroke at an almost constant load [1]. The properties of such materials are governed by the cell structure topology and the intrinsic property of the constituent material, where the topology defines how the constituent material is packed in space to form a porous structure [2]. Polymeric foams, i.e., polymeric materials with a relative density less than 0.3, are particularly attractive in this sense due to their low weight combined with superb energy absorbing capability, insulation properties, easy production, low price and design flexibility. Nowadays, polymeric foams of various types have a variety of applications such as protective materials in a multitude of aerospace, marine and automotive components (see e.g., [3]). The quasi-static behaviour of foams is reasonably well-known and has been extensively documented, see e.g., [2], while the dynamic compressive behaviour of cellular materials was recently described in [4] and [5].
Sandwich panels used as protective structures traditionally consist of two sheets (or skins) attached to a cellular core. The idea is that the core material will absorb energy during the dynamic event, and as a result, lower the forces transferred to the surrounding structure. The application of the sandwich panel usually governs the choice of skin and core material. As the sheet and core can consist of a range of different materials, there have been numerous studies over the years on various types of sandwich panels depending on the load case. Recently, Reyes and Børvik [6] investigated the quasi-static behaviour of sandwich panels with steel skins and six different polymeric foam cores, while the same panels were examined under low-velocity impact loading in [7]. The main conclusion from these studies was that in order to minimise the weight and at the same time maximise the energy absorption of the sandwich panel, a low-density foam should be used as core material. It was also found that the energy absorption and the back-skin displacement depended on the velocity range, in addition to the core material and density, so it is not apparent which combination of the different variables that will give the best protection during both quasi-static and dynamic loading.
The use of sandwich panels with polymeric foam cores as energy absorbers for blast mitigation has gained increased interest in recent years. Great efforts have been placed especially on the experimental aspects, but Fleck and co-workers have presented a series of notable papers on the analytical and finite element modelling of sandwich structures, mainly sandwich beams, subjected to impulsive loading, see e.g., [8,9,10,11].
Shukla et al. [12] recently published a book chapter on thick section composite and sandwich structures [13]. Here, their work on blast loaded sandwich panels performed over a ten-year period is summarised. They have studied sandwich structures with various skin and polymer foam core materials, including graded density cores subjected to shock tube and underwater blast loads. Their results show that a graded density core is favourable over a monolithic core, and that the blast load attenuation is dependent on the core gradation layering and arrangement. An increase in load attenuation was found for increasing number of layers and when arranging layers with increasing density [14]. The response of sandwich panels with thermo-plastic polyurethane cores and aluminium face sheets subjected to blast loading was explored both experimentally and numerically by Jamil et al. [15]. They observed that the cores could withstand high blast loads, and that the addition of aluminium skins provided additional resistance to impulsive loads. Furthermore, the increase of the core thickness enhanced the performance even more. Chen et al. [16] studied blast loading on structural panels with steel skins and EPS core. They claimed that neither increasing the core density nor the core thickness improved the blast resistance markedly. Zhang et al. [17] investigated the behaviour of corrugated sandwich panels filled with a polymeric foam core. It was found that foam filling could enhance the blast resistance of the panel, but the level of improvement strongly depended on the filling strategy. Another type of sacrificial claddings with foam-filled open-top truncated square pyramids was investigated by Li et al. [18]. They learnt that the crushing resistance increased with foam filling material for quasi-static tests. The conclusions were somewhat more complicated for blast loading, as the foam filling mitigated the response for higher blast loads and had literally no effect for lower blast loads. Similarly, Fahr et al. [19] examined the influence of foam filling in corrugated sandwich steel structures. They used a syntactic foam as filler and tested the influence of temperatures up to 900 °C. The foam-filled corrugated panels showed superior blast mitigation to the unfilled panels at room temperatures, while the increased temperature caused larger back face deflections and some core separation.
The influence of graded density cores for sandwich panels subjected to blast loading has also been investigated by Kelly et al. [20] and Rolfe et al. [21]. Based on the experimental results, it was concluded that grading the core density mitigated the through-thickness crack propagation and damage in the higher density foam layers. Ye et al. [22] simulated blast loading by firing an aluminium foam projectile at sandwich structures with aluminium skins and a PVC core, and evaluated different foam densities and core thicknesses in terms of energy absorption efficiency. Low density foam cores with large thicknesses were seen to have excellent energy absorption abilities, but also thin high-density cores could be efficient when subjected to intensive impulses. An optimal core gradation was found to give beneficial blast mitigation when Zhou et al. [23] investigated the performance of sandwich panels with metallic skins and both graded and ungraded PVC foam cores under blast loading. The panel system with a low-density (large thickness) core appeared to be favourable for the mitigation of back face deformation and core cracking failure, and an optimal gradation of densities for the given problems was found. However, an optimal core gradation in terms of face sheet deformation and core cracking failure led to the risk of delamination failure of the core. Different face-sheet materials and a graded foam core were used for the sandwich panels subjected to blast loading by Sun et al. [24]. They concluded that the blast resistance of sandwich panels with a positive gradient of the core density, i.e., a linear decrease in core density with blast direction, was superior to those with a uniform or a negative gradient of the core density. These and similar findings show that it is not straightforward to optimise such components experimentally and that simulation-based design optimization is required to make progress. A hybrid evolutionary optimisation algorithm for sandwich panels to maximise their blast mitigation was recently proposed by Karen et al. [25].
In this study, the dynamic response of sandwich panels subjected to air-blast-like loading has been investigated both experimentally and numerically. The main objective of this work is to provide high-precision experimental data, combined with a validated numerical modelling strategy, that can later be used in simulation-based optimisation of sandwich panels exposed to blast loading. In the experimental tests, the blast load was generated using a shock tube facility, where the blast intensity could be accurately controlled and consistently repeated [26]. The experimental setup also facilitates reliable measurements of the in-situ response of the test components. Sandwich panels with 0.8 mm thick aluminium skins and a 50 mm thick polymeric foam core were subjected to different blast load intensities. The core material of the sandwich panels consisted of extruded polystyrene (XPS) with three different densities, i.e., 33, 37 and 50 kg/m3. The quasi-static compressive properties of the polymeric foam cores have been extensively characterised in a previous work [6], while in the present study low-velocity impact tests on XPS foam samples were conducted and used for validation and calibration of a viscoplastic extension of the Deshpande-Fleck crushable foam model implemented as a user-material subroutine in LS-DYNA (R10.0, Livermore Software Technology (LST), Livermore, CA, USA, 2018) [27]. The skins of the sandwich panels were made of AA1050-H14 aluminium alloy and their mechanical behaviour was characterised through a series of uniaxial tension tests. The experimental results revealed a significant increase in blast load mitigation for sandwich panels compared to skins alone, and both the back-skin deformation of the sandwich panels were found to correlate with the foam density. Numerical models of the shock tube tests were created using LS-DYNA, incorporating the new viscoplastic formulation of the foam material, and a number of finite element simulations were run. The numerical models captured the main trends observed in the experimental tests, and good agreement between the experimental and predicted responses was in general obtained.

2. Materials

2.1. Aluminium Skins

The skins of the sandwich panels were made from 0.8 mm thick low-strength, strain-hardened and cold-rolled aluminium sheets of the alloy EN AW 1050A-H14, manufactured by Norsk Hydro ASA. This alloy is considered commercially pure and is primarily intended for forming operations into wrought products. The nominal yield stress and tensile strength, given by the manufacturer, are 100 MPa and 116 MPa, respectively, while the chemical composition of the alloy is given in Table 1.
Plates with dimensions 625 mm × 625 mm were received from the manufacturer. Dog-bone specimens having a gauge length 70 mm, width 12.5 mm and thickness 0.8 mm were cut from one of the plates, oriented at 0°, 45° and 90° relative to the rolling direction of the material. A sketch of the specimen geometry can be found in [28]. Triplicate tests in each orientation were conducted, giving a total of nine tensile tests. Before testing, measurements of the width and thickness were taken across the gauge length of specimens. The tensile tests were performed in an Instron 5985 universal testing machine (Instron, Norwood, MA, USA) with a 250 kN load cell at an initial nominal strain rate of 5 × 10⁻⁴ s−1. The force was recorded by the load cell, while a digital camera oriented perpendicular to the specimen captured pictures at 1 Hz. Before testing the specimens were painted with a speckle pattern to enable two-dimensional digital image correlation (2D-DIC) to track displacements across the gauge area. Engineering strains were then calculated by a virtual extensometer with an initial length of 50 mm using the in-house DIC-code eCorr (v4.0, NTNU, Trondheim, Norway) [29].
Engineering stress-strain curves until fracture from tensile tests in different material orientations are shown in Figure 1a. A slight anisotropy in flow stress is seen between the tests in the rolling direction (0°) and the tests angled 45° and 90° to the rolling direction. The angled tests have an increase in flow stress of about 5 % compared to the tests in the rolling direction of the plate. The elongation to fracture varies between specimen orientations and is more consistent in the 45° and 90° orientations than in the 0° direction. Grytten et al. [30] showed that the anisotropy of thin plates made of the aluminium alloy AA5083-H116 did not influence the response in low-velocity impact tests. Based on results like these, a representative test in the 0° direction was chosen and used to calibrate the constitutive relation and failure criterion applied in the numerical models. Details regarding the calibration process and the obtained material parameters are presented in Section 4.2.1.

2.2. Foam Cores

Foam cores of the sandwich panels were made from plates of extruded polystyrene (XPS) with a nominal thickness of 50 mm, manufactured by Sundolitt [31]. XPS is a closed-cell polymer foam made by extrusion foaming of the monomer styrene. Foams with three nominal densities, namely 30, 35 and 45 kg/m3, were applied as core material in this study. The manufacturer designates XPS with the nominal plateau stress of the foam in kPa, and the three densities considered here are thus named XPS-250, XPS-400 and XPS-700. Quasi-static compressive properties of the same XPS foams as used in this study have been extensively investigated by Reyes and Børvik [6,7], and some of these results are repeated below for completeness. In this work, the strain-rate sensitivity of the XPS foams was further investigated through a series of low-velocity impact tests on cubic samples.

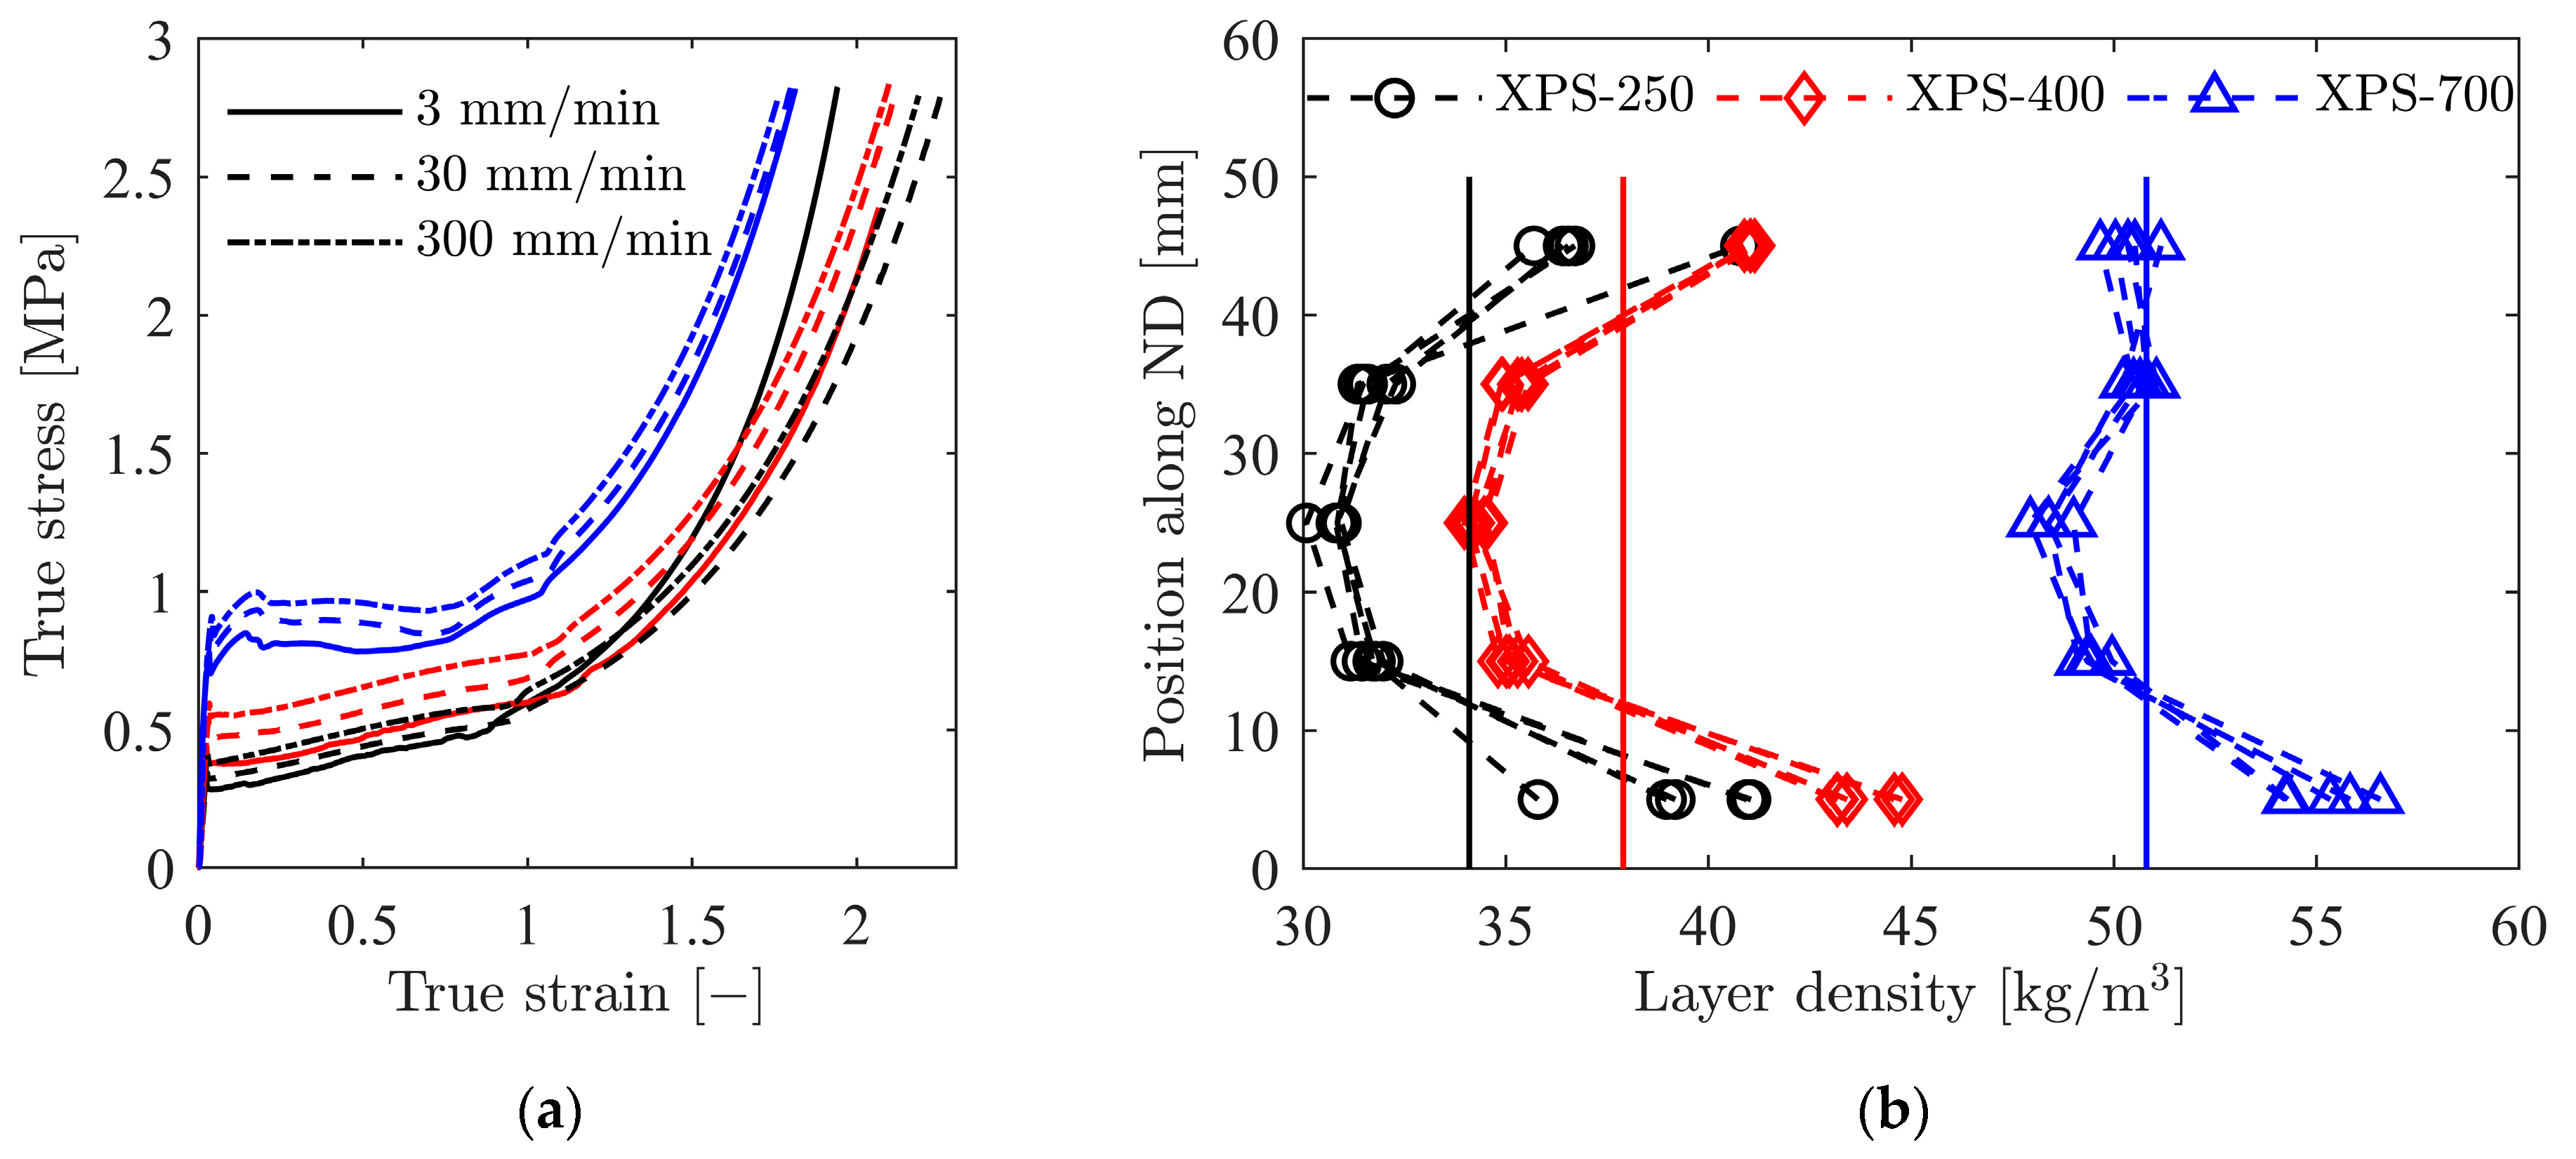
2.2.1. Uniaxial Compression Tests

The material behaviour of the XPS foams under uniaxial compression was investigated by testing cubes measuring 50 mm × 50 mm × 50 mm in an Instron 5985 universal testing machine (Instron, Norwood, MA, USA). The compressive response was revealed through two test series. In series 1, the anisotropy of the foams was investigated by loading cubes in the thickness (normal) direction (ND), the longitudinal direction (LD) and the transverse direction (TD) of the extruded plates. The crosshead velocity of the test machine was set to 3.0 mm/min in these tests, corresponding to an initial strain rate of 1 × 10⁻³ s−1. In series 2, the strain-rate sensitivity of the foams was examined by running tests on specimens in ND with an elevated crosshead velocity of 30 mm/min and 300 mm/min, respectively, corresponding to initial strain rates of 1 × 10⁻² s−1 and 1 × 10⁻¹ s−1. The complete test matrix and nominal material parameters are given in [7].
Before testing, each sample was given an identification number before being carefully measured and weighed. These measurements were used to determine the densities of the samples, see Table 2. The imaged surface of the sample was painted with a speckle pattern to enable use of 2D-DIC to measure compressive strains. The samples were compressed between two hardened steel plates during testing. A 100 kN calibrated load cell registered the load, while a digital camera was used to take pictures of one side of the samples at a frequency of 1 Hz. The in-house DIC-software eCorr was used to extract displacement and strain fields from the acquired pictures.
All samples exhibited typical closed-cell foam behaviour, consisting of a linear elastic region followed by a plateau region spanning over a wide strain range, ending in a densification region where the stresses increase rapidly over a narrow strain range [6]. A slight anisotropic behaviour of the foams was observed, where the response in the LD and TD was similar, while slightly higher plateau stresses and lower densification strains were seen for tests in the ND. For most engineering purposes, the three XPS foams may be considered isotropic. Table 2 displays the mean density ρ , standard deviation SD, elastic modulus E, yield stress σ y , plateau stress σ p and densification strain ε D based on the compression tests in ND at a strain rate of 1 × 10⁻³ s−1 [6]. These results show that the elastic modulus, the yield stress and the plateau stress display a distinct increase with foam density, consistent with the expected behaviour for closed-cell foams [2]. In addition, the densification strain was comparable for the different densities. All three foam densities displayed a similar level of strain hardening.
Figure 2a shows true stress-strain curves for the three densities in ND at different strain rates. As the scatter was low, only a representative test for each density and strain rate is shown for legibility. An apparent increase in yield and plateau stress was found with increasing strain rate, while the densification strain was mostly unaffected by strain rate. The results from the representative tests will later be used to calibrate a rate-dependent modification of the Deshpande-Fleck constitutive model for crushable foams (see Section 4.2).
Based on DIC analyses, Reyes and Børvik [6] showed that the XPS foams used in this study have a distinct strain localisation during compression. As the samples were compressed, strains first localised in a band in the middle of the XPS-250 and XPS-400 samples before the band propagated towards the top and bottom surfaces. The strain localisation in XPS-700 was similar but occurred in two bands closer to the surfaces. This localisation encouraged an investigation of the density distribution across the normal direction of the test samples. Foam cubes were sliced into five sections with nominal dimensions 10 mm × 50 mm × 50 mm, before they were carefully measured and weighed to acquire the density. Figure 2b shows the resulting density variation over the thickness of the foams. The XPS-250 and XPS-400 foams exhibit a significant density reduction in the centre of the specimen, while XPS-700 has a somewhat smaller density variation. These measured density distributions were applied in numerical simulations of the three foam densities, see Section 4.2. It should be noted that the method applied here for measuring the density variation through the thickness of the foam samples is not ideal for obtaining accurate results. A more accurate result can be obtained by imaging the foams using X-ray computed tomography (CT) in the same manner as Vestrum et al. [32]. An attempt was therefore made also in this study to scan the foams with CT, but the densities were too low to provide usable results with the imaging setup applied.

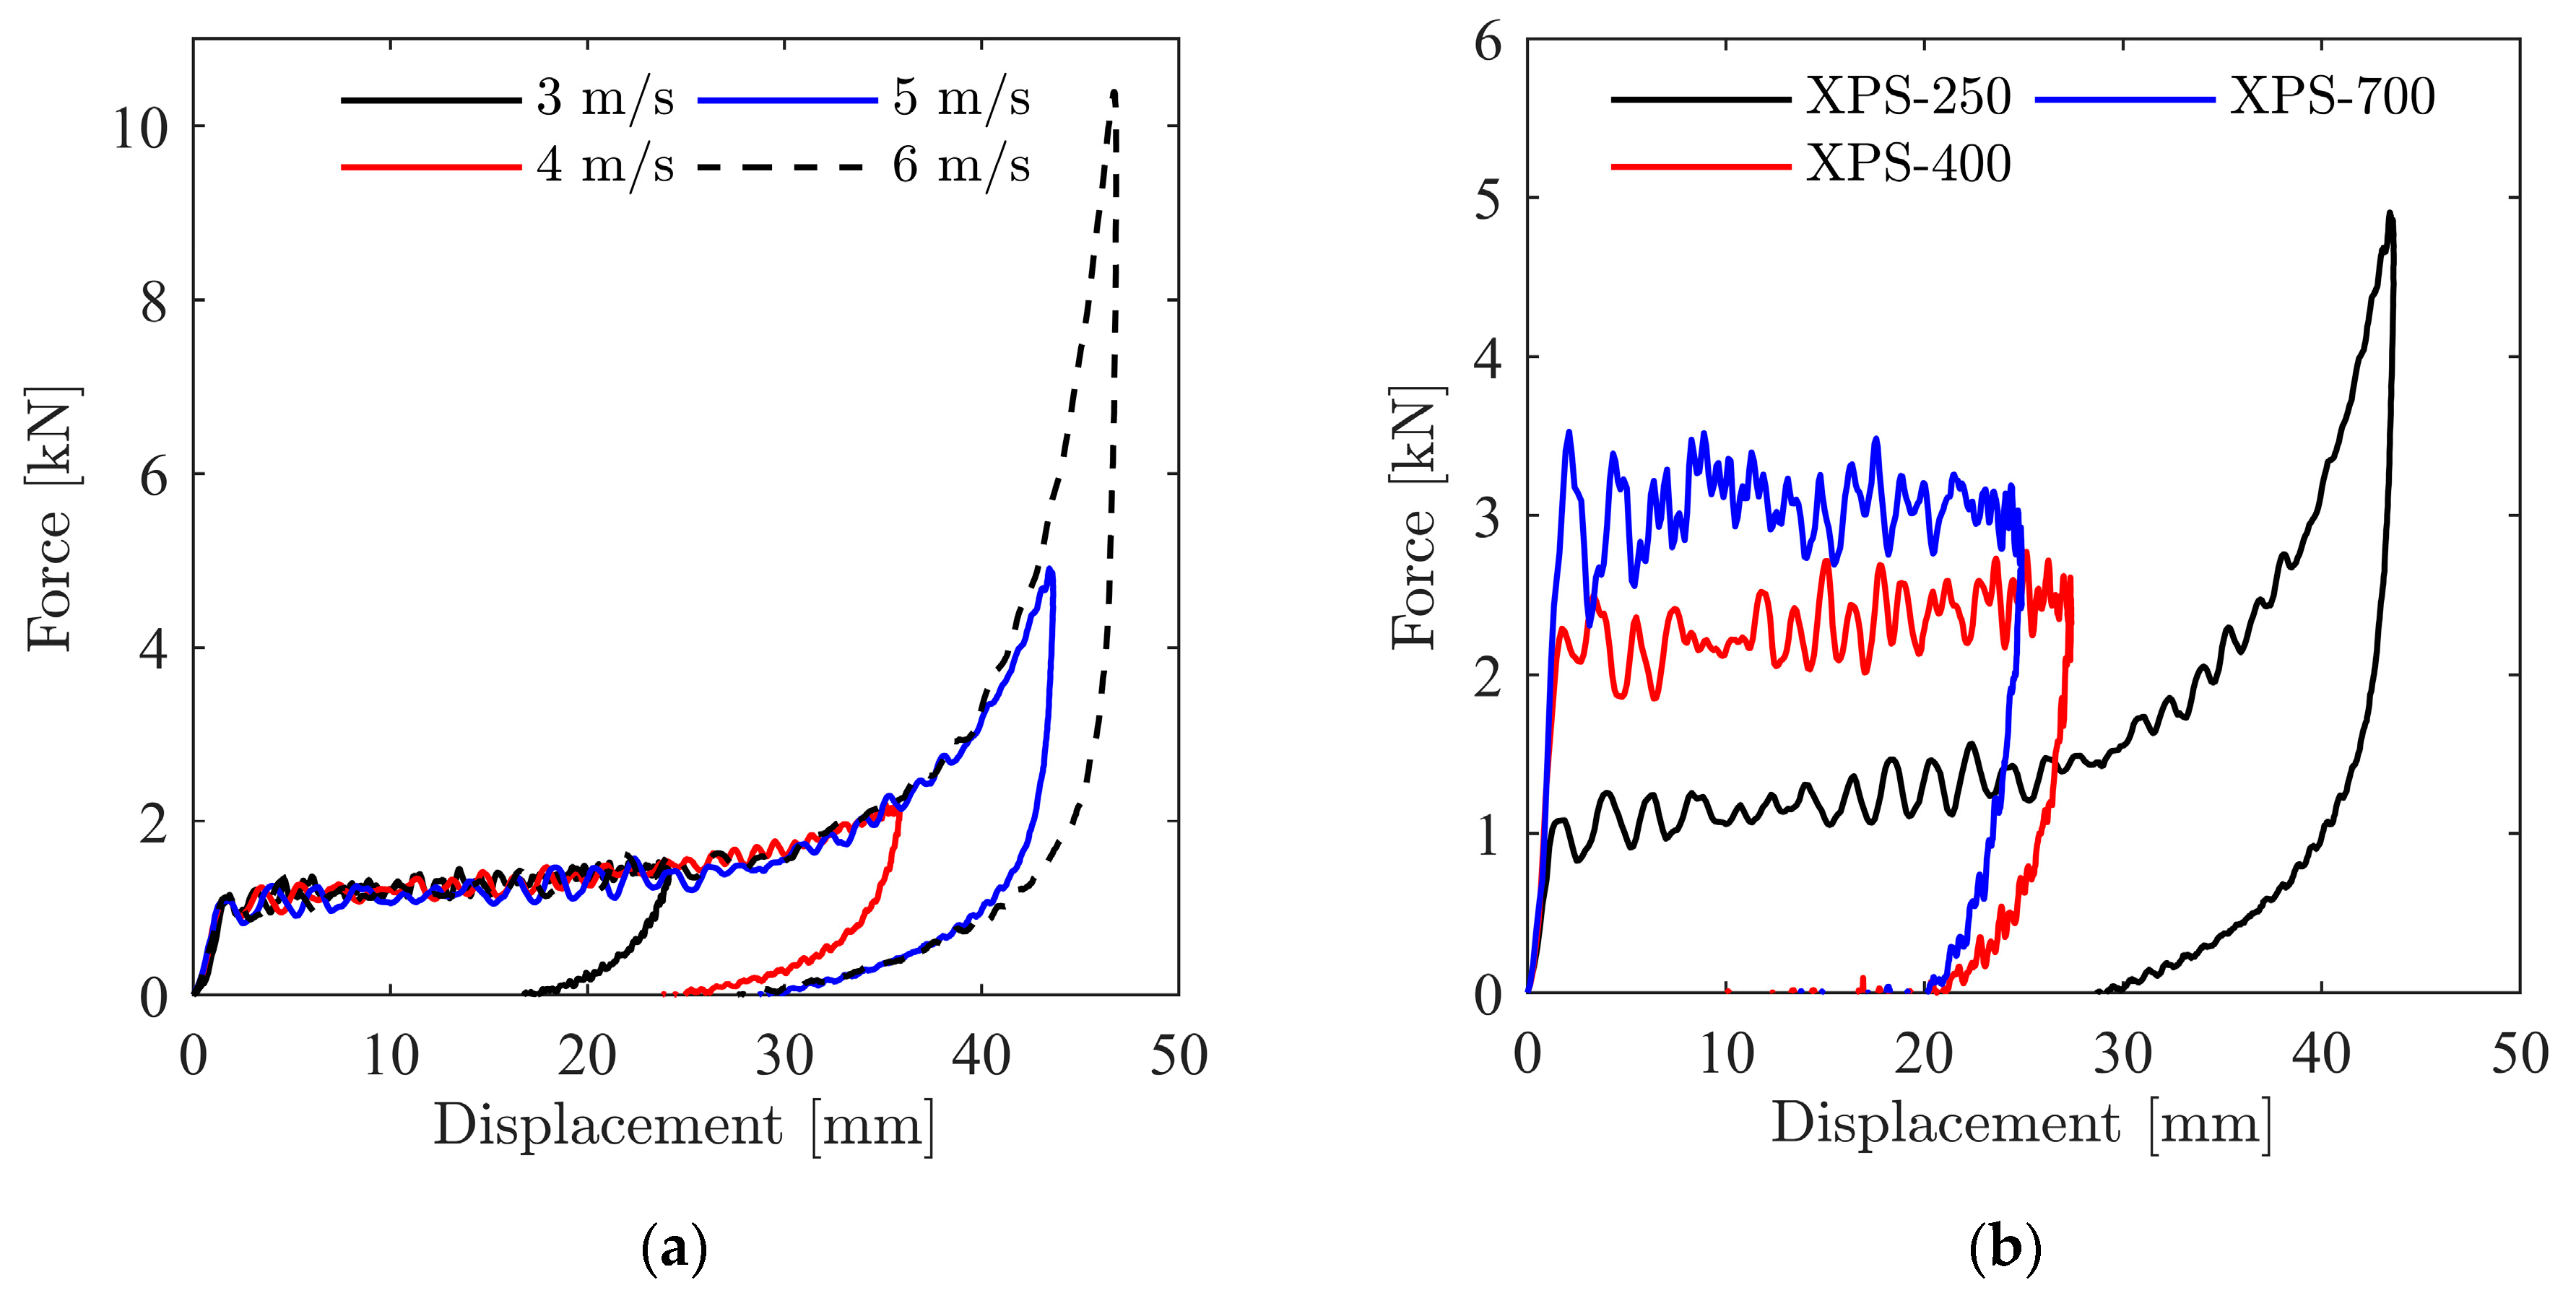
2.2.2. Low-Velocity Impact Tests

The compressive response of the three XPS foams at elevated strain rates was investigated by conducting low-velocity impact tests in an Instron CEAST 9350 drop tower system (Instron, Norwood, MA, USA) using cubes with dimensions 50 mm × 50 mm × 50 mm as samples. The test setup was similar to that used by Reyes and Børvik [7], with some minor modifications to account for the test sample geometry. Here, a conical steel nose with a maximum diameter of 80 mm was attached to the instrumented striker to create a rigid, flat impact surface. Series of five tests were carried out for each of the three foam densities at impact velocities ranging from 2.6 to 6 m/s. The total impacting mass was 5.339 kg in all tests. The impact force was measured by a calibrated load cell placed 220 mm from the impactor nose. As the load cell is not located at the tip of the striker, the recorded force is not equal to the contact force between the impactor nose and the test sample. Based on dynamic equilibrium, the actual impact force (F) was found from the recorded force (P) according to Equation (1), accounting for the mass m 1 above and the mass m 2 below the load cell [7].
F = ( 1 + m 2 m 1 ) P
A Phantom v2511 high-speed camera (Vision Research Inc., Wayne, NJ, USA) placed perpendicular to one side of the specimen recorded deformations during impact at a frequency of 33 kHz. Before the tests, the imaged surface of the samples was painted with a speckle pattern to enable use of 2D-DIC for surface strain measurements during impact. Each sample was carefully measured and weighed before testing, and the density for all samples were found to be within the standard deviation given in Table 2.
Figure 3a shows unfiltered force-displacement curves for XPS-250 samples impacted at velocities ranging from 3 to 6 m/s. Within this velocity range, the difference in yield and plateau stress is negligible when the impact velocity is increased. The peak force increases, however, with initial velocity because of the increase in kinetic energy. Similar test series were conducted for XPS-400 and XPS-700. These results are omitted for brevity as they exhibited the same trends as for XPS-250, i.e., no noticeable increase in yield and plateau stress within the chosen velocity range. As expected, the amount of compression of the samples decreased with increasing density. Figure 3b shows a comparison of force-displacement curves for XPS-250, XPS-400 and XPS-700 impacted at an initial velocity of 5 m/s.
A comparison of Cauchy stress-logarithmic strain curves obtained from quasi-static tests and impact tests are shown in Figure 4. For all samples, global strains were computed based on the relative displacement of the top and bottom contact point between the sample and the test rig. Stresses were calculated assuming a negligible plastic Poisson’s ratio for the foam. Note that the strain rate in the impact tests is not constant but decreases as the samples are compressed because the impactor is slowed down towards the maximum displacement. Thus, the strain rates given in Figure 4 are based on the impactor velocity at contact with the foam samples. The strain-rate sensitivity for XPS-250 seems to be less than the strain-rate sensitivity for the two other foams in this plot, and the reason for this result is unclear and require further investigations.

3. Component Tests

3.1. Experimental Setup

The blast tests on sandwich components were conducted in the SIMLab shock tube facility (SSTF) at Norwegian University of Science and Technology (NTNU). A detailed description of the SSTF is given by Aune et al. [26], while Figure 5 shows a schematic overview of the shock tube. It consists of a high-pressure chamber (the driver), separated from a 16.10 m long low-pressure chamber (the driven) by a firing section. In this study, the test specimen is placed at the end of the driven section, to the right in Figure 5. Aluminium inserts are used to change the volume of the driver in 0.25 m increments. For these tests, the driver length was 0.77 m. The firing section consists of several independent chambers separated by diaphragms. This separation allows for a stepwise pressure gradient between the high-pressure driver and the low-pressure driven (at ambient pressure in these tests). The pressure in the driver is released by a controlled venting of the firing section, causing successive rupture of the diaphragms. By keeping the length of the driver section short compared to the driven section, the resulting pressure wave after firing takes a form similar to the one obtained in a free-field air blast explosion [26].
The sandwich components were attached to a flange at the end of the driven section by two clamping flanges and twelve M24 bolts and nuts, shown in Figure 6 and Figure 7. The bolts were tightened to 2 Nm using a torque wrench to avoid excessive compression of the foam core. An additional set of nuts were added to prevent the bolts and clamping frame from unscrewing during loading. In the following, the skin closest to the driven is named the front skin and the skin furthest from the driven is named the back skin. The planar shock wave impacts an area of the front skin measuring 300 mm × 300 mm. The test specimen and the end of the driven were surrounded by a closed dump tank equipped with windows. Two synchronised Phantom v2511 high-speed cameras (Vision Research Inc., Wayne, NJ, USA) placed in a stereovision setup overlooked the back skins and recorded the blast response at a frame rate of 37 kHz with an image size of 768 × 800 pixels. The pressure loading was measured with two pressure sensors, located 0.245 and 0.345 m upstream of the test specimen. In Figure 5, these pressure sensors are denoted Sensor 1 and Sensor 2 respectively, abbreviated to S01 and S02 in the following. The pressure measurements were synchronised with the high-speed cameras, i.e., operating at a recording rate of 37 kHz. Three-dimensional digital image correlation (3D-DIC) analyses were conducted based on the high-speed video images and the in-house DIC-software eCorr. Before testing, the stereovision setup was calibrated using an 80 mm diameter cylinder with an applied checker pattern. In total, five images of the cylinder in various positions were used in the calibration process. Out-of-plane displacements were calculated based on the image sets from the synchronised cameras, comparing the relative displacement of the plate to the reference (or undeformed) state. Before each test, a speckle pattern required for 3D-DIC, as seen in Figure 6, was applied to the back skin with an aerosol nitrocellulose lacquer and a polymer template.

3.2. Blast Test Programme

A total of 17 shock tube tests were conducted, of which four were with skins only, and 13 with sandwich components. Experiments with skins only were conducted with the same setup as described in the previous section, but with the clamping bolts tightened to 100 Nm. The loading was varied by changing the initial pressure in the driver before firing. A nominal range of 1000 to 2500 kPa was used. Table 3 shows the test matrix for the shock tube tests. Each test is given an abbreviation on the form XX_YYY_PZZ. Here, XX is either Sk or Sw, denoting tests with skins only and sandwich components, respectively, and YYY is the nominal plateau stress of the foam. PZZ denotes the nominal firing pressure in bar for all tests. Repeated tests are suffixed by a repetition number.
In the following description of the test results, the driver firing pressure is used to denote the magnitude of the blast load applied to the test specimens. The actual pressure on the specimen surface is not measured directly, but the pressure measured at sensor S01, 0.25 m in front of the specimens, provides a good estimate of the actual loading. First, comparisons of the incoming pressure and Mach number at S01 ensure that the incoming blast wave has the expected magnitude. Second, the measured reflected pressure at S01 indicates the pressure load on the specimen. Test results on rigid plates [26] show that for a given firing pressure, the incoming and reflected blast waves exhibit a high degree of repeatability. However, a recent numerical study [33] shows that the dynamic response of the test specimens introduces a non-uniform spatial and temporal pressure distribution near the specimen. Thus, the pressure measured at S01 only indicates the actual load on the specimens and possible fluid-structure-interaction (FSI) effects.
In the tests marked with an asterisk, the aluminium alloy used in the skins was from a different batch than for the rest of the samples, i.e., they were from the same batch as used by Aune et al. [34]. Although the manufacturer specifications were the same, a small difference in yield stress and work hardening was observed.

3.3. Experimental Results

In this section, the results from the blast load experiments are presented. To reduce the number of figures presented in the text, and to provide additional clarity, some test data for load level P12 and P15 are presented in Appendix A.1.

3.3.1. Aluminium Skins

Experimental data in terms of mid-point displacements, measured pressures and cross-sectional displacement profiles for the aluminium skins only are presented in Figure 8. The mid-point and cross-section displacements were obtained using 3D-DIC. All curves are corrected for the shock tube rigid body movement and shifted in time such that the time equals zero when the shock wave arrives at sensor S01. In the cross-sectional displacement profiles, plate velocity over the cross-section is indicated by the distance between each line, as the time interval is constant. The Mach number, maximum incoming pressure and reflected pressure measured at sensor S01 for each test are presented in Table 3.
At the lowest load level, i.e., 10 bar firing pressure, the two skins behave as expected for plates subjected to a shock-tube blast load. The skins rapidly deform to a permanent maximum displacement of about 32 mm. The deformation begins with a uniform acceleration of the entire cross-section. The plate edges start to decelerate first, while the centre is still accelerating. After a small elastic springback from the peak displacement, the entire plate oscillates elastically around a permanent plastic displacement. The skins tested at 12 bar firing pressure had the same behaviour as the test with 10 bar firing pressure: a rapid deformation to a maximum mid-point displacement of 41 mm.
At the highest load level tested, i.e., 15 bar driver pressure, the skins fail by tearing along the clamping frame edge. High-speed images of the failure process are shown in Figure 9. Failure initiates with tearing in the middle of both vertical edges at the frame and propagates vertically. After the tears have propagated along the entire height of both vertical edges, tearing initiates along the upper horizontal. The plate then fails along the upper horizontal edge, followed by the lower horizontal edge, before being ejected from the frame.

3.3.2. Sandwich Panels

Experimental data from the tests on sandwich panels subjected to the lowest load level, i.e., 10 bar firing pressure, are shown in Figure 10. None of the components failed in these tests. A comparison between the mid-point displacements for sandwich panels and skins only is shown in Figure 11a. In terms of the cross-sectional displacements, see Figure 10, the specimens behave similarly. When the shock wave impacts, the front skin is accelerated uniformly. As for the tests with skins only, the edges of the sandwich components start to decelerate first, but with a less pronounced difference between the edges and centre before coming to rest with a shallower, more rounded, displacement profile than for the skins only.
The maximum mid-point displacement for the XPS-250 sandwich component is over 20% higher than for the XPS-400 component, while the difference between XPS-400 and XPS-700 is only approximately 7%. This variation in mid-point displacements is not consistent with the difference in compressive strength of the cores. A possible explanation for this observation is that the maximum reflected pressures in these tests are not high enough to initiate proper collapse of the higher density cores.
Figure 12a shows the recorded pressure-time histories at sensor S01 for all tests at 10 bar firing pressure. Here, a distinct reduction in the measured pressure is observed for the sandwich component with an XPS-250 core. As seen in Table 3, the maximum recorded pressure in sensor S01 was approximately 7% higher for the sandwich components with XPS-400 and XPS-700 as core materials than for the XPS-250 sandwich panels and skins only. This reduction in measured reflected pressure may be connected to the reduced displacement of the sandwich panels with XPS-400 and XPS-700 cores, i.e., the larger displacement of the skins only and XPS-250 sandwich panels causes a pressure reduction in front of the components due to FSI effects.
Experimental data from tests on sandwich panels with 12 bar driver pressure are shown in Figure A1, and mid-point displacements are compared with the results from the tests on skins only in Figure 11b. In general, the results are similar to those found for 10 bar firing pressure. However, the difference in maximum mid-point displacement is more consistent with the difference in core material compressive strength at this firing pressure. The displacement with an XPS-250 core does not increase much compared to the tests at 10 bar firing pressure, while the tests with skins only and XPS-400 and XPS-700 as core material show a significant increase in displacement. Thus, at this load level the pressure seems high enough to activate more of the higher strength core materials. The behaviour of the reflected pressure, shown in Figure 12b, is similar to the tests at 10 bar firing pressure, i.e., a reduction in the measured pressure consistent with the displacement of the test samples.
The experiments at 15 bar driver pressure were performed in two series, because the first series of experiments showed that the applied load was close to the failure limit of the sandwich panels used in this study. Complete results from series 1 and 2 are presented in Figure A2 and Figure A3, respectively. Mid-point displacements from all these tests are compared to the skins only tests in Figure 11c. Only two of the test components at this load level did not fail (XPS-250 and XPS-700). The mid-point displacements from these two tests settled at 45 mm and 36 mm permanent displacement for XPS-250 and XPS-700, respectively. For the failed components, the mid-point displacement continued to increase, as the back skin fails. Figure 12c shows the measured pressure for all tests at 15 bar firing pressure. For the test with skins only, a rapid pressure drop was recorded. This pressure drop was caused by the emptying of the driven section when the component fails. The same pressure drop is not observed for the failed sandwich components because the back skins in these tests did not fail, and thus a pressure reflection is measured. Figure 13 shows post-test images of the components in series 1. Here, the XPS-250 sandwich did not show any signs of failure. The XPS-400 sandwich had almost complete tearing of the back skin and substantial fracture of the core material. In comparison, the XPS-700 sandwich showed tearing of the back skin top horizontal and cracking of the core material. These results indicate that at 15 bar driver pressure, the applied blast load is at the limit of the failure load for these components. Figure A4 shows post-test images of the components in series 2. In series 2, there was more severe damage to the components. The XPS-250 sandwich exhibited complete tearing of the back skin along the vertical edges and the top horizontal edge, and the core failed along the inner edge of the clamping frame. For the XPS-400 sandwich, both the back skin and the core failed along the inner edge of the clamping frame. The XPS-700 sandwich did not display the same amount of damage as the other components in series 2, i.e., complete tearing of the back skin along the left vertical and bottom horizontal edge and partial tearing along the top horizontal edge. The core showed extensive fractures, but not a complete failure as for the XPS-250 and XPS-400 sandwich panels. In general, for tests at 15 bar driver pressure, the primary failure mechanism is face yield and consequently tearing of the back skin along the edge of the clamping frame. Depending on the extent of back skin tearing, the core tends to fracture in the centre of the blast-exposed area, with fracture along the clamping frame edge.

4. Numerical Work

Finite element simulations were conducted using the explicit finite element solver LS-DYNA. The main goals of the numerical work were to quantitatively assess the level of accuracy obtainable in numerical simulations using a commercial solver and to qualitatively investigate the effect of various parameters on the behaviour of the sandwich panels exposed to blast loading.

4.1. Constitutive Relations

The loading conditions during blast events may involve large plastic strains, high strain rates and thermal softening due to self-heating in the affected materials. To account for these effects, a thermoelastic-thermoviscoplastic constitutive model like the one proposed by e.g., Børvik et al. [35] should be applied for the aluminium skins. However, studies by Grytten et al. [30] on perforation of 5000-series aluminium plates and Holmen et al. [36] on low-velocity impact of Docol 600DL steel plates showed that thermal softening effects are limited at moderate plastic strains and strain rates. Therefore, thermal effects in the aluminium skins will be neglected in this study. For the foam cores, the compression tests at elevated strain rates indicate a strain-rate sensitivity for all densities studied. A similar conclusion was given by Cronin and Ouellet [37] and Toksoy and Güden [38] for polystyrene foams. Thus, an extension of the Deshpande-Fleck [39] crushable foam model was proposed and implemented as a user-material subroutine in LS-DYNA to account for rate sensitivity in the foam cores.
The main assumptions in the applied models are an isotropic material and small elastic strains, while the plastic strains and rotations may be finite. Thus, a hypoelastic formulation is adopted through an additive decomposition of the rate-of-deformation tensor
D = D e + D p
where D e and D p are the elastic and plastic parts, respectively. The elastic part is defined as
D e = 1 + ν E σ J ν E tr ( σ J ) I
where ν and E are elastic constants, σ J is the Jaumann rate of the Cauchy stress tensor σ and I is the second-order unit tensor. The plastic rate-of-deformation tensor D p is defined by the associated flow rule, viz.
D p = p ˙ f σ
where p ˙ is the equivalent plastic strain rate. The yield function is adopted in the form
f ( σ , R ) = σ eq ( σ ) σ Y ( R )
where σ eq is the equivalent plastic strain and R = R ( p ) is the isotropic hardening variable which depends on the equivalent plastic strain p , and σ Y is the flow stress of the material.
For the pressure insensitive aluminium skins, the rate-dependent J 2 flow theory is adopted. The von Mises equivalent stress is then given by
σ eq ( σ ) = σ eq ( σ ) = 3 J 2 = 3 2 σ : σ
where σ = σ 1 3 tr ( σ ) I is the stress deviator. The plastic part of the rate-of-deformation tensor in Equation (4) for the von Mises material is then obtained as
D p = p ˙ f σ = 3 2 p ˙ σ σ eq
The flow stress is defined as
σ Y = σ 0 + R ( p ) = σ 0 + [ i = 1 2 Q i ( 1 exp ( C i p ) ) ]
where σ 0 is the yield stress and ( Q i , C i ) are material parameters governing strain hardening based on the extended Voce hardening rule. The equivalent plastic strain rate p ˙ is given as
p ˙ = { 0 , f 0 p ˙ 0 ( [ σ eq ( σ ) σ Y ( R ) ] 1 c MJC 1 ) , f > 0
Here, c MJC is a material parameter governing the strain-rate sensitivity and p ˙ 0 is a user-defined reference strain rate. In the viscoplastic domain ( f > 0 ), the equivalent stress is found from Equation (9) as
σ eq = σ Y ( R ) [ 1 + p ˙ p ˙ 0 ] c MJC = [ σ 0 + i = 1 2 Q i ( 1 exp ( C i p ) ) ] [ 1 + p ˙ p ˙ 0 ] c MJC
This constitutive relation was implemented in LS-DYNA by Børvik et al. [35] as material model 107 (*MAT_MODIFIED_JOHNSON_COOK).
For the pressure-sensitive foam cores, the yield function should include a hydrostatic stress term in addition to the deviatoric stress term to account for the volumetric change when the cells of the material collapse under compression. The continuum-based isotropic constitutive relation for crushable foams proposed by Deshpande and Fleck [39] was adopted for this purpose. In this model, the equivalent stress σ eq is given by
σ eq 2 ( σ ) = σ eq 2 ( σ , σ H ) = 1 [ 1 + ( α 3 ) 2 ] [ σ vM 2 + α 2 σ H 2 ]
where σ vM is the von Mises equivalent stress defined by Equation (6) and σ H = 1 3 tr ( σ ) is the mean hydrostatic stress. The parameter α governs the shape of the yield surface and is defined as
α 2 = 3 G K = 9 ( 1 2 ν p ) 2 ( 1 + ν p )
where K and G are the bulk- and shear modulus, respectively, and ν p is the plastic coefficient of contraction. It is seen from Equation (12) that when ν p = 0.5 , as for pressure insensitive materials, α 2 = 0 , and the equivalent stress σ eq ( σ ) in Equation (11) reduces to the von Mises equivalent stress σ vM . The plastic rate-of-deformation tensor for the pressure-sensitive material is decomposed into a deviatoric and a hydrostatic part, viz.
D p = p ˙ f σ = p ˙ f σ vM σ vM σ + p ˙ f σ H σ H σ = ε ˙ vM n + 1 3 ε ˙ v I
where the von Mises equivalent plastic strain rate, ε ˙ vM , and the volumetric plastic strain rate, ε ˙ v , are defined as
ε ˙ vM = p ˙ 1 + ( α 3 ) 2 σ vM σ eq ,   ε ˙ v = α 2 p ˙ 1 + ( α 3 ) 2 σ H σ eq
By combining the equations above, it is possible to express the equivalent plastic strain rate explicitly in terms of ε ˙ vM and ε ˙ v , i.e.,
p ˙ = [ 1 + ( α 3 ) 2 ] ( ε ˙ vM 2 + 1 α 2   ε ˙ v )
Based on the work of Hanssen et al. [40] and Reyes et al. [41], the flow stress is taken as
σ Y ( R ) = σ P + R ( p ) = σ P + γ p ε D + α 2 ln ( 1 1 ( p ε D ) β )
where σ P is the plateau stress, ε D is the true densification strain, and γ , α 2 and β are material parameters governing the work hardening. This constitutive relation was implemented in LS-DYNA by Reyes et al. [41] as material model 154 (*MAT_DESHPANDE_FLECK_FOAM).
Hanssen et al. [40] proposed a relation where material parameters are expressed in terms of the relative density by
{ σ P , α 2 , γ , 1 β } = C 0 + C 1 ( ρ f ρ f 0 ) n
here, C 0 , C 1 and n are constants, while ρ f and ρ f 0 are the density of the foam and the base material, respectively. In the special case of ν p = 0 , and uniaxial compression, the true densification strain can be expressed as
ε D = ln ( ρ f ρ f 0 )
As the material studied is assumed to have a plastic contraction of ν p = 0 and the calibration tests are performed in uniaxial compression, the relations in Equations (17) and (18) were implemented as a user-material subroutine (UMAT) in LS-DYNA to account for the density
To include the strain-rate sensitivity of the polystyrene foams, the constitutive relation described above was expanded. A definition of the plastic strain rate on the form of Equation (9) was adopted and implemented in the Deshpande-Fleck model. Thus, the equivalent stress in the viscoplastic domain ( f > 0 ) is obtained on the form
σ eq ( σ , σ H ) = σ Y ( R ) [ 1 + p ˙ p ˙ 0 ] c DF = [ σ P + γ p ε D + α 2 ln ( 1 1 ( p ε D ) β ) ] [ 1 + p ˙ p ˙ 0 ] c DF
here, c DF is a material parameter governing the strain-rate sensitivity of the foam, and p ˙ 0 is a reference strain rate. This relation was implemented into the UMAT along with the definitions of the density variation. Note that no attempt has been made to relate the strain-rate sensitivity c DF to the local material density in this study, and that this parameter will be calibrated based on the average density of the foam samples.

4.2. Material Calibration

4.2.1. Aluminium Skins

Following the same procedure as Holmen et al. [36], the strain hardening parameters for the aluminium skins were calibrated against DIC-results obtained from the quasi-static tension tests described in Section 2.1. As the strain at necking is significantly lower than the failure strain, an inverse modelling approach using the optimisation tool LS-OPT (Version 5.2.1, Livermore Software Technology (LST), Livermore, CA, USA, 2018) [42] was applied, where sequential simulations of the same model were run with different choices of hardening parameters. A model of the test specimen was created using the same shell-element size and formulation as used in the simulations of the shock tube tests (see Section 4.3), i.e., quadrilateral four-node Belytschko-Tsai shell elements measuring 1 mm × 1 mm with reduced integration and five integration points across the thickness. An initial value for the hardening parameters σ 0 , Q i and C i was found by a least-square fit of the Cauchy stress—logarithmic plastic strain curve to necking for the representative test. These initial parameters were then used as starting values in the optimisation routine. The engineering stress-strain curve from one representative test in the rolling direction (0°) of the plate was chosen as the target curve for the calibration. A generic optimisation routine in LS-OPT was applied in the optimisation, where 100 equidistant regression points were used in the calculation of the mean square error to ensure a good fit in all parts of the engineering stress-strain curve. The hardening parameters were found by minimising the mean square error and are given in Table 4. The density, elastic constants and strain-rate constants are taken from Aune et al. [34] and are listed in Table 5. A comparison between numerical and experimental results is shown in Figure 1, and one can see that the numerical model captures the overall material response well.

4.2.2. Foam Cores

The strain hardening parameters for the foam cores were calibrated against the uniaxial compression tests conducted by Reyes and Børvik [6], see Section 2.2.1. As the foams in this study are assumed to have a negligible plastic contraction, the yield surface parameter α is found from Equation (12) to be 2.12 for all foams studied. The negligible plastic contraction also allowed for the hardening parameters to be directly calibrated from the experimental results without inverse modelling. For each test performed in the normal direction (ND), a set of hardening parameters (i.e., σ p , γ , α 2 and β in Equation (16)) was calibrated to the experimental Cauchy stress-logarithmic plastic strain curves using a least-squares method. The acquired set of parameters for all foam densities was then used for fitting constants in the density-dependent hardening model in Equation (17). As ε D is directly calculated based on the relative densities of the foams and the base material, according to Equation (18), no calibration of this parameter is needed. For all applications of this relation for ε D , a density of 1050 kg/m3 for polystyrene was assumed [2]. The obtained constants for the density-dependent hardening model are presented in Table 6. As the density-dependent model only applies to the plastic hardening, elastic constants and thus contact behaviour in the numerical models are given by a single input based on the average density of the modelled material. The density and Young’s modulus are taken from Reyes and Børvik [6], and are given in Table 2, while the elastic contraction is taken as ν e = 0.01 [43].
To verify the density-dependent model and the model constants, a numerical model of the foam sample consisting of a 50 mm cube discretised by 5 mm cubic 8-node elements with reduced integration was established in LS-DYNA. When calculating the hardening parameters, the average density of each foam type was used as input in the numerical model. Nodal displacements were applied to one side of the model to represent the compressive load, while nodes on the opposite side were constrained in all degrees of freedom. The remaining four sides of the cube where unconstrained from movement. The numerical stress-strain curves are compared to representative experimental results in Figure 14a. Here, it is seen that the density-dependent model describes the foam hardening behaviour with reasonable accuracy for the three studied densities.
The viscoplastic extension of the Deshpande-Fleck foam model was calibrated and verified by numerical simulations of the low-velocity impact tests described in Section 2.2.2. The same foam sample as described above was used, while the impactor was modelled as a rigid body with a total mass of 5.339 kg. In these simulations, an initial velocity of 5 m/s was given to the impactor. The contact force between the impactor and sample was obtained by a force transducer contact (*CONTACT_FORCE_TRANSDUCER_PENALTY) on the top plane of the sample. The strain-rate sensitivity of the foams was obtained by inverse modelling of the low-velocity impact tests. A range of values for the rate sensitivity parameter, c DF in Equation (19), between 0 and 0.1 in 0.01 intervals were applied to the low-velocity impact model, and a value of c DF = 0.02 for all three foam densities was found to give acceptable agreement with the experimental data. Numerical and experimental results for the low-velocity impact tests are compared in Figure 14b. Note that the force-displacement curves were truncated when the impactor reached zero velocity and that elastic unloading was omitted. It is confirmed that the viscoplastic model can capture the rate sensitivity observed in the foams reasonably well. For XPS-250 and XPS-400, the viscous increase in plateau stress is in good agreement with the experiments, while the increase in plateau stress is slightly underestimated for XPS-700. For both XPS-400 and XPS-700, the maximum displacement is in good agreement with the experimental results, while the maximum displacement is lower in the numerical simulation than in the experimental test for XPS-250.

4.3. Shock Tube Tests

4.3.1. Numerical Model

Figure 15 shows the numerical model used in the simulations of the shock tube tests. One-quarter of the test setup was modelled to decrease computational costs. The aluminium skins were modelled with quadrilateral four-node reduced integration Belytscko-Tsay (type 2) elements, with five integration points across the thickness and stiffness-based hourglass control. In the central blast-exposed area of the plate, an element size of 1 mm × 1 mm was used, while for the rest of the skin an element size of 4 mm × 4 mm was applied. MAT_107, i.e., the Modified Johnson-Cook model in LS-DYNA, with parameters as described in Section 4.2.1, was used to model the behaviour of the aluminium skins. The core of the sandwich panel was modelled using eight-node hexahedral elements with reduced integration (type 1). The same mesh as used for the skins was extruded in 1 mm intervals through the thickness of the core. This resulted in an element size of 1 mm × 1 mm × 1 mm in the blast-exposed area, and an element size of 4 mm × 4 mm × 1 mm in the periphery. The core materials were modelled with the modified version of the Deshpande-Fleck model described in Section 4.1 and the material parameters given in Section 4.2.2. Automatic surface-to-surface contact with a friction coefficient μ = 0.1 was used between all parts of the model. To account for the significant difference in material stiffness, the option SOFT = 1 was used in the contact formulation between the core and the skins/clamping frame.
The clamping frame and bolts were modelled as elastic using MAT_001 with density ρ = 7800 kg/m3, Young’s modulus E = 210 GPa and Poisson’s ratio ν s = 0.3 . Eight-node hexahedral elements with reduced integration and stiffness-based hourglass control (type 1) with an element size of about 5 mm were used for the clamping frame and bolts. Preliminary simulations of the setup included preloading of the bolts by applying a stress to the bolts’ cross-section and dynamic relaxation. The applied preload showed no significant increase in accuracy and was omitted in the numerical study due to the high computational cost.
Based on the measured densities, shown in Figure 2b, the core materials in the blast simulations of the sandwich components were given a density distribution, which is shown in Figure 16. As the density must be constant within each element, the applied density distribution is discretised to fit the element size of the model. This discretisation of the density distribution does introduce a mesh dependence in the models, but with the chosen element size of 1 mm × 1 mm × 1 mm the discretisation is sufficiently fine to capture the measured distributions.
The blast load was applied to the exposed area of 300 mm × 300 mm of the front skin as a tabulated pressure-time curve based on experiments using massive plates [26]. Pressure-time histories, as measured by pressure sensors mounted on the surface of massive steel plates, were fitted to the Friedlander equation given as
P r ( t ) = P r , m a x ( 1 t t a t d + ) exp ( b ( t t a ) t d + )
where P r , m a x is the peak reflected overpressure, t a is the arrival time of the blast wave at the specimen, t d + is the duration of the positive phase, and b is the exponential decay coefficient.
The results from tests on massive plates and the subsequent fitted parameters of the Friedlander equation were taken from Aune et al. [26] for tests with 10 and 15 bar firing pressure. For the tests with 12 bar driver pressure, no tests on massive plates were available. Thus, the Friedlander parameters for these tests were defined based on interpolation of the parameters obtained for tests with 5 to 20 bar firing pressures from Aune et al. [26]. The parameters used for modelling the blast loads are presented in Table 7. Note that the tabulated blast loads are based on results from massive plates, and thus possible FSI effects are not taken into account in this study. Such effects could be considered by performing fully coupled FSI-simulations like in [33] but have been omitted here due to the significant increase in computational cost. However, without considering FSI-effects in the numerical simulations, slightly conservative results are expected.

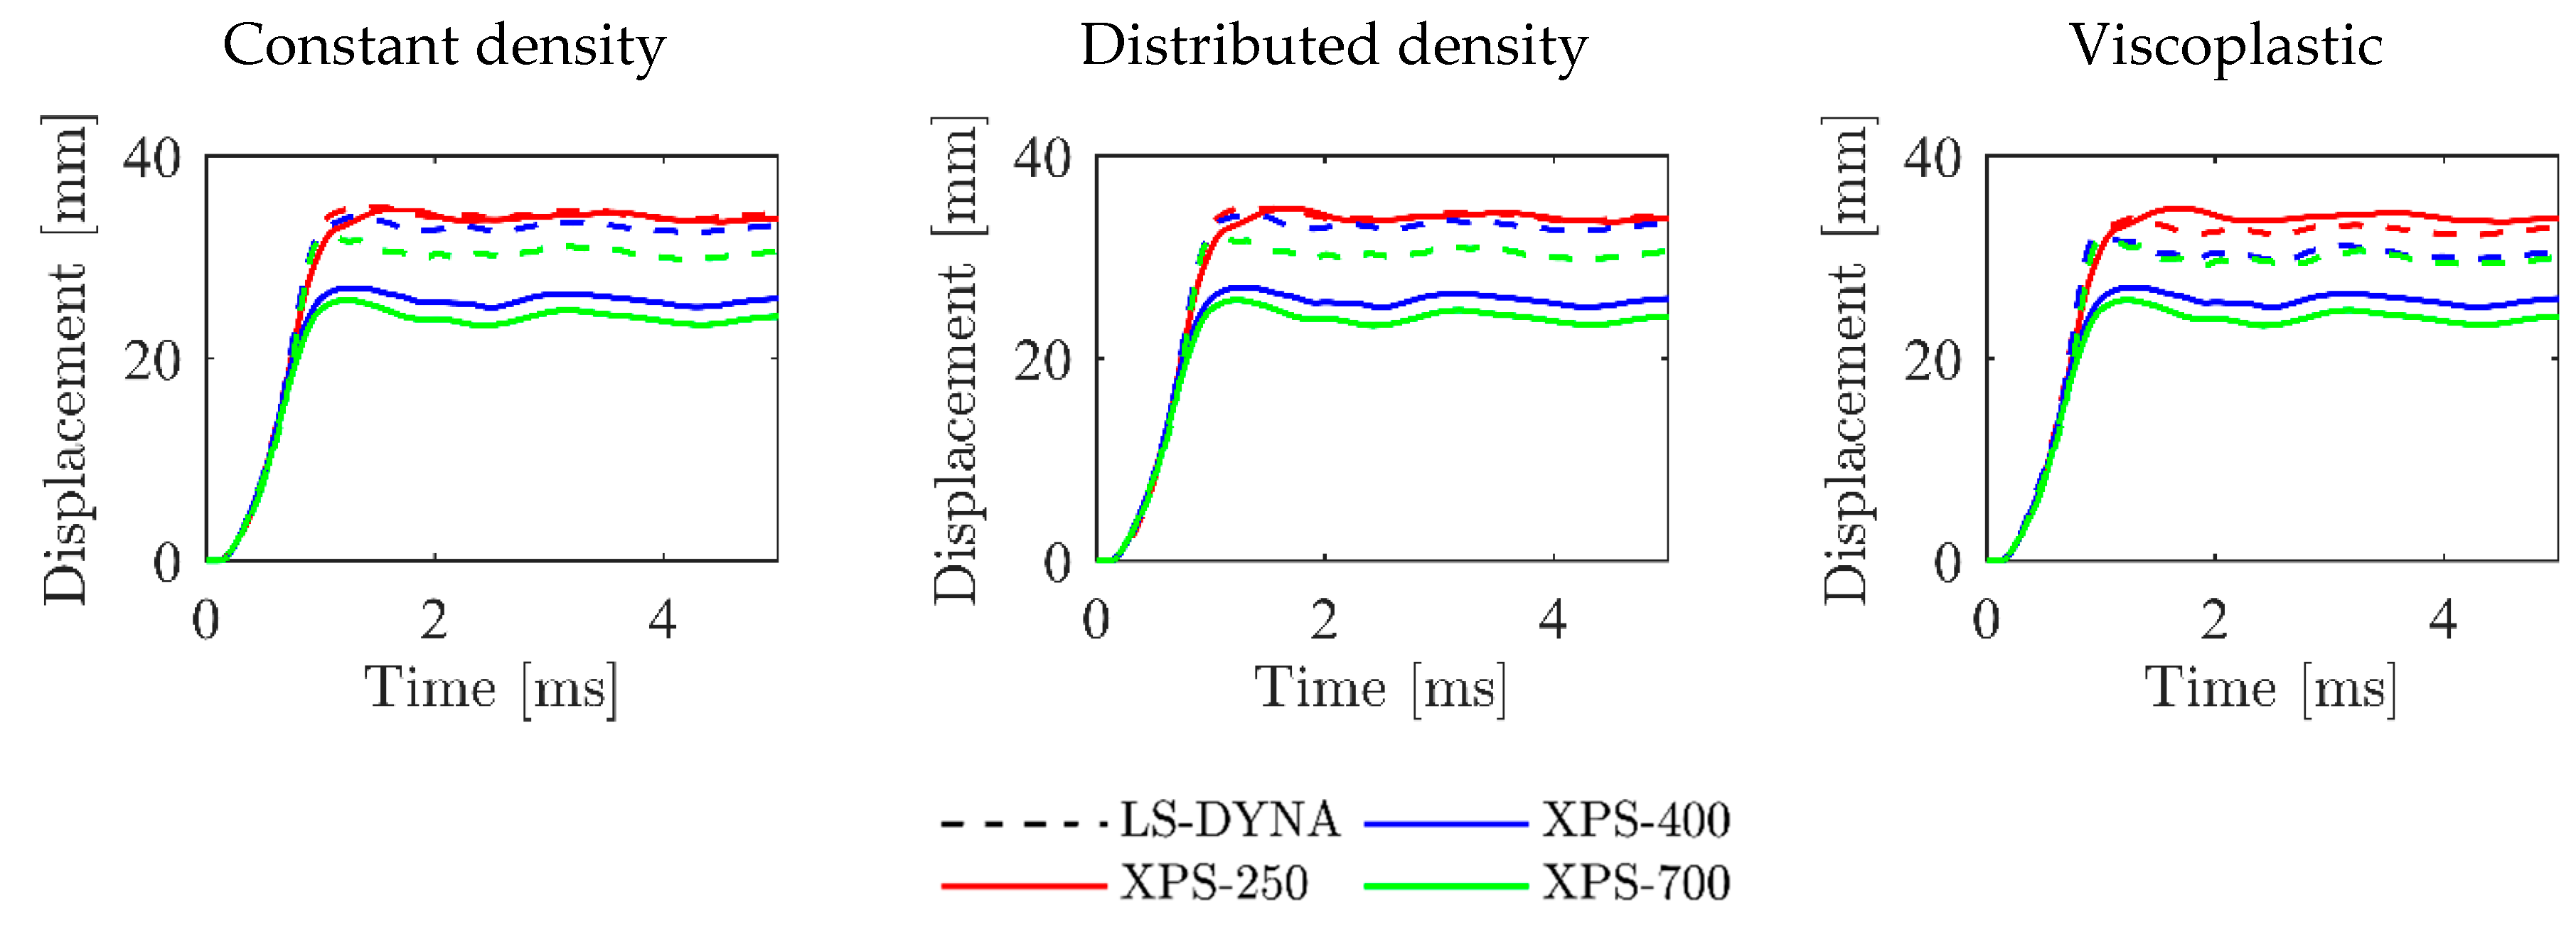
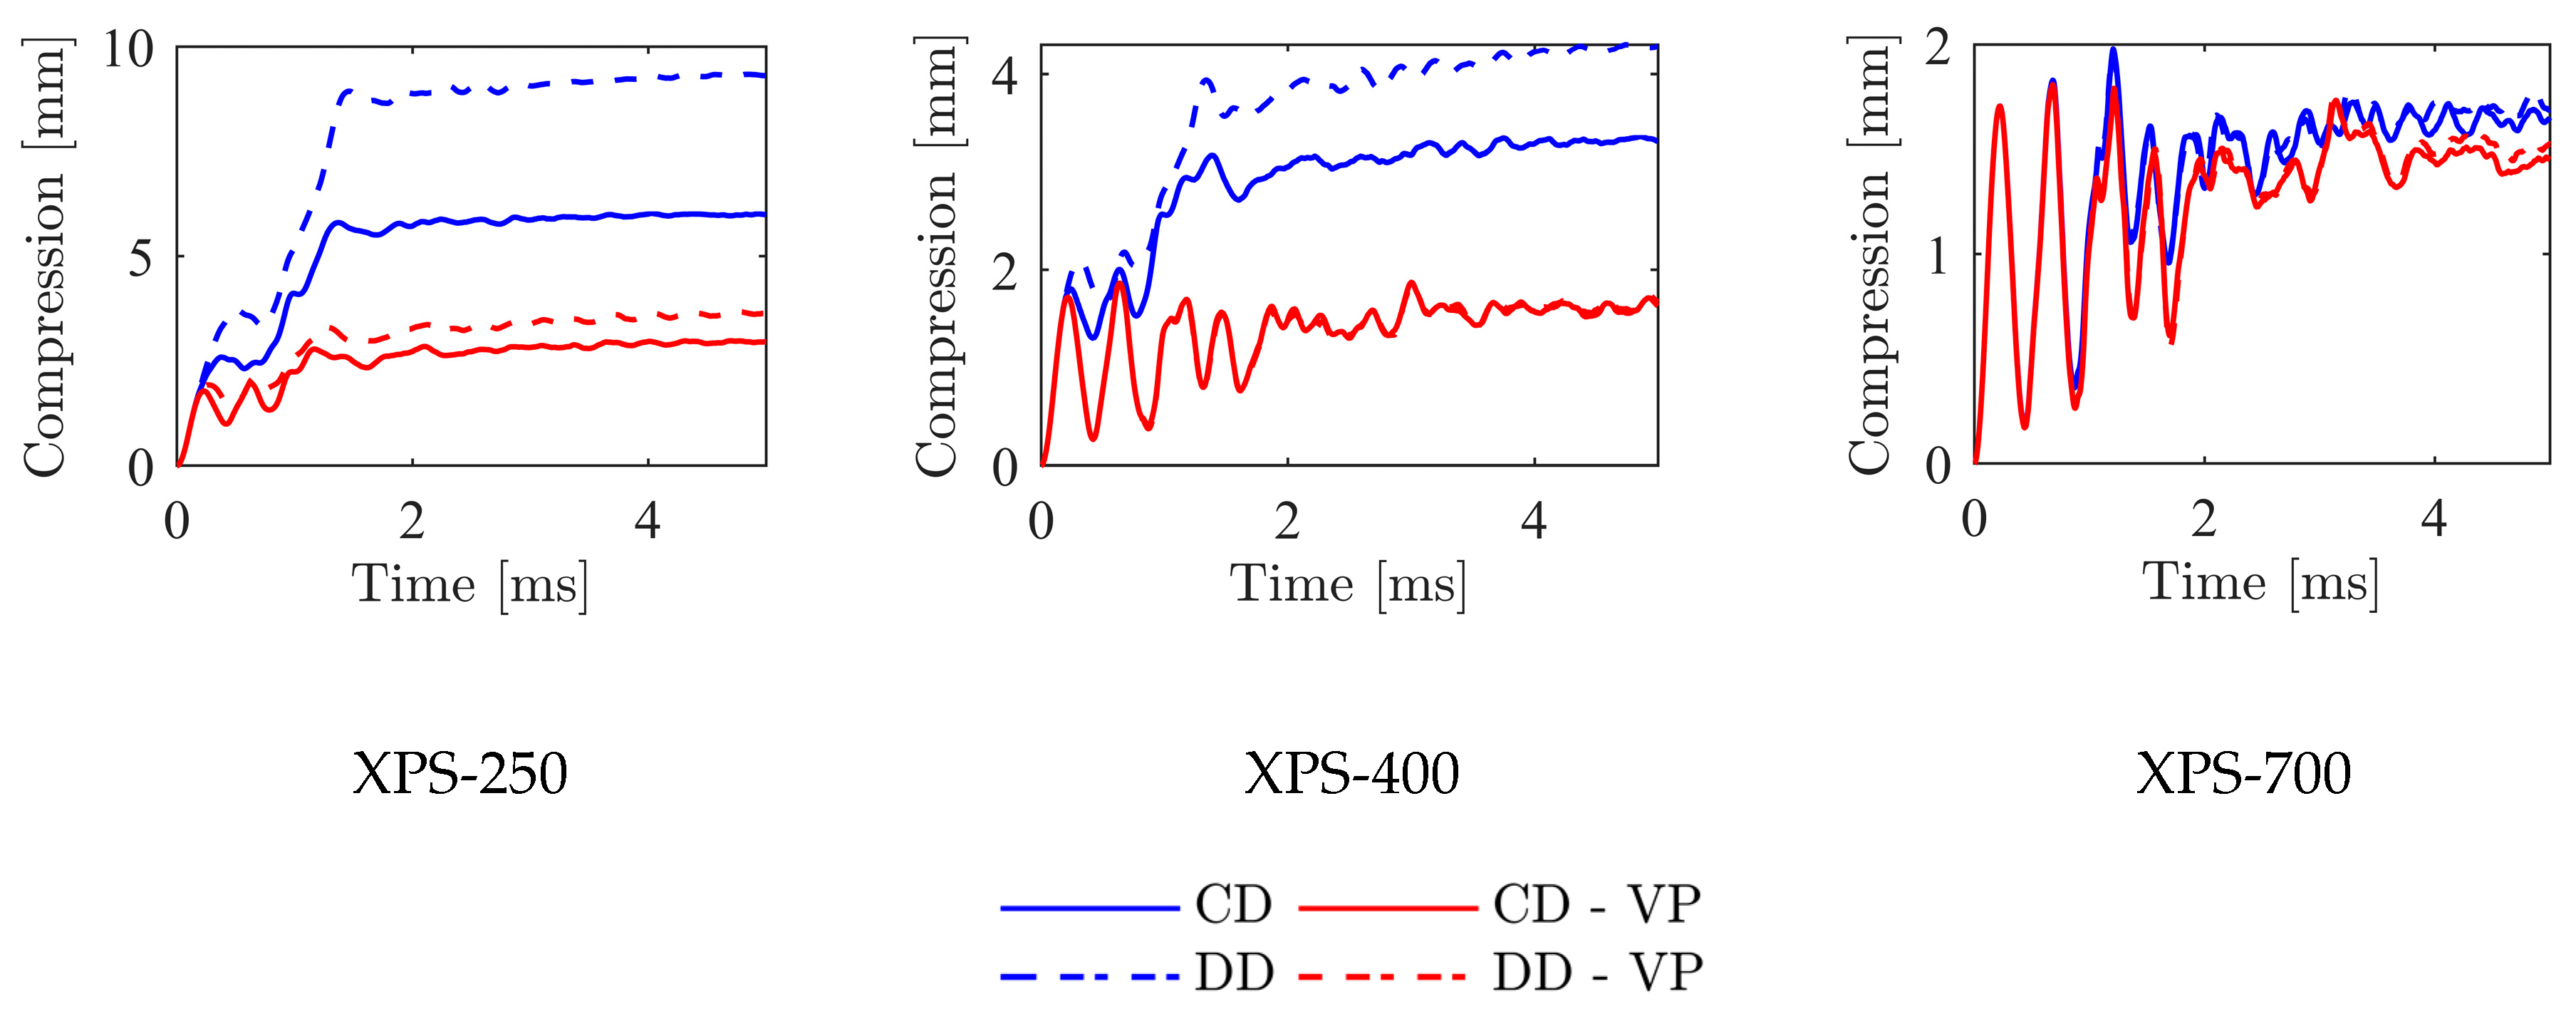
4.3.2. Blast Simulation Results

One emphasis in the numerical part of this study is to examine the influence of varying the material description of the core material. Numerical and experimental results are compared, but it was not expected that the rather simple numerical model could exactly replicate the experimental results. This is partly because the blast load is included without accounting for FSI effects, and thus not ideal for an accurate prediction of the structural response. However, it is expected that the trends in the response are correctly predicted even though FSI effects are not considered. Simulation results for load level P12 and P15 have been moved to Appendix A.2 to reduce the data amount presented in the text.
Midpoint displacements from numerical simulations of the aluminium skins only (i.e., without cores) are compared with the experimental results in Figure 17. As the load applied numerically does not account for FSI effects, the numerical displacements are consistently larger than the experimental values. These results agree with the observations of Aune et al. [26] for single steel plates subjected to a similar blast load. Overall, the results from the simulations show that the applied numerical model predicts the structural response reasonably well. In these simulations, no fracture criterion was applied. However, the value of the Cockcroft-Latham fracture parameter W [44] is calculated during simulations when MAT_107 is used. The value of W from these simulations was compared to the value obtained in simulations of the tensile tests until fracture appeared in the physical test. Based on this comparison, it is expected that fracture would have occurred in the 15 bar simulation and not in the 12 bar simulation. This is consistent with the experimental results.
The numerical results from the simulations of sandwich components will be presented in two parts. First, the numerical results obtained with the original, constant-density Deshpande-Fleck crushable foam model are compared to the experimental data to reveal the predictability of the standard model. Second, the difference in numerical results when incorporating distributed density and viscoplasticity to the material model is compared to the original, constant-density Deshpande-Fleck model.
Numerical midpoint displacements from simulations of the tests with the original Deshpande-Fleck model at 10, 12 and 15 bar firing pressure are presented in the leftmost graphs in Figure 18, Figure A5 and Figure A10, respectively. At 10 bar firing pressure, Figure 18 shows that the midpoint displacement from the simulation with XPS-250 is very close to the experimental result, while the numerical midpoint displacements for XPS-400 and XPS-700 are significantly higher than the experimental values. The difference between XPS-400 and XPS-700 is within the same range numerically as experimentally. The excellent agreement between experiments and simulations for XPS-250 is somewhat unexpected, since the method used to apply the loading should provide conservative results, i.e., a higher numerical than experimental displacement. Also, the difference in displacement between XPS-250 and XPS-400 is expected to be larger. The reason for this result is not entirely apparent, but as shown in Figures 22–24, the simulations with the weakest core material have significantly higher plastic deformations of the core compared to the other two core materials. As already seen in the results from the simulations of the low-velocity impact tests (Figure 14b) the model with XPS-250 has a noticeably higher energy absorption than what is observed experimentally. The results from the blast simulations could be affected both by the material calibration and the formulation of the Deshpande-Fleck model. As shown by Deshpande and Fleck in [45], polymeric foams do not necessarily follow the Deshpande-Fleck yield surface, since they generally have a lower yield stress in compression than in tension. This means that as the current model is calibrated from tests in uniaxial compression, the yield stress in tension may not be accurately represented.
The same trends as described above are observed in the results from the blast simulations with 12 bar firing pressure, shown in Figure A5, and 15 bar firing pressure, shown in Figure A10, where the difference in displacement is as expected between XPS-400 and XPS-700. However, XPS-250 has a lower maximum displacement than expected at these load levels.
The numerical results for the different core material formulations from simulations of tests at 10 bar firing pressure are presented in Figure 18, Figure 19, Figure 20, Figure 21, Figure 22, Figure 23 and Figure 24. These consist of simulations with constant density (CD), distributed density (DD), constant density with viscoplasticity (CD-VP) and distributed density with viscoplasticity (DD-VP). As shown in Figure 19, the back-skin displacement is not much affected by changing from the CD to the DD model. The core compression, shown in Figure 20, is on the other hand much more affected by the density distribution of the core material. Especially for the simulations of XPS-250, the core compression is nearly doubled for the DD, compared to the CD model. For XPS-400 and XPS-700 cores, which have much less plastic deformation at this load level, the difference between the CD and the DD model is much smaller. Note that the core compression reported in these plots is the difference in mid-point displacement of the back and front skin and does not represent the core compression of the whole specimen. However, the distribution of the internal energy, shown in Figure 21, implies that for XPS-250 and XPS-400 there is a significant increase in core internal energy when changing from the CD to the DD model. This increase in internal energy indicates that for the XPS-250 and XPS-400 materials, the core is dissipating more energy when the DD model is applied. For XPS-700, the same change in core internal energy from CD to DD is not observed at this load level. There are two possible reasons for this. First, the plateau stress of the XPS-700 is higher than the applied pressure, and thus there is not much plastic deformation of the core. Second, the density distribution found for XPS-700 is narrower (see Figure 2b), and therefore the effect of the distribution is less pronounced. These observations are further illustrated by the deformation profiles and plastic strain fields shown in Figure 22 for XPS-250, Figure 23 for XPS-400 and Figure 24 for XPS-700. For XPS-250, it is seen that the plastic strains in the core material is much higher at the centre of the cross-section with the DD model because the density is lowest there. An increase in plastic strain towards the centre of the plate is also seen. Both these effects give a better utilisation of the core material in terms of energy absorption. Note also that the introduction of a distributed density reduces the plastic strains in the core at the edge of the blast-exposed area, where the back skin meets the frame. This increase in plastic strain in the middle of the cross-section seems to be beneficial as it both lowers the forces transferred to the back skin and reduces the possibility of core fracture in this area. For XPS-400, the difference in behaviour between the CD and the DD model is similar to that of XPS-250, but less pronounced, as the material plateau stress is higher for XPS-400. For XPS-700, this localisation effect is almost non-existent since the plateau stress of XPS-700 is high compared to the applied load.
When the viscoplastic formulation for the core materials is applied, the back-skin midpoint displacement is reduced in all simulations since the viscous increase in plateau stress increases, as expected, the stiffness of the sandwich panels. The introduction of viscoplasticity also reduces the effect of modelling the density distribution, as the viscous increase in plateau stress will act to normalise the difference introduced by the density variation. This is especially noticeable in the core compression for XPS-400 and XPS-700, where there is almost no difference between the CD-VP and DD-VP model, as seen in Figure 20. This strong influence of the viscoplastic formulation on the numerical results indicates that the plastic strain rates in the problem are high (about 500 s−1 in the core material for XPS-250 at P15) so that a viscoplastic formulation of the core material is recommended to describe an accurate response.
Trends in midpoint displacement at a driver pressure of 12 bar are shown in Figure A5. The response is similar to that observed at 10 bar pressure, but with a smaller difference in displacement between the CD and the DD model and a smaller reduction in displacement when viscoplasticity is included. The midpoint core compression for XPS-250, Figure A6, does not increase by the same relative magnitude between CD and DD as for the lowest load because the higher load activates more of the constant density material. For XPS-400, the relative increase in midpoint core compression is higher between CD and DD than at the lower load level, which indicates that at this load level more of the core material has a low enough plateau stress to initiate plastic deformations with the DD model. For XPS-700, the midpoint core compression is very similar to the lower load level, as the plateau stress is still too high to allow significant plastic deformations regardless of how the material is modelled. The distribution of internal energy from the simulations at this load level, Figure A7, follows the trends seen at the lowest load level. Here, the highest dissipation is seen for the XPS-250 material with DD, while XPS-400 with the viscoplastic formulations shows a clear reduction in internal energy. XPS-700 yields almost the same result for all material formulations. An interesting observation is the reduced internal energy for the back skin and the increase in internal energy for the front skin for both XPS-250 and XPS-400 when the formulation is changed from CD to DD. When the distributed density model is applied, the reduced plateau stress in the low-density centre causes plastic deformation to occur at a lower transmitted pressure, and the pressure load transferred through the core to the back skin is thus reduced. Deformation profiles for XPS-250 and XPS-400, shown in Figure A8 and Figure A9, exhibit the same trends as at the lower load level, where more plastic deformation occurs in the lower-density centre of the core for both materials. Furthermore, the inclusion of a viscoplastic formulation reduces the plastic deformations in both models. The deformation profiles for XPS-700 are not displayed for brevity, as this material did not show any significant plastic deformations at this load level.
Midpoint displacements for the highest load level, i.e., 15 bar, are presented in Figure A10. At this load level, XPS-400 has a higher midpoint displacement than XPS-250 with the CD model. This increase in displacement for XPS-400 likely occurs because the load transmitted through the core is higher than for XPS-250, but the XPS-400 material at this load level is weak enough to allow significant deformations at the edge of the blast-exposed area, reducing the overall panel stiffness. The same increase in midpoint displacement is not observed for XPS-700 as this material has a high enough plateau stress and stiffness to avoid collapse of the core material at the edge of the blast-exposed area. This will eventually reduce the midpoint displacement. The trends for core compression, Figure A11, and internal energy, Figure A12, are similar for simulations at 12 and 15 bar firing pressure. For XPS-250, the core compression increases as the DD model is introduced and reduces as the VP model is introduced. The cross section, Figure A13, also exhibits the same trend as with the 10 and 12 bar load level, with higher plastic displacements and plastic strains in the core material. In a similar way as for the lower pressure loads, the core compression and energy absorption for the VP models of XPS-400 and all models with XPS-700 are low because the plateau stress in these models are higher than the applied blast load. Especially, as the VP models for XPS-400 is introduced, the plastic strains in the core material, shown in Figure A14, is significantly reduced.

5. Concluding Remarks

An experimental and numerical study on the response of sandwich panels with aluminium skins and extruded polystyrene foam cores exposed to blast loading has been presented. The main contribution from this work is the large amount of high-precision experimental data together with a validated numerical modelling strategy that may be used to improve simulation-based optimisation techniques of sandwich panels exposed to blast loading.
The constitutive behaviour of the aluminium skins and polystyrene foam cores was characterised through series of quasi-static material tests. In addition, the dynamic response of the foam cores was investigated through low-velocity impact tests. The results from the quasi-static tests were used to calibrate the modified Johnson-Cook material model for the skins and the Deshpande-Fleck material model for the foams. The material models were in general able to describe the quasi-static behaviour of the materials. An extension of the Deshpande-Fleck crushable foam model was implemented as a user-material subroutine in LS-DYNA to account for both the density distribution and the viscoplastic behaviour of the foams. When compared to the results from the low-velocity impact tests, the extended Deshpande-Fleck model was able to represent the viscoplastic behaviour of the core materials with reasonable accuracy.
In the blast load tests, sandwich panels with the different foam core materials were subjected to various blast load intensities. The failure load increased significantly for the sandwich panels compared to skins only. This increase was especially evident when comparing the results at the intermediate blast load. In general, the response of the test specimens in terms of back-skin displacement and core compaction correlated with the density of the foam core, and a lower density core gave a higher displacement of the back skin. Some discrepancies to this trend were however observed regarding fracture of the sandwich panels, since in one test the panel with intermediate core density failed while the others did not. Fracture of the panels may, on the other hand, be mitigated without changing the weight of the component by using a stronger or more ductile aluminium plate for the skins.
The numerical simulations captured the trends observed experimentally. They also showed that a model that takes the density distribution across the core into account dissipates more energy than a model with constant density, which confirms that a graded density foam core would be preferable in an energy absorbent. A viscoplastic formulation of the core material reduced the core compression and energy absorption. In this study, FSI effects were not considered, and the numerical simulations provided in general conservative results in terms of back skin displacement. It is however expected that including FSI in the modelling approach would scale the results proportionally so that the main trends will still be captured.

Author Contributions

K.A.B.: Formal analysis, methodology, investigation, visualization, writing—original draft preparation, writing-review and editing. A.R.: Conceptualisation, writing—original draft preparation, writing—review and editing. T.B. (Torodd Berstad): Formal analysis, software, writing—review and editing. M.L.: Writing—review and editing, supervision, funding acquisition. T.B. (Tore Børvik): Conceptualisation, writing—original draft preparation, writing—review and editing, supervision, funding acquisition. All authors have read and agreed to the published version of the manuscript.

Funding

The present work has been carried out with financial support from the Centre of Advanced Structural Analysis (CASA), Centre for Research-based Innovation, at the Norwegian University of Science and Technology (NTNU) and the Research Council of Norway through project no. 237885 (CASA).

Acknowledgments

The authors would like to acknowledge the assistance of Trond Auestad, Olaf Moriggi Kielland, Sigurd Løvstad Lekve and Ruben Løland Sælen with the various experimental programs.

Conflicts of Interest

The authors declare no conflict of interest. The funders had no role in the design of the study; in the collection, analyses, or interpretation of data; in the writing of the manuscript, or in the decision to publish the results.

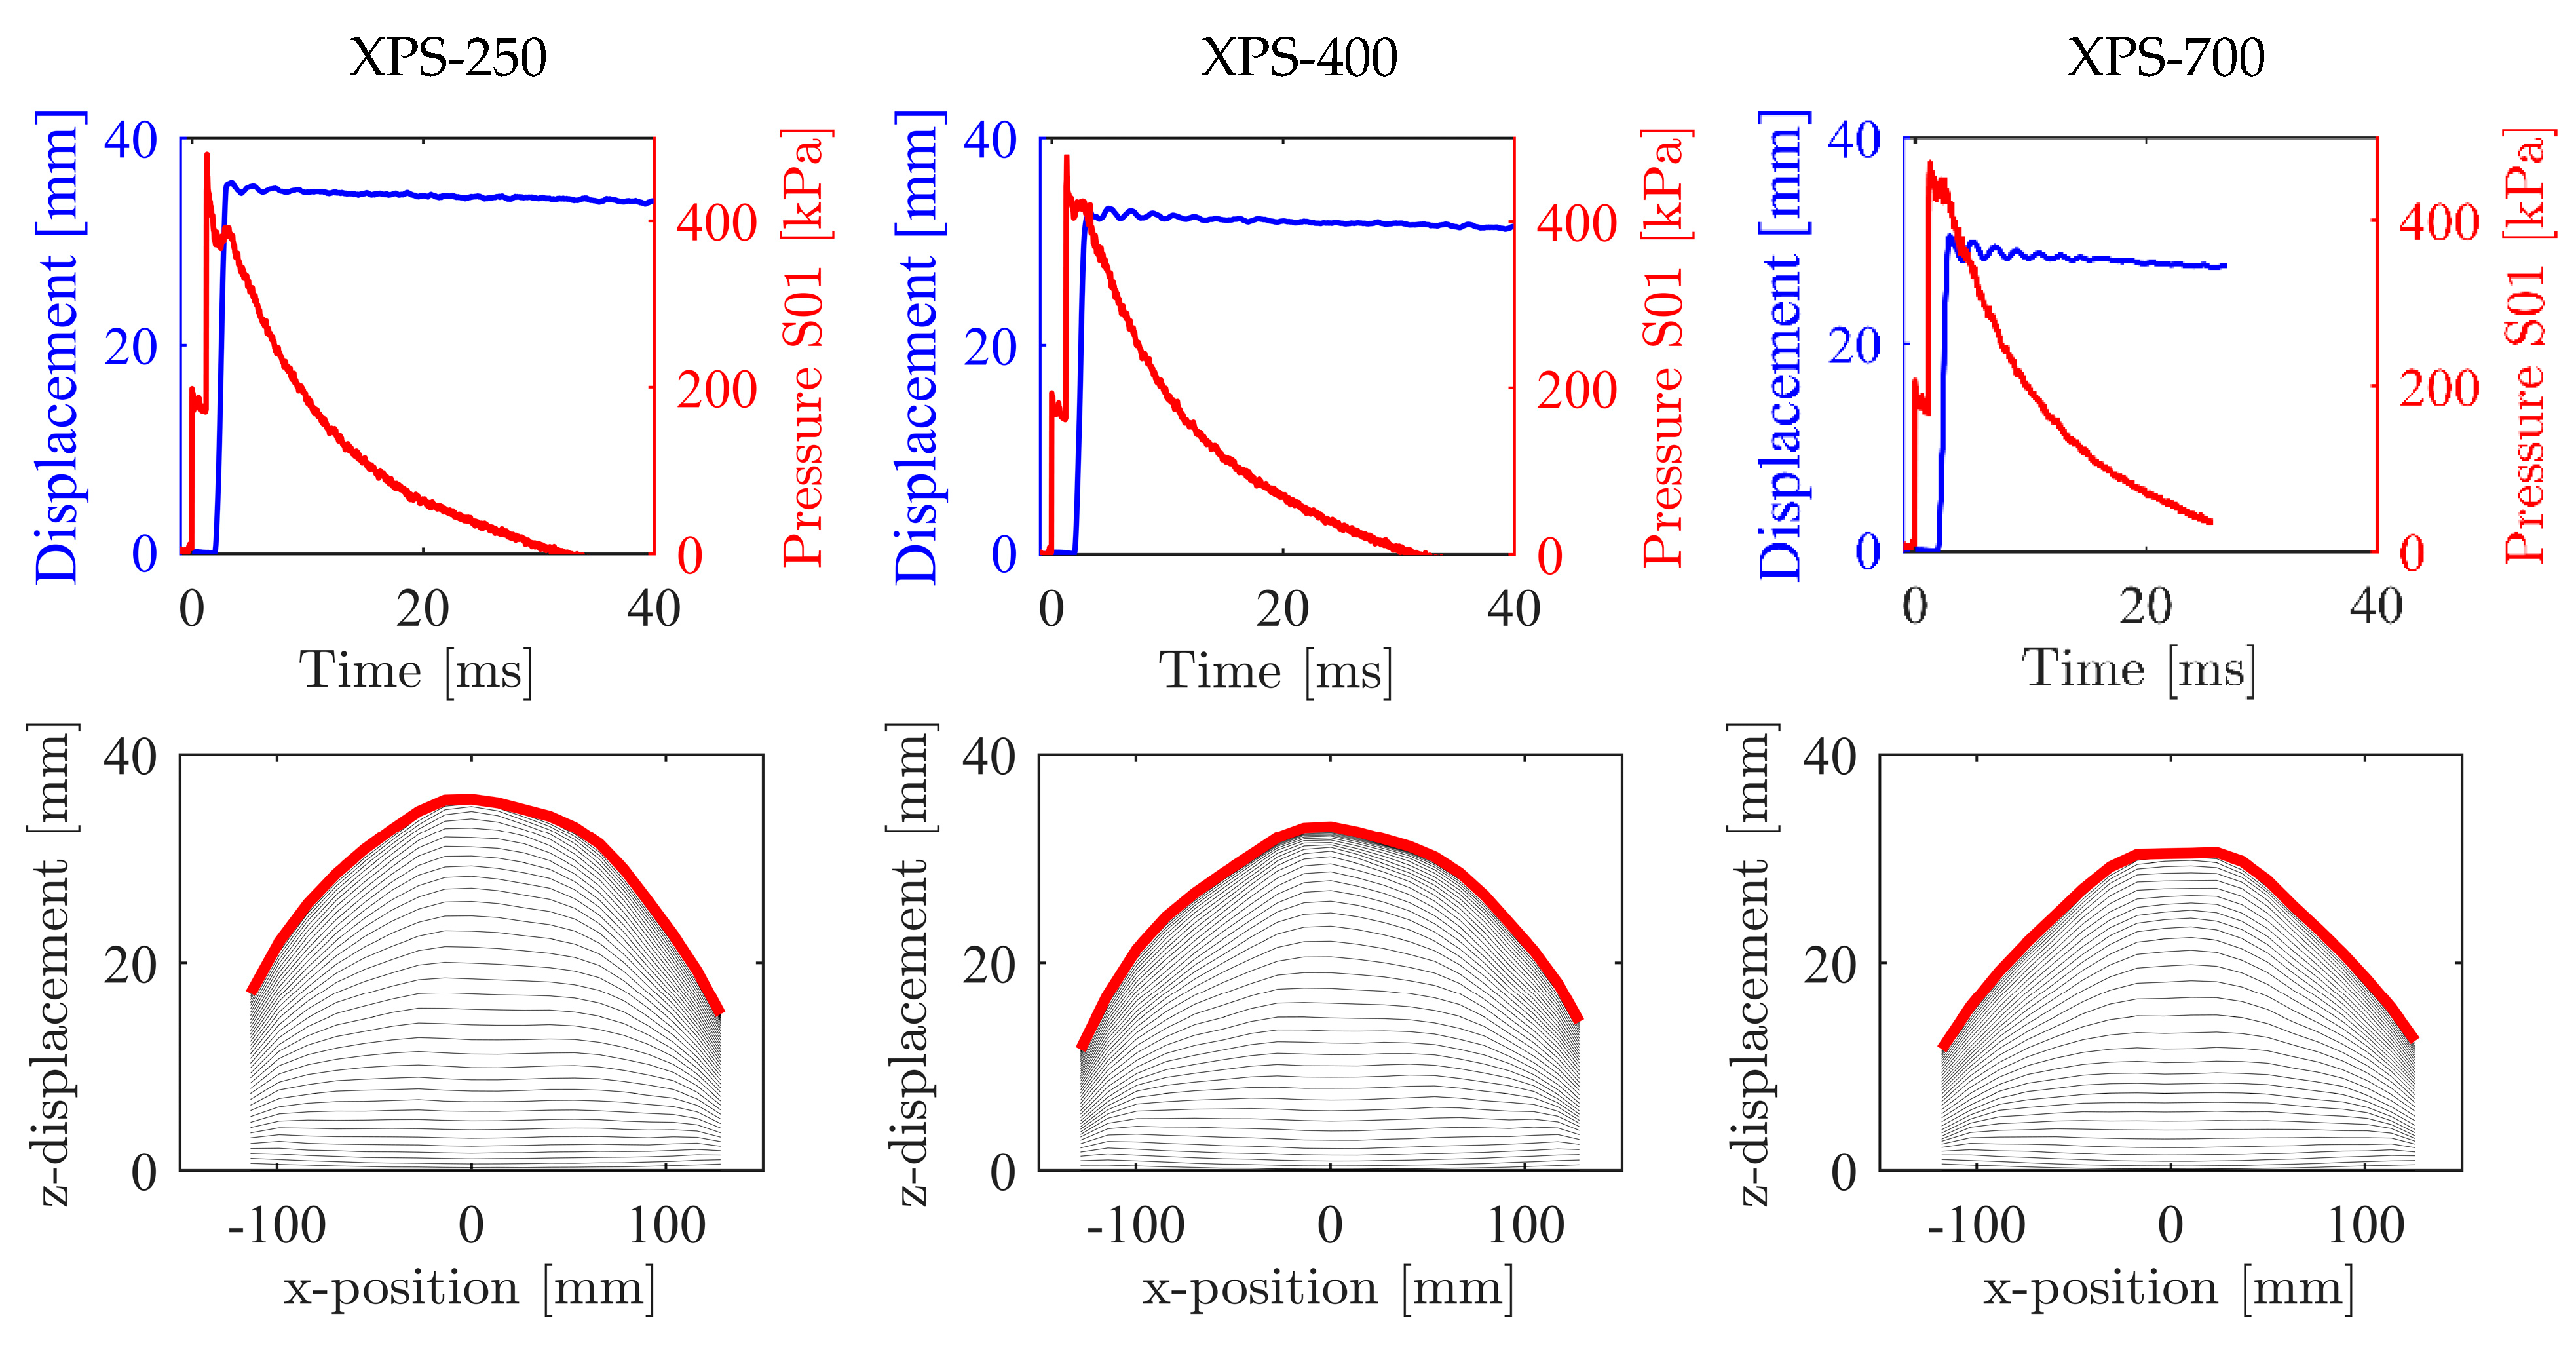
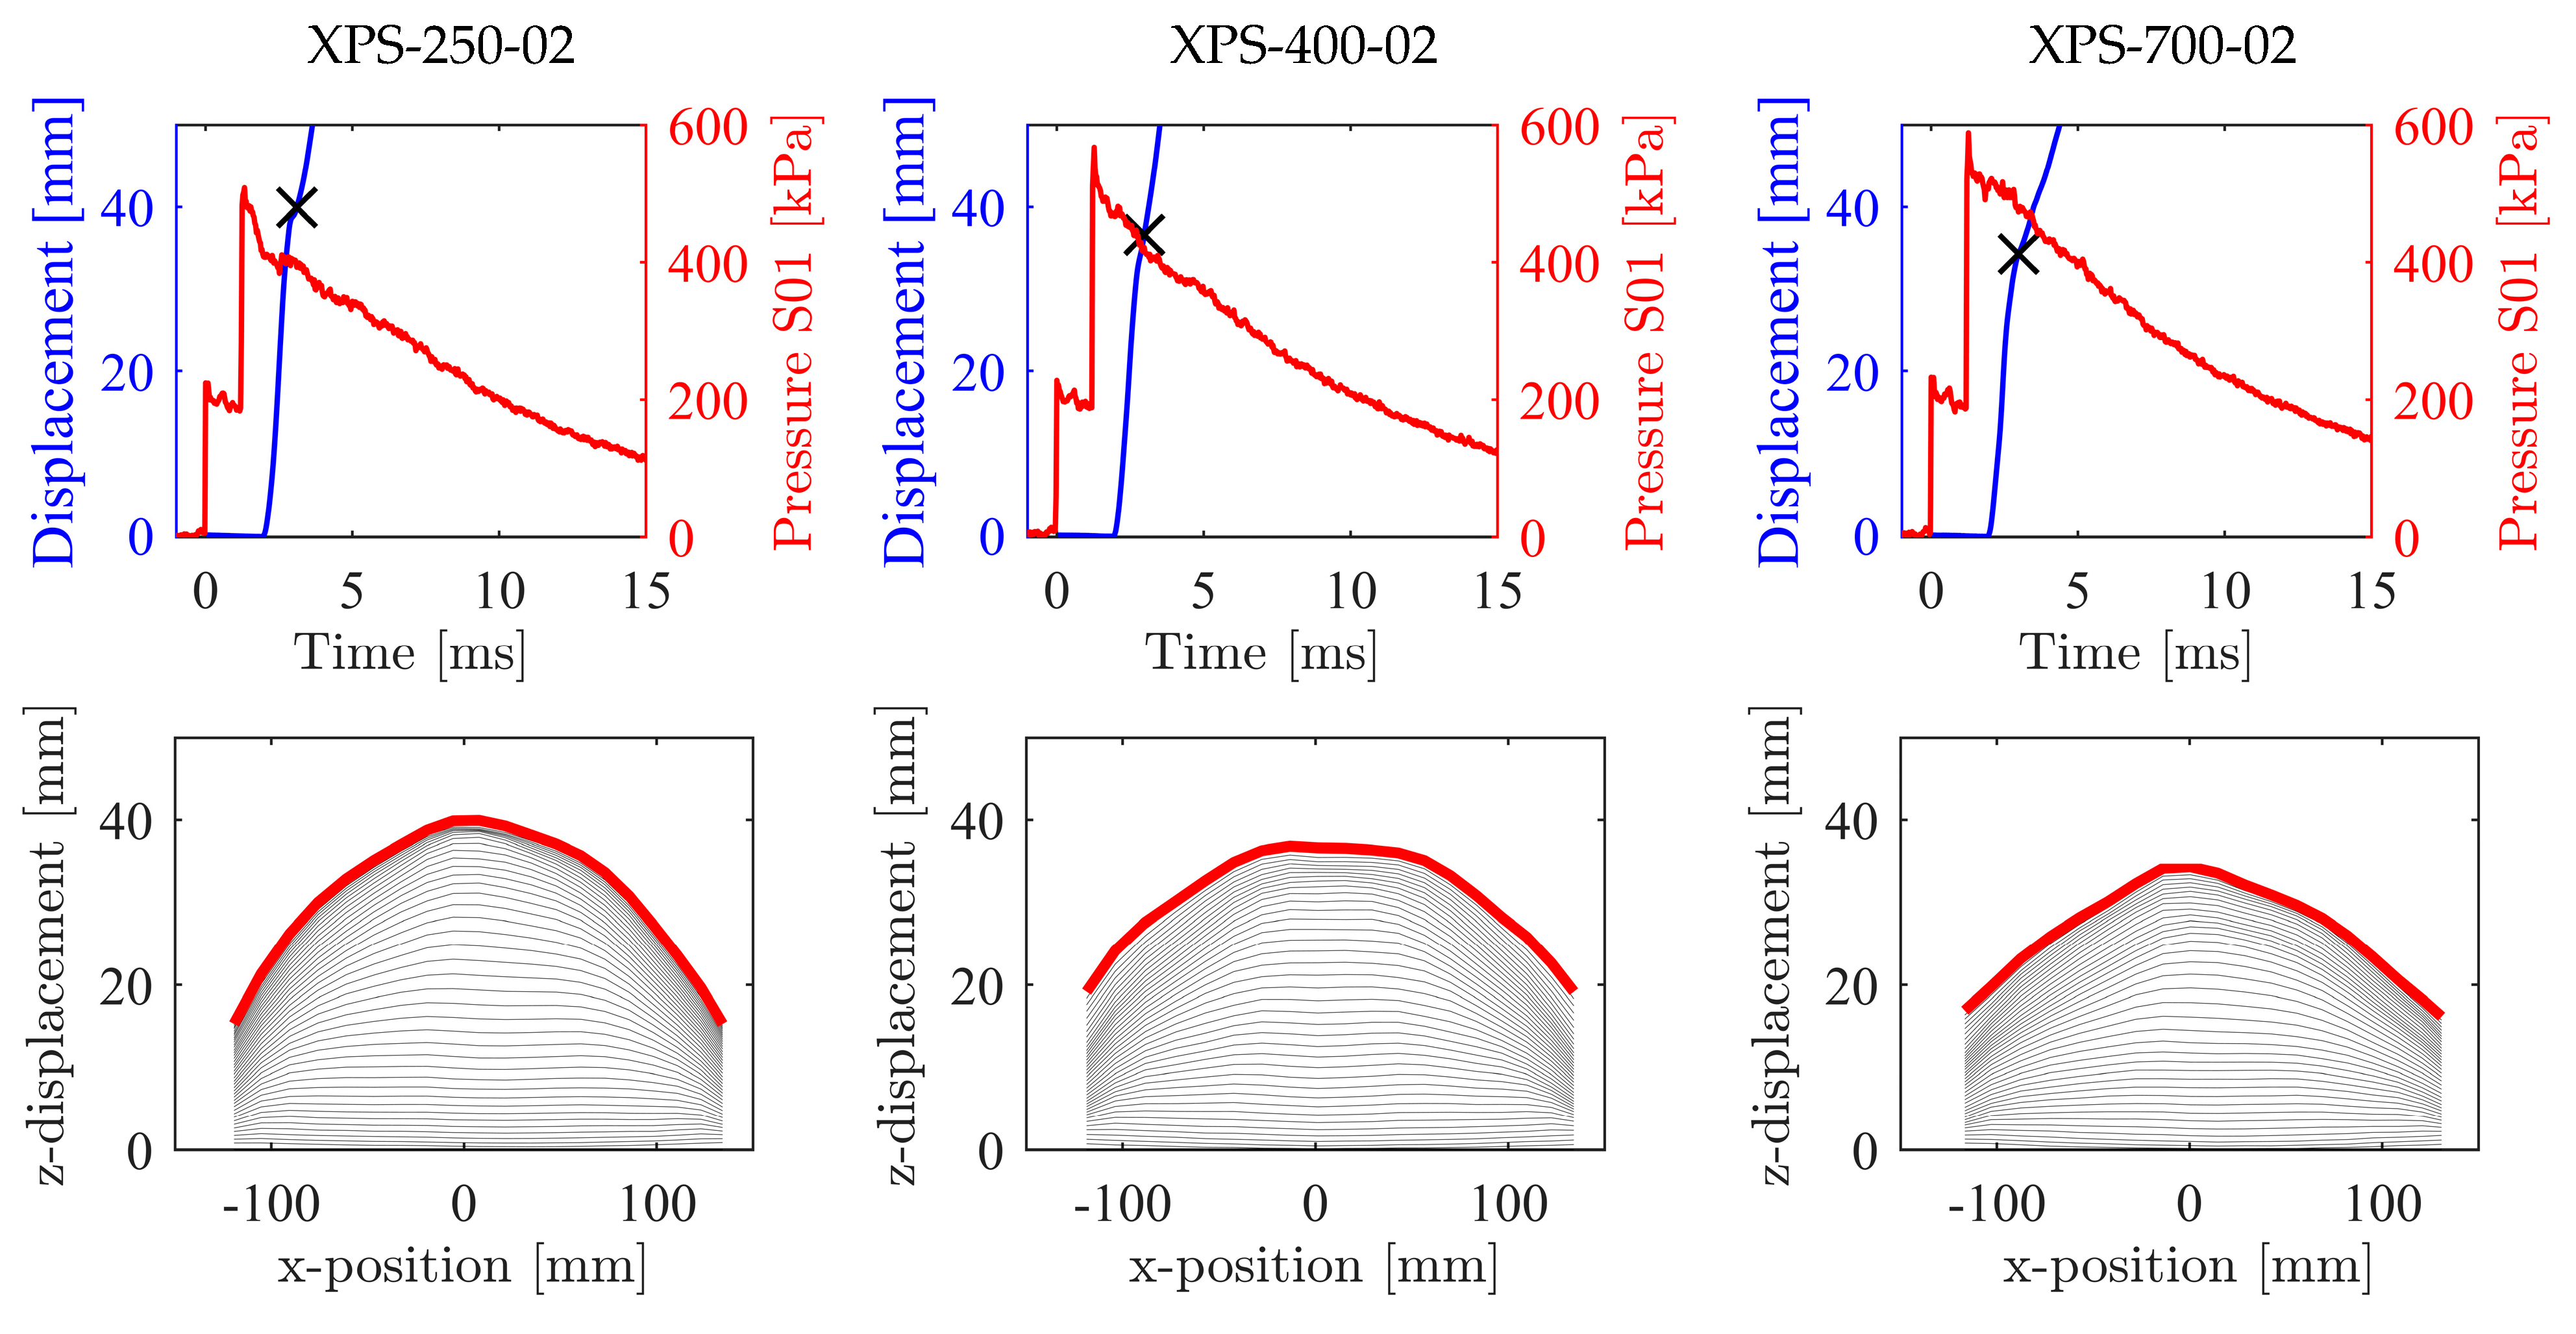
Appendix A. Additional Figures

Appendix A.1. Experimental Data

Figure A1. Displacement and pressure versus time (top) and displacement profiles (bottom) for tests on sandwich panels with 12 bar firing pressure.
Applsci 10 09061 g0a1
Figure A2. Displacement and pressure versus time (top) and displacement profiles (bottom) for tests on sandwich panels with 15 bar firing pressure, Series 1.
Applsci 10 09061 g0a2
Figure A3. Displacement and pressure versus time (top) and displacement profiles (bottom) for tests on sandwich panels with 15 bar firing pressure, Series 2.
Applsci 10 09061 g0a3
Figure A4. Post-test images of back skins (top), core (middle) and front skins (bottom) for series 2 at load level P15.
Applsci 10 09061 g0a4

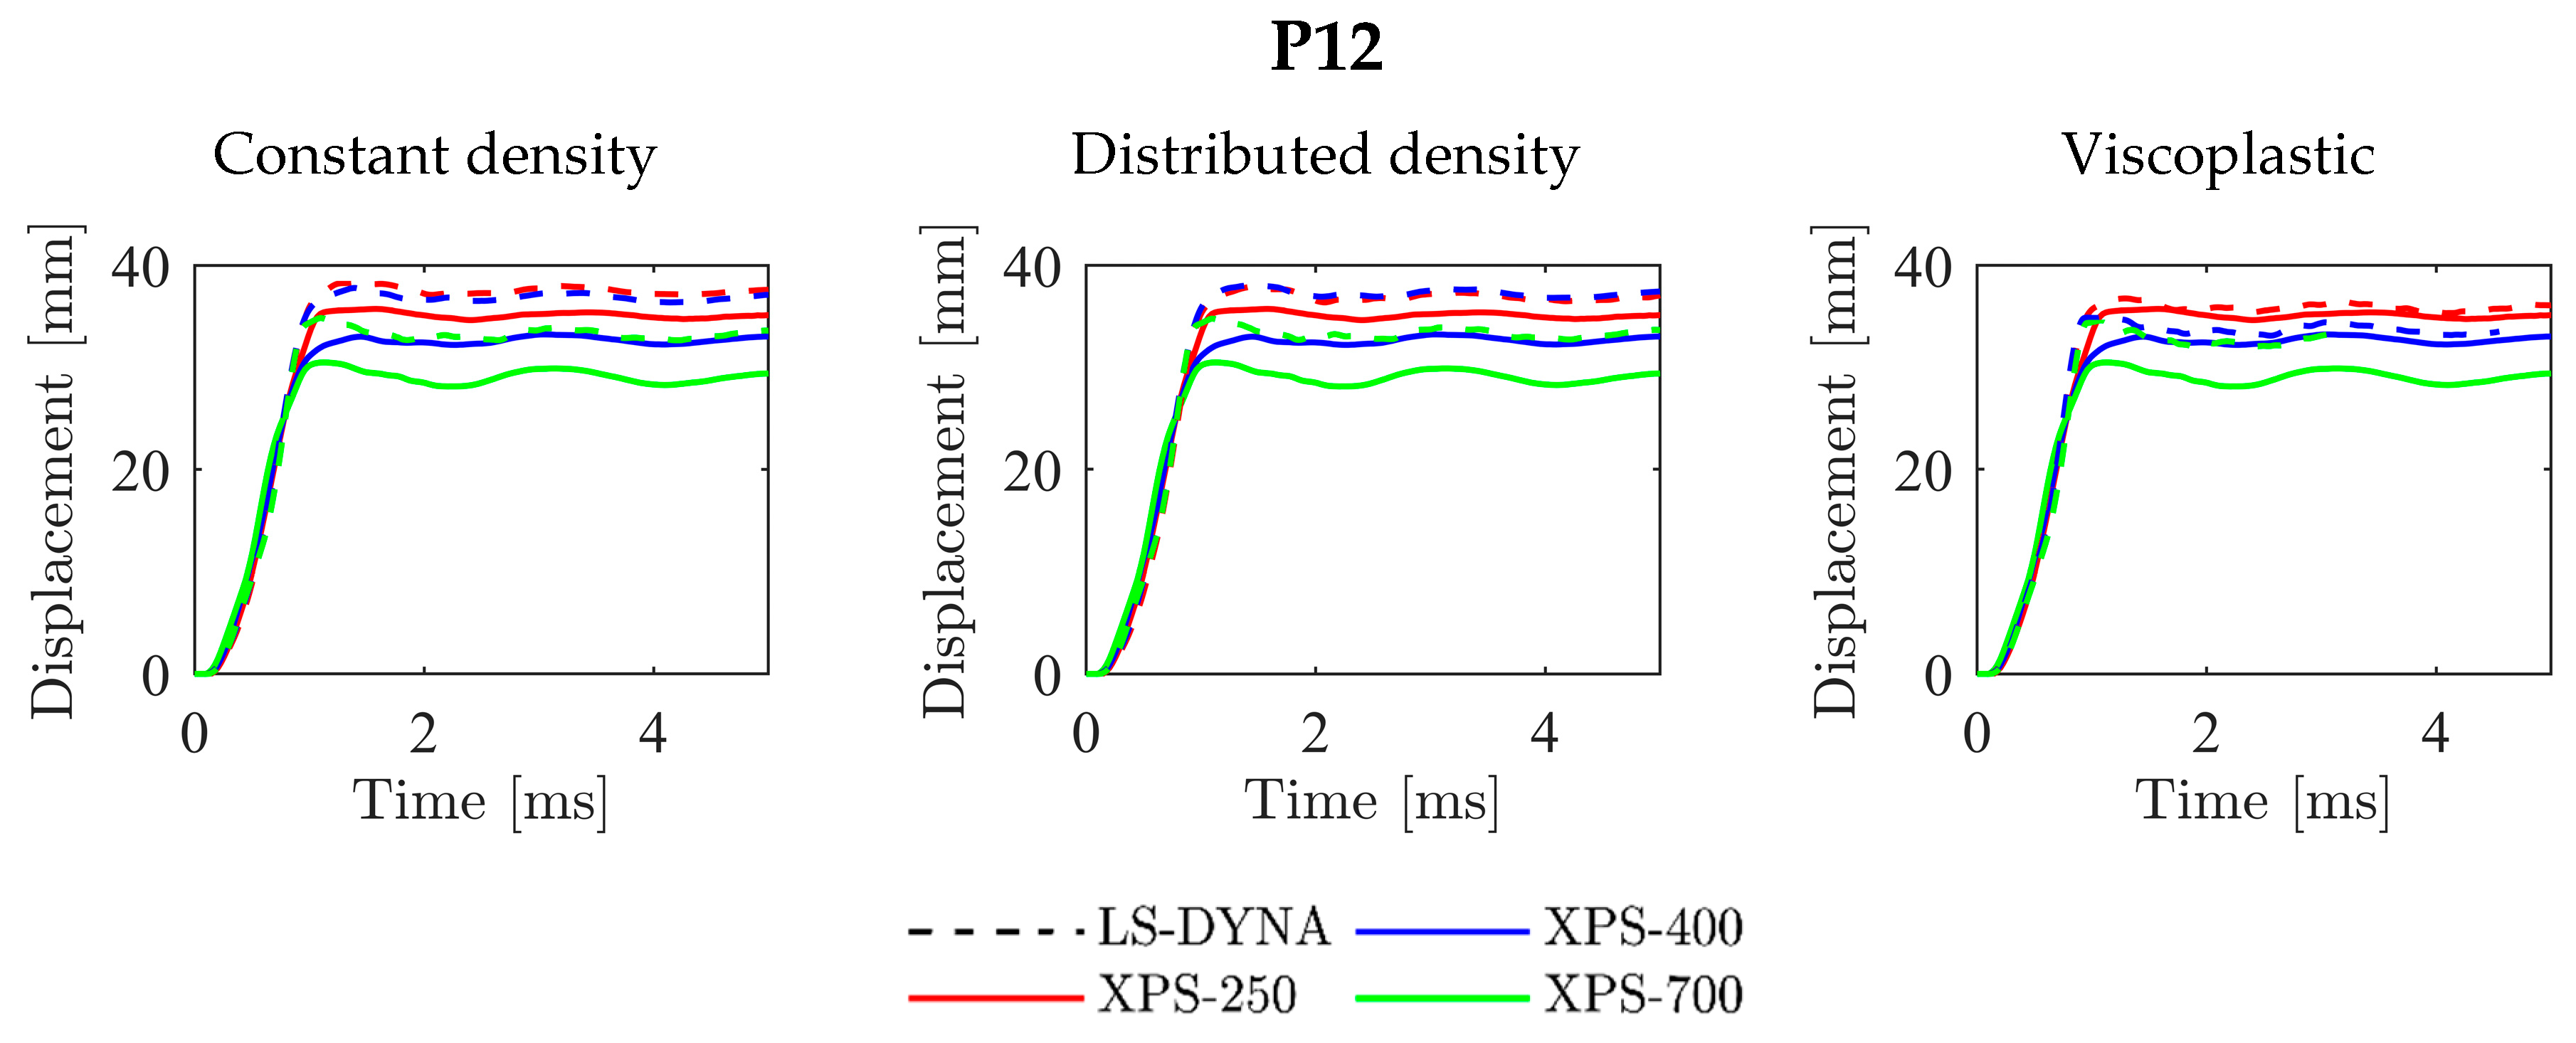
Appendix A.2. Numerical Data

Figure A5. Comparison between experimental and numerical midpoint displacements for tests with 12 bar firing pressure.
Applsci 10 09061 g0a5
Figure A6. Core compression from simulations of tests at 12 bar firing pressure.
Applsci 10 09061 g0a6
Figure A7. Distribution of internal energy in the numerical models of tests with 12 bar firing pressure.
Applsci 10 09061 g0a7
Figure A8. Deformation profiles and plastic strain from numerical simulations of test Sw_250_P12.
Applsci 10 09061 g0a8
Figure A9. Deformation profiles and plastic strain from numerical simulations of test Sw_400_P12.
Applsci 10 09061 g0a9
Figure A10. Comparison between experimental and numerical midpoint displacements for tests with 15 bar firing pressure.
Applsci 10 09061 g0a10
Figure A11. Core compression from simulations of tests at 15 bar firing pressure.
Applsci 10 09061 g0a11
Figure A12. Distribution of internal energy in the numerical models of tests with 15 bar firing pressure.
Applsci 10 09061 g0a12
Figure A13. Deformation profiles and plastic strain from numerical simulations of test Sw_250_P15.
Applsci 10 09061 g0a13
Figure A14. Deformation profiles and plastic strain from numerical simulations of test Sw_400_P15.
Applsci 10 09061 g0a14

References

  1. Karagiozova, D.; Langdon, G.; Nurick, G. Blast attenuation in Cymat foam core sacrificial claddings. Int. J. Mech. Sci. 2010, 52, 758–776. [Google Scholar] [CrossRef]
  2. Gibson, L.J.; Ashby, M.F. Cellular Solids Structure and Properties, 2nd ed.; Cambridge University Press: Cambridge, UK, 1997. [Google Scholar]
  3. Birman, V.; Kardomateas, G.A. Review of current trends in research and applications of sandwich structures. Compos. Part B Eng. 2018, 142, 221–240. [Google Scholar] [CrossRef]
  4. Sun, Y.; Li, Q. Dynamic compressive behaviour of cellular materials: A review of phenomenon, mechanism and modelling. Int. J. Impact Eng. 2018, 112, 74–115. [Google Scholar] [CrossRef] [Green Version]
  5. Senol, K.; Shukla, A. Dynamic response of closed cell PVC foams subjected to underwater shock loading. Int. J. Impact Eng. 2019, 130, 214–225. [Google Scholar] [CrossRef]
  6. Reyes, A.; Børvik, T. Quasi-static behaviour of crash components with steel skins and polymer foam cores. Mater. Today Commun. 2018, 17, 541–553. [Google Scholar] [CrossRef]
  7. Reyes, A.; Børvik, T. Low velocity impact on crash components with steel skins and polymer foam cores. Int. J. Impact Eng. 2019, 132, 103297. [Google Scholar] [CrossRef]
  8. Fleck, N.A.; Deshpande, V.S. The Resistance of Clamped Sandwich Beams to Shock Loading. J. Appl. Mech. 2004, 71, 386–401. [Google Scholar] [CrossRef]
  9. Deshpande, V.; Fleck, N. One-dimensional response of sandwich plates to underwater shock loading. J. Mech. Phys. Solids 2005, 53, 2347–2383. [Google Scholar] [CrossRef]
  10. Tilbrook, M.; Deshpande, V.; Fleck, N.A. The impulsive response of sandwich beams: Analytical and numerical investigation of regimes of behaviour. J. Mech. Phys. Solids 2006, 54, 2242–2280. [Google Scholar] [CrossRef]
  11. Tilbrook, M.; Deshpande, V.S.; Fleck, N.A. Underwater blast loading of sandwich beams: Regimes of behaviour. Int. J. Solids Struct. 2009, 46, 3209–3221. [Google Scholar] [CrossRef] [Green Version]
  12. Shukla, A.; Salazar, C.; Kishore, S.; Matos, H. Dynamic Response of Composite Structures in Extreme Loading Environments. In Advances in Thick Section Composite and Sandwich Structures; Springer: Cham, Switzerland, 2020; pp. 1–42. [Google Scholar]
  13. Lee, S.W. Advances in Thick Section Composite and Sandwich Structures; Springer: Cham, Switzerland, 2020. [Google Scholar]
  14. Gardner, N.; Wang, E.; Shukla, A. Performance of functionally graded sandwich composite beams under shock wave loading. Compos. Struct. 2012, 94, 1755–1770. [Google Scholar] [CrossRef]
  15. Jamil, A.; Guan, Z.; Cantwell, W.; Zhang, X.; Langdon, G.; Wang, Q. Blast response of aluminium/thermoplastic polyurethane sandwich panels—Experimental work and numerical analysis. Int. J. Impact Eng. 2019, 127, 31–40. [Google Scholar] [CrossRef]
  16. Chen, W.; Hao, H.; Hughes, D.; Shi, Y.; Cui, J.; Li, Z.-X. Static and dynamic mechanical properties of expanded polystyrene. Mater. Des. 2015, 69, 170–180. [Google Scholar] [CrossRef]
  17. Zhang, P.; Cheng, Y.S.; Liu, J.; Li, Y.; Zhang, C.; Hou, H.; Wang, C. Experimental study on the dynamic response of foam-filled corrugated core sandwich panels subjected to air blast loading. Compos. Part B Eng. 2016, 105, 67–81. [Google Scholar] [CrossRef]
  18. Li, Z.; Chen, W.; Hao, H. Numerical study of blast mitigation performance of folded structure with foam infill. Structures 2019, 20, 581–593. [Google Scholar] [CrossRef]
  19. Fahr, P.; Yazici, M.; Shukla, A. Shock response of filled corrugated sandwich structures under extreme temperatures. J. Sandw. Struct. Mater. 2018, 20, 130–149. [Google Scholar] [CrossRef]
  20. Kelly, M.; Arora, H.; Worley, A.; Kaye, M.; Del Linz, P.; Hooper, P.; Dear, J.P. Sandwich Panel Cores for Blast Applications: Materials and Graded Density. Exp. Mech. 2016, 56, 523–544. [Google Scholar] [CrossRef] [Green Version]
  21. Rolfe, E.; Kelly, M.; Arora, H.; Hooper, P.A.; Dear, J.P. Failure analysis using X-ray computed tomography of composite sandwich panels subjected to full-scale blast loading. Compos. Part B Eng. 2017, 129, 26–40. [Google Scholar] [CrossRef]
  22. Ye, N.; Zhang, W.; Li, D.; Huang, W.; Xie, W.; Huang, X.; Jiang, X. Dynamic response and failure of sandwich plates with PVC foam core subjected to impulsive loading. Int. J. Impact Eng. 2017, 109, 121–130. [Google Scholar] [CrossRef]
  23. Zhou, T.; Zhang, P.; Xiao, W.; Liu, J.; Cheng, Y. Experimental investigation on the performance of PVC foam core sandwich panels under air blast loading. Compos. Struct. 2019, 226, 111081. [Google Scholar] [CrossRef]
  24. Sun, G.; Wang, E.; Zhang, J.; Li, S.; Zhang, Y.; Li, Q. Experimental study on the dynamic responses of foam sandwich panels with different facesheets and core gradients subjected to blast impulse. Int. J. Impact Eng. 2020, 135, 103327. [Google Scholar] [CrossRef]
  25. Karen, I.; Yazici, M.; Shukla, A. Designing foam filled sandwich panels for blast mitigation using a hybrid evolutionary optimisation algorithm. Compos. Struct. 2016, 158, 72–82. [Google Scholar] [CrossRef]
  26. Aune, V.; Fagerholt, E.; Børvik, T.; Langseth, M. A shock tube facility to generate blast loading on structures. Int. J. Prot. Struct. 2016, 7, 340–366. [Google Scholar] [CrossRef] [Green Version]
  27. Available online: http://lstc.com/products/ls-dyna (accessed on 29 October 2020).
  28. Gruben, G.; Fagerholt, E.; Hopperstad, O.; Børvik, T. Fracture characteristics of a cold-rolled dual-phase steel. Eur. J. Mech. A Solids 2011, 30, 204–218. [Google Scholar] [CrossRef]
  29. Fagerholt, E. eCorr v4.0 Documentation. Available online: https://www.ntnu.edu/kt/ecorr (accessed on 29 October 2019).
  30. Grytten, F.; Børvik, T.; Hopperstad, O.; Langseth, M. Low velocity perforation of AA5083-H116 aluminium plates. Int. J. Impact Eng. 2009, 36, 597–610. [Google Scholar] [CrossRef]
  31. Available online: https://www.sundolitt.com/no/sundolitt/norway/standard-eps-og-xps/xps/ (accessed on 29 October 2020).
  32. Vestrum, O.; Langseth, M.; Børvik, T. Finite element modeling of porous polymer pipeline coating using X-ray micro computed tomography. Compos. Part B Eng. 2019, 172, 406–415. [Google Scholar] [CrossRef]
  33. Aune, V.; Valsamos, G.; Casadei, F.; Langseth, M.; Børvik, T. Fluid-structure interaction effects during the dynamic response of clamped thin steel plates exposed to blast loading. 2020. submitted. [Google Scholar]
  34. Aune, V.; Valsamos, G.; Casadei, F.; Larcher, M.; Langseth, M.; Børvik, T. Use of Damage-based Mesh Adaptivity to Predict Ductile Failure in Blast-loaded Aluminium Plates. Procedia Eng. 2017, 197, 3–12. [Google Scholar] [CrossRef]
  35. Børvik, T.; Hopperstad, O.; Berstad, T.; Langseth, M. A computational model of viscoplasticity and ductile damage for impact and penetration. Eur. J. Mech. Solids 2001, 20, 685–712. [Google Scholar] [CrossRef]
  36. Holmen, J.K.; Hopperstad, O.S.; Børvik, T. Low-velocity impact on multi-layered dual-phase steel plates. Int. J. Impact Eng. 2015, 78, 161–177. [Google Scholar] [CrossRef] [Green Version]
  37. Cronin, D.; Ouellet, S. Low density polyethylene, expanded polystyrene and expanded polypropylene: Strain rate and size effects on mechanical properties. Polym. Test. 2016, 53, 40–50. [Google Scholar] [CrossRef]
  38. Toksoy, A.K.; Güden, M. The strengthening effect of polystyrene foam filling in aluminium thin-walled cylindrical tubes. Thin-Walled Struct. 2005, 43, 333–350. [Google Scholar] [CrossRef] [Green Version]
  39. Deshpande, V.S.; Fleck, N.A. Isotropic models for metallic foams. J. Mech. Phys. Solids 2000, 48, 1253–1283. [Google Scholar] [CrossRef] [Green Version]
  40. Hanssen, A.; Hopperstad, O.; Langseth, M.; Ilstad, H. Validation of constitutive models applicable to aluminium foams. Int. J. Mech. Sci. 2002, 44, 359–406. [Google Scholar] [CrossRef]
  41. Reyes, A.; Hopperstad, O.S.; Berstad, T.; Hanssen, A.G.; Langseth, M. Constitutive modelling of aluminium foam including fracture and statistical variation of density. Eur. J. Mech. Solids 2003, 32, 815–835. [Google Scholar] [CrossRef]
  42. Available online: http://lstc.com/products/ls-opt (accessed on 29 October 2020).
  43. Mills, N.J. Polymer Foams Handbook: Engineering and Biomechanics Applications and Design Guide; Elsevier: Amsterdam, The Netherlands, 2007. [Google Scholar]
  44. Cockcroft, M.G.; Latham, D.J. Ductility and workability of metals. J. Inst. Met. 1968, 96, 33–39. [Google Scholar]
  45. Deshpande, V.; Fleck, N.A. Multi-axial yield behaviour of polymer foams. Acta Mater. 2001, 49, 1859–1866. [Google Scholar] [CrossRef]
Figure 1. (a) Engineering stress-strain curves based on two-dimensional digital image correlation (2D-DIC) measurements and (b) Cauchy stress-logarithmic plastic strain curves until necking in different material orientations regarding the rolling direction for aluminium alloy 1050A-H14.
Applsci 10 09061 g001
Figure 2. (a) Typical true stress-strain curves from material compression tests of extruded polystyrene (XPS) foams in the thickness direction (ND) as a function of density and strain rate, and (b) density variation through the ND direction of the XPS foams. All plots are reproduced from [6].
Applsci 10 09061 g002
Figure 3. Force-displacement curves for (a) XPS 250 at four impact velocities and (b) comparison of the three XPS densities at 5 m/s impact velocity.
Applsci 10 09061 g003
Figure 4. Stress-strain curves for the three XPS-foams at strain rates from 0.001 s−1 to 100 s−1.
Applsci 10 09061 g004
Figure 5. Overview of SIMLab Shock Tube Facility (SSTF) [26].
Applsci 10 09061 g005
Figure 6. Image showing the mounting of the sandwich component at the end of the shock tube driven section.
Applsci 10 09061 g006
Figure 7. Sketch of the test specimen and clamping frame. All dimensions in mm.
Applsci 10 09061 g007
Figure 8. Displacement and pressure vs time (top) and displacement profiles (bottom) for tests on aluminium skins only.
Applsci 10 09061 g008
Figure 9. High-speed images of failure in test Sk_P15: (a) initiation of tearing along the vertical edges (t = 1.35 ms), (b) complete tearing along the vertical edges (t = 1.75 ms), (c) tearing starts in the upper horizontal edge (t = 2.16 ms), and (d) complete failure along the entire frame (t = 2.97 ms).
Applsci 10 09061 g009
Figure 10. Displacement and pressure versus time (top) and displacement profiles (bottom) for tests on sandwich panels with 10 bar firing pressure.
Applsci 10 09061 g010
Figure 11. Mid-point displacement of the aluminium skins only and the sandwich panels at (a) 10 bar firing pressure, (b) 12 bar firing pressure and (c) 15 bar firing pressure. Solid and dashed lines are used for series 1 and 2, respectively.
Applsci 10 09061 g011
Figure 12. Measured pressure in sensor 1 for the aluminium skins only and the sandwich panels at (a) 10 bar firing pressure, (b) 12 bar firing pressure and (c) 15 bar firing pressure. Solid and dashed lines are used for series 1 and 2, respectively.
Applsci 10 09061 g012
Figure 13. Post-test images of back skins (top), core (middle) and front skins (bottom) for series 1 at load level P15.
Applsci 10 09061 g013
Figure 14. Comparison between experimental and numerical results for (a) quasi-static and (b) low-velocity impact loading of foam cubes. The maximum displacement obtained numerically is denoted by a cross for legibility.
Applsci 10 09061 g014
Figure 15. Illustrations of the numerical model: (a) Complete assembly and (b) sandwich specimen. Note that the mesh for flanges and bolts is omitted for clarity.
Applsci 10 09061 g015
Figure 16. Visualisation of the density distribution as applied in the numerical models.
Applsci 10 09061 g016
Figure 17. Comparison between experimental and numerical mid-point displacements for aluminium skins only.
Applsci 10 09061 g017
Figure 18. Comparison between experimental and numerical midpoint displacements for tests with 10 bar firing pressure.
Applsci 10 09061 g018
Figure 19. Back-skin displacements from simulations of tests at 10 bar driver pressure.
Applsci 10 09061 g019
Figure 20. Core compression from simulations of tests at 10 bar driver pressure.
Applsci 10 09061 g020
Figure 21. Distribution of internal energy in numerical simulations of tests with 10 bar firing pressure.
Applsci 10 09061 g021
Figure 22. Deformation profiles and plastic strain fields from numerical simulations of test Sw_250_P10.
Applsci 10 09061 g022
Figure 23. Deformation profiles and plastic strain fields from numerical simulations of test Sw_400_P10.
Applsci 10 09061 g023
Figure 24. Deformation profiles and plastic strain fields from numerical simulations of test Sw_700_P10.
Applsci 10 09061 g024
Table 1. Chemical composition of AA1050-H14 (in wt. %).
SiFeCuMnMgZnTiAl
0.040.320.0010.0020.0000.0000.02Balance
Table 2. Material properties (mean values based on five tests) of the foam samples in thickness (normal) direction (ND) [6].
MaterialDensity, ρ
[kg/m3]
Elastic
Modulus, E
[MPa]
Yield
Stress, σy
[MPa]
Plateau
Stress, σp
[MPa]
Densification
Strain, εD
[–]
MeanSD
XPS-25034.10.3813.70.260.343.36
XPS-40037.90.6518.50.410.493.68
XPS-70050.80.3823.50.730.773.46
Table 3. Test matrix and selected results from blast tests.
TestNominal Firing
Pressure [bar]
Core
Material
M s
[–]
PS01,in
[kPa]
PS01,max
[kPa]
umax
[mm]
Sk_P1010-1.46167.9378.433.3
Sw_250_P10_1XPS-2501.49170.9375.333.5
Sw_250_P10_2*XPS-2501.50161.9389.934.4
Sw_400_P10XPS-4001.47167.9409.525.7
Sw_700_P10XPS-7001.49171.5407.124.1
Sk_P12*12-1.57198.9461.841.2
Sw_250_P12XPS-2501.57198.3480.335.7
Sw_400_P12XPS-4001.55193.9478.833.0
Sw_700_P12*XPS-7001.57197.6469.730.5
Sk_P1515-1.59218.5512.7Failure
Sw_250_P15_1XPS-2501.60223.4503.545.6
Sw_250_P15_2XPS-2501.61224.0508.4Failure
Sw_400_P15_1XPS-4001.60226.4549.9Failure
Sw_400_P15_2XPS-4001.61227.7567.4Failure
Sw_700_P15_1XPS-7001.61227.7523.136.2
Sw_700_P15_2XPS-7001.61232.2588.5Failure
Table 4. Material hardening parameters for aluminium alloy AA1050-H14.
σ 0
[MPa]
Q 1
[MPa]
C 1
[MPa]
Q 2
[MPa]
C 2
[MPa]
80.025.71000.07.621.4
Table 5. Material constants for aluminium alloy AA1050-H14 (from [34]).
E
[GPa]
ν
[–]
ρ
[kg/m3]
c MJC
[–]
p ˙ 0
[s−1]
70.00.3027000.0145 × 10−4
Table 6. Density-dependent hardening constants for the XPS foams.
σ p
[MPa]
γ
[–]
α 2
[–]
1 / β
[–]
C 0 [–] 0 0 10.01 0.17
C 1 [–] 700 1.017 × 10 4 1.618 54.81
n [–] 2.27 2.615 0.3874 2.114
Table 7. Parameters of the Friedlander equation curve-fitted to the pressure measurements from massive plates tests.
TestNominal Firing
Pressure [bar]
P r , m a x
[kPa]
t d +
[ms]
b
[–]
P1010446.235.41.571
P1212519.339.81.892
P1515606.644.12.025
Publisher’s Note: MDPI stays neutral with regard to jurisdictional claims in published maps and institutional affiliations.

