Article

Aveiro Canyon Head (Portugal) Submarine Slope Instability Assessment

by
Nuno Lapa
1,*,
Fernando M. F. S. Marques
2 and
Aurora Rodrigues
1
1
Instituto Hidrográfico, Marine Geology Division, 1249-093 Lisbon, Portugal
2
Faculty of Sciences, Department of Geology and Instituto Dom Luiz, University of Lisbon, 1749-016 Lisbon, Portugal
*
Author to whom correspondence should be addressed.
Appl. Sci. 2020, 10(24), 9038; https://doi.org/10.3390/app10249038
Submission received: 10 November 2020 / Revised: 15 December 2020 / Accepted: 16 December 2020 / Published: 17 December 2020
(This article belongs to the Section Marine Science and Engineering)

Abstract

:
Mass wasting events are the main processes of sedimentary dynamics that affect the marine environment and which, due to their spatial and temporal variability, are difficult to study and evaluate. Affecting the marine floor, between the coastline and the abyssal plain, these processes are triggered by multiple causes, having different magnitudes and causing drastic changes and impacts on the marine environment and human activities. In this paper, the submarine landslide susceptibility affecting the upper course of the Aveiro canyon (West Iberian Margin) is addressed using statistical models which are based on the statistical relations between a landslide inventory and the landslide predisposing factors bathymetry, sediment cover, slope angle, aspect and curvature. The statistical methods were the widely proven bivariate information value (IV) and the multivariate logistic regression (LR). The model results were validated against the landslide inventory using receiver operating characteristic (ROC) curves and the corresponding area under the curve (AUC), which provided satisfactory results, with IV AUC = 0.79 and LR AUC = 0.83, in spite of the limitations of the databases used in this study. The results obtained suggest that these methods may be useful for the preliminary assessment of sea floor slope instability at a regional scale of analysis, enabling the selection of sites to be studied with much more detailed and expensive methods.

1. Introduction

Mass wasting events are the main dynamic process affecting marine sedimentary deposits [1,2], and are recognized as one of the main marine geohazards that can result in destruction of seabed infrastructure, collapse of coastal areas into the sea and landslide-generated tsunamis [3,4]. For economic development and marine resources growing exploration, the instabilities of the sea floor are of utmost interest. In fact, an increasing number of offshore engineering constructions require a stable substratum and the knowledge of the processes affecting the bottom sediments’ stability, for risk and integrity assessments and the evaluation of maintenance costs.
In natural sedimentary processes, the identification and mapping of submarine instabilities is important for the understanding of the downslope processes that characterize the particle transfer between the continental shelf and the deep ocean, through creeks, small valleys and submarine canyons, such as the Aveiro Canyon (Portugal) [5,6,7,8]. Submarine landslides are important mechanisms/agents for modelling and transporting large amounts of sediment along the continental slope to the deep ocean [3,9], leaving traces and marks in the submarine morphology and sedimentary deposits distribution.
Many factors have been suggested as probable or possible causes to the initiation of submarine landslides [3], which can be divided into the following types [3,10,11]:
(1)
Related to the geological characteristics of the landslide material [3];
  • Movements in recent deposits of weak, under-consolidated and metastable soils in areas of rapid sedimentation (deltas or canyons) [3,10,11];
  • Movements due to the failure of a week layer [3,10,11].
(2)
Driven by transient external events [3].
  • Movements in old, normally consolidated deposits, triggered by significant changes in sedimentation and erosional regimes, which may be caused by sea-level changes (as a driver of sedimentation or erosion changes) or migration of erosional channels [3,10,11];
  • Movements in old deposits, caused by tectonic processes, such as earthquakes [3,10,11].
It is also noted that human activities can contribute to submarine landslide triggering, with works such as excavation, loading, or changes in the hydraulic regime which may cause an increase of erosion or deposition [3,11].
Submarine mass movements (SMM) often result from the combination of more than one factor [3]. In detail, gravitational load, occurs when stresses in the seafloor soils equal or exceeds the available shear strength, causing sudden movement [12]. Creep-like movements also occur in cohesive soils, resulting in a slow and persistent movement over a long period of time [12]. Also, the seafloor is affected continuously by the dynamic action of currents, tides and surface waves. Depending on the sediment properties, the wave height and length, and the depth of the water column, larger waves displacement cause water pressure variations which can affect the stability of the sea bottom sediments [12]. These bottom water pressure variations caused by severe storm surges may be enough to cause ruptures in “soft” sediments up to depths of about 120 m [13]. In earthquake events, cyclic shear stresses caused by the propagation of seismic waves in the sedimentary layers can originate soil ruptures [12].
Slope movements can be classified in different types (e.g., landslides, flows, rock falls, among others [14]), regarding the mechanisms involved and with implications on the affected volume, triggering mechanism and their location. However, in terms of sediment transport volume driven by gravity-driven processes, only slides, debris flows and turbidity currents make a significant contribution to the particle transfer between coastal and deeper systems [3]. Some authors [3,15,16,17] reported that occasionally, movements in cohesive sediments may evolve downslope from slide to debris flow, and from debris flow to turbidity current through gradually increasing disintegration and entrainment of water. Nevertheless, these processes are not fully understood.
The purpose of this study is the description of the upper course of the Aveiro Submarine Canyon, between the head of the canyon and the 3000 m deep lower course of the canyon, in order to assess the slope instability susceptibility, applying to the submarine slopes the approaches commonly used in onshore landslide susceptibility assessments (e.g., Reichenbach et al., 2018) [18] and also to sea cliff failures (e.g., Marques et al., 2013) [19]. Were applied two statistically based methods (information value and logistic regression) to correlate an inventory of potential landslides forms and scars, identified by interpretation of a digital bathymetric model (DBM), with a set of landslide predisposing factors. The final results were validated against the landslide inventory using receiver operating characteristic (ROC) curves and the corresponding area under the curve (AUC), and the susceptibility models produced by both methods were compared.

2. Setting

The Aveiro Submarine Canyon is located 50 km off the city of Aveiro (Figure 1) in the West Portuguese margin. Specifically, the studied area is located between the middle continental shelf (100 m depth) and the lower course of the canyon (3000 m depth).
The upper course of the Aveiro Canyon stands out from the other canyons that characterize the Portuguese Margin, due to its morphology and location. The upper course of the canyon presents a rather large and wide amphitheatre-shaped morphology, contrasting with the V-shape of the others Portuguese canyons. The Aveiro canyon starts in the middle shelf, below a depth of 110 m. Its head is about 60 km wide, being dissected by a dense network of smaller tributary valleys or runoff lines (Figure 1). It extends for over 150 km through the Valle-Inclán saddle until it reaches the Iberian Abyssal Plain at depths of 4000 m.
The continental shelf nearby the canyon head is characterized by flatter bottom morphology with a very smooth slope, around 0.3% where some smaller reliefs are also observed, such as the Pontal da Galega [20,21]. Geologically, the structure of the continental shelf is characterized by a strong tectonic control. Rodrigues (2004) [21] reports the presence of (1) rotational gravitational slip faults formed during the Mesozoic rifting; and (2) filling of structural depressions by a thick tertiary sedimentary body (Eocene and Neogene bioclastic and detrital limestone formations).
Given the regional setting of the canyon, there is no relationship between the origin and evolution of this structure with erosional processes, namely those associated with the nearby fluvial systems. In fact, its origin and the characteristics of the upper canyon was attributed to the geologic structure of the west Portuguese margin, specifically to the presence of a right lateral strike-slip fault (WNW-ESE direction), also with normal movement component in which the North block is the footwall [18]. It is likely that the fault, formed during the Variscan orogeny and reactivated in younger tectonic phases played an important role in the canyon’s origin and modelling [22].

3. Methods

Two statistical methods were used in this study, in order to assess the canyon slope instability: the bivariate information value method (IV) [23] and the multivariate binomial logistic regression method (LR) [24,25]. Both methods consider the relations between the occurrence of a given event or state, in this case the occurrence of a landslide, with factors which may have relations with its susceptibility or triggering.
These methods are data-driven methods that statistically evaluate the combination of the conditioning/predisposing factors that are better related to the spatial distribution of past and present instabilities [26]. This type of analysis assumes that the factors that conditioned the past and present instability will produce the same effects in the future [26,27,28,29]. Therefore, it is possible to make a quantified prediction of susceptibility in as yet non-failing areas [26,30,31].
Due to the available data in this area, the possible predisposing factors were mainly derived from the hydrographic information (bathymetry) and sediment cover. The considered factors were bathymetry, geometric parameters obtained on the bathymetric surface (mean slope angle, slope face direction (aspect) and seafloor curvature) and superficial sediments mapping. These predisposing factors are also considered to contribute to the occurrence of landslides in slope instability assessment studies (e.g., [19,32,33,34,35]).
In summary, this approach requires the production of an inventory of recognized slope movements in the study area; the identification and mapping of the predisposition factors; a comparison between the inventory of movements and the predisposition factors; the production of a susceptibility map; and the model validation.

3.1. Information Value (IV)

The information value (IV) [23] is a statistical method that correlates the unstable areas with the predisposing factors. Each predisposing factor is divided into classes or variables (e.g., factor—mean slope angle, variable—0–5°) [19] in order to compute a score or susceptibility score for each one. The analysis of each factor is done in geometrical basis (pixels) or in predefined polygons, i.e., terrain units.
The score of the IV (Ii) of each variable (Xi) is given by [23]:
I i = log S i / N i S / N
where Si is the number of terrain units that are unstable with the variable Xi; Ni is the number of terrain units with the variable Xi; S is the total number of terrain units that are unstable; N is the total number of terrain units in the study area.
Negative values of Ii mean that the presence of the variable is not favourable to the occurrence of instabilities, whereas positive values of Ii indicate that there is a relationship between the variable and the occurrence of instabilities [23].
The total IV (Ij) for a given terrain unit (j) is obtained by the following equation [23]:
I j = i = 1 m X ij I i
where m is the number of variables; and Xij is 0 if the variable is not present in the terrain unit j, or 1 if the variable is present. Therefore, the susceptibility of a terrain unit to the occurrence of a movement is given by the final information value (IV) Ij [32].
The use of this method allows a simple susceptibility assessment of the occurrence of movements based only on the spatial distribution of the classes of predisposing factors (variables) and the presence or absence of instabilities in each terrain unit [19]. As a final result, susceptibility scores are obtained for all the terrain units of the study area.
This very simplified method allows a direct evaluation of results using the variable scores. Its main limitation results from its bivariate character, i.e., it does not take into account correlations that may exist between variables [19,32].

3.2. Logistic Regression (LR)

The logistic regression (LR) is a statistical method where one can predict the relationship between a dichotomic dependent variable (0 without instabilities, 1 with instabilities), and a set of independent explanatory variables (predisposing factors) which may be continuous, categorical or dichotomic [25]. The relation between the occurrence of movements in a given terrain unit and the variables is expressed as [36]:
S =   1 1 + e ψ 0 S   1
where S (from 0 to 1) is the probability of a given terrain being in the group of the units affected by instabilities; and ψ is the logit, which is linearly related to the independent variables:
ψ = log ( p 1 p ) =   β 0 +   β 1 v 1 ( r ) + +   β m v m ( r ) +   ε
where p is the probability of presence of the characteristic of interest; β0, β1, ..., βm are the unknown parameters of the LR model, v0(r), v1(r), ..., vm(r) are the independent variables in each terrain unit; and ε is the error associated with model fitting. The LR calculations and modulations were performed using IBM SPSS Statistics v26 software. A model was built using the forward conditional approach, in which after the regression computation, the factors (with all their variables) are added to the model, one by one, in decreasing order of relevance for model building, until a state is reached where the remaining factors are no longer relevant [19].

3.3. Model Validation

The results of the predictive model need a validation to its performance in order to give validity and significance [37] to this type of study. Therefore, ROC curves were computed.
ROC curve analysis is a commonly used method for evaluating the predictive accuracy of a model [33,38,39,40]. The curve is a plot of the probability of having true positive (correctly predicted event response—area classified as movement) versus the probability of a false positive, (falsely event response—non-movement area) as the cut-off probability varies [28].
The AUC of the ROC curve was calculated as a measure of the overall quality of the predictive model [33,41,42,43]. The obtained AUC value will vary between 0 to 1 and the higher the value the better is the model [26,35,40,44,45,46].
According to [36,47] curves that obtain AUC of 0.80 to 0.90 should be considered “very satisfactory”. Although, both studies state that in order for a model to be considered “acceptable”, must have an AUC as a minimum of 0.75. The AUC value is computed according to the following equation:
AUC =     [ ( x i + 1   x i ) . y i + 1 + y 1 y ]
where x is the percentage of the study area predicted as susceptible by descending order of susceptibility, and y is the percentage of correctly classified movements area belonging to the validation group (inventory).

4. Data Acquisition and Processing

The data used in the present study were obtained within the scope of the SEPLAT program (Sedimentary Deposits of the Portuguese Continental Shelf; funded by the Instituto Hidrográfico—IH) and the scientific project DEEPCO (West Iberian deep sedimentary conduits, funded by the Portuguese Science and Technology Foundation (FCT), contract POCTI/CTA/46367/2002).
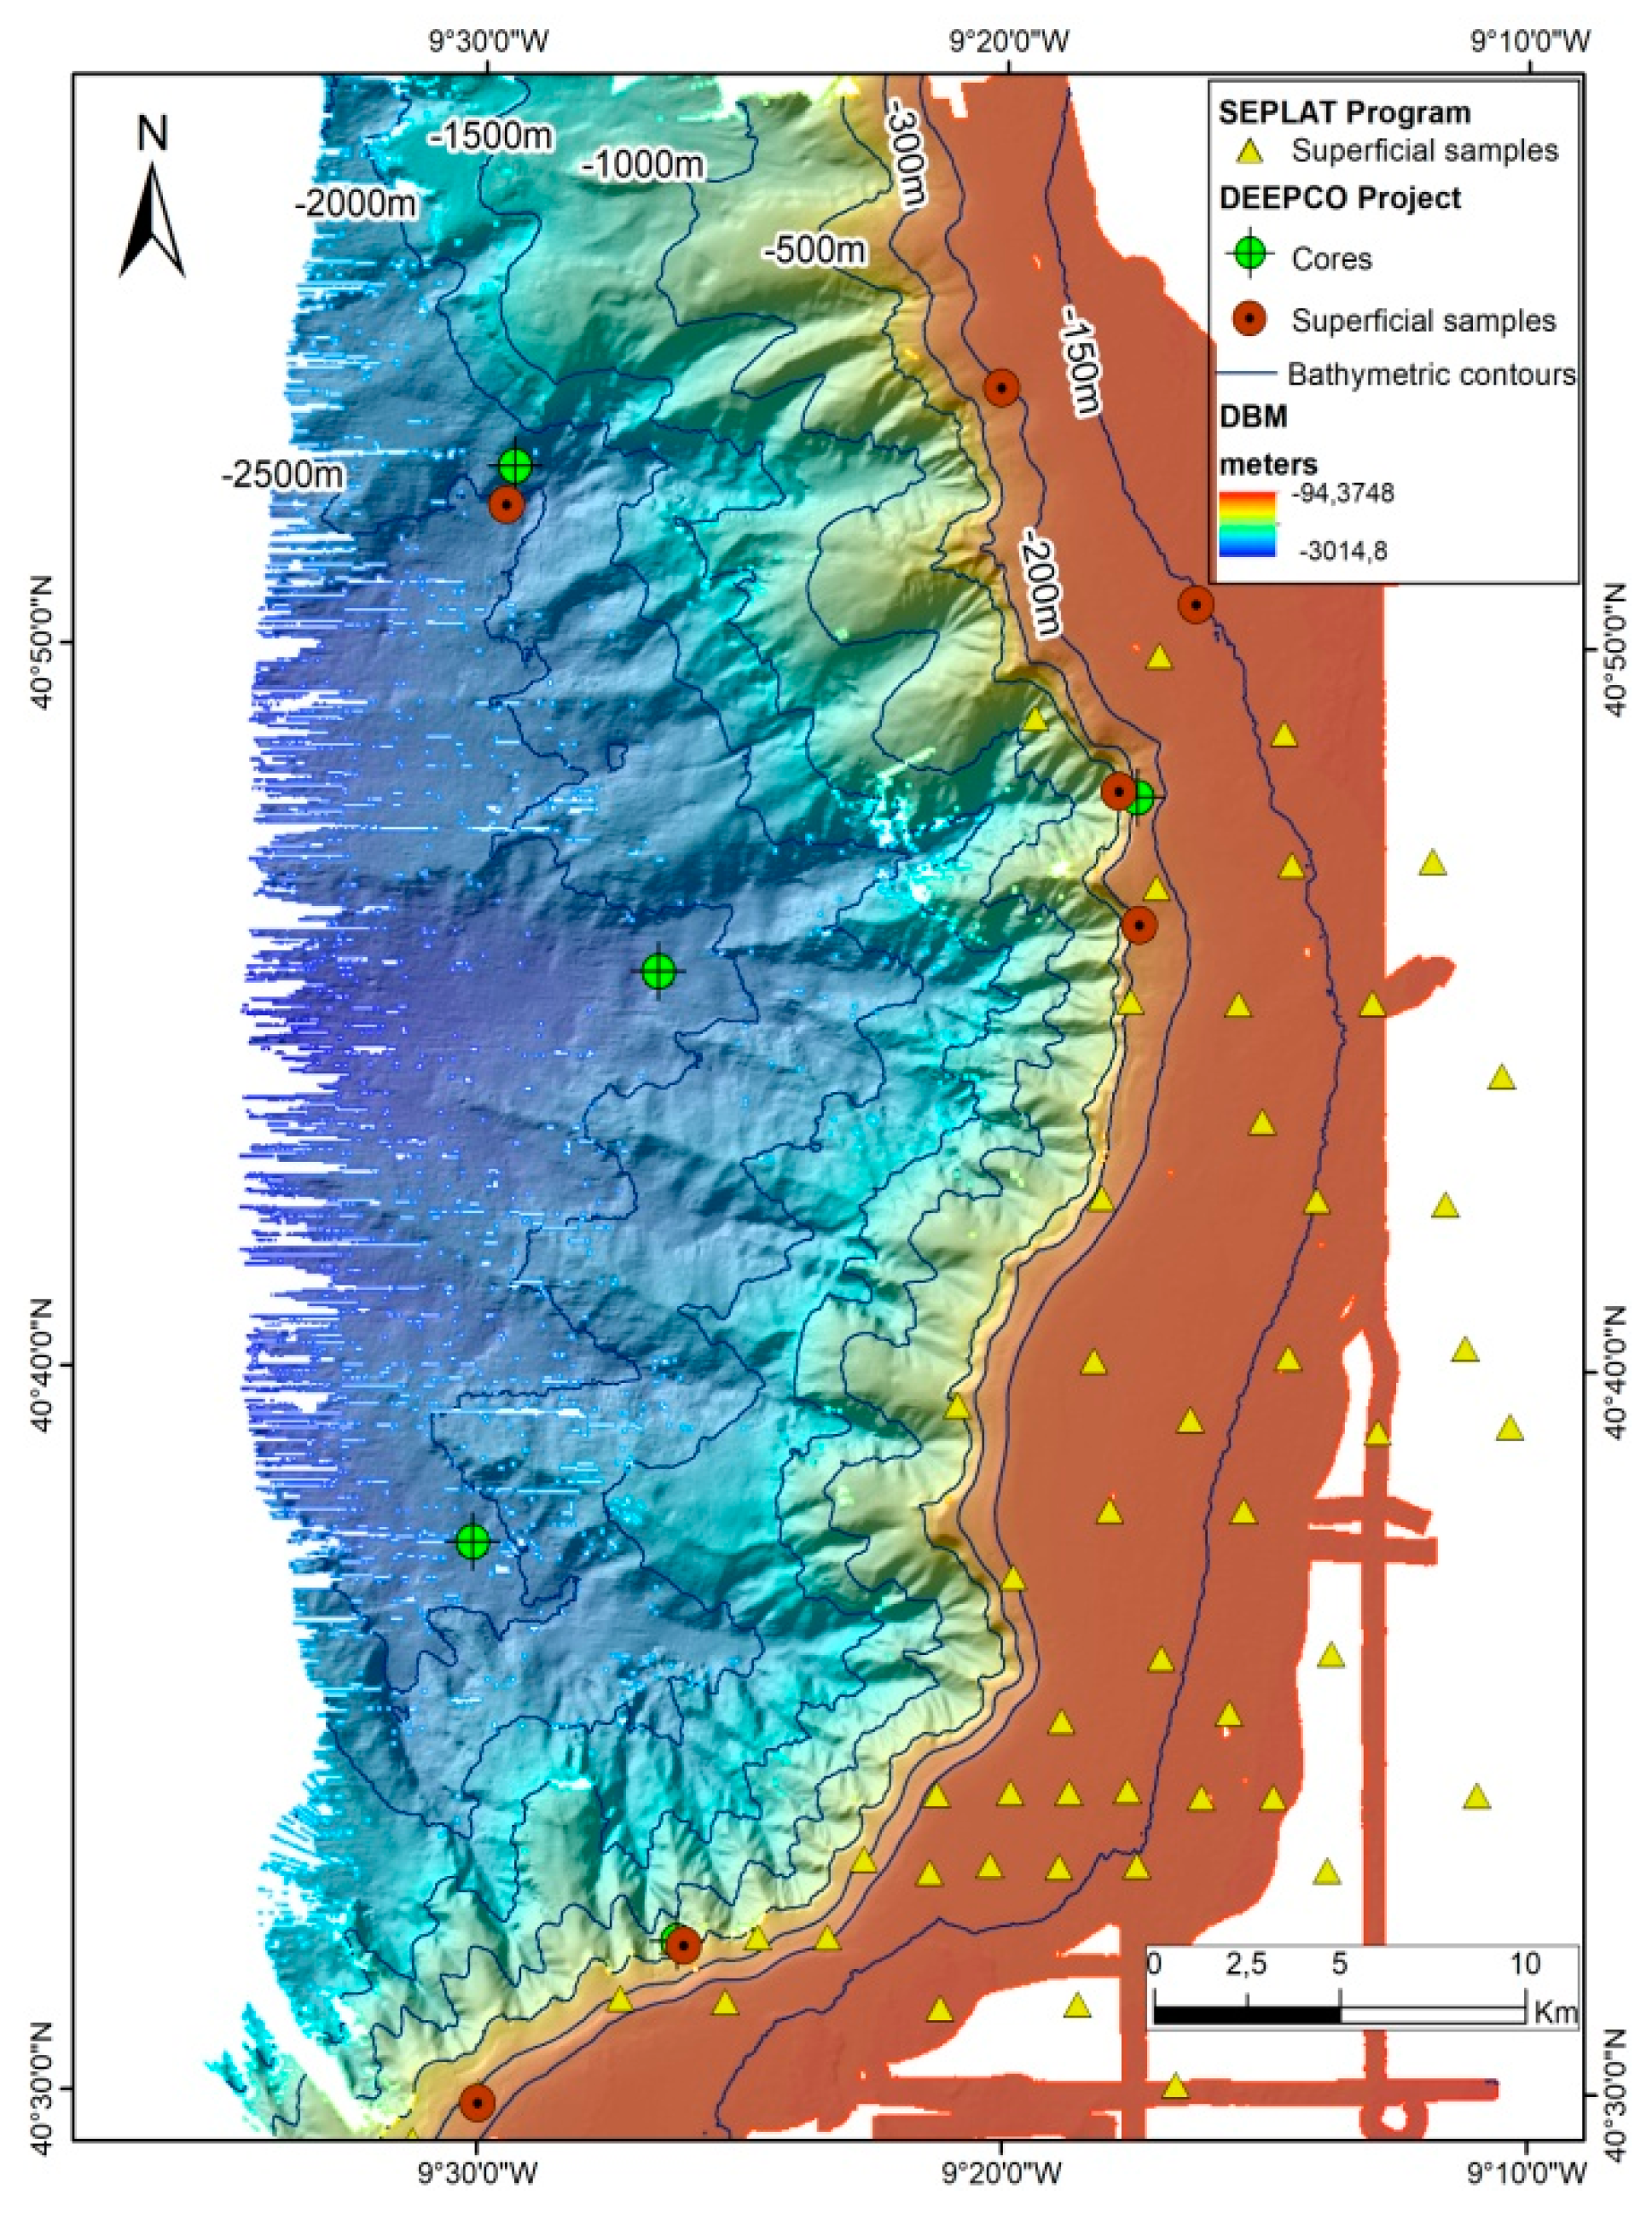
For the purpose of the DEEPCO project, in the upper course of the Aveiro Canyon a multibeam survey was performed in December 2007, as well as a sediment sampling campaign, carried out in May 2008, which resulted in collecting 7 superficial (Smith-McIntyre sampler) and 3 vertical sediment samples/cores (gravity corer sampler). In order to complement the available information in this study, sedimentological data (57 superficial samples) obtained between 1989 and 1991 under the SEPLAT program (Sedimentary Cartography of the Portuguese Continental Platform) were also used (Figure 2).

4.1. Inventory of Mass Movements

The successful output of the IV and LR methods is directly linked to the inventory of the SMM. This inventory in the Aveiro upper canyon was based on the visual interpretation of digital bathymetric model (DBM). Slope instabilities were identified from (a) direct observation of the bottom surface, (b) comparing it with the mean slope angle map and (c) obtaining slide profiles.
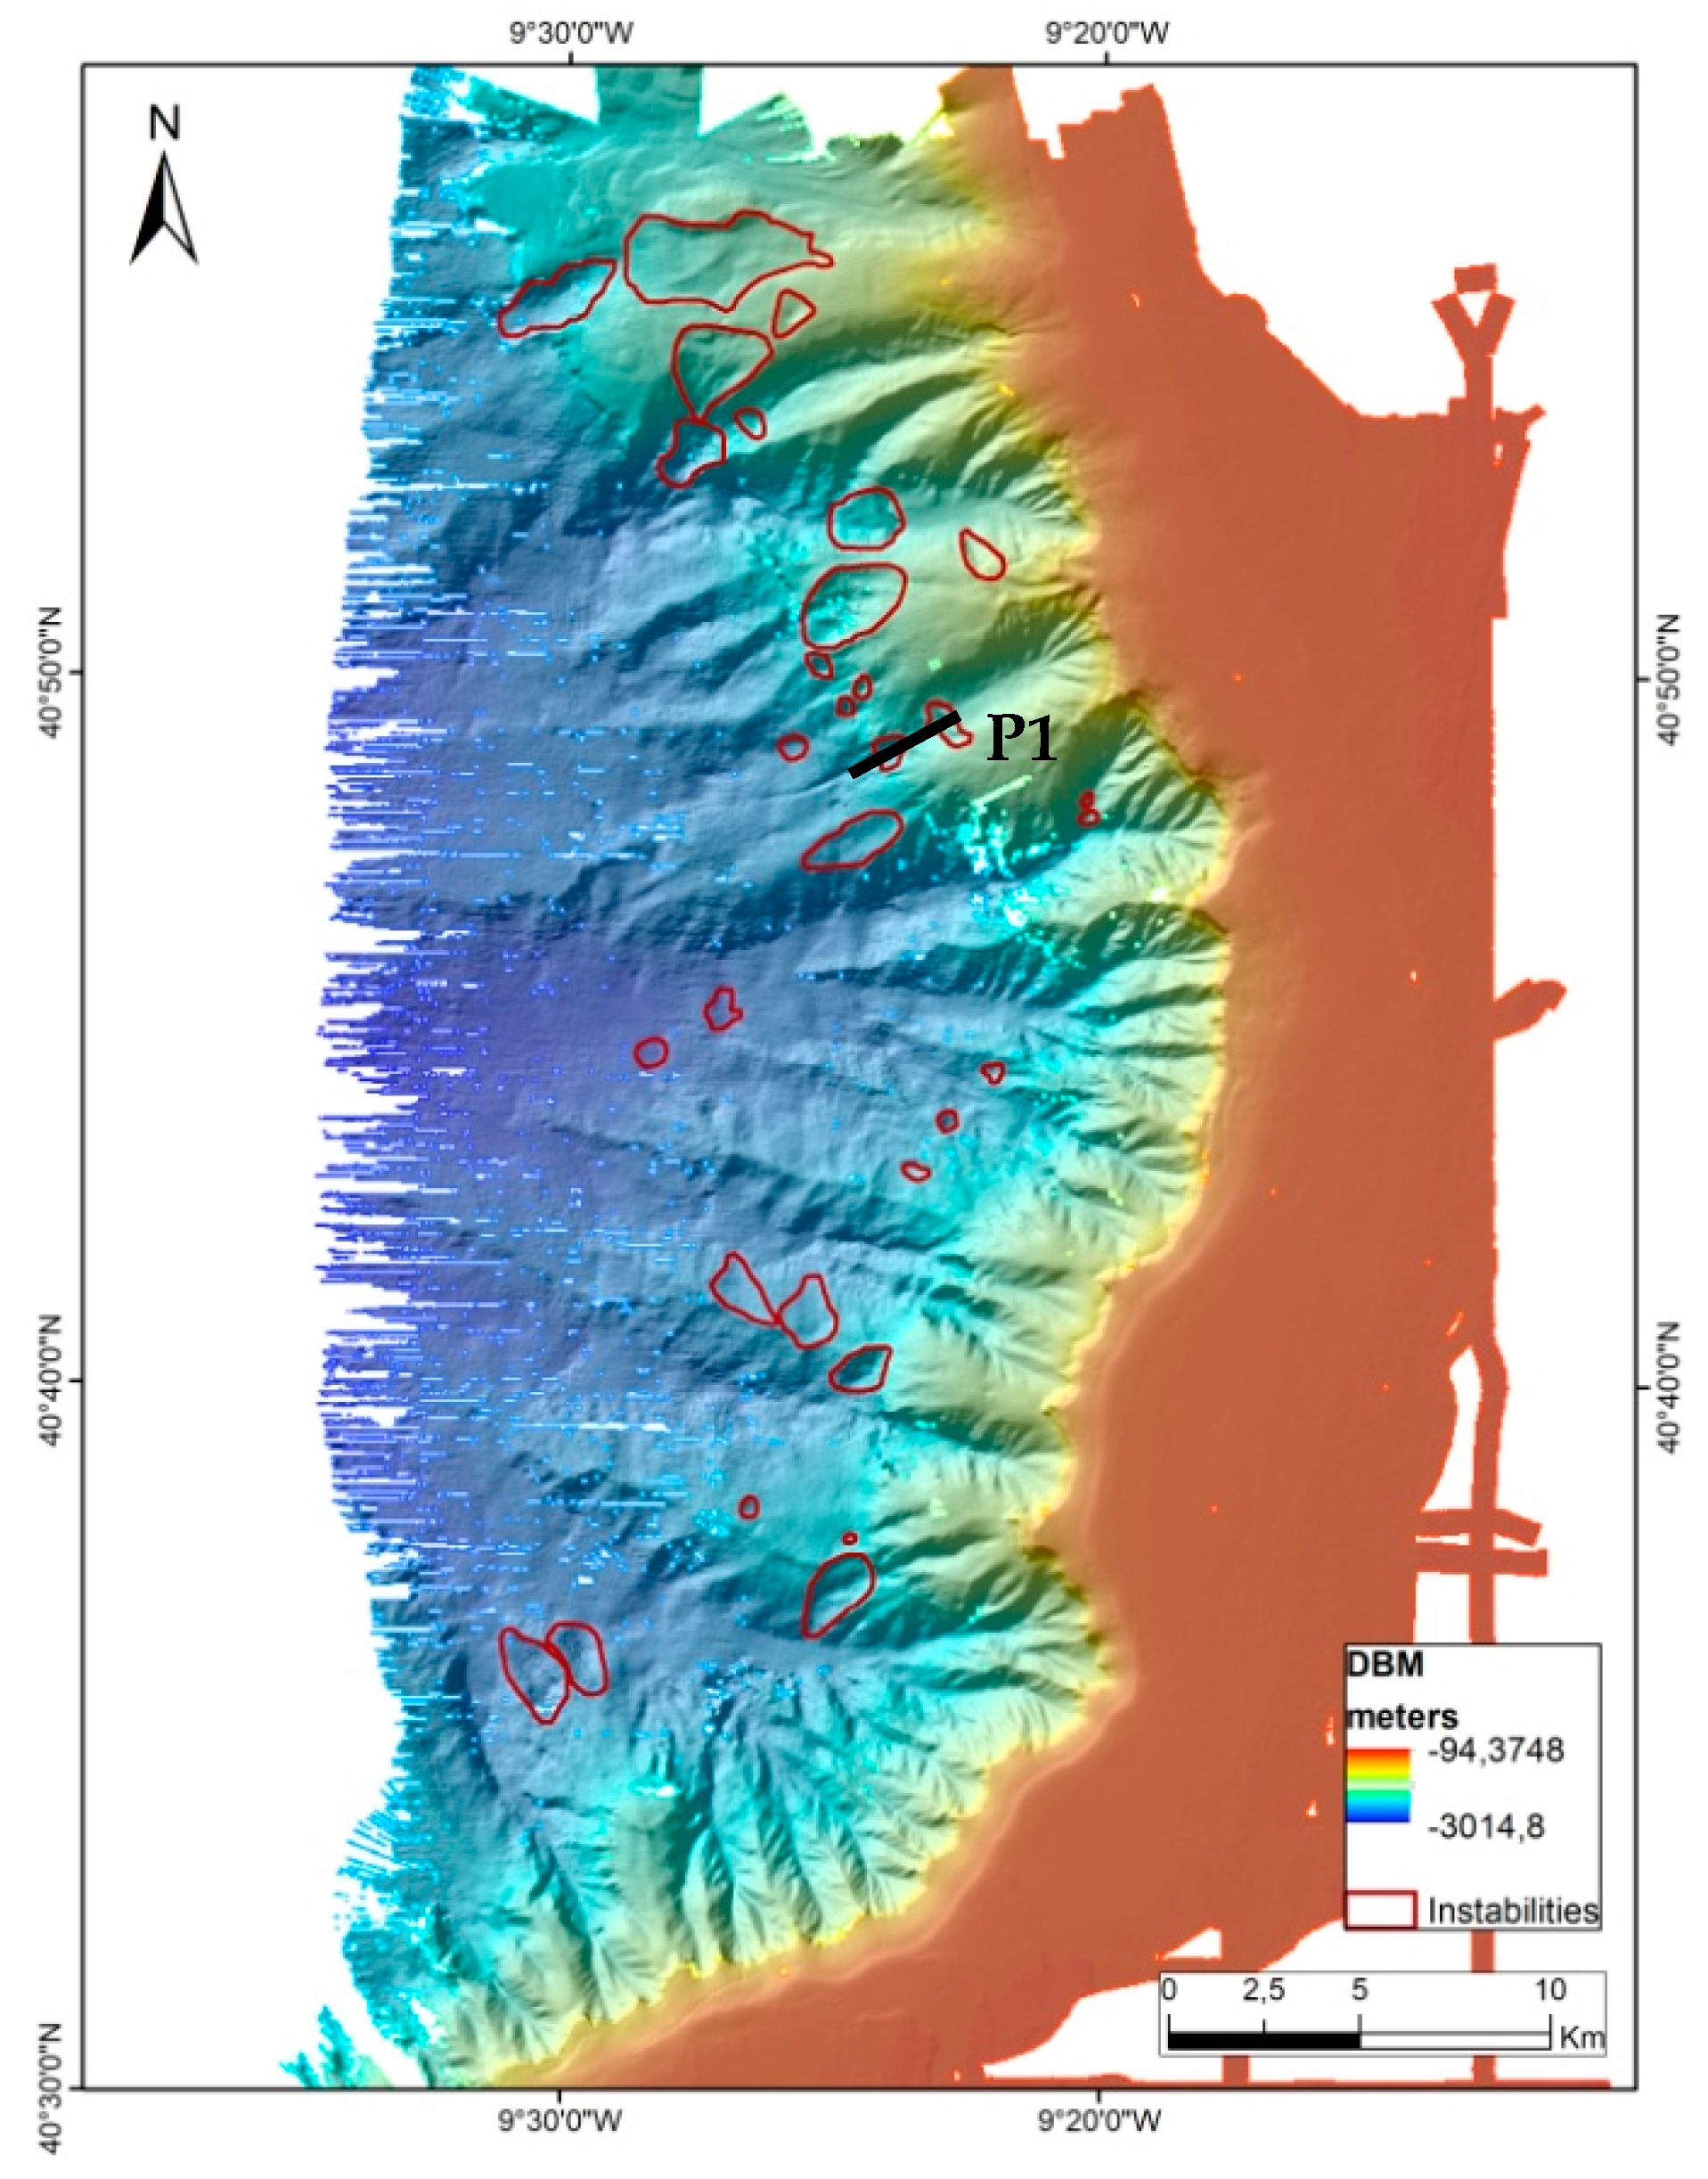
Altogether, 31 SMM’s were identified in the bathymetric surface and its source area delimited, as shown in Figure 3.
Since the DBM has a grid resolution of 50 m, smaller events may have gone unnoticed and the represented features should be considered expeditious.
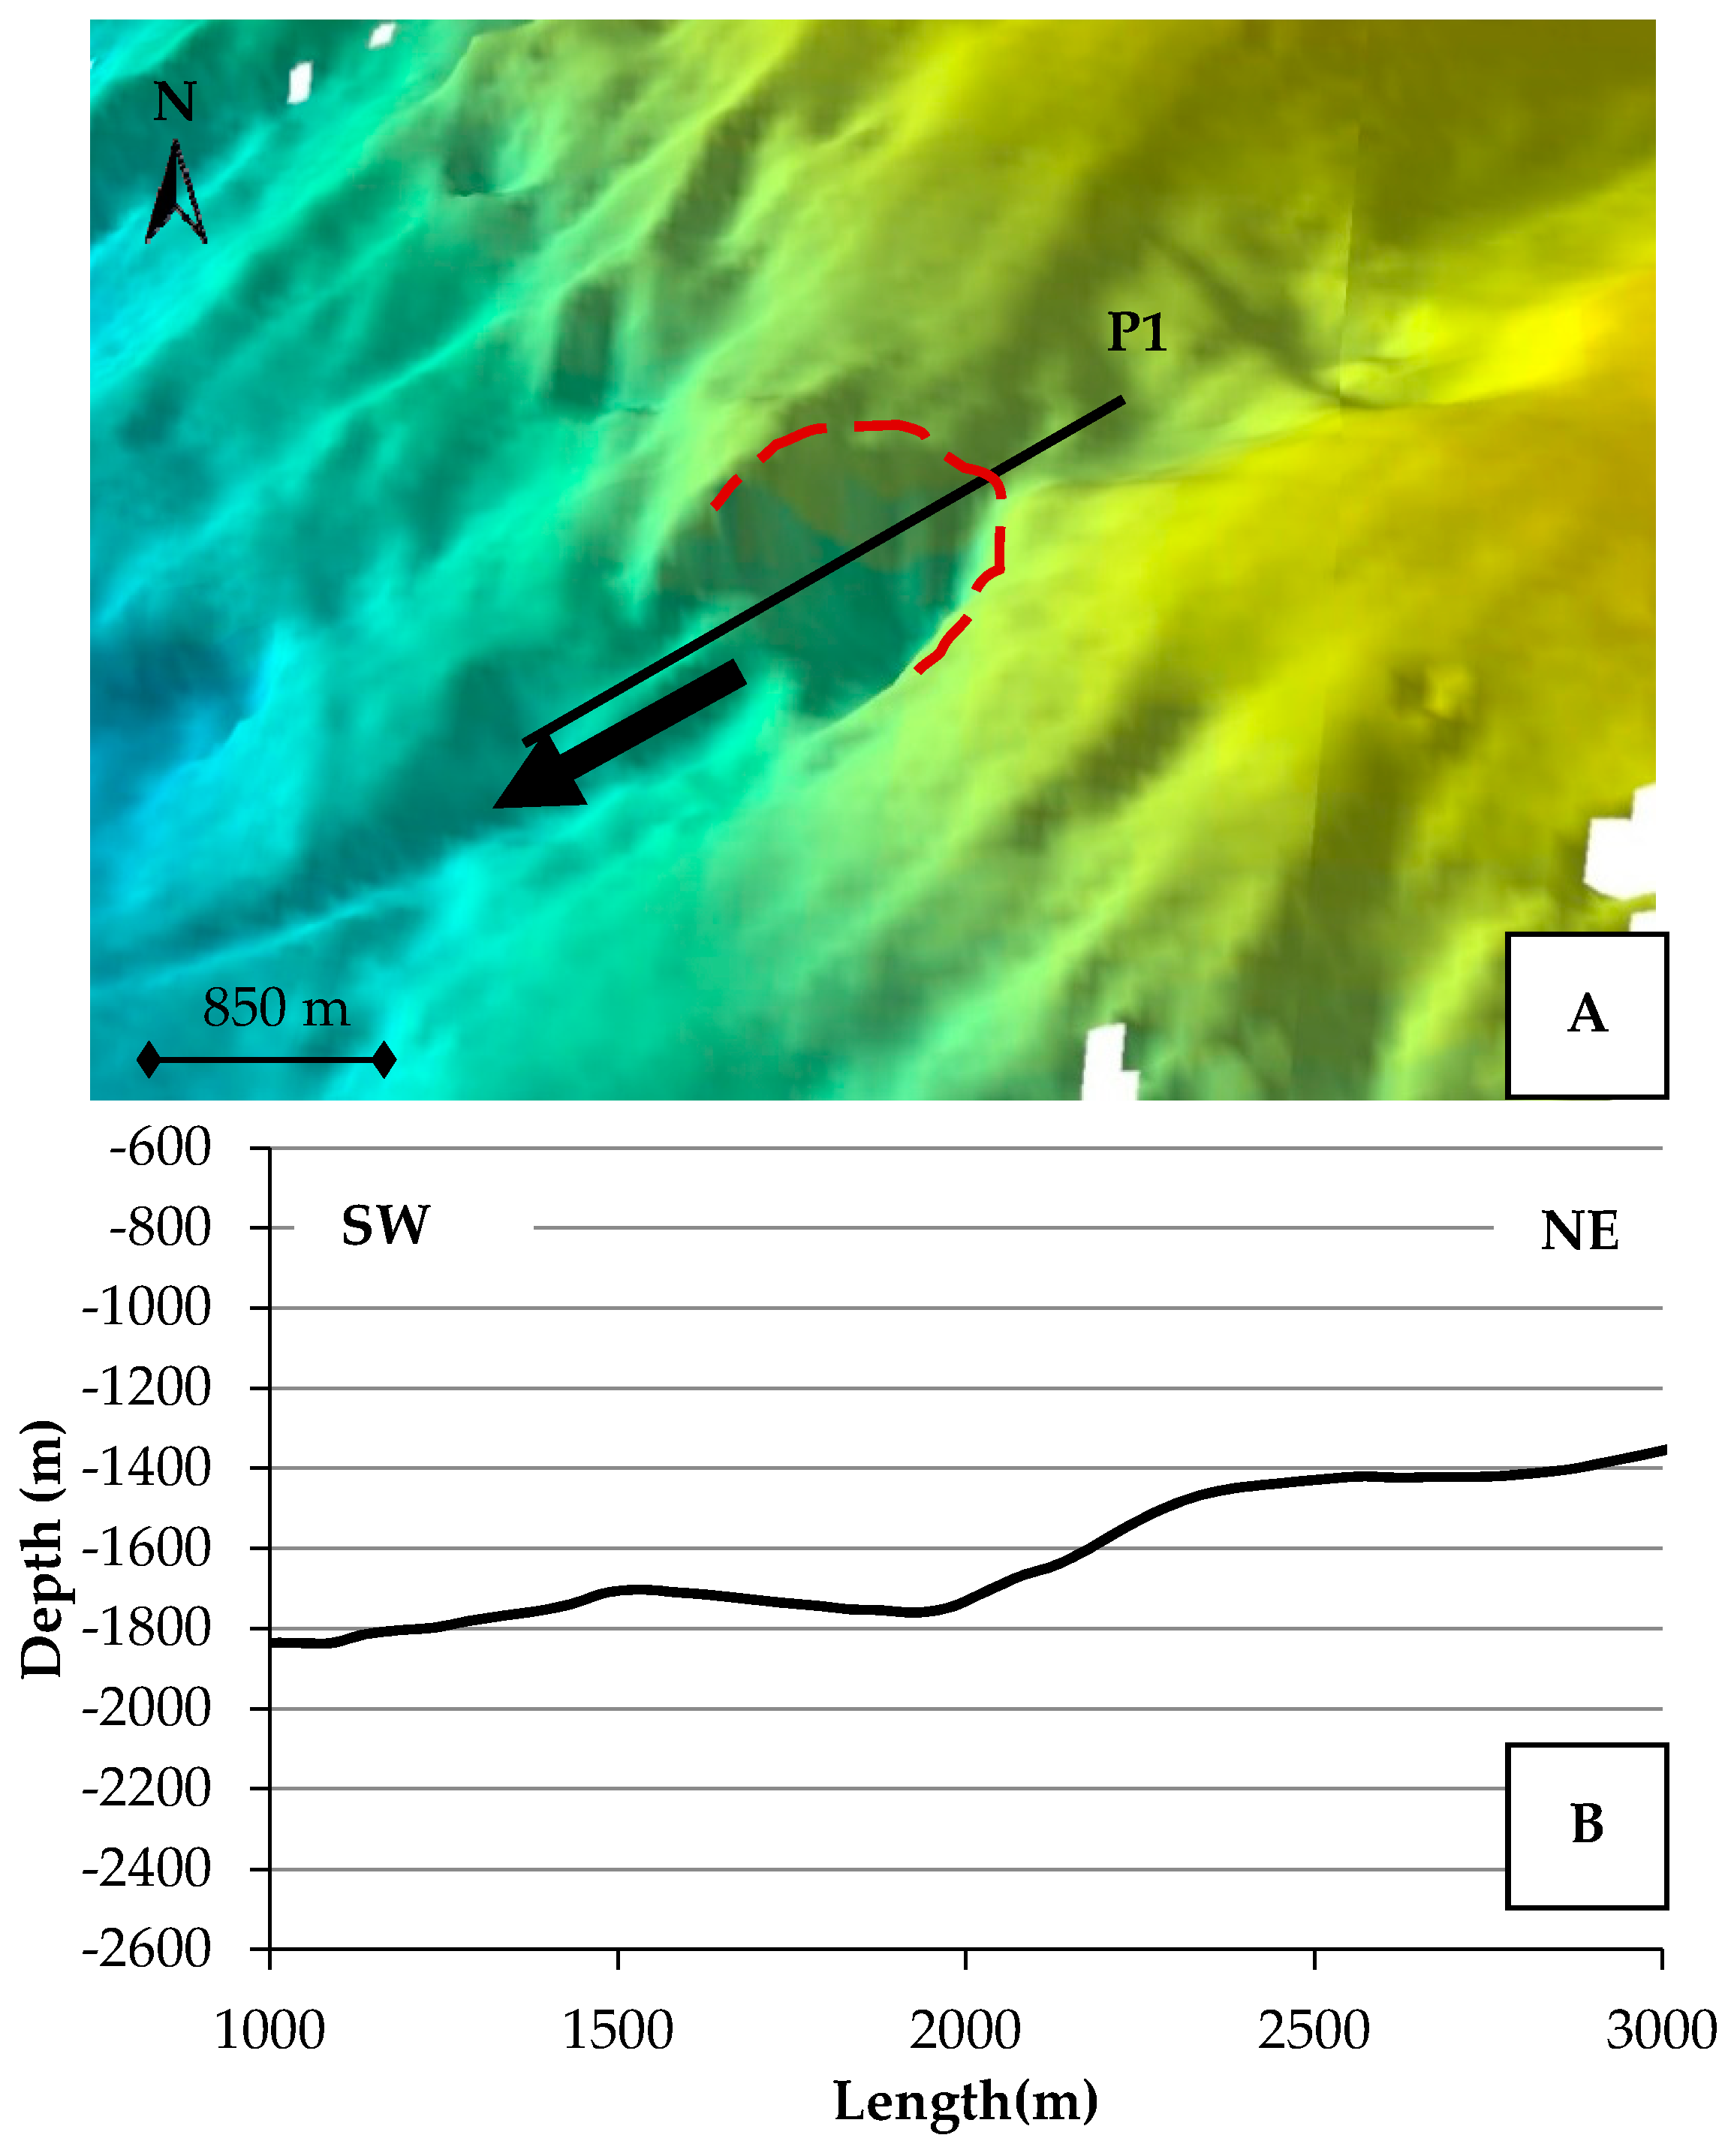
The observed instabilities led mainly to rotational slumps and gravitational flows. These slides correspond to a movement of material that moves downslope along a curved or concave rupture plane [12]. Most of these events cause a scoop shaped scar on the surface due to its rotational movement. Figure 4 shows a rotational slide along the slope that exemplifies well the scoop-shaped concave rupture surface.
The analysis of the P1 profile that crosses the slide seems to corroborate that it is in fact a rotational-type slide (Figure 4). It is possible to observe a first movement at about 1200 m depth, and a largest one located approximately at the 1400 m isobaths (highlighted in Figure 4). This produced a steep escarpment, with a clear change in its inclination, with a gap of almost 400 m (from the depth of 1400 to 1800 m).
As mentioned previously, in the canyon upper course, 31 features related to slope instabilities were identified, corresponding to 44 km2 of a total unstable area (almost 4.5% of the total study area), with a concentration of movements in the Northern sector (Figure 3).

4.2. Predisposing Factors

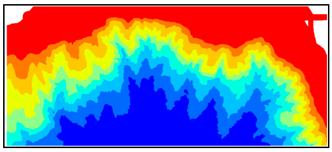
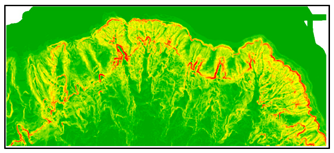
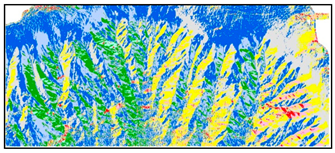
In this study, 5 predisposing factors were considered to have influence in the trigger of instabilities events along the canyon slopes (Table 1). Since direct observation of the terrain is not possible, the predisposing factors were recognized in the available information about the study area and reclassified in a geographic information system (GIS) environment. Each factor was divided into variables, which resulted in classified maps of categorical variables.
The most important predisposing factor, the base and from which the others were derived, with the exception of superficial sediment mapping, was bathymetry (derived from the hydrographic data). The predisposing factor bathymetry was divided into 9 classes, with an interval of 300 m.
Mean slope angle, aspect (direction of slope face exposure) and surface curvature were obtained with the 3D Analyst tool from ArcGIS software. The mean slope angle was reclassified in 5 degree intervals, originating 11 classes, while the aspect was divided into 9 classes, each within 22.5° azimuths.
The seabed surface curvature represents the shape of the surface of the slope and may be concave, convex or flat. Positive values indicate that the terrain surface is concave, negatives represent a convex surface, and zero values correspond to a flat surface. Consequently, the curvature DBM was reclassified into 3 classes: concave (positive values), convex (negative values) and flat (zero).
In order to use the sedimentary cover as a predisposing factor, it was necessary to model/extrapolate to the remaining study area the sediment maps covering the near external shelf and upper slope (until 700 m depth). This mapping was based on 64 superficial sediment samples collected by a Smith–McIntyre superficial sampler under the scope of the SEPLAT program and DEEPCO project. At 2500 m depth, the first 20 cm of 3 cores were also included. Nevertheless, it must be emphasized that superficial sediment mapping was based in an irregular sampling strategy, which may induce some local errors, especially in deeper areas.

5. Results, Validation and Discussion

Information value (IV) and logistic regression (LR) modelling results for each of the considered predisposing factors showed similar results, in terms of score values. However, comparison between both values must be made with caution since the Ii score, obtained with IV method, only concerns the respective predisposing factor while the calculated LR values (β takes into account the other factors and its importance for the model construction.
The reclassified predisposing factors maps were correlated with the inventory of landslides, and thus, Ii and β scores of each of the variables that compose them were calculated. Table 2 summarizes the obtained results. Overall, variables whose scores have positive values are more susceptible to instabilities while negative values are less likely.
Results obtained with both methods for the bathymetry factor (Table 2) indicate that the area most prone to instability is located between the depths of 900 and 2100 m (higher values). This depth range also represents the “centre” of the canyon slope, where 80% of the slides were identified. As expected, the lowest values were observed in the shelf. However, below 2400 m depth, the probability of occurrence of downslope movements is also lower due to the flatter surface of the slope base.
In general, IV scores for mean slope angle are distributed in a relatively narrow range of values (Table 2), indicating that the probability for the occurrence of movements does not have a large variation along the canyon slope. In a more detailed analysis, the 0° to 5° slope angle class, which corresponds to the area of the canyon head whose surface, is almost flat, unsurprisingly provided low susceptibility scores; the slope angles from 5° to 20° and above 40° were the more susceptible to instability. Both classes represent a likely fragility zone with a sudden change in the inclination of the canyon slope, and therefore more prone to movements. Interestingly, on the other hand, the 25–30° and 30–35° classes scored negatively. This may be due to the following reasons: the area where the sea bottom surface might be more stable; and/or low resolution of the DBM that masked some slides and therefore, they are not included in the model.
Regarding the aspect (slope face exposure) factor, the highest scores were obtained in the classes corresponding to the Southeast and East direction (Table 2). The classes concerning the South and Northeast orientations also appear with considerable scores.
Seafloor curvature of the slopes presents the concave class as the most prone to the occurrence of slides (Table 2). This class has a relationship with the type of instabilities that were detected in the present study. Rotational slides, or slumps, have the particular characteristic of displaying a concave surface, which corroborates the score obtained for this class.
The last predisposing factor analysed, regarding the superficial sediment characteristics, indicates that the type of sediment most prone to instability is fine silt, followed by medium silt (Table 2). In fact, according to the landslides inventory, only these types of sediment showed instabilities. However, it should be noted once again that this map is an extrapolation of a limited database of the available sample points.
In summary, considering the scores obtained (Table 2), the most favourable conditions for triggering downslope mass movements in the Aveiro Canyon are as follows:
(1)
depths larger than 900 m;
(2)
mean slope angle between 5° and 20°, and above 40°;
(3)
slope face exposed to the east quadrant (E–SE);
(4)
bottom surface with concave profile;
(5)
sedimentary deposits composed by medium to fine silt.
Relevance of the predisposing factors in the construction of the logistic regression (LR) predictive model, which consists in adding, step by step, each factor according to its importance, indicate that the most relevant factor was “Bathymetry”, followed by “Mean slope”, “Aspect”, “Sediment cover” and “Curvature” being the last one added.
As for the IV approach, the relevance of each of the predisposing factors and their influence was tentatively analysed by: (1) calculating the absolute value of each score (Ii), obtained in each of its classes, and subsequently calculating the mean of the absolute values of the scores of the variables of each factor; (2) and calculating a success rate AUC.
The results obtained (Table 3) indicate that, according with the mean absolute Ii values, the factor that has the higher influence in the occurrence of instability is “Sediment cover”, followed by “Bathymetry”. “Mean slope” is the factor that has the lowest preponderance.
Nevertheless, these results may be influenced by the relative weight of the number of terrain pixels affected by slope movements in each variable, compared to the number of pixels in the total area (Table 2). In contrast, the calculated AUC’s for each one of the analysed factors revealed better and more meaningful results, and more closer to the ones obtained by the logistic regression (LR) method (in order: “Bathymetry”, “Sediment cover”, “Mean slope”, “Aspect” and “Curvature”).
Based on the obtained AUCs for the IV method, and knowing in advance the hierarchy of predisposing factors to the occurrence of slope movements, susceptibility maps were produced, with the addition of the most important factors at each step [34], one by one, until obtaining the best model. In case of the LR, the calculations started with the 5 factor model and removing one factor at each operation in order of its relevance to the model. ROC curves of all the calculated models were produced, using false positives against true positives, and were computed their corresponding AUC (Table 4, Figure 5 and Figure 6).
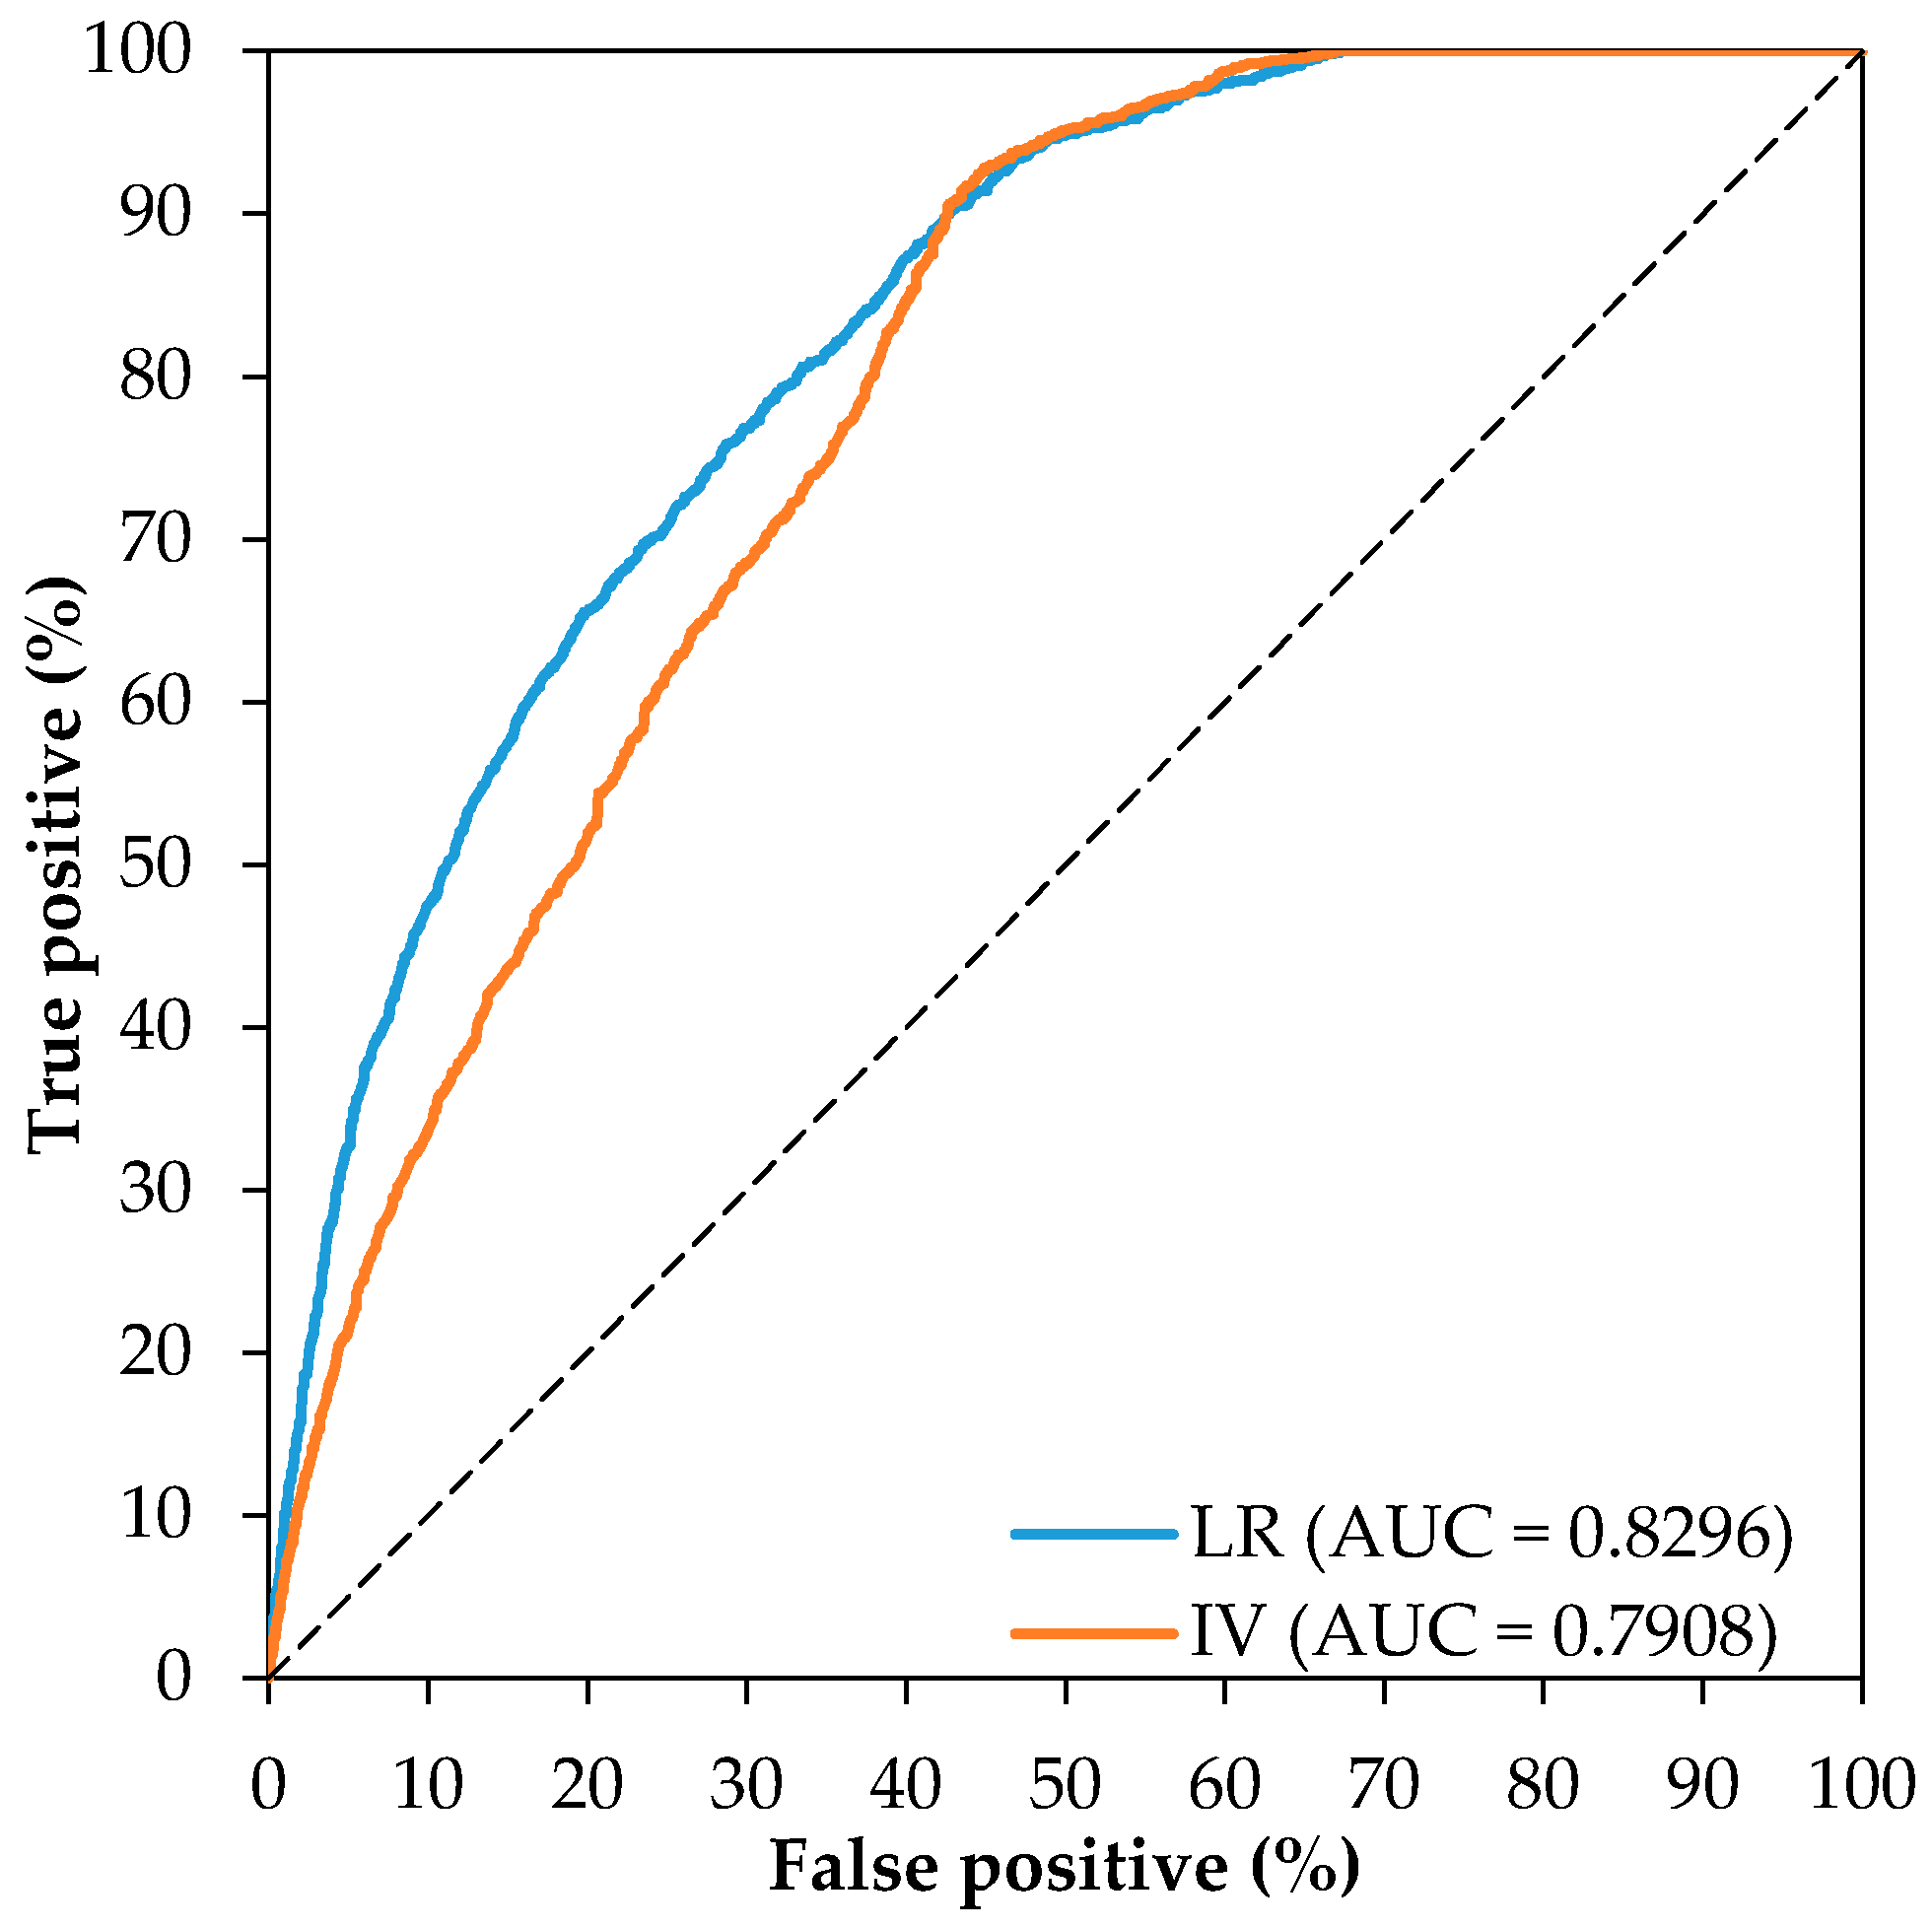
Analysing the results, the IV and LR models that include all factors, provided AUC values of 0.7908 and 0.8296 respectively (Table 4). From the analysis of the results obtained, it is clear that LR (AUC of 0.8296) produced more consistent results than the IV (AUC of 0.7908). This statement was somewhat expected, since the LR model considers the relationships between factors, rather than the individual evaluation. In that sense, models computed with IV method are classified as “acceptable”, while the ones produced with the LR method are classified as “very satisfactory” [44]. In general, these values mean that the models predicted approximately 79% (IV) and 83% (LR) of the instability events. Observing the Figure 5, it is possible to verify that at the beginning of the curve, the first 5% of the susceptible area (false positives) corresponds to approximately 21%, for the IV curve, and 33%, for the LR curve, of the inventoried movements (true positives). However, both curves end up converging when 45% of the total area returns about 90% of the instability inventory.
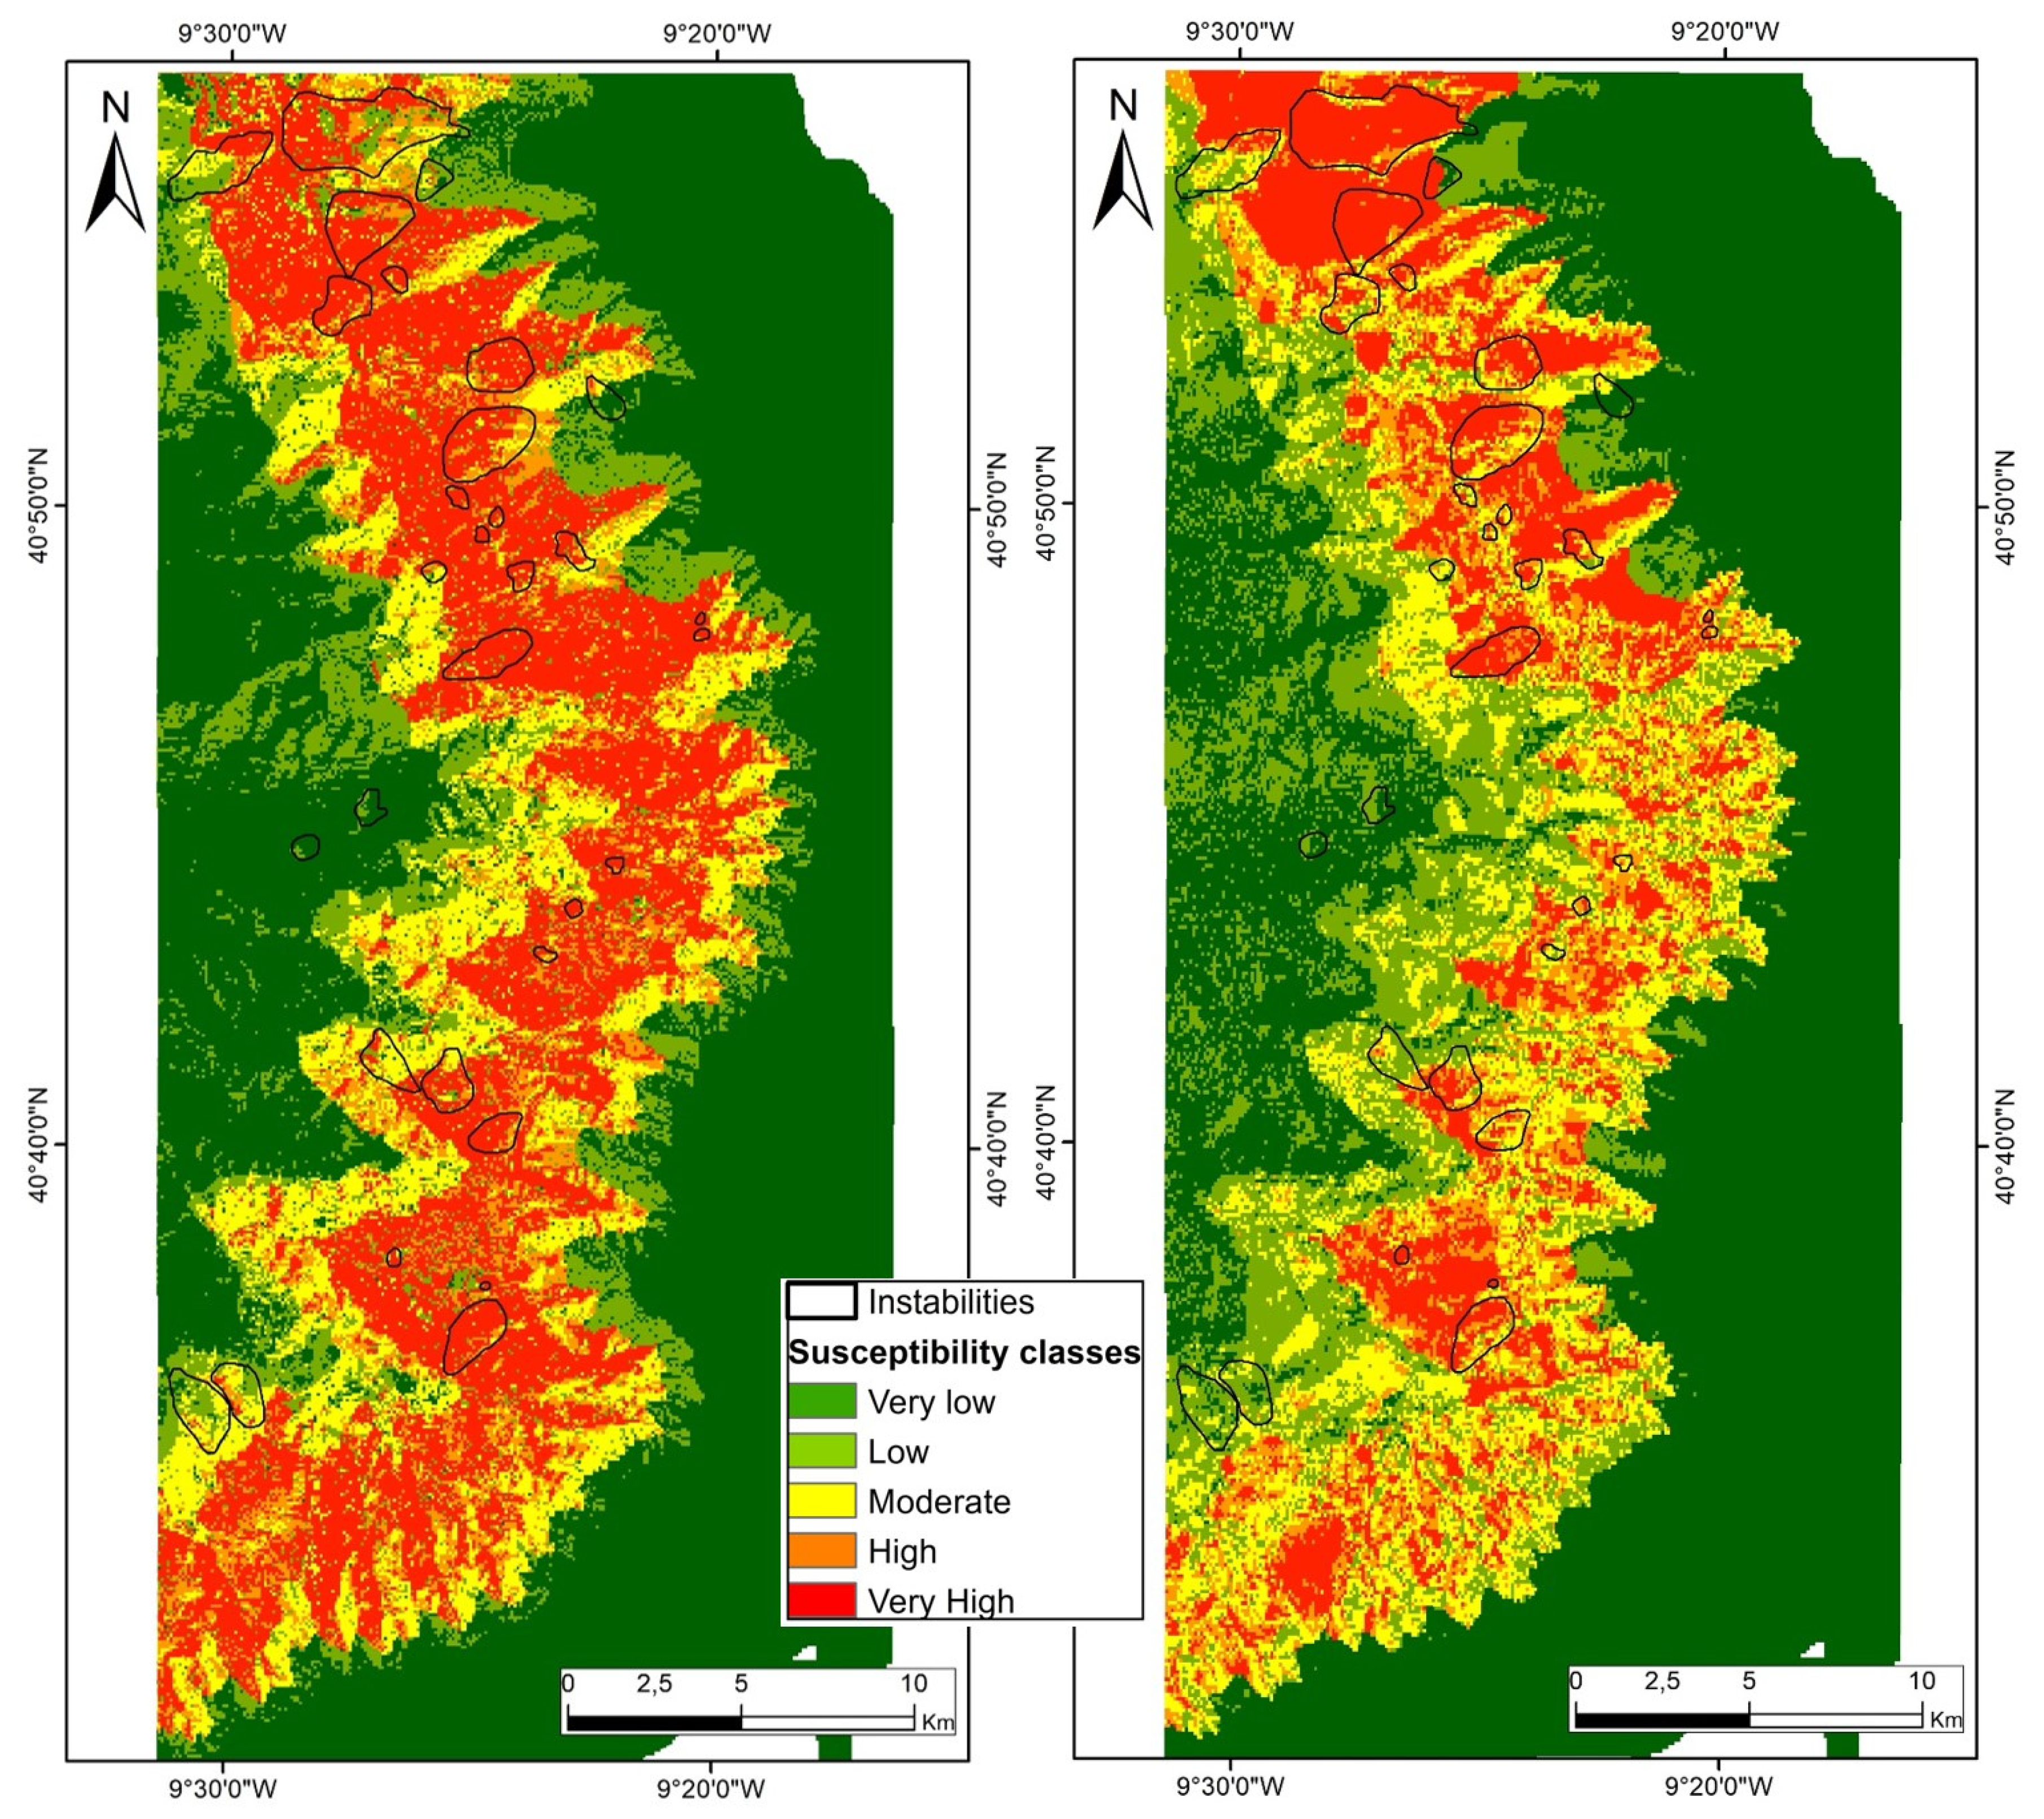
Based on the outputs of the IV and LR models, susceptibility maps to the occurrence of slope movements were produced (Figure 6).
In order to make the results comparable, the predictive maps correspond to the models integrating all 5 factors. In the case of the LR model, the obtained map presents the best model, while the IV map presents the model with the worst AUC result between all of the method’s models (Table 4). The degree of susceptibility was assessed in 5 classes based on the percentage of susceptible area, i.e., the percentage area affected by SMM: very low (<5%), low (5–20%), moderate (20–35%), high (35–50%) and very high (>50%).
In this study, considering only the forward regression method, with the exception of the curvature, all factors contributed to the increase in the success rates of the models, with AUCs ranging from a minimum 0.79 with one factor, to a maximum 0.83 with 5 factors (Table 4).
As for the IV method, the addition of more predisposing factors does not necessarily correspond to an improvement on the susceptibility model output. The best models were obtained with a maximum of 4 factors (bathymetry, superficial sediments, slope and aspect). The increase in more factors resulted in a decrease in the quality of the obtained models, which may be attributed to the poor correlation of some factors with the occurrence of landslides. In fact, in the single model category it appears that the one considering bathymetry presents the highest AUC value. The models that produced the best AUC results (0.7971 and 0.7955, respectively) are those using bathymetry, slope and aspect. The remaining models, although presenting satisfactory results, showed lower AUC scores, ranging from 0.7875 to 0.7936.
In spite of the differences between the results, both methods indicate that bathymetry is the most important factor in the prediction of the instabilities in the Aveiro Canyon slopes. In fact, it makes sense because not only dynamic processes, in marine environment, are strongly controlled by depth, but this variable is also expressed in others important factors such as slope, roughness, aspect, the presence/absence of rocky outcrops and the distribution of marine sediments (which are controlled also with the distance to the particle sources).
In the predictive models, the mean slope angle and aspect play important roles as well. These two factors, derived from the DBM, represent, not only the bathymetric spatial variation, but also the expression of geologic internal structures. In fact, the morphologic analysis of the Aveiro Canyon [48,49] revealed three important variations in the slope gradient, explained by the outcrop of intercalated geologic formations, with different resistance to the marine erosion processes. In fact, the existence of alternation of soft layers with more resistant layers of the Cenozoic detrital formations was identified in this sector of the Portuguese margin [20,21] and explains the different levels of erosion. The existence of bottom currents, specifically upwelling currents [50,51], is probably one of the erosional agents that carves the canyon slopes and promote the variation of mean slope angle and slope direction, contributing to the instability of sediments located nearby. Lastly, the sediment cover is the fourth most important factor (second in the IV method model) and the remaining factor, curvature, did not make any significant contribution to either model.
Even though there are some expected differences, both susceptibility maps showed good agreement with the inventories of the movements that supports them, as success rate curves returned good results. The IV susceptibility map highlights the probability of the occurrence of downslope movements in the centre of the canyon slope, where the variables of the predisposing factors scored larger values, contrasting with the outer shelf and the base of the upper course of the canyon (≈2500 m), where very low susceptibility is found. The LR susceptibility map show that most of the area bellow the shelf break has moderate to high probability to the occurrence of instabilities, and that areas with higher probability are mainly located in the northern sector.
Unfortunately, the model’s predictive capacity was not analysed due to the lack of a second bathymetric survey of the study area, (an older and/or a more recent one), which is necessary to compare and quantify the SMM’s displacement between the two surveys. Also, this second survey, preferentially with resolution better than 50 m, will allow a more accurate, substantial and robust landslides inventory which could provide representative training and validating sets.

6. Final Considerations

The assessment of the susceptibility to the occurrence of movements in the Aveiro Canyon slopes followed methodological principles, well tested onshore [18,28,29,52,53,54] with the necessary adaptations to the marine environment, where few studies using these kinds of statistical method are known (e.g., [2,34,35]). This paper aims to take one step further into the study of landslides in marine environment, one of the main dynamic processes promoting the sediment transfer to deeper domains.
The statistical methods used in the present study, information value (IV) and logistic regression (LR), proved to be an adequate approach, considering the available low-resolution data. With these methods, it was possible to relate the identified instabilities with factors that may be associated with the generation of slope movements (predisposing factors). In the end, resulting models were assessed and validated through a standard statistical technique, which corresponded to the construction of a ROC curve, and calculating the respective AUC.
It was also possible to verify, through the preparation of the inventory of instabilities, that they can be mainly classified as rotational slides or slumps and affects an area of about 44km2 of the seafloor, which represents 4.3% of the study area.
Overall, the predisposing factors considered in this paper contributed to a good performance of both models. Bathymetry was revealed to be the most important factor in the study area, followed by mean slope angle and aspect. Although, as mentioned before, there are only a few studies made in submarine slopes, this finding is in line with the conclusions of a similar study done in Espírito Santo Basin (Brazil) [34], where bathymetry (elevation) and slope gradient were the most important factors.
Although the superficial sediment mapping below the 500 m depth was extrapolative, it is clear that the type of sediments has direct influence on the triggering process of slope movements.
In spite of the limitations of the database available for this work, the validation of the models obtained AUC values of 0.79 (IV) and 0.83 (LR) which is acceptable and very satisfactory models [47], respectively. LR provided better results, while IV gave another perspective on what is the weight of each factor in computing the susceptibility models.
Considering that the study was addressed to marine environment, where direct observation and confirmation is not possible, the results obtained are quite promising for the assessment of submarine slope-failure susceptibility on a regional scale, enabling a preliminary assessment based on limited databases, which requires, as a minimum, bathymetry and sea bottom sedimentary cover maps. This approach may be useful for the selection of zones to be studied in more detail using purpose made site investigations (including geophysical investigations, drilling, sample collection and “in situ” and laboratory testing) required to support physically based slope stability analysis for specific projects.

Author Contributions

N.L. is responsible for the conceptualization, data processing, integration and model output, original draft writing and visualization. F.M.F.S.M. supervised the investigation and model conceptualization, the paper writing and data analysis. A.R. supervised the sediment data interpretation, model integration and paper writing. F.M.F.S.M. and A.R. have additional credits in the study administration and funding. All authors have read and agreed to the published version of the manuscript.

Funding

This research was funded by FCT project UID/GEO/50019/2020 (Instituto Dom Luiz) and SEDMAR Program (Instituto Hidrográfico). Multibeam data and sediment samples were acquired under the scope of SEPLAT Program (funded by the Portuguese Navy) and DEEPCO project (funded by FCT, contract number POCTI/CTA/46367/2002). APC was funded by FCT project UID/GEO/50019/2020 (Instituto Dom Luiz).

Acknowledgments

Acknowledges are due to the mentioned projects and programs, for the provided data. It is also acknowledged the anonymous reviewers comments, which helped to improve the manuscript.

Conflicts of Interest

The authors declare that they have no competing financial interests or any other conflict that could affect the results of this paper. The funders had no role in the design of the study; in the collection, analyses, or interpretation of data; in the writing of the manuscript; or in the decision to publish the results.

References

  1. Hampton, M.A.; Lee, H.J.; Locat, J. Submarine landslides. Rev. Geophys. 1996, 34, 33–59. [Google Scholar] [CrossRef]
  2. Borrell, N.; Somoza, L.; León, R.; Medialdea, T.; Gonzalez, F.J.; Gimenez-Moreno, C.J. GIS Catalogue of Submarine Landslides in the Spanish Continental Shelf: Potential and Difficulties for Susceptibility Assessment. In Submarine Mass Movements and Their Consequences: 7th International Symposium; Lamarche, G., Mountjoy, J., Bull, S., Hubble, T., Krastel, S., Lane, E., Micallef, A., Moscardelli, L., Mueller, C., Pecher, I., Eds.; Springer International Publishing: Cham, Swizerland, 2016; pp. 499–508. [Google Scholar] [CrossRef]
  3. Masson, D.G.; Harbitz, C.B.; Wynn, R.B.; Pedersen, G.; Løvholt, F. Submarine landslides: Processes, triggers and hazard prediction. Philos. Trans. A Math. Phys. Eng. 2006, 364, 2009–2039. [Google Scholar] [CrossRef] [PubMed]
  4. Vanneste, M.; Forsberg, C.F.; Glimsdal, S.; Harbitz, C.B.; Issler, D.; Kvalstad, T.J.; Løvholt, F.; Nadim, F. Submarine landslides and their consequences: What do we know, what can we do? In Landslide Science and Practice, 1st ed.; Margottini, C., Canuti, P., Sassa, K., Eds.; Springer: Berlin, Germany, 2013; pp. 5–17. [Google Scholar]
  5. Nittrouer, C.A.; Wright, L.D. Transport of particles across continental shelves. Rev. Geophys. 1994, 32, 85–113. [Google Scholar] [CrossRef]
  6. Schmidt, S.; de Stigter, H.C.; van Weering, T.C.E. Enhanced short-term sediment deposition within the Nazaré Canyon, North–East Atlantic. Mar. Geol. 2001, 173, 55–67. [Google Scholar] [CrossRef]
  7. Harris, P. Seafloor Geomorphology—Coast, shelf, and abyss. In Seafloor Geomorphology as Benthic Habitat: GeoHab Atlas of Seafloor Geomorphic Features and Benthic Habitats; Harris, P., Baker, E.K., Eds.; Elsevier: Amsterdam, The Netherland, 2012; pp. 108–155. ISBN 978-0-12-385140-6. [Google Scholar] [CrossRef]
  8. Guerreiro, C.; Stigter, H.; Cachão, M.; Oliveira, A.; Rodrigues, A. Coccoliths from recent sediments of the central portuguese margin: Taphonomical and ecological inferences. Mar. Micro. 2015, 114, 55–68. [Google Scholar] [CrossRef]
  9. McAdoo, B.G.; Pratson, L.; Orange, D. Submarine landslide geomorphology, US continental slope. Mar. Geo. 2000, 169, 103–136. [Google Scholar] [CrossRef]
  10. Moore, D.G. Submarine Slides. Rockslides and Avalanches, vol. 1: Natural Phenomena; Voigt, B., Ed.; Elsevier: Amsterdam, The Netherland, 1978; pp. 563–604. ISBN 0-444-41507-6. [Google Scholar]
  11. Evans, N.C. Stability of Submarine Slopes, Geo Report No 47; Geotechnical Engineering Office, Hong Kong Government: Hong Kong, China, 1995; 51p. [Google Scholar]
  12. Poulos, H.G. Marine Geotechnics; Unwin Hyman: London, UK, 1988; 473p, ISBN 004620024X. [Google Scholar]
  13. Henkel, D.J. The role of waves in causing submarine landslides. Géotechnique 1978, 20, 75–80. [Google Scholar] [CrossRef]
  14. Varnes, D.J. Slope Movement Types and Processes. In Landslides, Analysis and Control. Special Report 176; Schuster, R., Krizek, R., Eds.; National Academy of Science: Washington, DC, USA, 1978; pp. 11–33. [Google Scholar]
  15. Mulder, T.; Cochonat, P. Classification of offshore mass movements. J. Sed. Res. 1996, 66, 43–57. [Google Scholar] [CrossRef]
  16. Ilstad, T.; Elverhøi, A.; Issler, D.; Marr, J.G. Subaqueous debris flow behaviour and its dependence on the sand/clay ratio: A laboratory study using particle tracking. Mar. Geol. 2004, 213, 415–418. [Google Scholar] [CrossRef]
  17. Bryn, P.; Berg, K.; Forsberg, C.F.; Solheim, A.; Kvalstad, T.J. Explaining the Storegga slide. Mar. Pet. Geol. 2005, 22, 11–19. [Google Scholar] [CrossRef]
  18. Reichenbach, P.; Rossi, M.; Malamud, B.; Mihir, M.; Guzzetti, F. A review of statistically-based landslide susceptibility models. Earth Sci. Rev. 2018, 180, 60–91. [Google Scholar] [CrossRef]
  19. Marques, F.M.S.F.; Matilde, R.; Redweik, P. Sea cliff instability susceptibility at regional scale: A statistically based assessment in the southern Algarve, Portugal. Nat. Hazards Earth Syst. Sci. 2013, 13, 3185–3203. [Google Scholar] [CrossRef] [Green Version]
  20. Mougenot, D. Geologia da Margem Portuguesa, Doc. Técnicos nº 32; Instituto Hidrográfico: Lisboa, Portugal, 1989; 259p. [Google Scholar]
  21. Rodrigues, A. Tectono-Estratigrafia da Plataforma Continental Setentrional Portuguesa. Ph.D. Thesis, Faculty of Sciences, University of Lisbon, Lisbon, Portugal, 2004; 244p. [Google Scholar]
  22. Lallemand, S.; Sibuet, J.C. Tectonic implications of canyon directions over the north-east Atlantic continental margins. Tectonics 1986, 5, 1125–1143. [Google Scholar] [CrossRef] [Green Version]
  23. Yin, K.L.; Yan, T.Z. Statistical prediction models for slope instability of metamorphosed rocks. In Landslides, Proceedings of the Fifth International Symposium on Landslides, Lausanne, Switzerland, 10–15 July 1988; Bonnard, C., Ed.; Balkema: Rotterdam, The Netherland, 1988; pp. 1269–1272. [Google Scholar]
  24. Cox, D.R. The regression analysis of binary sequences (with Discussion). J. Royal Stat. Soc. 1958, 20, 215–242. [Google Scholar] [CrossRef]
  25. Hosmer, D.; Lemeshow, S. Applied Logistic Regression, 2nd ed.; Wiley: New York, NY, USA, 2000; 383p. [Google Scholar] [CrossRef]
  26. Zêzere, J.L.; Pereira, S.; Melo, R.; Oliveira, S.C.; Garcia, R.A.C. Mapping landslide susceptibility using data-driven methods. Sci. Total Environ. 2017, 589, 250–267. [Google Scholar] [CrossRef] [PubMed]
  27. Varnes, D.J. Hazard zonation: A review of principles and practice. Comm. Landslides Iaeg Unesco Nat. Hazards 1984, 3, 63. [Google Scholar]
  28. Carrara, A.; Guzzetti, F.; Cardinali, M.; Reichenbach, P. Use of GIS technology in the prediction and monitoring of landslide hazard. Nat. Hazards 1999, 20, 117–135. [Google Scholar] [CrossRef]
  29. Guzzetti, F.; Reichenbach, P.; Cardinali, M.; Galli, M.; Ardizzone, F. Probabilistic landslide hazard assessment at the basin scale. Geomorphology 2005, 72, 272–299. [Google Scholar] [CrossRef]
  30. Aleotti, P.; Chowdhury, R. Landslide hazard assessment: Summary review and new perspectives. Bull. Eng. Geol. Environ. 1999, 58, 21–44. [Google Scholar] [CrossRef]
  31. Corominas, J.; van Westen, C.; Frattini, P.; Cascini, L.; Malet, J.P.; Fotopoulou, S.; Catani, F.; Van Den Eeckhaut, M.; Mavrouli, O.; Agliardi, F.; et al. Recommendations for the quantitative analysis of landslide risk. Bull. Eng. Geol. Environ. 2014, 73, 209–263. [Google Scholar] [CrossRef]
  32. Zêzere, J.L. Landslide susceptibility assessment considering landslide typology. A case study in the area north of Lisbon (Portugal). Nat. Hazards Earth Syst. Sci. 2020, 73–82. [Google Scholar] [CrossRef]
  33. Gorsevski, P.V.; Gessler, P.E.; Foltz, R.B.; William, J.E. Spatial prediction of landslide hazard using logistic regression and ROC analysis. Trans. GIS. 2006, 10, 395–415. [Google Scholar] [CrossRef]
  34. Teixeira, M.; Roque, C.; Terrinha, P.; Ercilla, G.; Casas, D. Landslide susceptibility in the Alentejo margin: Statistical analysis. In Proceedings of the Conference: IX Symposium on the Iberian Atlantic Margin—MIA, Coimbra, Portugal, 4–7 September 2018. [Google Scholar]
  35. Piedade, A.; Alves, T.M.; Zêzere, J.L. A new approach to assess ancient marine slope instability using a bivariate statistical method. Mar. Geol. 2018, 401, 129–144. [Google Scholar] [CrossRef] [Green Version]
  36. Guzzetti, F. Landslide Hazard and Risk Assessment. Ph.D. Thesis, University of Bonn, Bonn, Germany, 2005. [Google Scholar]
  37. Chung, C.J.; Fabbri, A.G. Predicting landslides for risk analysis—Spatial models tested by a cross-validation technique. Geomorphology 2008, 94, 438–452. [Google Scholar] [CrossRef]
  38. Egan, J.P. Signal. Detection Theory and ROC Analysis; Academic Press: New York, NY, USA, 1975; 277p. [Google Scholar]
  39. Swets J, A. Measuring the accuracy of diagnostic systems. Science 1988, 240, 1285–1293. [Google Scholar] [CrossRef] [Green Version]
  40. Williams, C.J.; Lee, S.S.; Fisher R, A.; Dickerman, L.H. A comparison of statistical methods for prenatal screening for Down syndrome. Appl. Stoch. Models Data Anal. 1999, 15, 89–101. [Google Scholar] [CrossRef]
  41. Hanley, J.A.; McNeil, B.J. The meaning and use of the area under a receiver operating characteristic (ROC) curve. Radiology 1982, 143, 29–36. [Google Scholar] [CrossRef] [Green Version]
  42. Frattini, P.; Crosta, G.; Carrara, A. Techniques for evaluating the performance of landslide susceptibility models. Eng. Geol. 2010, 111, 62–72. [Google Scholar] [CrossRef]
  43. Pereira, S.; Garcia, R.; Zêzere, J.; Oliveira, S.; Silva, M. Landslide quantitative risk analysis of buildings at the municipal scale based on a rainfall triggering scenario. Geomat. Nat. Hazards Risk 2016, 8, 25. [Google Scholar] [CrossRef]
  44. Gorsevski, P.V.; Gessler, P.E.; Foltz, R.B. Spatial prediction of landslide hazard using logistic regression and GIS. In Proceedings of the 4th International Conference on Integrating GIS and Environmental Modelling, Banff, AB, Canada, 2–8 September 2000. [Google Scholar]
  45. Bi, J.; Bennett, K.P. Regression Error Characteristic Curves. In Proceedings of the Twentieth International Conference on Machine Learning, ICML, Washington, DC, USA, 21–24 August 2003. [Google Scholar]
  46. Guillard, C.; Zêzere, J. Landslide susceptibility assessment and validation in the framework of municipal planning in Portugal: The case of Loures municipality. Environ. Manag. 2012, 50, 721–735. [Google Scholar] [CrossRef]
  47. Guzzetti, F.; Reichenbach, P.; Ardizzone, F.; Cardinali, M.; Galli, M. Estimating the quality of landslide susceptibility models. Geomorphology 2006, 81, 166–184. [Google Scholar] [CrossRef]
  48. Lapa, N.; Rodrigues, A.; Marques, F.M.S.F. Análise morfo-sedimentar da cabeceira do canhão de Aveiro; 4ªs Jornadas de Engenharia Hidrográfica: Lisboa, Portugal, 2016; pp. 339–342. [Google Scholar]
  49. Lapa, N. Estudo Morfo-sedimentar do Canhão de Aveiro. Master’s Thesis, Faculty of Sciences, University of Lisbon, Lisbon, Portugal, 2017; 82p. [Google Scholar]
  50. Haynes, R.; Barton, E.D.; Pilling, I. Development, persistence and variability of upwelling filaments off the Atlantic coast of the Iberian peninsula. J. Geophys. Res. 1993, 98, 22681–22692. [Google Scholar] [CrossRef] [Green Version]
  51. Peliz, A.; Rosa, T.; Santos, A.; Pissarra, J. Fronts, jets, and counter-f lows in the Western Iberian upwelling system. J. Mar. Syst. 2002, 35, 61–77. [Google Scholar] [CrossRef]
  52. Carrara, A. Multivariate models for landslide hazard evaluation. Math. Geol. 1983, 15, 403–426. [Google Scholar] [CrossRef]
  53. Van Westen, C.J.; Rengers, N.; Terlien, M.; Soeters, R. Prediction of the occurrence of slope instability phenomena through GIS-based hazard zonation. Geol. Rundsch. 1997, 86, 404–414. [Google Scholar] [CrossRef]
  54. Guzzetti, F.; Carrara, A.; Cardinali, M.; Reichenbach, P. Landslide hazard evaluation: A review of current techniques and their application in a multi-scale study, Central Italy. Geomorphology 1999, 31, 181–216. [Google Scholar] [CrossRef]
Figure 1. Location of the study area—submarine Aveiro Canyon.
Applsci 10 09038 g001
Figure 2. Sediment sampling stations in the upper course of Aveiro Canyon (sampled by the Instituto Hidrográfico, under the scope of the SEPLAT program (Sedimentary Cartography of the Portuguese Continental Platform) and DEEPCO project (West Iberian deep sedimentary conduits)). The black line indicates the location of profile P1 (see Figure 3).
Applsci 10 09038 g002
Figure 3. Delimitation of submarine mass movement (SMM) morphologic evidence, in the upper course of Aveiro Canyon. The black line indicates the location of profile P1 (see Figure 4).
Applsci 10 09038 g003
Figure 4. (A) Detail of a rotational slide (slump) along the canyon slope in 3D view highlighted with a red line. Black arrow indicates down slope movement. (B) NE–SW profile on the canyon slope, transversal to the rotational slide. Location of the P1 profile is in Figure 3.
Applsci 10 09038 g004
Figure 5. Receiver operating characteristic (ROC) curves for the models with all factors, produced with the corresponding areas under the curve (AUC). In blue, logistic regression (LR) and in red, information value (IV).
Applsci 10 09038 g005
Figure 6. Susceptibility maps based on the information value (IV) model with all factors (on the left), and on the logistic regression (LR) model with all factors (on the right). Black polygons correspond to the delimitations of the identified instabilities.
Applsci 10 09038 g006
Table 1. Predisposing factors surfaces and its respective classes.
Predisposing FactorsClassesReclassified Maps
Bathymetry (m) Applsci 10 09038 i001N
Applsci 10 09038 i002
Applsci 10 09038 i003
Mean slope (degrees) Applsci 10 09038 i004N
Applsci 10 09038 i005
Applsci 10 09038 i006
Aspect (slope face exposure) Applsci 10 09038 i007N
Applsci 10 09038 i008
Applsci 10 09038 i009
Curvature Applsci 10 09038 i010N
Applsci 10 09038 i011
Applsci 10 09038 i012
Sediment cover Applsci 10 09038 i013N
Applsci 10 09038 i014
Applsci 10 09038 i015
Table 2. Information value (Ii) and logistic regression (constant ε and β values) results for each one of the variables.
FactorsVariables (Xi)Information Value (IV)
S = 17,668 Pixels;
N = 405,714 Pixels.
Logistic Regression
Forward Conditional (LR)
ε = −22.8423
SiNiIiβ
Bathymetry (m)2875–2400135167,236−0.33590.0000
2400–2100180243,209−0.018811.7773
2100–1800353536,3000.349512.3096
1800–1500294330,6600.343313.3058
1500–1200405530,4740.485113.4463
1200–900356938,7200.325613.9575
900–60041332,789−0.538713.6531
600–3000 *22,924−2.999711.6683
300–00 *103,402−3.65396.2134
Mean slope (degrees)0–51593126,867−0.54011.1351
5–10419665,8890.16511.2185
10–15444067,2700.18060.8517
15–20332554,2800.14820.5190
20–25204242,0990.04680.1781
25–3093925,951−0.0805−0.2529
30–3544611,472−0.0493−0.2454
35–4025752500.05080.0311
40–4519730780.16720.3864
45–5011417040.18650.2917
50–7811918540.16850.0000
Aspect (slope face exposure)N82118,3540.01160.2859
NE102414,6860.20440.7079
E38643610.30800.9623
SE77987200.31210.9770
S291439,3120.23100.7409
SW374576,8580.048803921
W4253114,122−0.06760.4504
NW278297,739−0.18470.0757
N96431,562−0.15410.0000
CurvatureConcave8673146,3240.13390.1545
Flat1361112,680−0.55700.1189
Convex7634146,7100.07730.0000
Sediment coverCoarse sand0 *8218−2.55420.2279
Medium sand0 *45,612−3.2985−00449
Fine sand0 *42,355−3.2663−3.2677
Very fine sand0 *9272−2.6066−5.4053
Coarse silt0 *392−1.2327−75024
Medium silt6057107,3620.11245.8967
Fine silt10,803125,0130.29766.1883
Very fine silt80863,718−0.53585.3359
Rock0 *3772−2.21600.0000
* No instabilities identified in the terrain unit of the variable. A value of 0.999 was assumed to avoid undetermined values and to prevent an excessive increase in the obtained negative score values (Ii).
Table 3. Absolute mean values and area under the curve (AUC) values for each one of the predisposing factors, based on the information value (IV) method.
FactorsIi Absolute Mean ValuesSuccess Rate Curve AUC
Bathymetry0.83150.7930
Mean slope0.18760.6553
Aspect0.18880.6030
Curvature0.47420.5838
Sediment cover1.76970.7120
Table 4. Receiver operating characteristic (ROC) curves area under the curve (AUC) values for the different models produced with 1 to 5 predisposing factors, according to their relevance. Models computed with the information value (IV) and logistic regression (LR) methods. Higher values are highlighted in bold.
ModelIVLR
5 factors: Bat.; Slope; Asp.; Sed.; Curv.0.79080.8296
4 factors: Bat.; Slope; Asp.; Sed.;0.79550.8269
3 factors: Bat.; Slope; Asp.0.79710.8246
3 factors: Bat.; Slope; Sed.0.79200.8217
2 factors: Bat.; Slope 0.79360.8189
2 factors: Bat.; Sed. 0.78750.7942
1 factor: Bathymetry0.79300.7930
Publisher’s Note: MDPI stays neutral with regard to jurisdictional claims in published maps and institutional affiliations.