Article

The Study of Economic and Environmental Viability of the Treatment of Organic Fraction of Municipal Solid Waste Using Monte Carlo Simulation

by
Jaime Martín-Pascual
1,
José María Fernández-González
2,
Nicolò Ceccomarini
3,
Javier Ordoñez
4 and
Montserrat Zamorano
1,*
1
Department of Civil Engineering, University of Granada, 18071 Granada, Spain
2
PROMA Ingenieros, University of Granada, 18071 Granada, Spain
3
Department of Civil, Chemical, Environmental and Materials Engineering, University of Bologna, 40136 Bologna, Italy
4
Department of Construction Engineering and Projects of Engineering, University of Granada, 18071 Granada, Spain
*
Author to whom correspondence should be addressed.
Appl. Sci. 2020, 10(24), 9028; https://doi.org/10.3390/app10249028
Submission received: 3 November 2020 / Revised: 7 December 2020 / Accepted: 14 December 2020 / Published: 17 December 2020
(This article belongs to the Special Issue Techniques for Sustainable Processing of Natural Resources II)

Abstract

:
Valorization of municipal solid waste (MSW) plays a crucial role in a sustainable society and provides an opportunity to reduce carbon emissions. The economic and social viability of the treatment of the organic fraction of MSW (OFMSW) with a multi-scenario analysis (composting and anaerobic digestion for renewable electricity or for biomethane injection into natural gas networks) was studied using a Monte Carlo simulation. The cost of treating organic fraction of MSW to neutralize financial net present value (NPV) and social NPV through greenhouse gas emissions avoided was determined for each scenario. The costs considered were the investment and the operating and maintenance costs. The financial benefits from the revenue of subproducts depended on the scenario. The lowest average fee to neutralize the financial NPV was 6.38 €/tonne treated in anaerobic digestion for biomethane injection into natural gas networks, therefore, it was the most financially viable. The average social NPV calculated for biomethane injection into natural gas networks (16.60 €/tonne) was higher than that obtained for renewable electricity (13.59 €/tonne). According to the results, anaerobic digestion for biomethane injection into natural gas networks is the most socially and economically viable alternative for the treatment of OFMSW.

1. Introduction

Considering the severe consequences that improper waste management systems can pose for the environment and society, valorization of municipal solid waste (MSW) represents a relevant matter for policymakers [1]. Waste management is a major source of greenhouse gas emissions and provides an opportunity to reduce carbon emissions that have yet to be fully exploited [2]. Indeed, the long-standing exploitation of fossil fuel has resulted in global warming due to significant greenhouse gas emissions with its attendant environmental and health problems [3].
Recycling of MSW plays a crucial role in a sustainable society, where waste management strategies should promote an efficient development of MSW recycling markets [4]. The European Union recently issued, in January 2017, a broad and complex set of regulations, for the action plan for the circular economy which included promoting waste recycling across the member states with the aim of achieving the target for recycling 70% of MSW by 2030 [1]. The recycling of waste, in a model based on the circular economy, plays a significant role by reducing the environmental impact associated with waste management, allowing increased availability of resources for industry, and promoting investment and job creation in the recycling sector [4]. Therefore, MSW should always deal with the using wastes as substitutes for primary materials and as an energy source, thus, reducing environmental pollution [5]. The introduction of various support schemes that promote the use of renewable resources and the energy and climate policies of the European Union have encouraged the development of anaerobic digestion plants for energy production [6].
There are mainly two technologies for the conversion of the organic fraction of municipal solid waste (OFMSW) into secondary materials, i.e., composting (aerobic digestion) and anaerobic digestion [7]. Composting is a strategic technology for the sustainability of agricultural activities that can fix critical issues such as the disposal of crop residues and livestock wastes [8]. The main output of the composting process is compost that can be used as a fertilizer in the agricultural sector.
Anaerobic digestion combines energy recovery with material recovery, obtaining the following two types of outputs: biogas, principally comprising CH4 and CO2 and a semi-solid residue, also known as digestate [9,10]. Therefore, anaerobic digestion is included as a waste-to-energy technology, because a variety of waste can be converted into energy resources in order to create valuable opportunities both in terms of energy recovery and environmental impact, such as reducing greenhouse gas emissions [11]. Biogas is a mature renewable energy technology, and it is produced starting from anaerobic digestion from several feedstocks, such as agricultural residues, energy crops, OFMSW, and organic waste produced by industry [12]. Anaerobic digestion is widely used to transform biomass residues into a biogas [13]. Indeed, it is largely used worldwide to generate energy from biogas, with the aim of bringing significant environmental and economic benefits [6].
Although anaerobic digestion is one of the most widely investigated methods used in the production of energy from different kinds of organic waste [14], the biogas needs to be purified or upgraded to natural gas (biomethane) grade before its final consumption as a fuel [3]. The biogas produced during anaerobic digestion can be converted to renewable electricity and heat through cogeneration to be used on site or exported to an electricity network or can be upgraded to biomethane for injection into natural gas networks for user consumption or possibly compressed and dispensed as vehicle fuel [13].
The solutions for MSW management should be environmentally sustainable, as well as cost-efficient and socially acceptable [15]. Although various methods for calculating the economical effectiveness of waste utilized as secondary materials have been proposed [4], in the present research, the economic significance and the reliability of a metric that depends on its compatibility are the evaluated net present value (NPV) [16]. In addition, the benefits derived from the CO2 emissions avoided, resulting from the use of conversion technologies of biogas, are considered through the social NPV. The Monte Carlo (MC) technique is one of the stochastic models used to account for risk in quantitative analysis and decision making. MC simulation has been largely used by researchers in a wide range of areas including project management, energy, engineering, research and development, and risk management [17].
In this research, for the first time, MC simulation was used as a decision-making tool in MSW management considering both economic and environmental aspects. Specifically, the aim of the present research was to find the most economic and socially viable alternative for the treatment of the OFMSW with a multi-scenario (composting, anaerobic digestion for renewable electricity, or anaerobic digestion for biomethane injection into natural gas networks) analysis using MC simulation. For this purpose, the cost of treatment for the OFMSW and the social viability through greenhouse gas emissions avoided were determined for each scenario.

2. Materials and Methods

2.1. Description of Scenarios

Considering the requirements of Directive 2018/851, which amended Directive 2008/98/EC on waste, in the present research, the following three different alternative scenarios based on the selective collection of OFMSW were developed for comparison: (i) Scenario 1 (aerobic digestion process for composting), (ii) Scenario 2 (anaerobic digestion for renewable electricity generation), and (iii) Scenario 3 (anaerobic digestion for biomethane injection into natural gas networks).

2.2. Cost/Benefit Assessment

In order to provide an economic assessment for the treatment of OFMSW, costs and benefits were identified. The major costs studied were allocated into two macro-categories, which were initial costs and operation and maintenance costs. Initial costs are imputable to the investment costs needed for launching a new business and represent a cost incurred once. Operation and maintenance costs are incurred periodically, in a clear time frame, typically annually.
The benefits resulting from the sale of the final product represent a concrete income for the venture. From each scenario, a quite different product is derived, each one having a diverse price including principally the components of the quality and the technology process employed to achieve the final product ready to be delivered to the final customer. Specifically, the final product resulting from composting was the compost, while the products resulting from anaerobic digestion in Scenarios 2 and 3 were, respectively, renewable electricity and biomethane. The revenue from electricity energy sales was taken from the available data of different researchers; from the value of revenue and MSW treated published, the unitary revenue was calculated.
In addition, the benefits derived from the CO2 emissions avoided that resulted from the use of conversion technologies of biogas should be considered. This benefit is only imputable in anaerobic digestion (Scenario 2 and 3) due to the fact that in Scenario 1 no energy generation is produced. CO2 emissions avoided do not represent a concrete monetized income for a venture, but at the same time they can provide interesting opportunities to improve environmental sustainability having significant implications on human life. Similar to revenue from electricity energy sales, CO2 was calculated from numerous references. This value can be measured, in economic terms, using SendeCO2 [18] which converts the tons of CO2 equivalent in euros through a factor of 5.83 € (representing the 2017 annual average of the carbon market).

2.3. Fee and Financial Net Present Value (NPV)

The economic performance and profitability of an investment can be studied through NPV in a risk analysis, considering that municipalities are generally responsible for urban solid waste services, to ensure that the venture managing the service does not assume an investment having losses over a certain timeframe. In the waste management sector, taxes are considered to be direct revenues, provided that the project promoters can demonstrate that they are raised for the financing of the waste service and earmarked. The replacement of short-life assets (plant equipment and machinery) needs to be undertaken every 10 years (although it can be phased over a two-year period), and the relevant amounts are included within incremental operating costs when performing the calculation of the discounted net revenue (Regulation (EC) No. 1303/2013). Calculation of the fee associated with all the processes and stages involved in the treatment and elimination of MSW, for each of the alternatives, consisted of the difference between total costs and the revenues obtained. From the NPV calculation, it is possible to quantify economically the required fee to achieve a break-even return in the feasibility proposal of the treatment of OFMSW.
Financial NPV (NPVf) is a widely known criterion for evaluating operations, investments, and financial business decisions [19]. It is calculated (Equation (1)) as the sum of net annual cash flow (Fn) over project lifetime (N), where each cash flow (n = 0, …, N) is discounted from its time n to the present time (n = 0) by the discount rate r [20] as follows:
N P V f = I 0 + n = 1 N F n ( 1 + r ) n
The Fn includes the annual revenues (RE) resulting from the sale of the product corresponding to the specific scenario, the operation and maintenance costs (O&M), the initial costs (I0), and the fee. Considering the above, the NPVf can be calculated by Equation (2) as:
N P V f = I 0 + ( R E O & M + F e e ) n = 1 N 1 ( 1 + r ) n
From Equation (2) for NPVf and assuming the fee as a fixed annual income, the fee can be calculated considering that NPVf must be neutral (NPVf equal to 0) given the public responsibility of the urban waste management. The annual fee can be calculated by Equation (3) as:
F e e = I 0 R E ( 1 + r ) N 1 r ( 1 + r ) N + O & M ( 1 + r ) N 1 r ( 1 + r ) N ( 1 + r ) N 1 r ( 1 + r ) N
In this research, a project lifetime of 10 years (N = 10) and a project discount rate of 12% (r = 0.12) were considered in accordance with the options offered in the EC Guide to Cost-Benefit Analysis of Investment Projects [21], in order to assess a reasonable discount rate which should represent the financial situation in developing countries [22] considering the maximum values of the cost of capital required for different renewable technologies according to Steffen [23].

2.4. Social NPV

The assessment of social NPV (NPVs) is proposed to account for all benefits that are hard to monetize because they do not represent an effective annual cash flow. In addition to revenue, operation and maintenance costs, and fee, NPVs includes and assumes the social benefit resulting from CO2 emissions avoided as a concrete annual cash flow. If NPVs of a project is greater than zero, this is a cost-effective project. NPVs is calculated by Equation (4), where BSn represents the expected net cash flow, also including the economic benefit of CO2 emissions avoided and the annual fee required, at time n:
N P V s = I 0 + n = 1 10 B S n ( 1 + r ) n

2.5. Monte Carlo Simulation

The tool used to implement the MC simulation was Microsoft Excel for investigating the range of model results in order to determine the variability, the trend, and the performance of the results obtained under uncertain conditions. An MC simulation of 10 years was carried out to determine NPVf and NPVs, using costs and benefits as inputs. Each of the inputs were varied 5000 times across a uniformly distributed range of possible values. In order to calculate the profitability of the project under different scenarios, the MC methodology was applied to 5000 iterations of NPV values under varying economic conditions guided by random cost/benefit items as input.

3. Results and Discussions

3.1. Economic Analysis: Cost and Benefit

In order to have a comprehensive overview from different literature reviews, the adoption of a clearly defined measuring system that includes item costs derived from quite different backgrounds is proposed. The unit of measurement to compare the different scenarios is €/tonne of OFMSW that can be treated. Table 1 shows the range of values for each scenario for costs and benefits obtained from the experiences checked in different countries, years, and volume treated, including extreme values when costs and benefits are likely to oscillate.
According to the data reviewed, the initial costs of a plant for OFMSW composting (Scenario 1) range from 18.49 to 78.15 €/tonne of waste treated. The main initial costs are land acquisition, civil work construction, fixed and mobile equipment (just for the centralized plant), planning, design, and engineering costs. Aye and Widjaya studied two different situations for composting organic fraction with a range from 18.49 to 43.7 €/tonne of waste. The first situation, consisted of 30 small-scale labor-intensive plants that used open windrow composting (plant capacity 6.5 tonnes/day of incoming waste, to a total of 71,175 tonnes of waste/year) and open dumping of the other fractions; the second situation consisted of a centralized plant that also used open windrow composting and open dumping of the other fractions for about 200 tonnes/day (equivalent to 73,000 tonnes of waste/year) [7]. An analysis of five composting plants using different composting technologies carried out by Pergola et al. [8] showed that the initial cost could reach 78.15 €/tonne of waste treated.
The different literature studies investigated showed operation and maintenance costs ranging from 13.33 to 25.93 €/tonne of waste per year. Aye and Widjaya, with the same conditions outlined for initial costs, showed that the operation and maintenance costs could range from 13.33 to 25.85 €/tonne of waste per year [7]. In an Italian case study, Pergola et al. showed average operation and maintenance costs of 19.84 €/tonne of waste per year for a composting designed plant [8]. A study performed by Bekchanov and Mirzabaev showed operation and maintenance costs of 25.93 €/tonne of waste per year [24]. Although both capital and operating costs decreased substantially as the plant scale increased, until leveling off, these could be considered to be the extreme value for the initial analysis.
The annual revenue from compost’s sales can be highly variable, according to the review done, fluctuating from 5.60 to 29.91 €/tonne. Aye and Widjaya reported about 28.90 €/tonne of waste per year [7]. However, this revenue can be quite different. For example, Masebinu et al. showed an income from compost of 5.6 €/tonne of waste treated per year [32].
The same approach was carried out to investigate the costs and benefits in anaerobic digestion process conditions, for renewable energy electricity production. The initial costs for Scenario 2 (Table 1) were quite different relative to those investigated for Scenario 1. In fact, according to different literature reviews, Lin et al. [25] and Rosa [26], where the latter implemented an economic assessment of upgrading and selling biogas starting from a typical farm-based anaerobic digestion plant in Northern Ireland assumed as reference, reported that the initial costs for anaerobic digestion in a biogas plant could range from 50.62 to 243.51 €/tonne of waste. An assessment from other diverse literature reviews was done in order to evaluate the accuracy of this range. In a report by Rasheed et al., in Pakistan’s context, the initial costs for a novel anaerobic bioenergy plant were about 64.62 €/tonne of waste as input in a digester [29]. However, as claimed by Ruiz et al. [13], the total initial costs for a commercial thermophilic biogas plant located in Spain, where a combined heat and power system produced electricity and then sold it to the network, were 54.91 €/tonne of waste. In relation to the operation and maintenance costs, according to Rasheed et al. [29] and Ruiz et al. [13], these ranged from 9.23 to 14.43 €/tonne of waste (Table 1).
The renewable electricity produced sales in the benefits of this scenario. As Table 1 shows, the benefits are located in a range from 3.87 to 27.63 €/tonne of waste per year, according to Ruiz et al. [13]. In the assessment carried out by Rosa, the income was 15.63 €/tonne of waste per year resulting from electricity sold [26].
Differently from Scenario 1, in this scenario one should also consider the benefits arising from the CO2 emissions avoided, that can be quantified through SendeCO2 [18], which will affect the social NPV computation. These ranged from 0.44 to 4.39 €/tonne of waste per year (Table 1), as reported by Lin et al. [26] and Aye and Widjaya [7]. Other different literature assessments, by Masebinu et al. [32] and Budzianowski and Budzianowska [33], showed values, respectively, of 3.49 and 3.00 €/tonne per year.
Finally, an assessment for Scenario 3, i.e., anaerobic digestion for biomethane injection into natural gas networks for user consumption, can be set out. The initial costs for Scenario 3 ranged between 39.90 and 131.58 €/tonne of waste (Table 1) according to the experience of Cucchiella et al. [12], who evaluated the profitability of small-scale biomethane plants concerning two typologies of substrates, and Chan Gutierrez et al. [27], who investigated the economic feasibility of a biomethane plant for a Mexican city, identified initial investment costs for upgrading biogas to biomethane. Other references, such as Lin et al. [25] (55.5 €/tonne of waste), Vo et al. [28] (98.85 €/tonne of waste), and Rosa [26] (82.76 €/tonne of waste) were consistent with this range.
The operation and maintenance costs for Scenario 3 ranged from 7.56 to 35.53 €/tonne of waste per year (Table 1) according to Cucchiella et al. [12] and Vo et al. [28]. Additional studies performed by Chan Gutiérrez et al. [27] and De Clercq et al. [30] showed costs of 14.53 and 15.14 €/tonne per year, respectively.
Regarding the benefits carried out in this assessment, this could range from 13.57 to 47.16 €/tonne per year (Table 1). According to Mengistu et al., the annual gains by selling biomethane could be 13.57 €/tonne of waste [31]. Other surveys performed by Masebinu et al. [32] and Chan Gutiérrez et al. [27] showed a revenue of, respectively, 21.74 and 23.48 €/tonne per year. Finally, the assessment carried out by Vo et al. [28] evidenced an annual profit of 47.16 €/tonne of waste. As done for the previous scenario, for biomethane production it is mandatory to consider in the assessment the social and environmental annual benefit represented by CO2 emissions avoided. According to the studies proposed by Budzianowski and Budzianowska [33] and Masebinu et al. [32], these could range from 1.47 to 4.39 €/tonne per year (Table 1).
Consequently, the initial costs carried out for Scenarios 2 and 3 are consistently higher than the initial costs reported in Scenario 1. This could be attributed to the different technologies needed for the anaerobic digestion process as compared with the aerobic digestion process. In relation to operation and maintenance costs, the highest value of Scenario 3 could be imputable to the technologies adopted, followed by an increase in personnel costs that arise from the increased technological component of a plant design; in fact, for Scenario 3 highly skilled personnel are needed for a comparison with the other two scenarios. The same reasons apply for the revenues that rise with an increase in the final quality of the product, due to the more advanced technological components in Scenarios 2 and 3 as compared with Scenario 1. In fact, according to Lin et al., the economic favorability of anaerobic digestion (Scenarios 2 and 3), as compared with composting (Scenario 1), was highly dependent on plant scale and valorization of the end products [25].

3.2. Fee Analysis

Table 2 shows a summary of the fee obtained (minimum, maximum, and average values) for each scenario considering the neutral NPVf with the MC methodology used. The fee was lowest in Scenario 3 and highest in Scenario 2. Specifically, the average fee and the fee range for Scenarios 1, 2, and 3 were 10.49 and −11.43 to 33.02, 22.09 and −8.64 to 52.09, and 6.38 and −29.56 to 42.54, respectively, with all in €/tonne of waste.
In order to include all output values of the simulation, a fee’s density and distribution function graph was built for each scenario (Figure 1). Independent of the scenario, the trend of the fee always takes the shape of a Gaussian distribution. The rank class was defined from −40 to 75 €/tonne to cover the entire set of values assumed by the fees from the MC simulation in all scenarios. The vertical axis Y shows the frequency, in percentage, that the fee assumes the value showed in the horizontal axis X.
In Scenario 1, the average value of the fee corresponding to values of rank class 15 has the major probability of about 21.26%. It can be noted that, for Scenario 1, P (fee > −10 €/tonne) is 99.79%, and P (fee > 30) is 0.42%, approaching 0.
The same approach was conducted for Scenario 2. In this case, using the same rank classes fixed the values included in rank classes of 20 and 25 to have the major probability of, respectively, 14.34% and 13.79%. Studying the cumulative distribution function, it can be noted that, in Scenario 2, P (fee > −5) is 99.60% and P (fee > 50) is 0.19%, approaching 0, for major values of fee.
Finally, in Scenario 3, the values covered by the rank class 10 have the major frequency of 14.22%. Moreover, with respect to the cumulative distribution function for Scenario 3, it can be seen that P (fee > −20) is 98.17% and P (fee > 40) resulting in 0.08% approaching 0 for major values.
In general, the lower the fee is, the higher the social acceptation is. Considering the fee value obtained for each scenario, the most viable is Scenario 3 with the lowest average fee, followed by Scenario 1, and, in the last position, Scenario 2 with the highest fee.

3.3. Social NPV

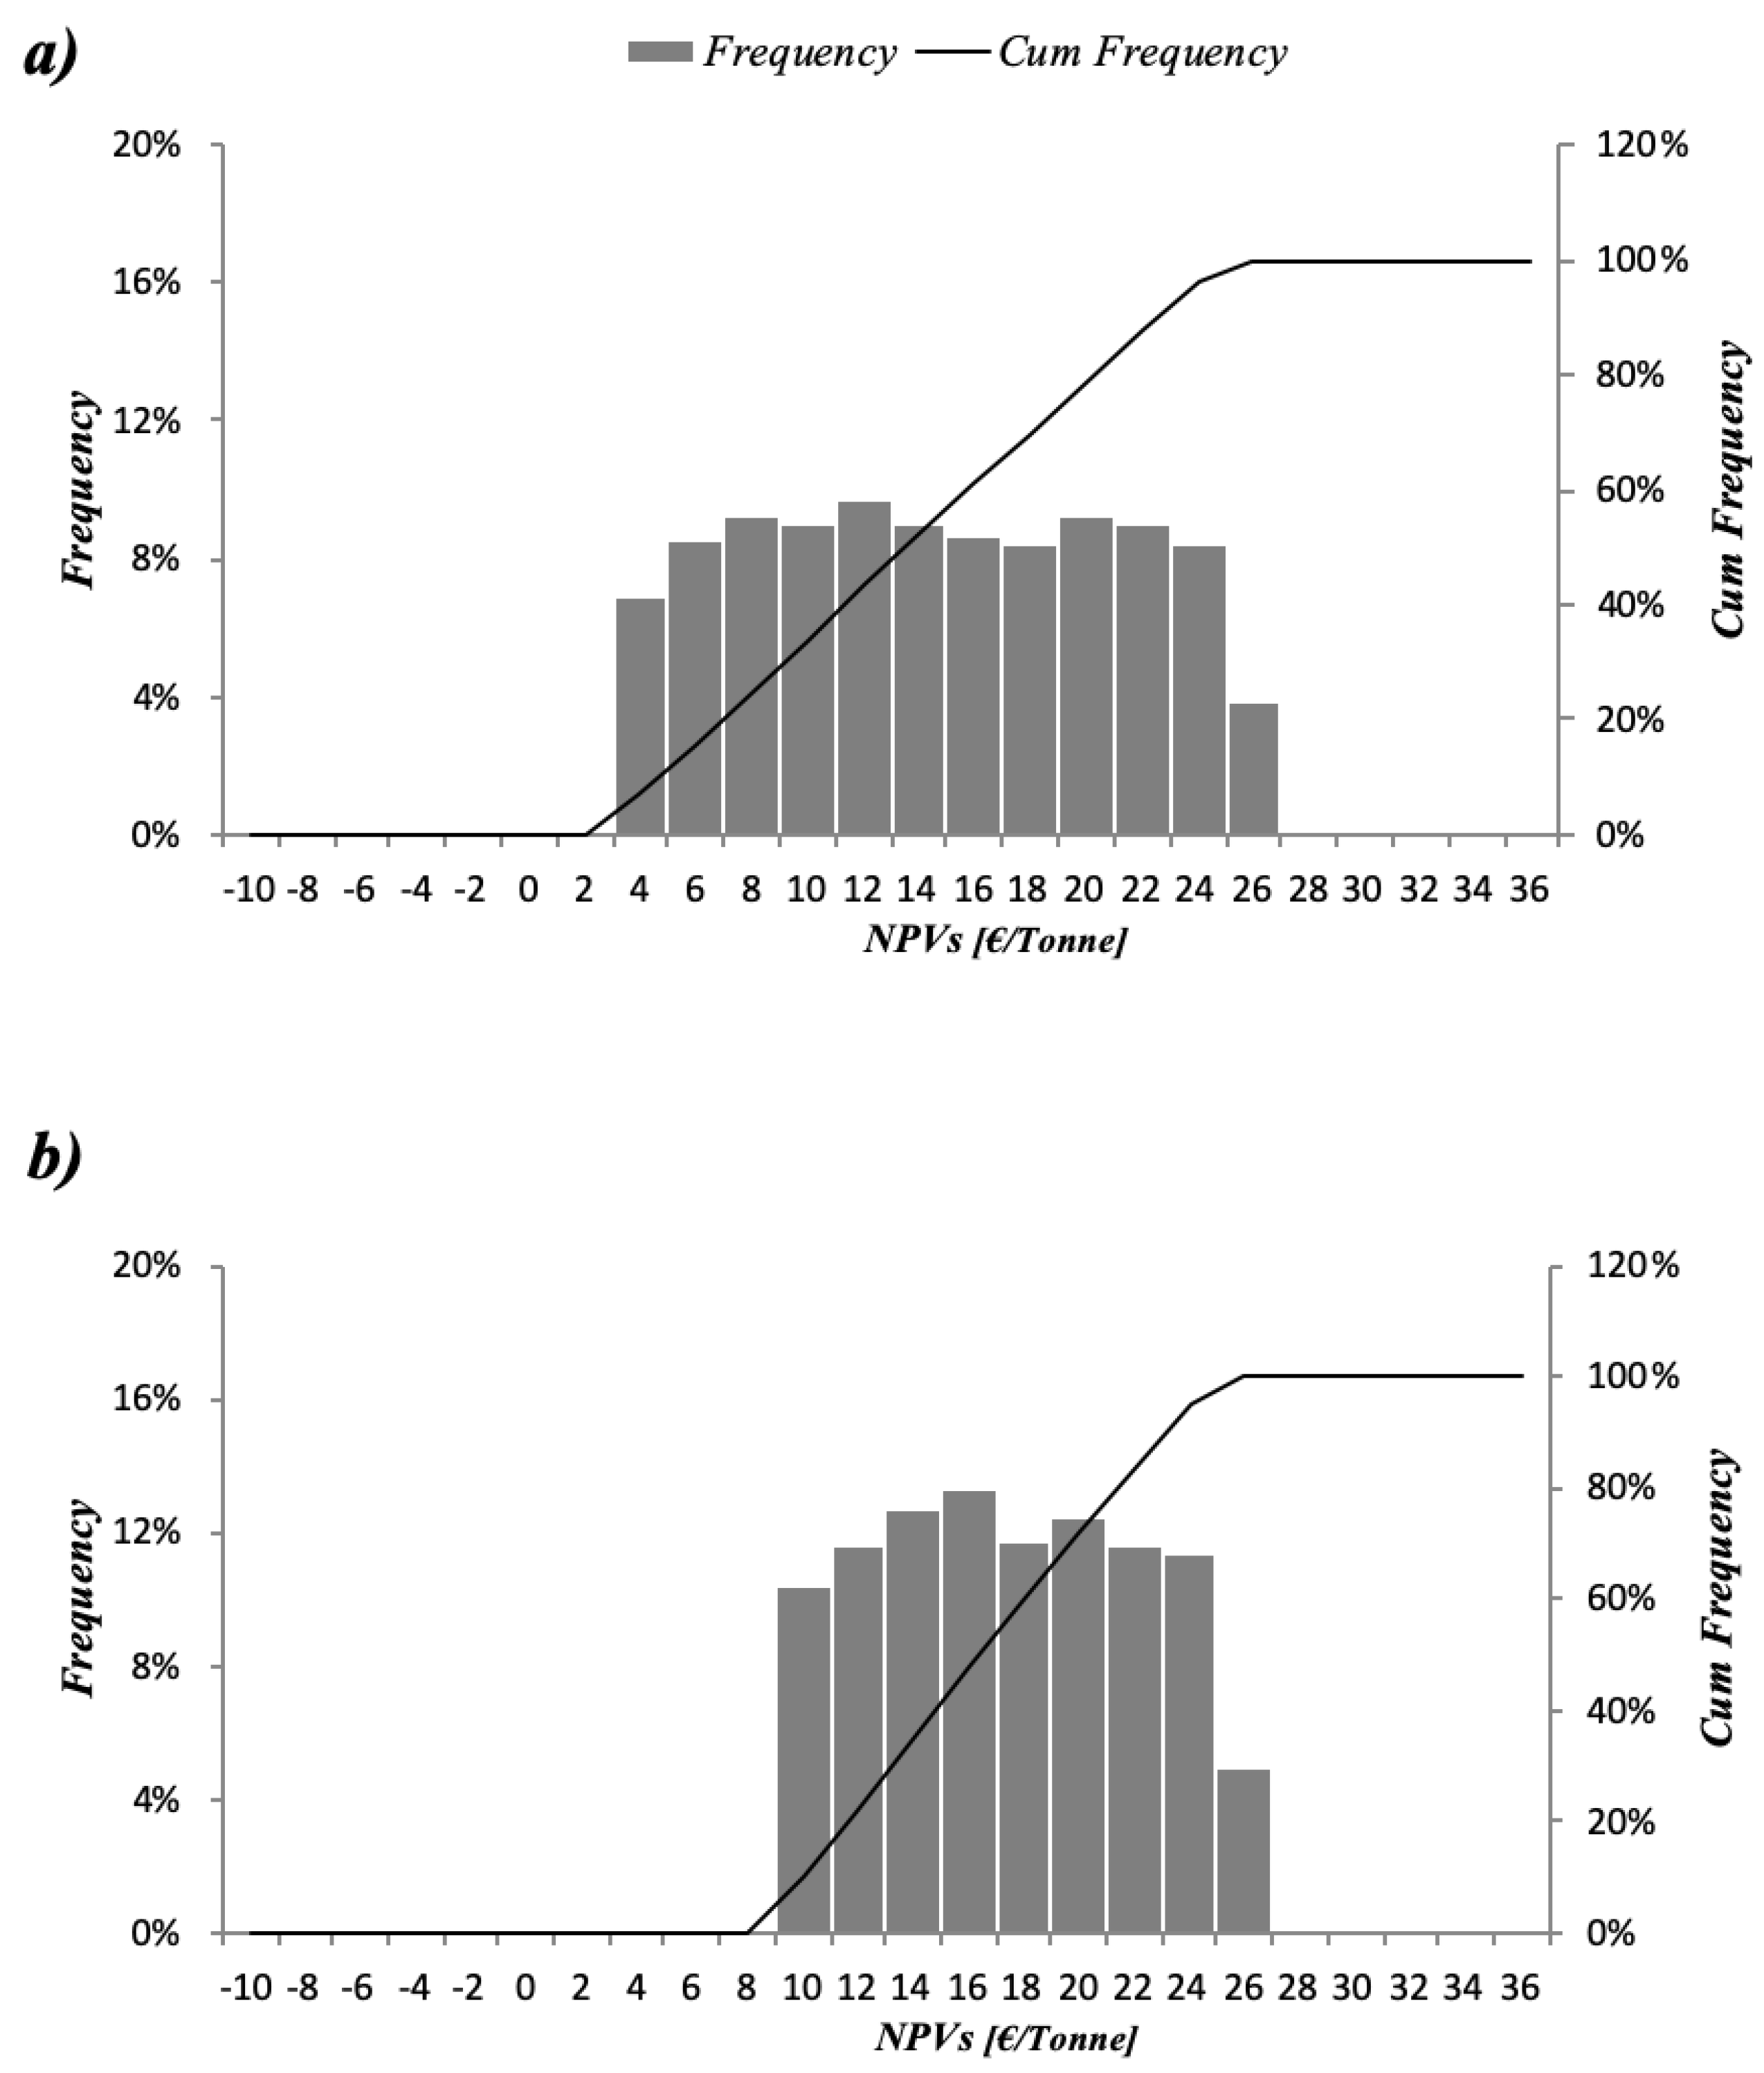
Table 2 summarizes the values of NPVs obtained applying the MC simulation. By analyzing all 5000 values of the NPVs carried out, it was possible to extrapolate the minimum, maximum, and average values of the simulation defined in Table 1. The NPVs includes the annual cash flow the CO2 emissions avoided for the renewable energy production and the fee calculated in a previous section.
The CO2 emissions avoided for the non-elimination in landfill would be the same in the three scenarios, therefore, they have not been considered. Therefore, the NPVs of Scenario 1 appears to be equal to 0, since the benefit resulting from CO2 emissions avoided are considered to be null, as assumed in previous sections. The NPVs of Scenario 2 ranged between 2.49 and 24.81 €/tonne with an average value of 13.59 €/tonne. Slightly higher values were obtained for Scenario 3, with an average value for NPVs of 16.60 €/tonne with a range between 8.31 and 24.81 €/tonne. This shows that Scenario 3 is the most socially viable scenario.
A more in-depth analysis is required for Scenarios 2 and 3, where there are benefits of non-zero CO2 emissions avoided. As Figure 2 shows, for this analysis, different rank classes were defined in order to cover all outputs of NPVs outputs extracted from the MC simulation. The rank classes suggested range from −10 to 36 €/tonne. In starting to analyze NPVs for Scenario 2, it can be noted that the density functions have the same trend of fluctuating between 8.41% and 9.72% of probability for the majority rank classes considered (covering 89.26% of NPVs values) ranging from 6 to 24 €/tonne. Studying the cumulative distribution function, it can be seen that P (NPVs > 4) is 93.10%, becoming 100% in rank class 2. P (NPVs > 24) is 3.85%, becoming 0% in the following rank class of 26.
By moving to Scenario 3, it can be noted that the rank classes covering the majority of NPVs values range from 10 to 24 (94.98% of NPVs values), which is different from the 6 to 24 rank range identified for Scenario 2, meaning that in Scenario 3 the average value of the NPVs will always be higher than the average value resulting from Scenario 2. Analyzing the cumulative distribution function, it can be seen that P (NPVs > 10) is 89.42%, becoming 100% in rank class 8, and P (NPVs > 24) is 5.02%, becoming 0 in rank class 26.

4. Conclusions

Considering the results obtained from a multi-scenario evaluation of treatments for organic fraction of municipal solid waste (OFMSW) with aerobic digestion (Scenario 1), anaerobic digestion for renewable electricity generation (Scenario 2), and anaerobic digestion for biomethane injection into natural gas networks (Scenario 3) using Monte Carlo simulation, the following conclusions were drawn:
  • Monte Carlo simulation is a useful tool for quantitative analysis and decision making in OFMSW management.
  • Although the initial costs for Scenarios 2 and 3 are consistently higher than the initial costs reported for Scenario 1, the revenues that rise with an increase in the final quality of the product are higher and they present a social benefit.
  • The lowest average fee that neutralizes the NPVf is 6.38 €/tonne treated in Scenario 3, and the highest is estimated in Scenario 2 (22.09 €/tonne), therefore, Scenario 3 is the most financially viable scenario.
  • The average NPVs calculated in Scenario 3 (16.60 €/tonne) is higher than that obtained in Scenario 2 (13.59 €/tonne), therefore, Scenario 3 is the most socially viable scenario.
Considering the above, anaerobic digestion versus the traditional aerobic digestion process for composting must be considered as a viable solution for the treatment of OFMSW. Moreover, anaerobic digestion for biomethane injection into natural gas networks could be more interesting than anaerobic digestion for renewable electricity generation in relation to the social viability.

Author Contributions

The authors contributed equally to this work. All authors have read and agreed to the published version of the manuscript.

Funding

This research received no external funding.

Acknowledgments

The authors appreciate the support of the research group TEP-968 (Technologies for Circular Economy) of the University of Granada.

Conflicts of Interest

The authors declare no conflict of interest.

References

  1. Sisto, R.; Sica, E.; Lombardi, M.; Prosperi, M. Organic fraction of municipal solid waste valorisation in southern Italy: The stakeholders’ contribution to a long-term strategy definition. J. Clean. Prod. 2017, 168, 302–310. [Google Scholar] [CrossRef]
  2. Liu, Y.; Ni, Z.; Kong, X.; Liu, J. Greenhouse gas emissions from municipal solid waste with a high organic fraction under different management scenarios. J. Clean. Prod. 2017, 147, 451–457. [Google Scholar] [CrossRef]
  3. Ayodele, T.R.; Ogunjuyigbe, A.S.O.; Alao, M.A. Economic and environmental assessment of electricity generation using biogas from organic fraction of municipal solid waste for the city of Ibadan, Nigeria. J. Clean. Prod. 2018, 203, 718–735. [Google Scholar] [CrossRef]
  4. Alwaeli, M. Economic calculus of the effectiveness of waste utilization processed as substitutes of primary materials. Environ. Prot. Eng. 2011, 37, 51–58. [Google Scholar]
  5. Expósito, A.; Velasco, F. Municipal solid-waste recycling market and the European 2020 Horizon Strategy: A regional efficiency analysis in Spain. J. Clean. Prod. 2018, 172, 938–948. [Google Scholar] [CrossRef]
  6. Scarlat, N.; Fahl, F.; Dallemand, J.F.; Monforti, F.; Motola, V. A spatial analysis of biogas potential from manure in Europe. Renew. Sustain. Energy Rev. 2018, 94, 915–930. [Google Scholar] [CrossRef]
  7. Aye, L.; Widjaya, E.R. Environmental and economic analyses of waste disposal options for traditional markets in Indonesia. Waste Manag. 2006, 26, 1180–1191. [Google Scholar] [CrossRef]
  8. Pergola, M.; Persiani, A.; Palese, A.M.; Di Meo, V.; Pastore, V.; D’Adamo, C.; Celano, G. Composting: The way for a sustainable agriculture. Appl. Soil Ecol. 2018, 123, 744–750. [Google Scholar] [CrossRef]
  9. Rajaeifar, M.A.; Ghanavati, H.; Dashti, B.D.; Heijungs, R.; Aghbashlo, M.; Tabatabaei, M. Electricity generation and GHG emission reduction potentials through different municipal solid waste management technologies: A comparative review. Renew. Sustain. Energy Rev. 2017, 79, 414–439. [Google Scholar] [CrossRef]
  10. Mancini, E.; Arzoumanidis, I.; Raggi, A. Evaluation of potential environmental impacts related to two organic waste treatment options in Italy. J. Clean. Prod. 2019, 214, 927–938. [Google Scholar] [CrossRef]
  11. Laramee, J.; Tilmans, S.; Davis, J. Costs and benefits of biogas recovery from communal anaerobic digesters treating domestic wastewater: Evidence from peri-urban Zambia. J. Environ. Manag. 2018, 210, 23–35. [Google Scholar] [CrossRef] [PubMed]
  12. Cucchiella, F.; D’Adamo, I.; Gastaldi, M.; Miliacca, M. A profitability analysis of small-scale plants for biomethane injection into the gas grid. J. Clean. Prod. 2018, 184, 179–187. [Google Scholar] [CrossRef]
  13. Ruiz, D.; San Miguel, G.; Corona, B.; Gaitero, A.; Domínguez, A. Environmental and economic analysis of power generation in a thermophilic biogas plant. Sci. Total Environ. 2018, 636, 1418–1428. [Google Scholar] [CrossRef] [PubMed]
  14. Rafieenia, R.; Girotto, F.; Peng, W.; Cossu, R.; Pivato, A.; Raga, R.; Lavagnolo, M.C. Effect of aerobic pre-treatment on hydrogen and methane production in a two-stage anaerobic digestion process using food waste with different compositions. Waste Manag. 2017, 59, 194–199. [Google Scholar] [CrossRef]
  15. Malinauskaite, J.; Jouhara, H.; Czajczyńska, D.; Stanchev, P.; Katsou, E.; Rostkowski, P.; Thorne, R.J.; Colón, J.; Ponsá, S.; Al-Mansour, F.; et al. Municipal solid waste management and waste-to-energy in the context of a circular economy and energy recycling in Europe. Energy 2017, 141, 2013–2044. [Google Scholar] [CrossRef]
  16. Marchioni, A.; Magni, C.A. Investment decisions and sensitivity analysis: NPV-consistency of rates of return. Eur. J. Oper. Res. 2018, 268, 361–371. [Google Scholar] [CrossRef] [Green Version]
  17. Mahdiyar, A.; Tabatabaee, S.; Sadeghifam, A.N.; Mohandes, S.R.; Abdullah, A.; Meynagh, M.M. Probabilistic private cost-benefit analysis for green roof installation: A Monte Carlo simulation approach. Urban For. Urban Green. 2016, 20, 317–327. [Google Scholar] [CrossRef]
  18. SendeCO2. Precios CO2—Sendeco2. Available online: https://www.sendeco2.com/es/precios-co2 (accessed on 10 December 2018).
  19. Souza, S.V.; Gimenes, R.M.T.; Binotto, E. Economic viability for deploying hydroponic system in emerging countries: A differentiated risk adjustment proposal. Land Use Policy 2019, 83, 357–369. [Google Scholar] [CrossRef]
  20. Zore, Ž.; Čuček, L.; Širovnik, D.; Novak Pintarič, Z.; Kravanja, Z. Maximizing the sustainability net present value of renewable energy supply networks. Chem. Energy Res. Des. 2018, 131, 245–265. [Google Scholar] [CrossRef] [Green Version]
  21. European Union. Guide to Cost-Benefit Analysis of Investment Projects, Economic Appraisal tool for Cohesion Policy 2014–2020; European Commission: Brussels. Beligum, 2014. [Google Scholar]
  22. Ćetković, J.; Lakić, S.; Knežević, M.; Bogdanović, P.; Žarković, M. Financial and socioeconomic analysis of waste management projects. Građevinar 2017, 11, 1007–1016. [Google Scholar] [CrossRef] [Green Version]
  23. Steffen, B. Estimating the cost of capital for renewable energy projects. Energy Econ. 2020, 88, 104783. [Google Scholar] [CrossRef]
  24. Bekchanov, M.; Mirzabaev, A. Circular economy of composting in Sri Lanka: Opportunities and challenges for reducing waste related pollution and improving soil health. J. Clean. Prod. 2018, 202, 1107–1191. [Google Scholar] [CrossRef]
  25. Lin, L.; Xu, F.; Ge, X.; Li, Y. Improving the sustainability of organic waste management practices in the food-energy-water nexus: A comparative review of anaerobic digestion and composting. Renew. Sustain. Energy Rev. 2018, 89, 151–167. [Google Scholar] [CrossRef]
  26. Rosa, M.D. Economic assessment of producing and selling biomethane into a regional market. Energy Environ. 2018, 31, 1–17. [Google Scholar] [CrossRef]
  27. Chan Gutiérrez, E.; Wall, D.M.; O’Shea, R.; Novelo, R.M.; Gómez, M.M.; Murphy, J.D. An economic and carbon analysis of biomethane production from food waste to be used as a transport fuel in Mexico. J. Clean. Prod. 2018, 196, 852–862. [Google Scholar] [CrossRef]
  28. Vo, T.T.Q.; Wall, D.M.; Ring, D.; Rajendran, K.; Murphy, J.D. Techno-economic analysis of biogas upgrading via amine scrubber, carbon capture and ex-situ methanation. Appl. Energy 2018, 212, 1191–1202. [Google Scholar] [CrossRef]
  29. Rasheed, R.; Khan, N.; Yasar, A.; Su, Y.; Tabinda, A.B. Design and cost-benefit analysis of a novel anaerobic industrial bioenergy plant in Pakistan. Renew. Energy 2016, 90, 242–247. [Google Scholar] [CrossRef]
  30. De Clercq, D.; Wen, Z.; Fei, F. Economic performance evaluation of bio-waste treatment technology at the facility level. Resour. Conserv. Recycl. 2017, 116, 178–184. [Google Scholar] [CrossRef]
  31. Mengistu, M.G.; Simane, B.; Eshete, G.; Workneh, T.S. The environmental benefits of domestic biogas technology in rural Ethiopia. Biomass Bioenergy 2016, 90, 131–138. [Google Scholar] [CrossRef]
  32. Masebinu, S.O.; Akinlabi, E.T.; Muzenda, E.; Aboyade, A.O.; Mbohwa, C. Experimental and feasibility assessment of biogas production by anaerobic digestion of fruit and vegetable waste from Joburg Market. Waste Manag. 2018, 75, 236–250. [Google Scholar] [CrossRef]
  33. Budzianowski, W.M.; Budzianowska, D.A. Economic analysis of biomethane and bioelectricity generation from biogas using different support schemes and plant configurations. Energy 2015, 88, 658–666. [Google Scholar] [CrossRef]
  34. Ulusoy, Y.; Ulukardesler, A.H.; Arslan, R.; Tekin, Y. Energy and emission benefits of chicken manure biogas production—A case study. Environ. Sci. Pollut. Res. 2018, 1–6. [Google Scholar] [CrossRef]
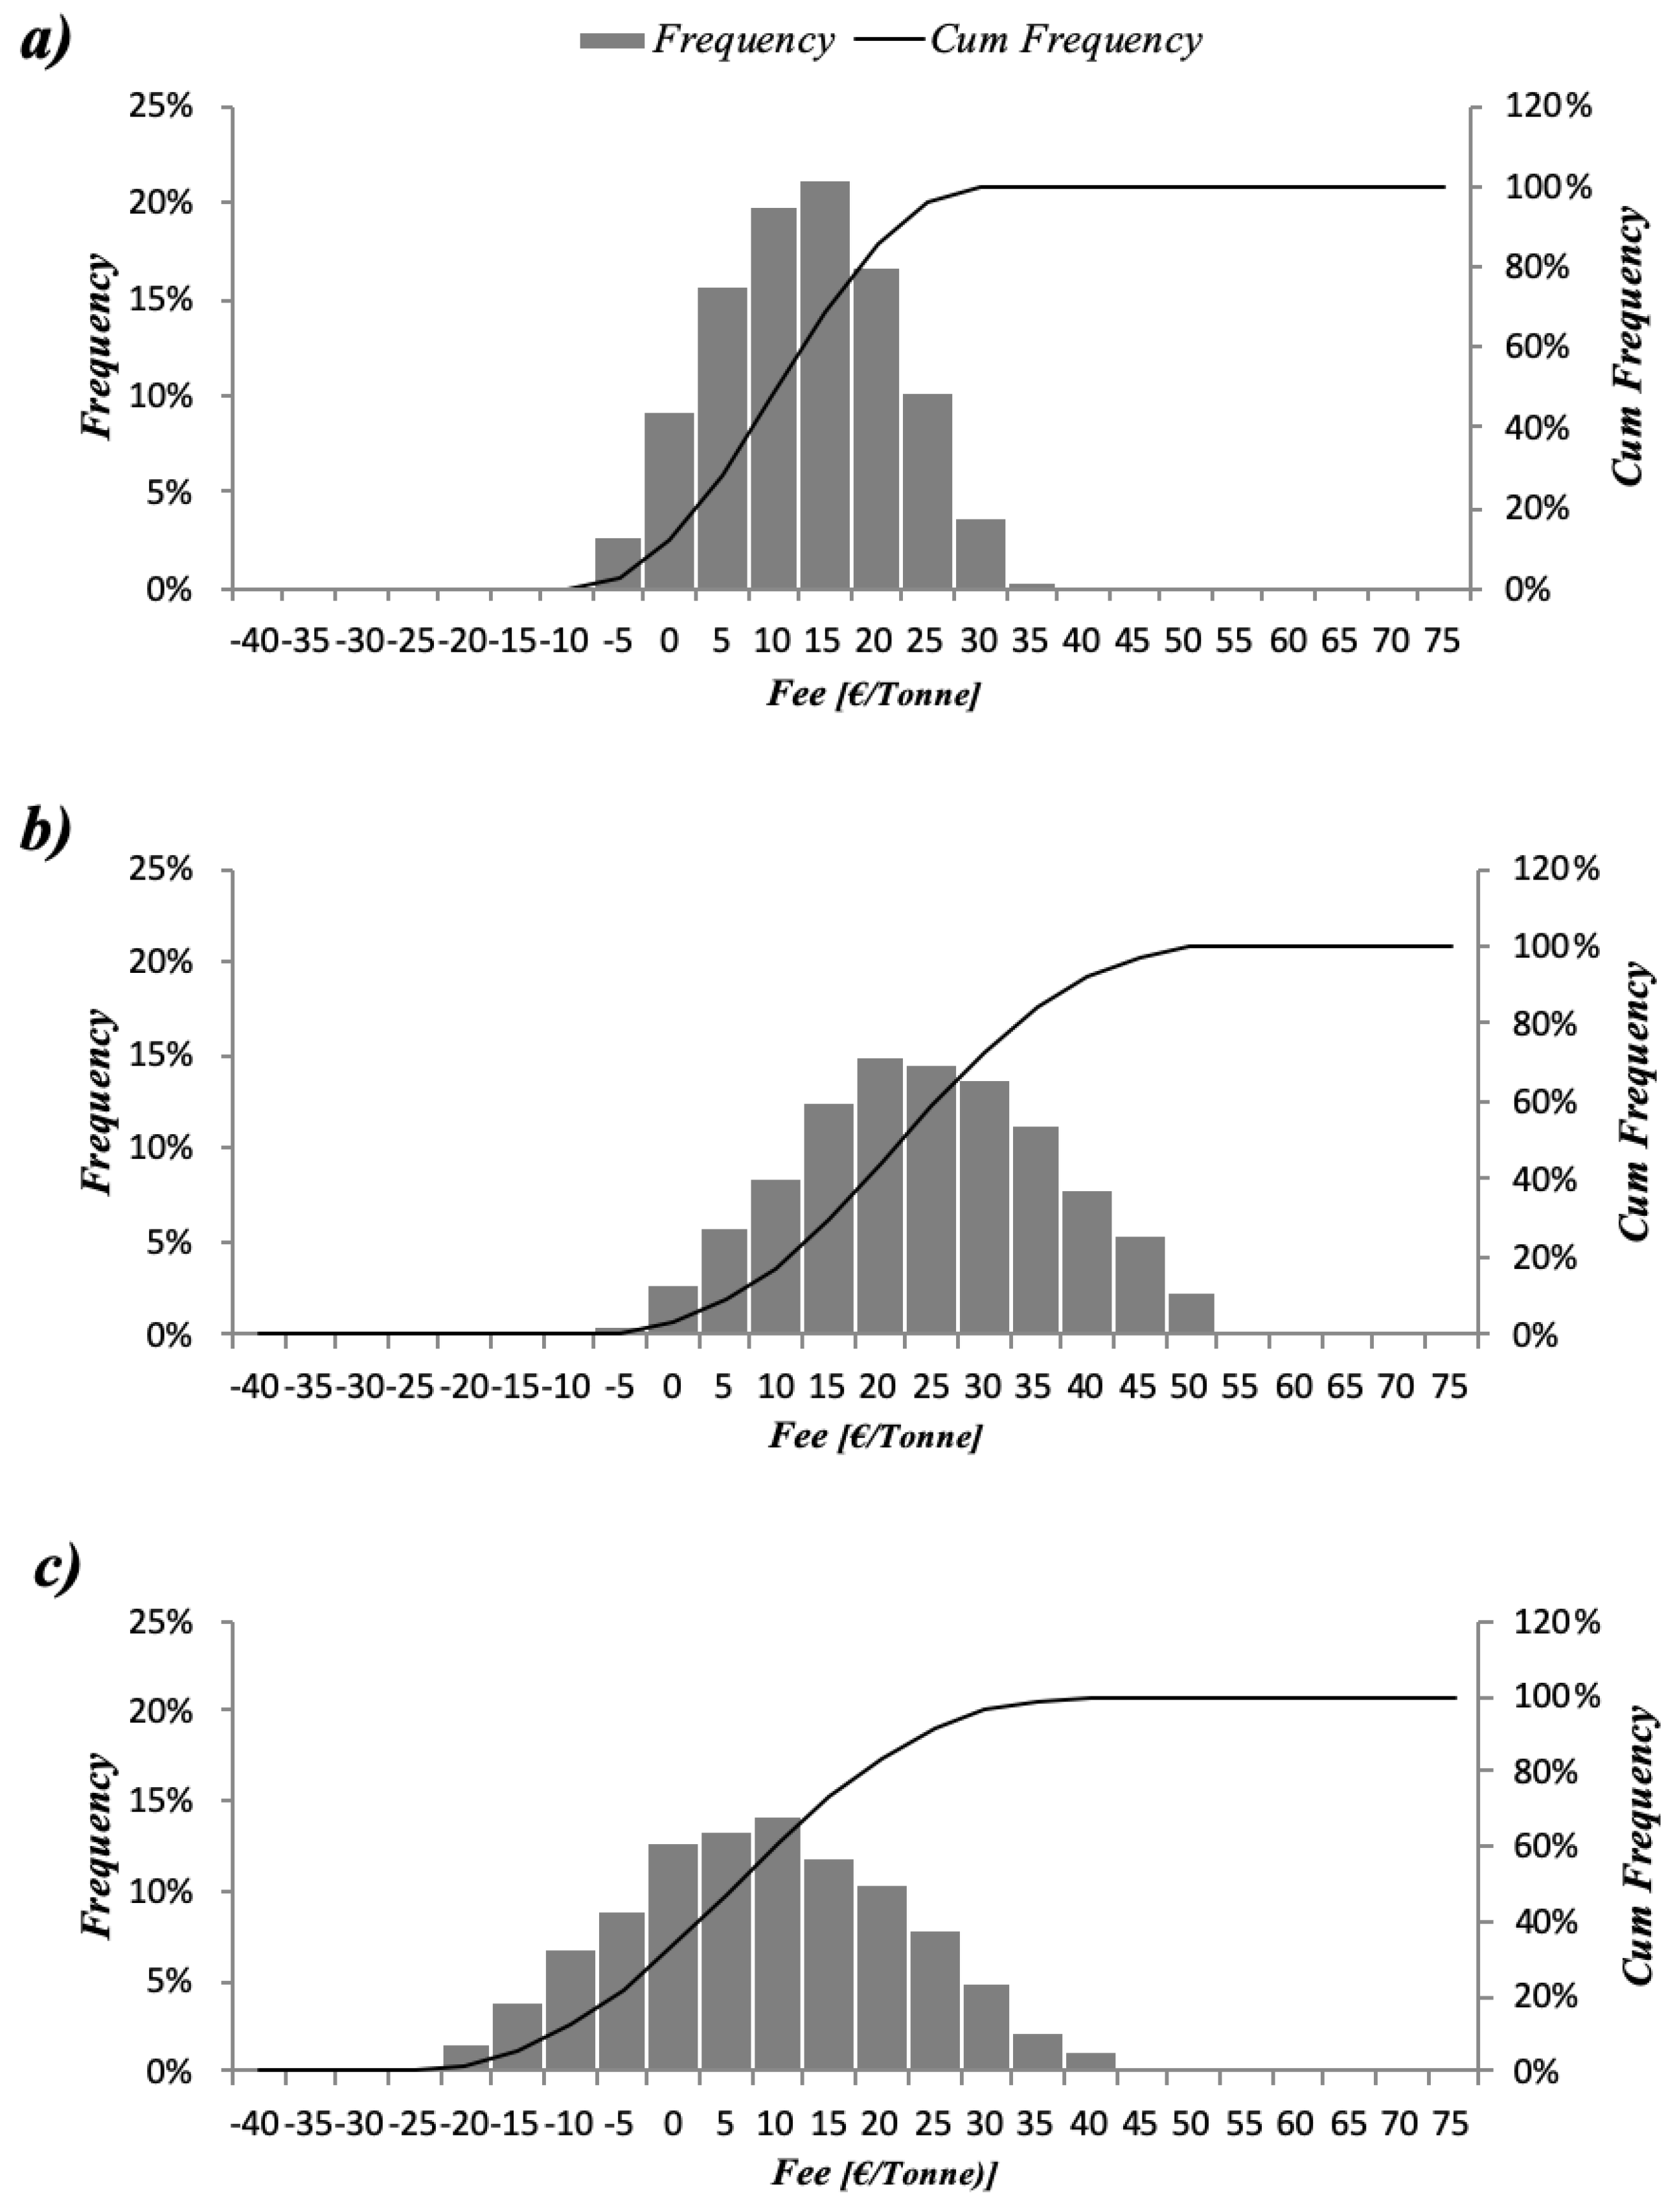
Figure 1. Fee density and distribution function. (a) Scenario 1, Composting; (b) Scenario 2, renewable electricity production; (c) Scenario 3, biomethane production.
Applsci 10 09028 g001
Figure 2. NPVs density and distribution function. (a) Scenario 2, renewable electricity production; (b) Scenario 3, biomethane production.
Applsci 10 09028 g002
Table 1. Cost and benefit item assessment per scenario tested.
ItemsScenario 1
(€/(tonne*Y))
min–MAX
Scenario 2
(€/(tonne*Y))
min–MAX
Scenario 3
(€/(tonne*Y))
min–MAX
Reference
CostInitial costs18.49–78.1550.62–243.5139.9–131.58[7,8,12,13,25,26,27,28]
Operation and maintenance costs13.33–25.939.23–14.437.56–35.53[7,8,12,13,24,27,28,29,30,31]
BenefitRevenue from compost5.60–29.91 XX[7,8,32]
Revenue from electricity energy salesX3.87–27.63X[13,29]
Revenue from biomethane salesXX13.57–47.16[27,28,30,31,32]
CO2 emissions avoided00.44–4.391.47–4.39[7,8,25,31,32,33,34]
Table 2. Fee and social net present value (NPVs) resulting from Monte Carlo simulation.
FEE (NPVf = 0)
(€/tonne)
Average (Min, Max)
NPVs
(€/tonne)
Average (Min, Max)
SCENARIO 110.49 (−11.43, 33.02)x
SCENARIO 222.09 (−8.64, 52.09)13.59 (2.49, 24.81)
SCENARIO 36.38 (−29.56, 42.54)16.60 (8.31, 24.81)
Publisher’s Note: MDPI stays neutral with regard to jurisdictional claims in published maps and institutional affiliations.