Article

Atmospheric Concentrations and Health Implications of PAHs, PCBs and PCDD/Fs in the Vicinity of a Heavily Industrialized Site in Greece

by
Konstantinos G. Koukoulakis
1,
Panagiotis George Kanellopoulos
1,
Eirini Chrysochou
1,
Danae Costopoulou
2,
Irene Vassiliadou
2,
Leondios Leondiadis
2 and
Evangelos Bakeas
1,*
1
Laboratory of Analytical Chemistry, Department of Chemistry, National and Kapodistrian University of Athens, Zografos, Panepistimiopolis, 15784 Athens, Greece
2
Mass Spectrometry and Dioxin Analysis Laboratory, INRASTES, NCSR “Demokritos”, Neapoleos 27, 15341 Athens, Greece
*
Author to whom correspondence should be addressed.
Appl. Sci. 2020, 10(24), 9023; https://doi.org/10.3390/app10249023
Submission received: 31 October 2020 / Revised: 10 December 2020 / Accepted: 15 December 2020 / Published: 17 December 2020
(This article belongs to the Special Issue Advances in Air Quality Monitoring and Assessment)

Abstract

:
Background: Thriassion Plain is considered the most industrialized area in Greece and thus a place where emissions of pollutants are expected to be elevated, leading to the degradation of air quality. Methods: Simultaneous determination of polycyclic aromatic hydrocarbons (PAHs), polychlorinated dibenzo-p-dioxins/dibenzofurans (PCDD/Fs), and polychlorinated biphenyls (PCBs) was performed in PM10 samples. SPSS statistical package was employed for statistical analysis and source apportionment purposes. Cancer risk was estimated from total persistent organic pollutants’ (POPs) dataset according to the available literature. Results: POPs concentrations in particulate matter were measured in similar levels compared to other studies in Greece and worldwide, with mean concentrations of ΣPAHs, ΣPCDD/Fs, dioxin like PCBs, and indicator PCBs being 7.07 ng m−3, 479 fg m−3, 1634 fg m−3, and 18.1 pg m−3, respectively. Seasonal variations were observed only for PAHS with higher concentrations during cold period. MDRs, D/F ratios, and principal component analysis (PCA) highlighted combustions as the main source of POPs’ emissions. Estimation of particles’ carcinogenic and mutagenic potential indicates the increased toxicity of PM10 during cold periods, and cancer risk assessment concludes that 3 to 4 people out of 100,000 may suffer from cancer due to POPs’ inhalation. Conclusions: Increased cancer risk for citizens leads to the necessity of chronic POPs’ monitoring in Thriassion Plain, and such strategies have to be a priority for Greek environmental authorities.

1. Introduction

Polycyclic aromatic hydrocarbons (PAHs), polychlorinated dibenzo-p-dioxins and dibenzofurans (PCDDs and PCDFs or PCDD/Fs), along with, polychlorinated biphenyls (PCBs), both dioxin like (dlPCBs) and non-dioxin like (ndlPCBs), are ubiquitous semi volatile persistent organic pollutants (POPs) that can be found far from their emission sources through long range transport of air masses either as gas molecules or bounded to particulate matter [1,2,3]. POPs are also characterized as low soluble compounds that tend to bioaccumulate and biomagnify in biota [4], and due to their potential health implications and especially their mutagenic, teratogenic, and carcinogenic effects, they have attracted global research attention [5,6,7,8].
PAHs constitute byproducts of incomplete fossil fuel combustion or biomass burning [9], and they could also be emitted by solid waste incineration [10] and aluminum production, and they can be found in crude oil, asphalt coal, and tar [11]. The most dominant routes of human exposure to PAHs are via ingestion and inhalation [12,13,14]. On the other hand, PCDD/Fs are not produced intentionally, besides using them for research scope, but they are unintentionally formed as by-products of chlorinated compounds in combustion and industrial thermal processes like waste incineration, ferrous and secondary nonferrous smelting, cement kilning, and also from fuel combustion, pulp production, chlorinated substances production, and chemical and petrochemical industries [4,15,16,17,18,19,20]. PCBs have similar emission sources as PCDD/Fs, and they were used in transformer, paint, and capacitor production. Although PCBs have been phased out from production processes in most countries in the last decades, many studies investigate PCB contaminants in air, especially in industrialized sites [2,16,20,21]. PCBs are divided into dlPCBs, due to their similar metabolism in humans with dioxins [22] and to non-dioxin like PCBs (ndlPCBs), of which six congeners have often been chosen as indicators PCBs (indPCBs) for the evaluation of ndlPCBs’ contamination in the atmosphere [23]. Due to their presence in many commercial PCB mixtures [24], their predominance in air samples from industrial sites is an indication of their impact on the atmospheric environment.
There is a general acceptance that either long- or short-term exposure to POPs may lead to adverse health effects [25,26,27]. Therefore, many monitoring programs have been undertaken by developed countries’ authorities under the prism of the Stockholm Convention for the cooperation among nations to eliminate unintentionally emitted POPs including PCDDs/Fs and dlPCBs. Intense POPs research provides evidence that some compounds (e.g., PAHs, PCDDs/Fs, and dlPCBs) exert intense carcinogenic, mutagenic, or teratogenic effects on humans, and therefore IARC [28,29] and the United States Environmental Protection Agency [12] have classified them as probable human carcinogens. PCBs have also been included in IARC’s latest report as substances with carcinogenic impacts on humans due to their relation with melanoma cancer [30].
In this study, the most heavily industrialized area of Greece has been selected for the simultaneous monitoring of PAHs, PCDD/Fs, dlPCBs, and indPCBs bonded to particulate matter (PM10) and for the estimation of their health risks for nearby citizens. Although some toxic PCDDF/s and PCBs were found to be particularly in gas phase [31,32], according to several other works, PCDD/Fs participated majorly in particulate form, especially the congeners with increased chlorine atoms (penta, hexa, hepta, and octa compounds) [33,34]. According to the study by Lee and Jones (1999) [33] about the partitioning behavior of PCDD/Fs in gas and particulate phase, PCDDs tended to be more associated with atmospheric particulates than the equivalent PCDF homologue groups, probably reflecting the slightly lower vapor pressures of PCDDs. Our choice to study these POPs simultaneously in PM10 was made to find out the levels of POPs in samples already legislated and monitored for other pollutants. To our knowledge, this is the first study in this direction in Greece, and one of the few globally, and thus it may be helpful for the development and implementation of strategies for the regulation of emissions in this site, only a few kilometers east, southeast from the Greek capital, Athens.

2. Materials and Methods

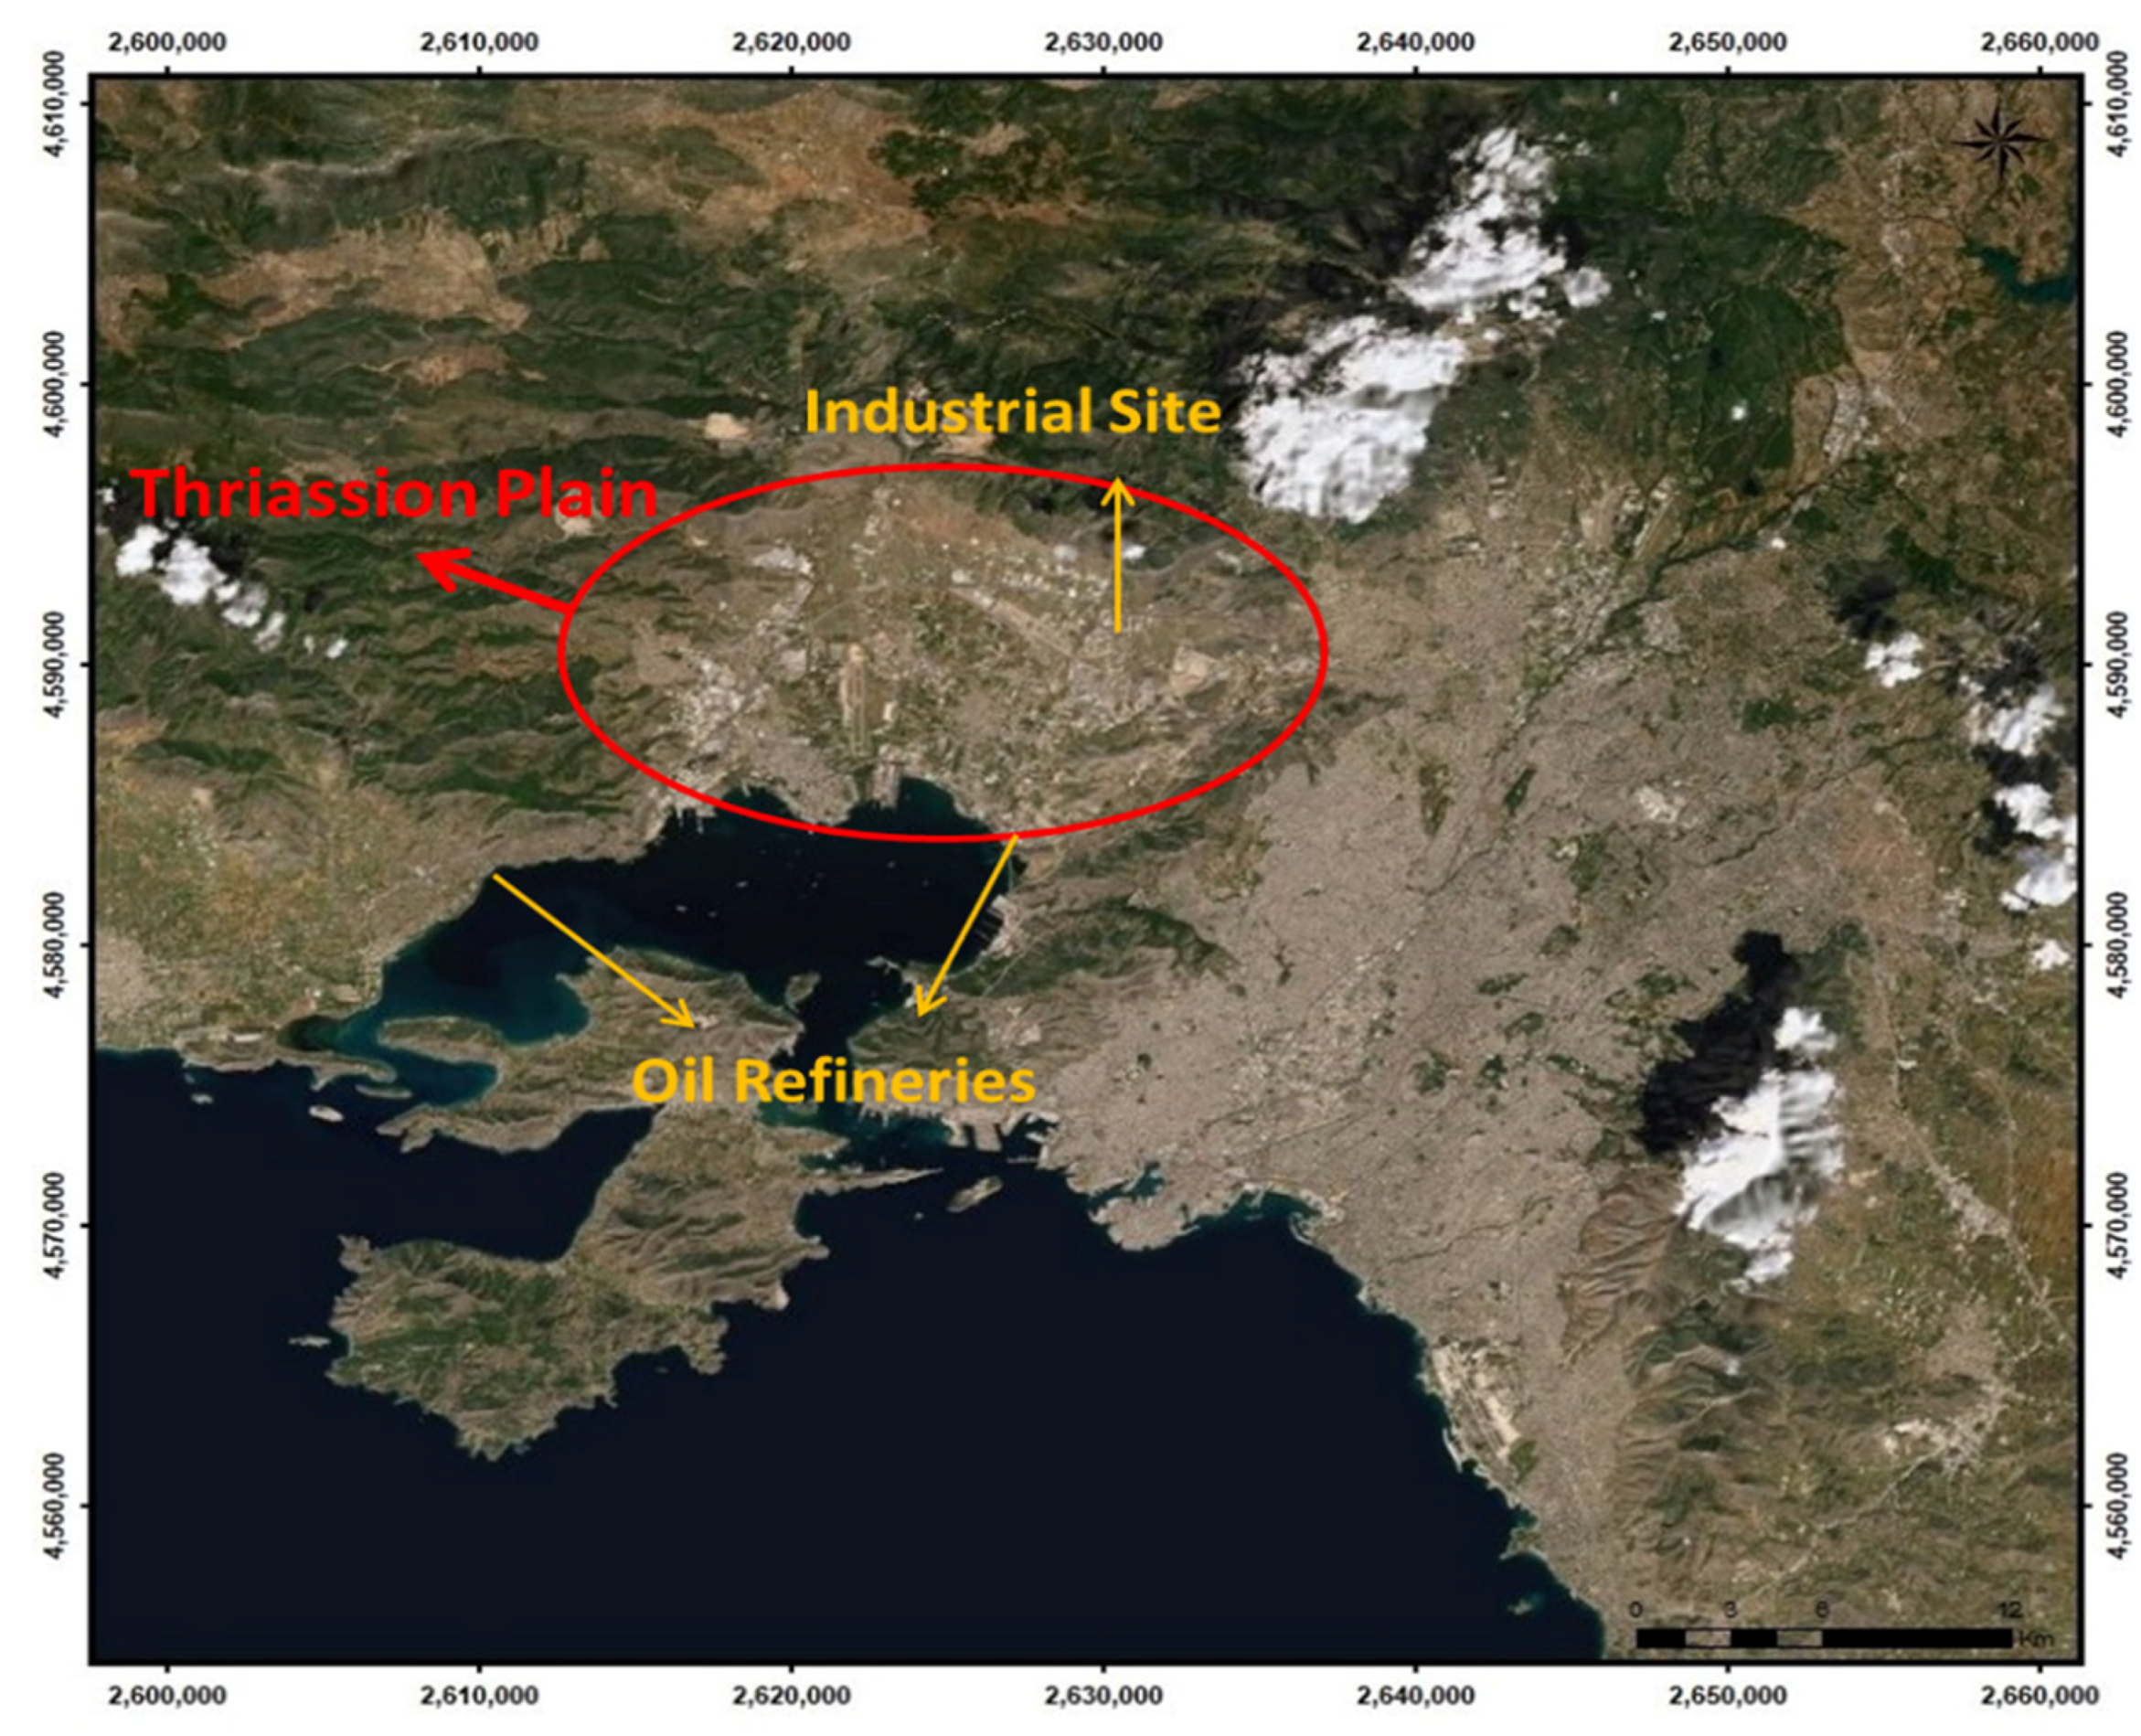
2.1. Site Description and Sampling Procedure

The sampling campaign was performed in the industrial city of Eleusis located at central Greece, with a population reaching approximately 25,000 people according to a 2011 census. Eleusis is in the heart of Thriassion Plain, the largest industrial area in Greece, approximately 18 km northwest from the center of Athens (the capital of Greece) (Figure 1). It is the place where the majority of crude oil in Greece is imported and refined. Within this area, the largest crude oil refineries are located, and over 300 industrial plants, referring to metallurgical processes, cement, chemical and food production plants, shipyards, etc., are situated. A recently imposed environmental pressure on the surrounding area is the illegal uncontrolled combustions that take place in the neighboring industrial site of Aspropirgos for the recovery of raw materials by burning tires, electronics, plastics, etc. [35,36].
The sampling point was located in the center of Eleusis at a height of 4 m from the ground. A medium volume sampler (MVS) equipped with a PM10 cutoff inlet was used to collect particulate phase on Quartz fiber filters with a diameter of 47 mm, at a flow rate of 2.3 m3 h−1 for 24 h. The sampling procedure was performed according to EN12341. Filter blanks were included in each sampling campaign, and if necessary, appropriate corrections of the results were performed. The sampling duration was from December 2018 to July 2019, and 30 samples were collected in total. The sampling procedure was apportioned in order to study possible seasonal variations, and fifteen samples were collected during a cold period (December 2018 to February 2019) and another fifteen during a warm period (May 2019 to July 2019).

2.2. Materials

A PAH-determination procedure was validated using the Polynuclear Aromatic Hydrocarbons Mix, a standard solution of the compounds studied including naphthalene (NAP), acenaphthylene (ACY), acenaphthene (ACE), fluorene (FL), phenanthrene (PHE), anthracene (ANT), fluoranthene (FLT), pyrene (PYR), chrysene (CHR), benzo[a]anthracene (BaA), benzo[b,k]fluoranthenes (BbkF), benzo[a]pyrene (BaP), indeno[1,2,3 cd]pyrene (IPY), dibenzo[a,h]anthracene (DBaA), and benzo[ghi]perylene (BPE), and purchased by Sigma Aldrich. A mix of phenanthrene D10 and perylene D12 (Supelco) was also prepared for quantitation and quantification of PAHs, and all solvents were appropriate for residue analysis purchased from Carlo Erba and Macron Fine Chemicals. For the PCDD/Fs and PCBs analysis, all solvents used were residue analysis picograde, and were purchased from Promochem. Activated carbon FU 4652 was purchased from Schunk Kohlenstofftechnik GmbH. Basic Alumina for dioxin analysis was purchased from MP Biochemicals GmbH and silica gel 60–200 mesh from Merck. The internal standards used were 13 C-labelled solutions of PCDD/Fs and PCBs in toluene, and were added to each sample prior to extraction. They contained a mixture of 13 C12 isomers of all the 17 PCDD/F congeners except OCDF, the four 13C12 non-ortho PCBs, the eight 13C12 mono ortho PCBs, and the six 13C12 indicator PCBs. The isomers for the preparation of the 13C12 internal standard solutions, the injection standards 13C12 1,2,3,4-TCDD, and 13C12 PCB-80 were purchased from Wellington Laboratories.

2.3. Sample Extraction and Clean Up

After sampling, the filter was cut in two symmetrical halves. The first half was used for PAHs analysis, while the second half was used for the determination of PCDD/Fs. The procedure, carried out for PAHs analysis, was fully described in our previous study [36]. In general, the filters were spiked with the mix of internal standards (phenanthrene D10 and perylene D12), and then were extracted with dichloromethane in an ultrasonic bath (Ultrasonic LC 130H, Elma, Germany). The extraction procedure was performed in triplicate. The obtained extracts were combined and concentrated in volume using a rotary evaporator (Rotavapor R-210, Buchi, Switzerland) at 28 °C nearly to 2–3 mL. Then, a solvent change step was performed with the addition of hexane. Subsequently a purification step was followed. A 30 cm × 1 cm i.d. glass column chromatography was used. The column was packed with anhydrous sodium sulphate and silica gel, and was activated with hexane before the sample was placed on the top of the column. The clean-up was performed using initially hexane and then a mixture of CH2Cl2: n-hexane 3:2. This eluted fraction was collected and finally evaporated under a flow of nitrogen.
The analysis of PCDD/Fs and PCBs was performed according to EPA T0-9A protocol. Quartz filters were extracted overnight with toluene in a soxhlet apparatus. Prior to extraction, samples were spiked with 0.1 ng 13C12 labeled PCDD/Fs and non-ortho PCBs (n.o.-PCBs), and 1.0 ng mono-ortho PCBs (m.o.-PCBs) and indPCBs as quantitative standards. The extract was subjected to clean-up. Active carbon Carbosphere or FU4652 was used for the separation of PCDD/Fs and n.o.-PCBs, in two different fractions, with toluene as elution solvent. Further clean-up of fractions was performed by column chromatography with basic alumina and 44% H2SO4-silicagel eluted with different mixtures of hexane:dicloromethane. After evaporation, the eluate containing the PCDD/Fs was re-dissolved in n-nonane containing 2 ng mL−1 of injection standard 13C12 1,2,3,4-TCDD, while that containing the n.o. PCBs was re-dissolved in n-nonane containing 2 ng mL−1 13C12 PCB80. For mono-ortho and indicator PCBs, 10% of the fraction obtained from Soxhlet extraction was dissolved in hexane and brought onto a column chromatography filled with 10 g of 44% H2SO4-silica. Further clean-up was performed by column chromatography with basic alumina and 44% H2SO4-silica and elution with hexane:dicloromethane. The eluate was evaporated to dryness and re-dissolved in n-nonane containing 20 ng mL−1 of injection standard (13C12 PCB 80). A detailed description of the whole clean-up procedure has been given elsewhere [7].

2.4. Instrumental Analysis and Quality Assurance

A GC/MS (6890N/5975B, Agilent Technologies, Santa Clara, CA 95051, USA) was employed for PAHs determination. The GC instrument was equipped with a split/splitless injector and a HP-5ms [5%-(phenyl)-methylpolysiloxane] (Agilent J&W GC Columns, Agilent Technologies, Santa Clara, CA, USA) capillary column. High purity Helium was the carrier gas with a velocity of 1.5 mL min−1. A pulsed splitless mode was used for the injection, and the injector’s temperature was set at 280 °C. The GC oven temperature program was: 65 °C (hold for 1 min) to 320 °C at 15 °C min with a final isothermal hold for 3 min. Inlet and MS source temperatures were 280 °C and 230 °C, respectively. Selected ion monitoring (SIM) mode was used for the quantification of the analytes. Detection limits (DLs) of the studied PAHs ranged from 0.0002 (ANT and DBA) to 0.002 (FLT and PYR) ng m−3. Recoveries varied from 82% (FL) to 117% (CHR) calculated from spiked filters determination.
The quantification of PCDD/Fs and PCBs was performed by High Resolution Gas Chromatography–High Resolution Mass Spectrometry (Electron-Impact) (HRGC-HRMS, EI), on Multiple Ion Detection (MID) mode, on a Trace 1310 gas chromatograph (ThermoScientific, Waltham, MA 02451, USA) equipped with an Agilent DB-5MS GC column, 60 m length, 0.25 mm I.D., 0.10 μm film, a TriPlus RSH autosampler, coupled to a DFS mass spectrometer (ThermoScientific, Waltham, MA, USA) performing at 10,000 resolving power (10% valley definition). Instrumental conditions and quality control criteria are according to US EPA Method 1613 and European Standard EN 1948. The quantification was carried out by the isotopic dilution method. According to the European guidance, in the field of PCDD/Fs and PCBs analysis, results are calculated as sum-parameters based on concentrations and on limits of quantitation (LOQs) only, while limits of detection (LODs) do not carry any relevant information, and due to high precision in measurement, are considered equal to LOQs. The limit of quantitation (LOQ) for each congener was determined as the concentration in the extract which produced an instrumental response at two different ions to be monitored with a signal to noise ratio of 3:1 for the less sensitive signal. LOQ values were 0.1 (PCDD/Fs and n.o.-PCBs) and 2 (m.o.-PCBs) pg/sample. LOQs were evaluated during accreditation of the method using different reference materials and the respective higher LOQ value is used for each group of congeners for all samples. These values are low enough to ensure that the difference between the upper-bound level and lower-bound level does not exceed 20%. Recovery rates of 70–120% were also calculated by spiked filters analysis.

2.5. Statistical Analysis

Statistical analysis was performed using SPSS software package (IBM SPSS statistics version 24). This statistical software package was suitable for multivariate analysis of the environmental data [16,35,36,37,38,39]. Shapiro-Wilk and Kolmogorov–Smirnov tests used to study whether the data followed normal distribution with a value of p > 0.05 indicated normal distribution. As no variable of the dataset was normally distributed, the Mann–Whitney test for 2 independents was employed to carry out if there was a statistically significant difference. A value of p < 0.05 (95% confidence level) was considered to indicate a significant difference in the statistical analysis of the data. Principal Component Analysis (PCA) was used for the investigation of any possible associations and source apportionment among PAHs, PCDD/Fs, and PCBs. PCA consists of eigenvalue decomposition of the covariance matrix of Gaussian distributed random variables. However, in environmental studies, PCA is used as a tool for data compression, dimension reduction, or even filtering method for non-Gaussian (non-normal) distributed and/or nonlinear data. Application of PCA for source apportionment purposes has been performed in many POPs’ studies [16,23,39].

2.6. Health Risk Estimation

BaPE is the first parameter to estimate carcinogenicity of total PAHs. BaPE values above 1.0 ng m−3 represent an increased cancer risk. BaPE is calculated according to Equation (1):
BaPE   =   ( [ BaA ] 0.06 )   +   ( [ BbF ] 0.07 )   +   ( [ BkF ] 0.07 )   +   ( [ BaP ] 1 )   +   ( [ DBA ] 0.6 )  
Total carcinogenic and mutagenic potential of particulate bound PAHs, ΣBaPTEQ and ΣBaPMEQ, were calculated as described elsewhere [40,41,42], using Equations (2) and (3):
Σ BaPTEQ   = Σ { ( [ BaA ] 0.1 ) +   ( [ CHR ] 0.01 ) +   ( [ BbF ] 0.1 ) +   ( [ BkF ] 0.1 ) +   ( [ BaP ] 1 ) +   ( [ IPY ] 0.1 ) +   ( [ DBA ] 5 ) +   ( [ BPE ] 0.01 ) }
Σ BaPMEQ   = Σ { ( [ BaA ] 0.082 ) +   ( [ CHR ] 0.017 ) +   ( [ BbF ] 0.25 ) +   ( [ BkF ] 0.11 ) +   ( [ BaP ] 1 ) +   ( [ IPY ] 0.31 ) +   ( [ DBA ] 0.29 ) +   ( [ BPE ] 0.19 ) }  
The relation between exposure and cancer risk is considered linear in low doses, and thus inhalation cancer risk associated to PAHs could be calculated from ΣBAPTEQ using the inhalation unit risk (IURBaP= 1.1 × 10⁻³ (μg m−3)−1 [43] for BaP and according to the following equation (Equation (4)):
ICR =   Σ BaPTEQ   IURBaP
In general, exposure to toxic substances in the ambient air depends on the chronic daily intake (CDI) of each pollutant emitted by the source. CDI (mg/kg/day) could be calculated as Life Averaged Daily Dose (LADD) using Equation (5) [43,44,45]:
CDI = Cair   I F  
where Cair is concentration of pollutant (mg m−3), and IF is Intake Factor (mg3/kg/day) derived from Equation (6):
I F = I R E F E D E T B W A T
where according to EPA (1998) Inhalation Rate (IR) = 20 m3/day; Exposure Frequency (EF) = 365 days; Exposure Duration (ED) = 70 years; Exposure Time (ET) = 24 h/day; Body Weight (BW) = 70 kg; and Average Time (AT) = 35,500 days for exposure to carcinogenic pollutants. Cancer risk of the specific substances like POPs is calculated using Equation (7):
Cancer   Risk =   LADD     S F
where Slope Factor (SF) (mg/kg·day)−1 values were calculated by Equation (8):
S F = IUR   m 3 μ g 1   ×   70   kg   ×   103   μ g   mg 1 20   m 3   day 1
Inhalation Unit Risk values used for the estimation of Cancer Risk by each PCDD/Fs, PCBs, and PAHs were obtained from OEHHA [46]. Cancer risk values in our study were compared to upper-bound cancer risk of 1 × 10⁻⁶ (one person per million could develop cancer from the inhalation of this pollutant). Cancer risk values over this benchmark level are considered significant, and risks over 1 × 10⁻⁴ are unacceptable by EPA (2012). Finally, a total risk related to the sampling site was calculated, summarizing the risk from each pollutant.

3. Results and Discussion

3.1. Results

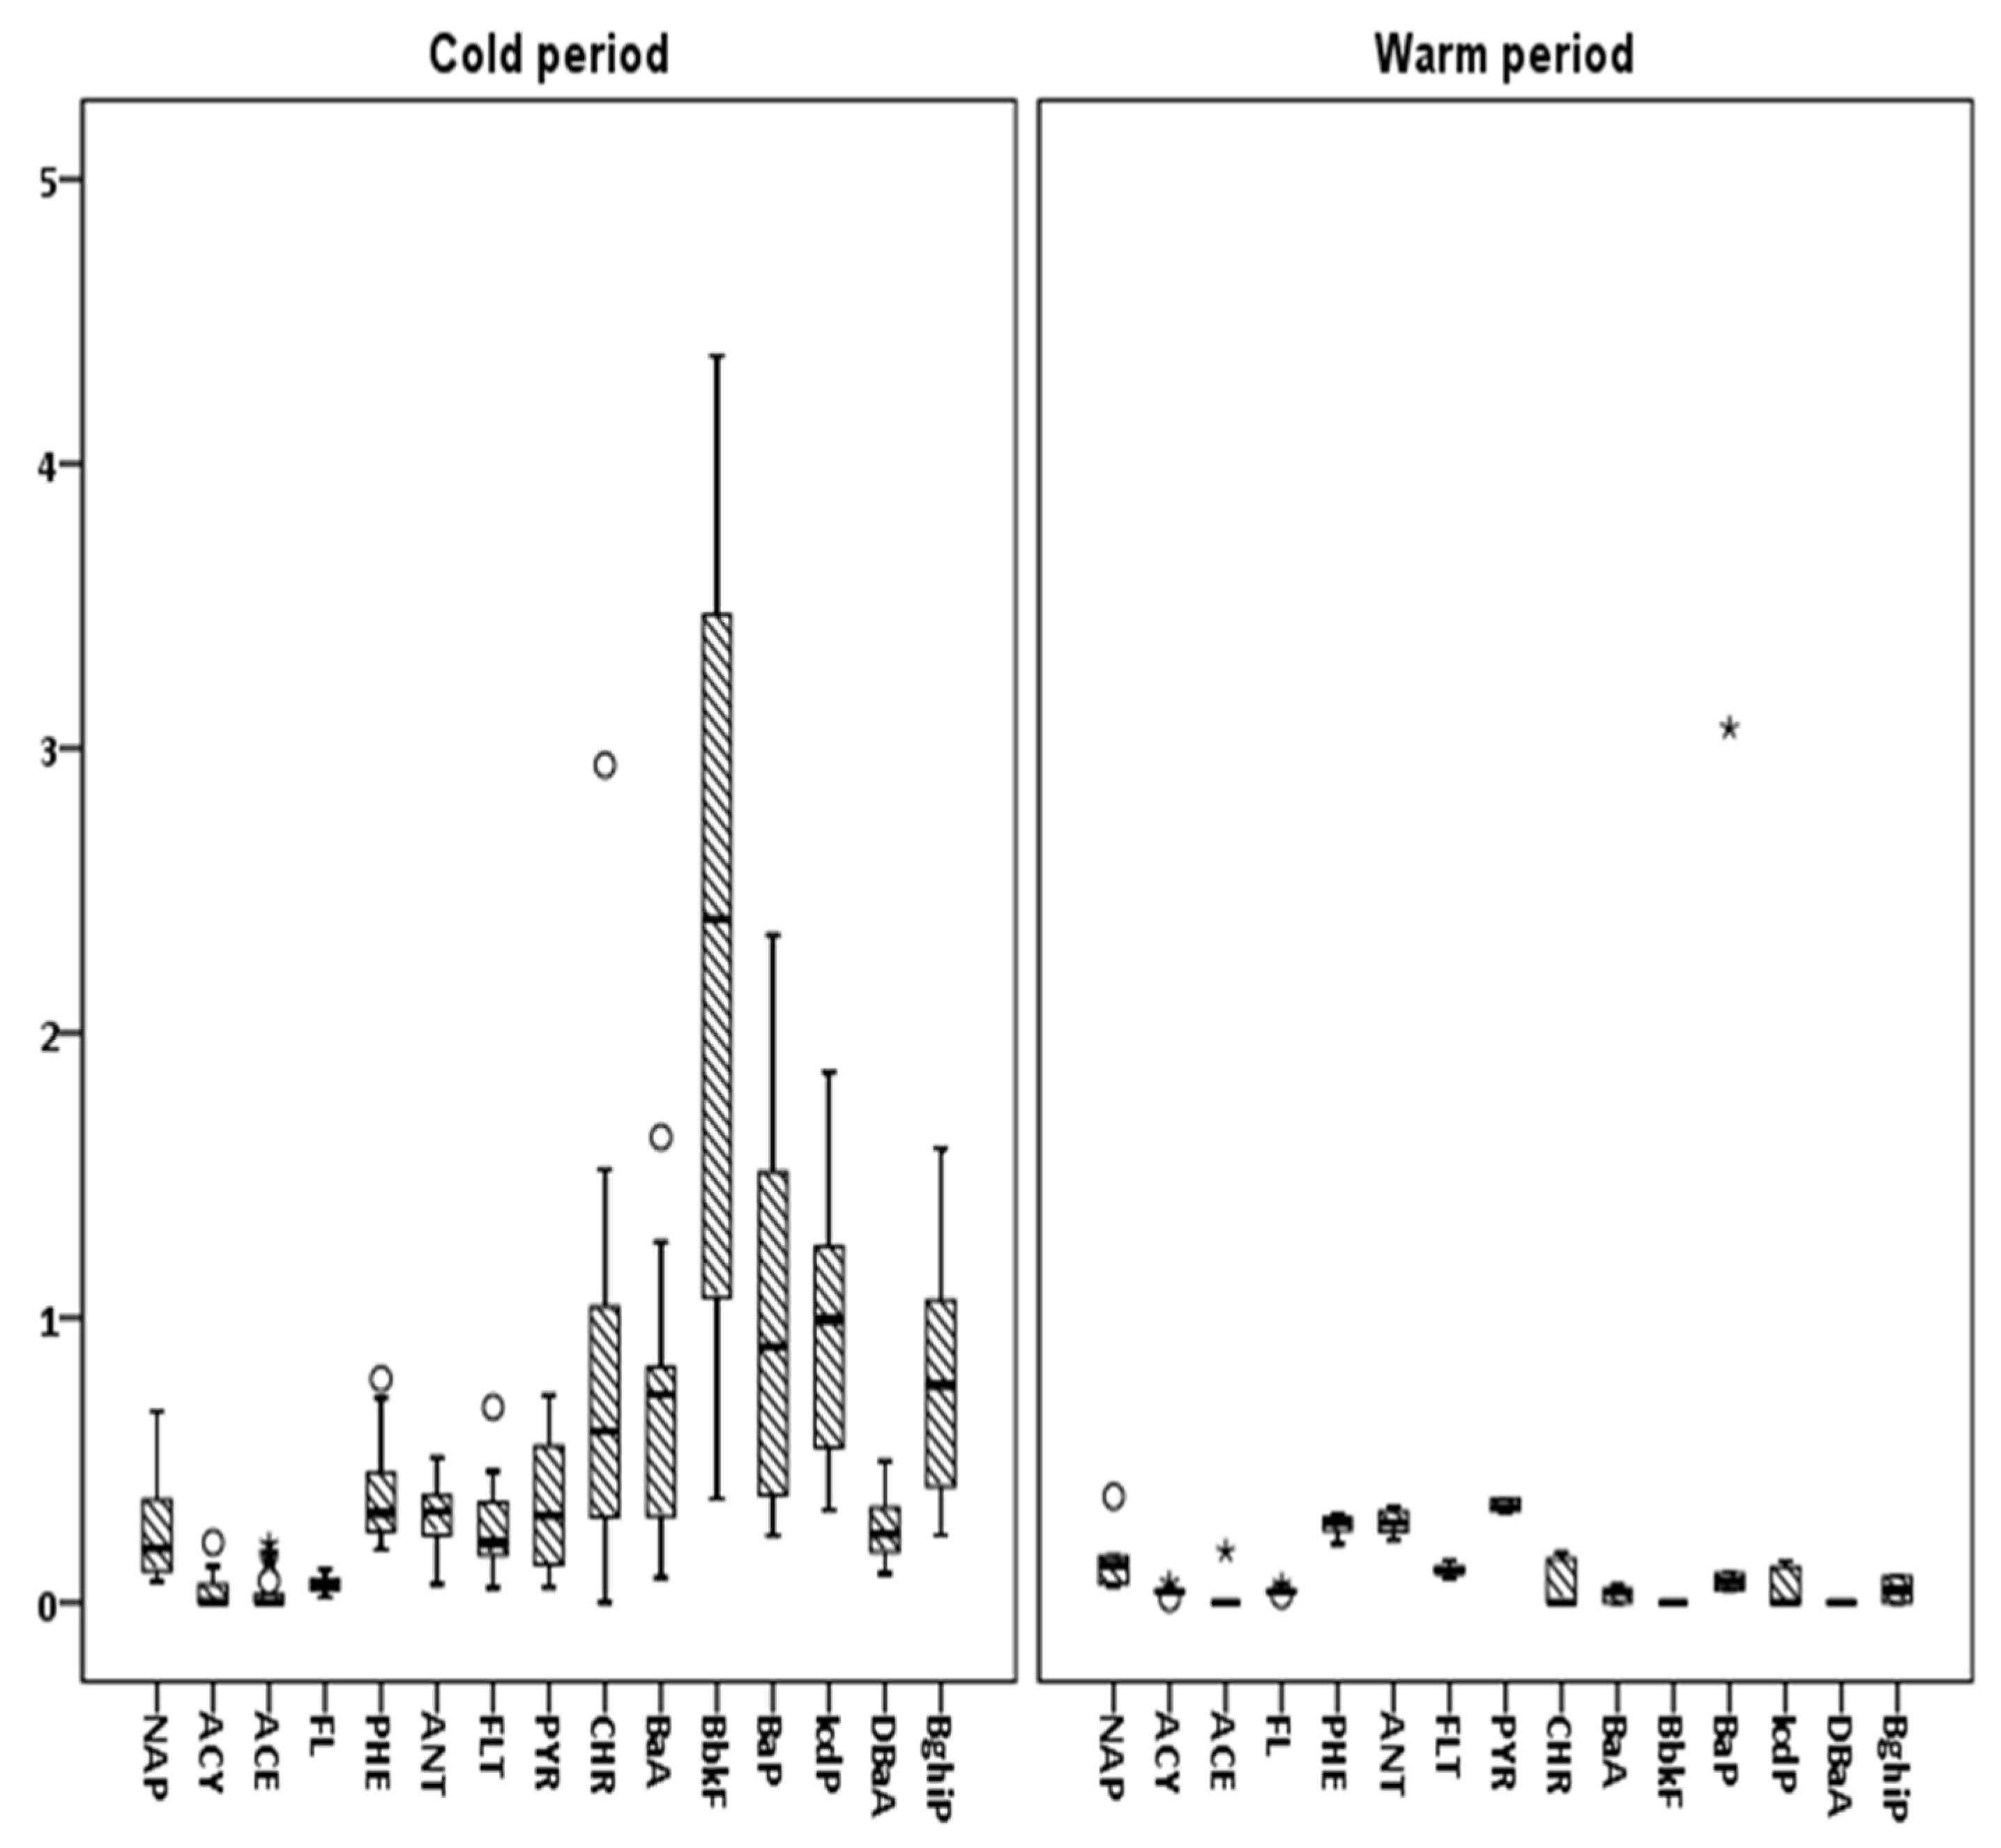
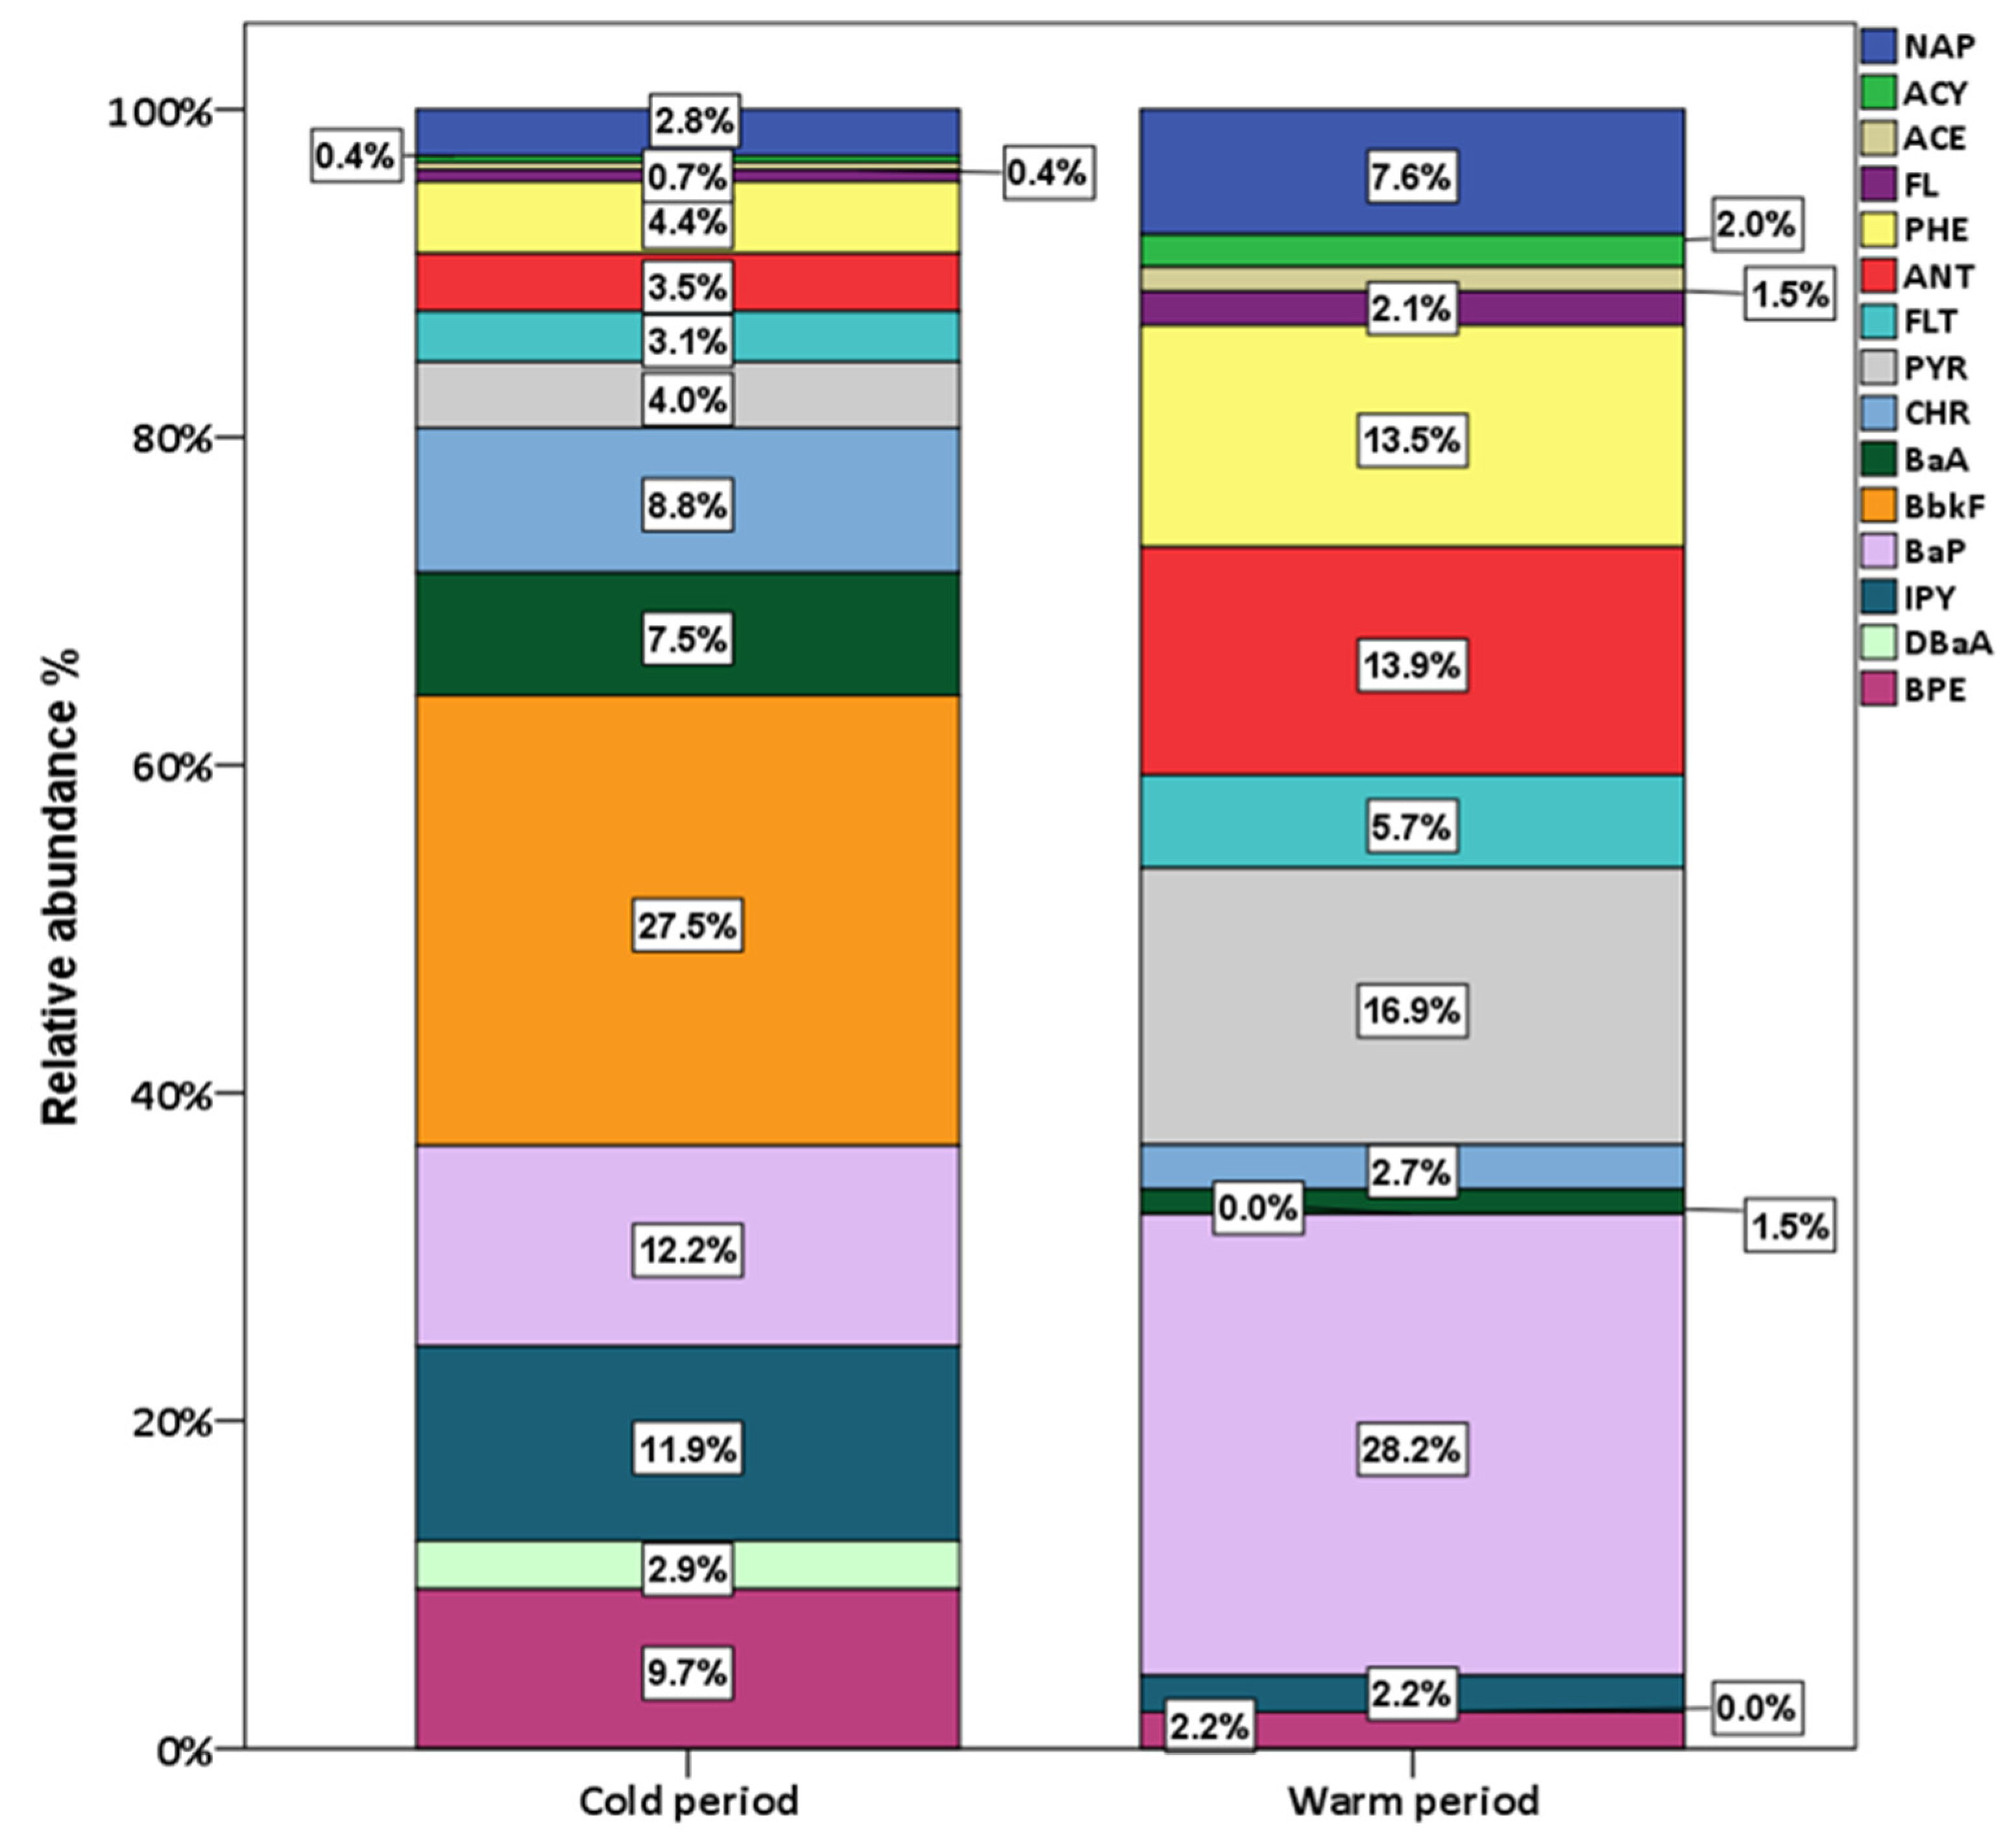
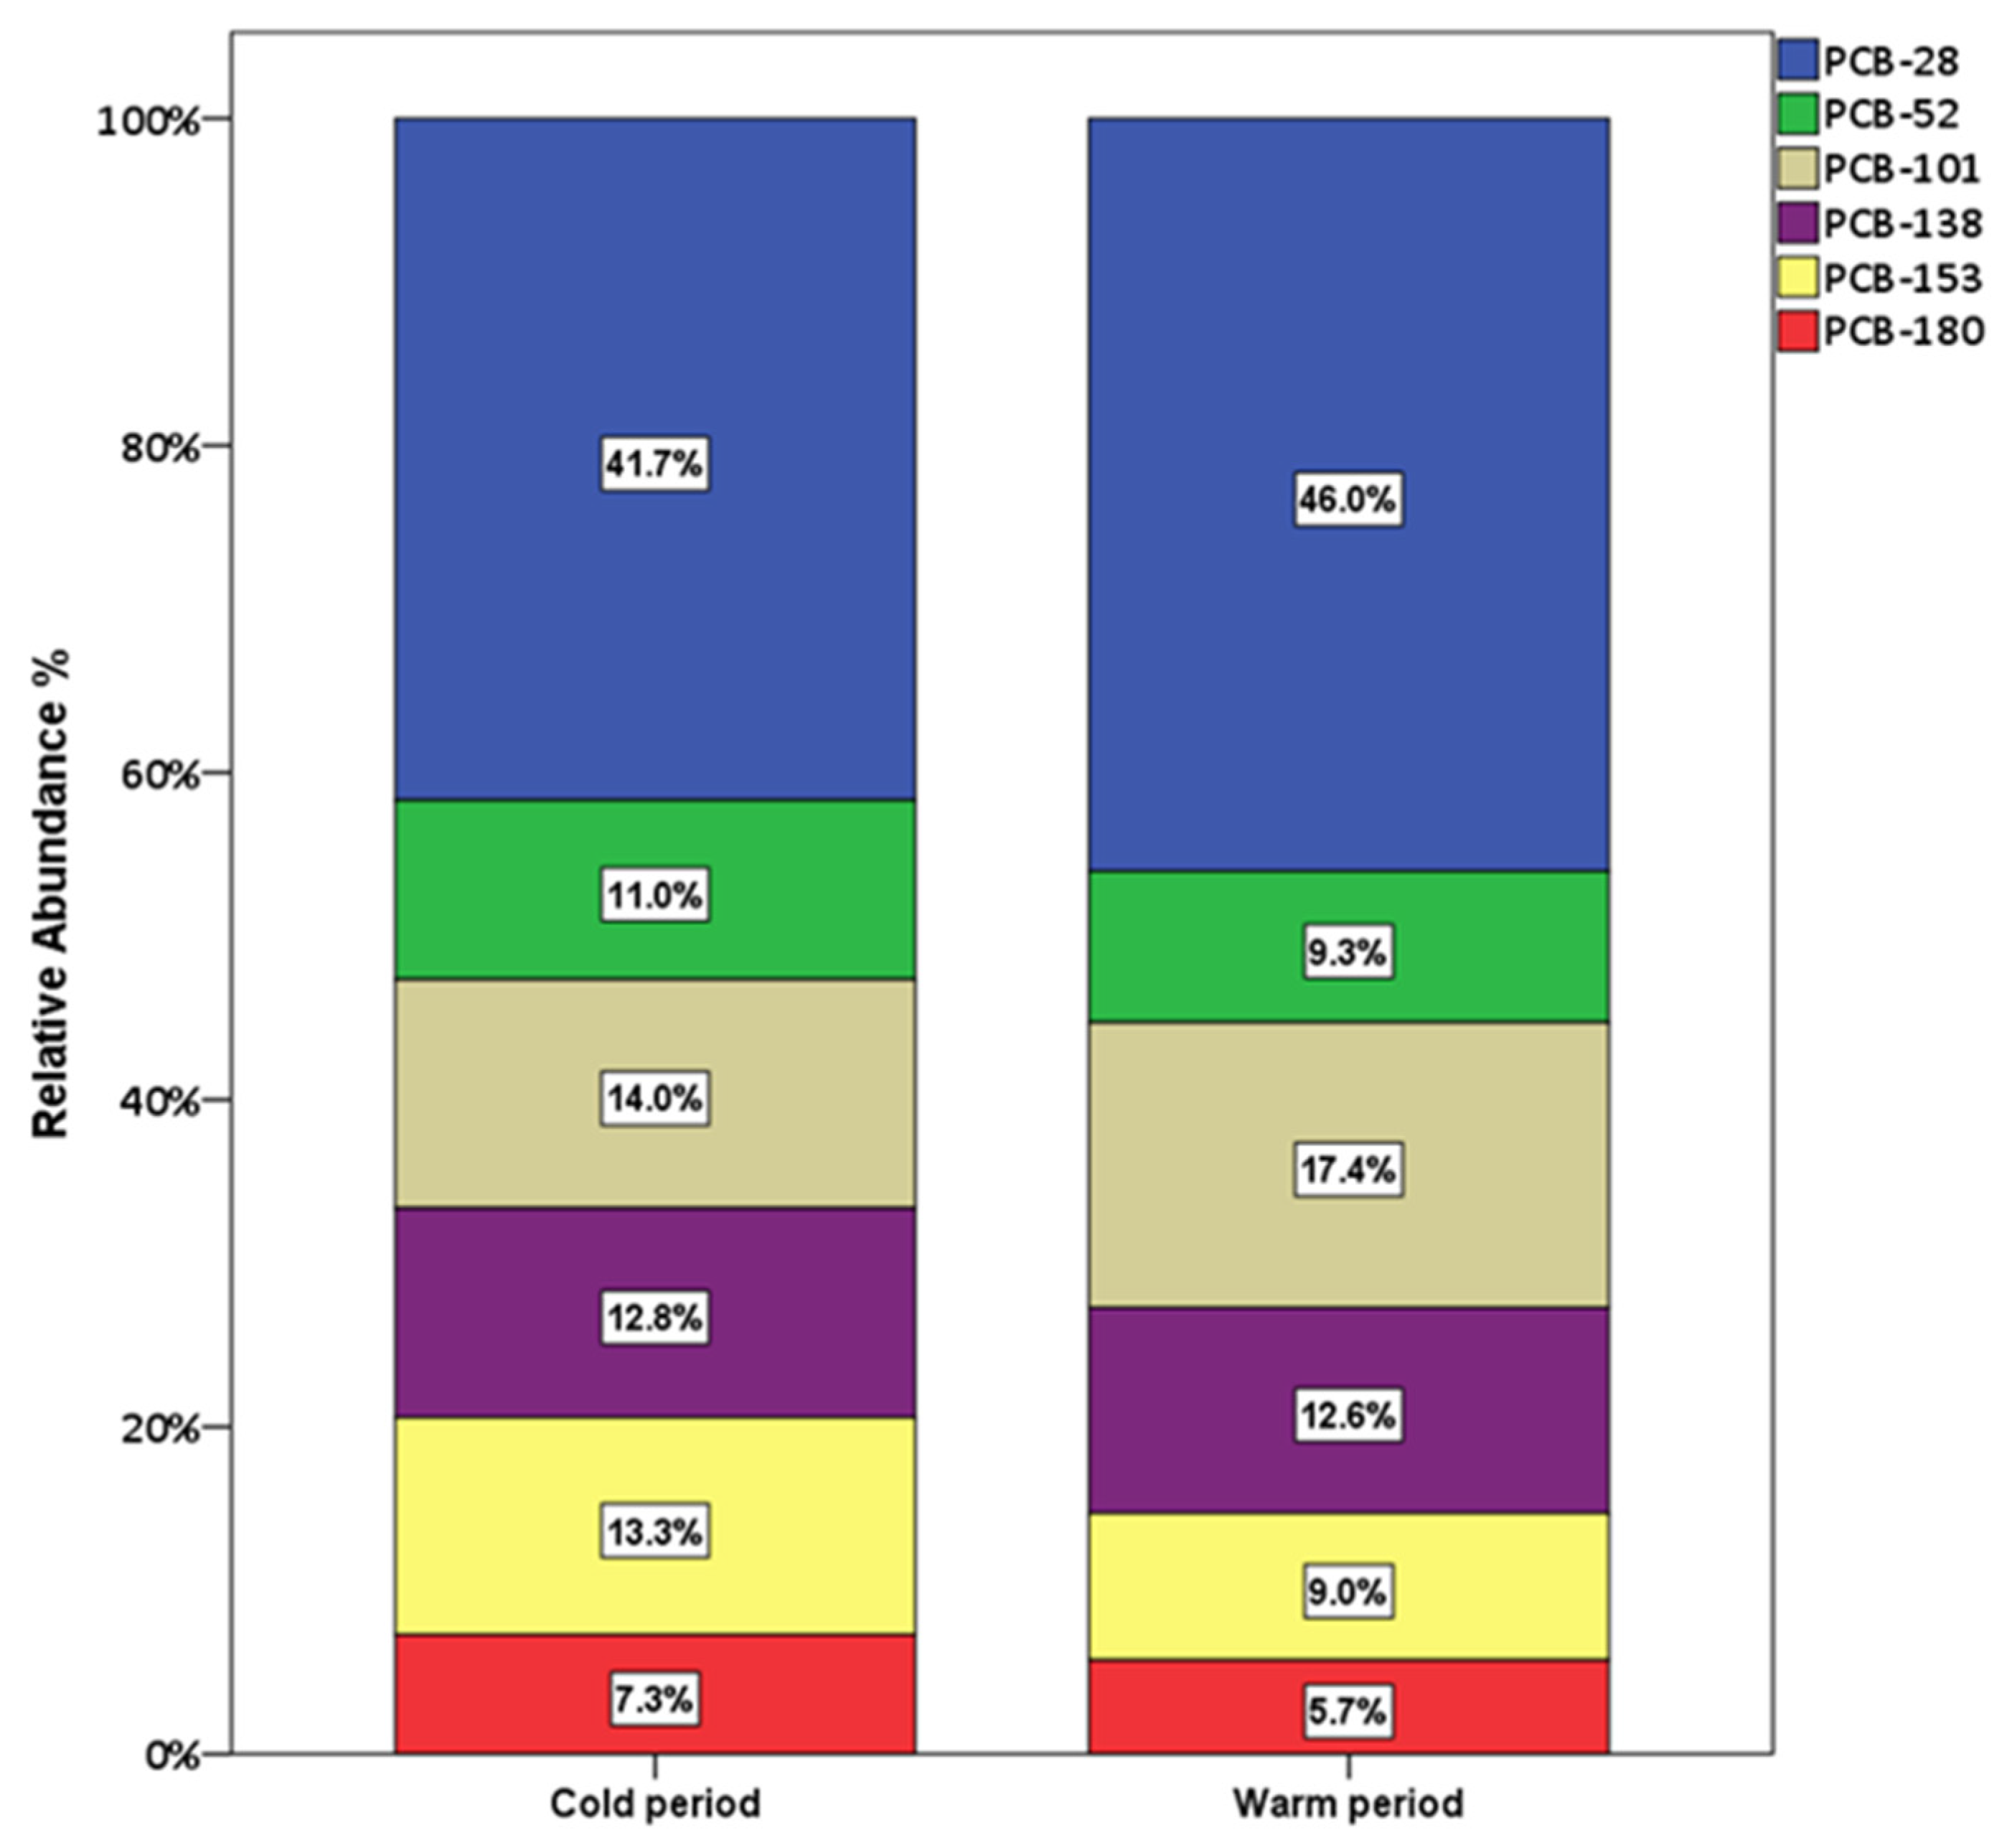
3.1.1. PAHs and Indpcbs

PAHs concentrations are presented in Table 1. ΣPAHs ranged from 1.27 to 16.5 ng m−3 with a median value of 6.12 ng m−3. PAHs levels were found in the same levels with a previous research in the same site [47] (ΣPAHs = 7.9 ng m−3) and slightly lower than our previous study in the nearby area of Aspropirgos (mean value 9.8 ng m−3) [36]. PAHs in other Greek cities were measured in lower concentrations, with mean values 3.34 and 6.46 ng m−3 in the harbor of Volos [48], 3.08 ng m−3 in Spata, and 3.21 ng m−3 in Koropi [49], but significantly higher mean concentrations were reported in industrial sites of Istanbul (60.5 ng m−3) [39] and Aliaga (218 ng m−3) [21], Turkey.
BaP is considered the most toxic PAHs compound, and its values ranged from below LOD to 3.04 ng m−3 with an average value of 0.93 ng m−3, which is close to the target value of 1 ng m−3 from the 4th Daughter Directive [50,51]. BaP highest average concentration in Aspropirgos was 3.6 ng m−3, while in Eleusis, the mean concentration was 0.71 ng m−3 [47]. Similar levels of BaP were also recorded in Thessaloniki, with the average values for the cold and warm periods being 0.12 and 0.86 ng m−3, respectively [42], while BaP concentration in Volos measured 0.60 ng m−3 [49]. Lower BaP concentrations were found in industrial sites of Istanbul, Turkey (0.39 ng m−3) [39], Dunkirk, France (0.29 ng m−3) [31], and Jiangsu Province, China (up to 0.35 ng m−3) [16], whereas much higher concentrations were presented in the industrial site of Shanghai, with a mean value of 5.95 ng m−3 [52].
In Table 2, concentrations of indPCBs are presented with values ranging from 11.4–26.6 pg m−3, with a median value of 18.1 pg m−3. The most abundant compound was PCB28 (7.96 pg m−3), followed by PCB101 (2.86 pg m−3). Levels of PM10-bound indPCBs were similar to that reported in Thessaloniki (0.5–29.2 pg m−3) [53], but relatively lower than in Rome (163 pg m−3) [54] and Brescia (474 pg m−3) [23], Italy.

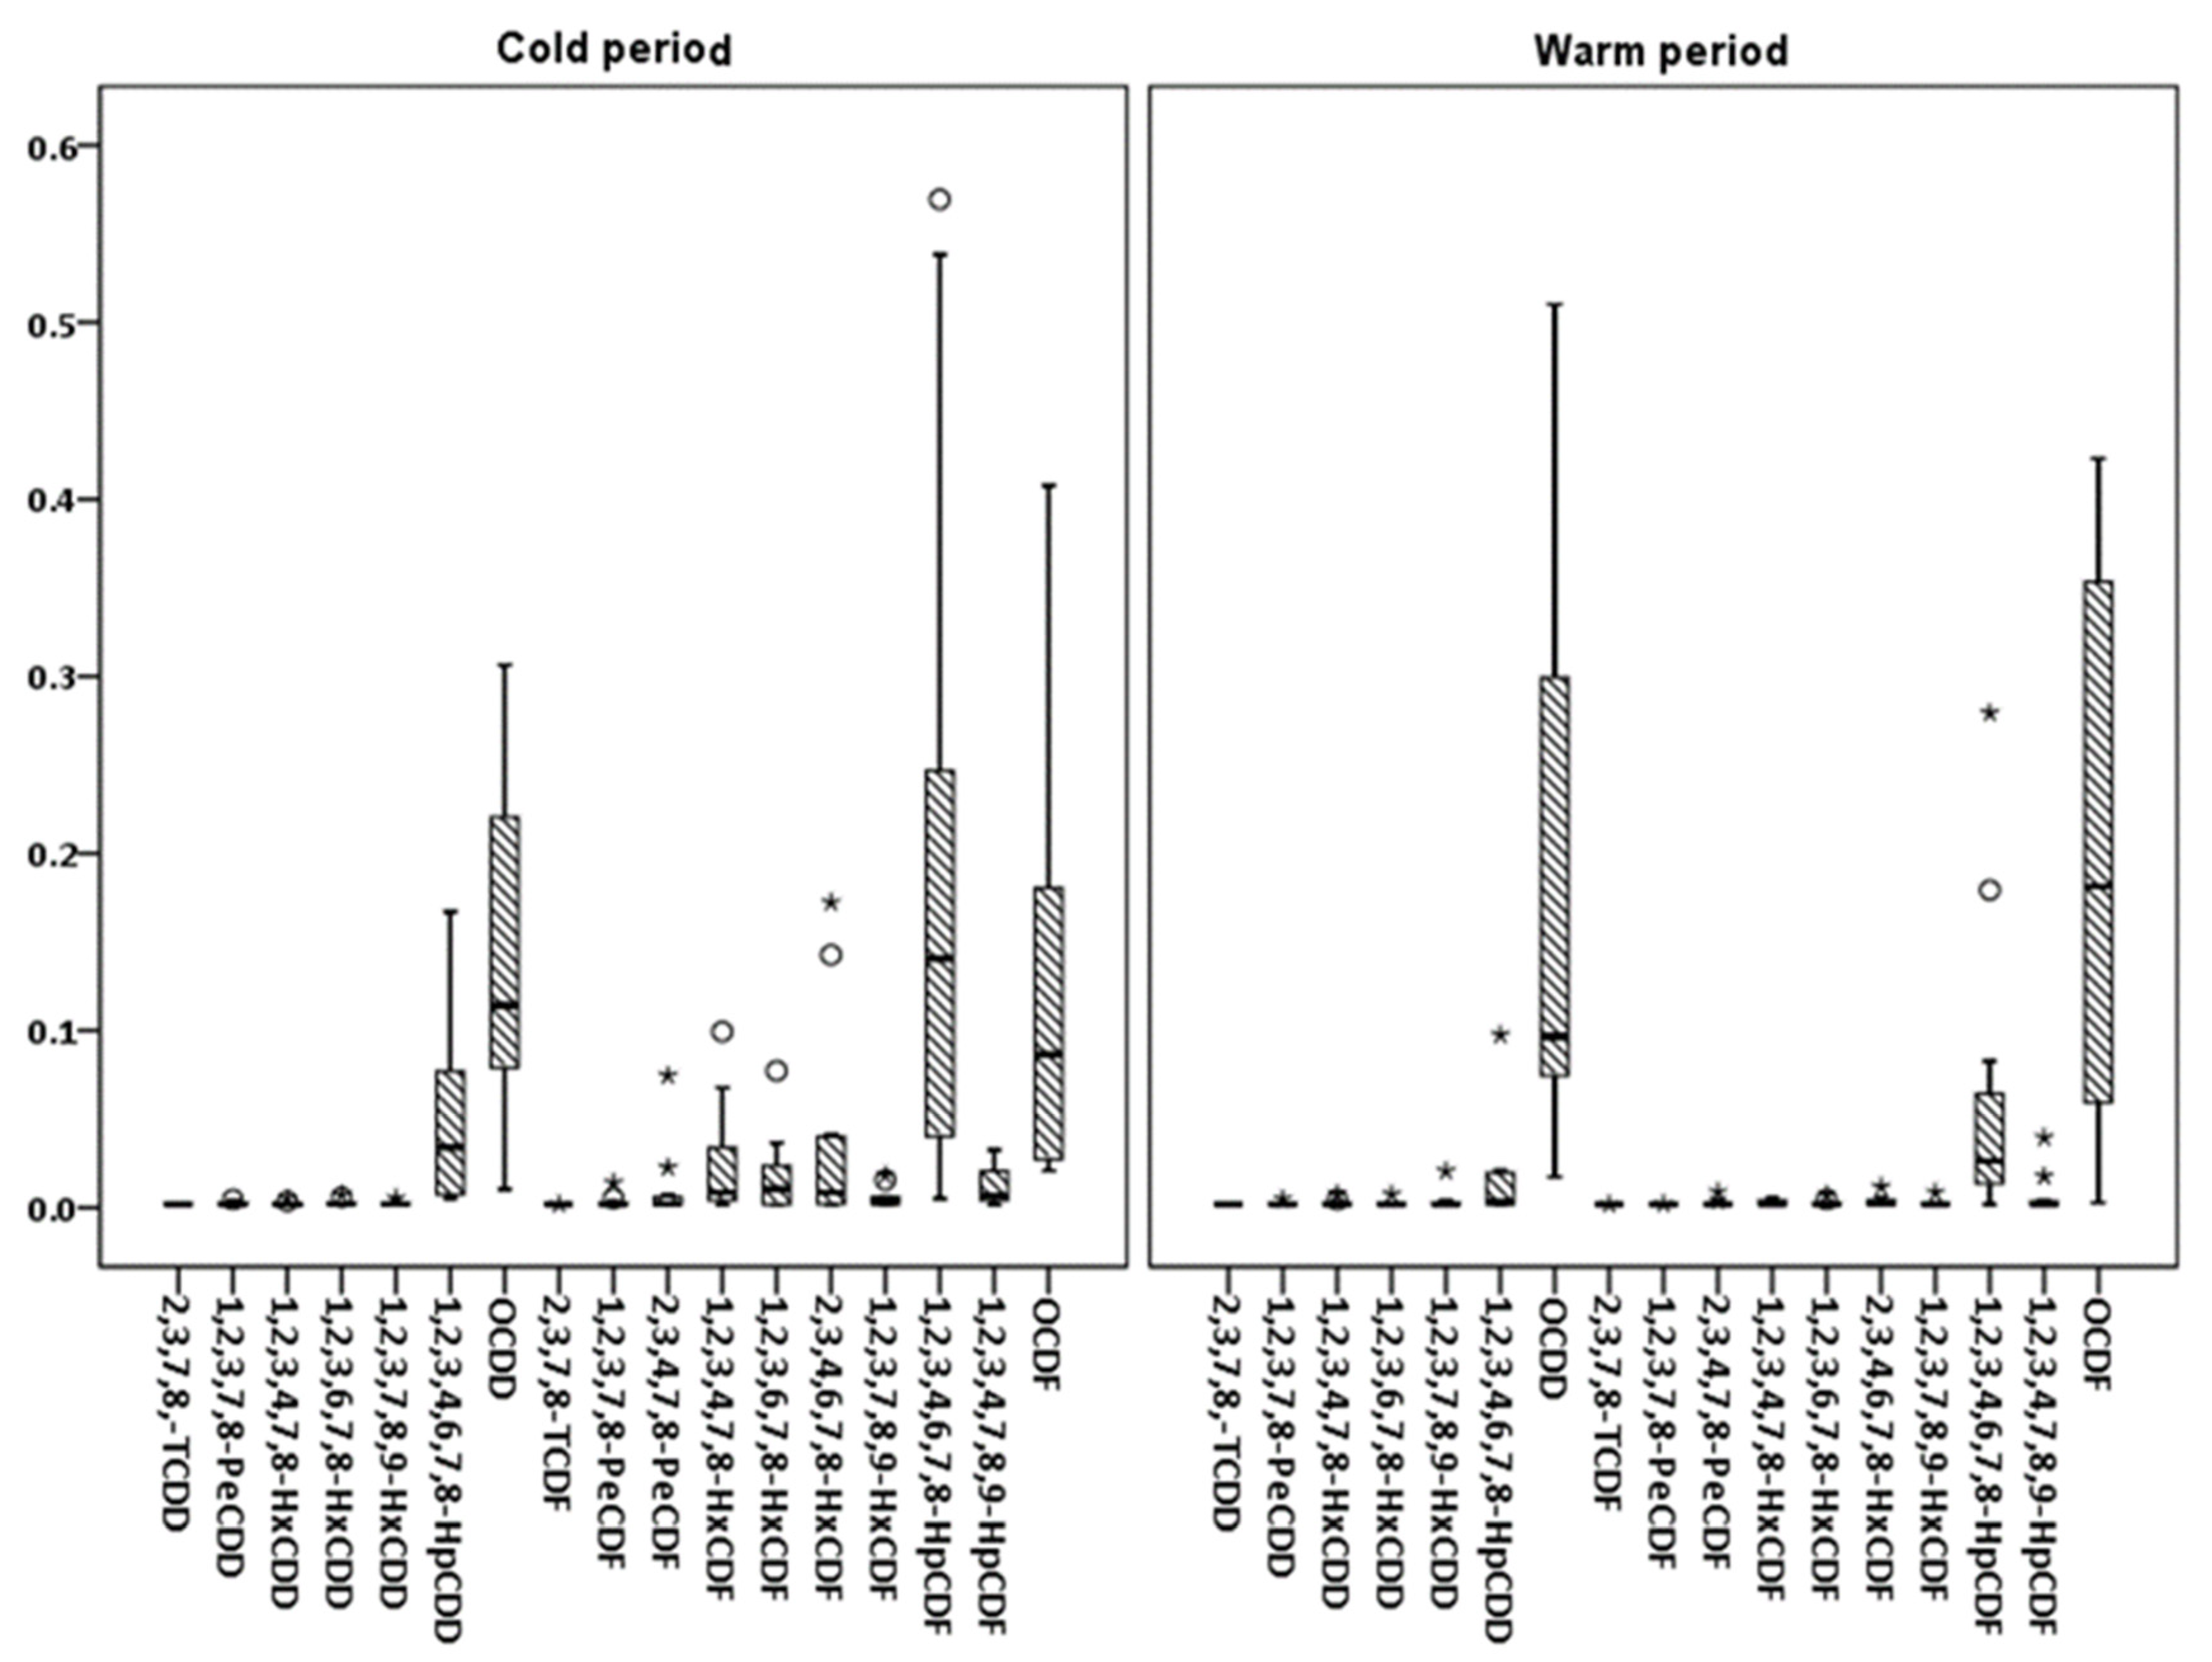
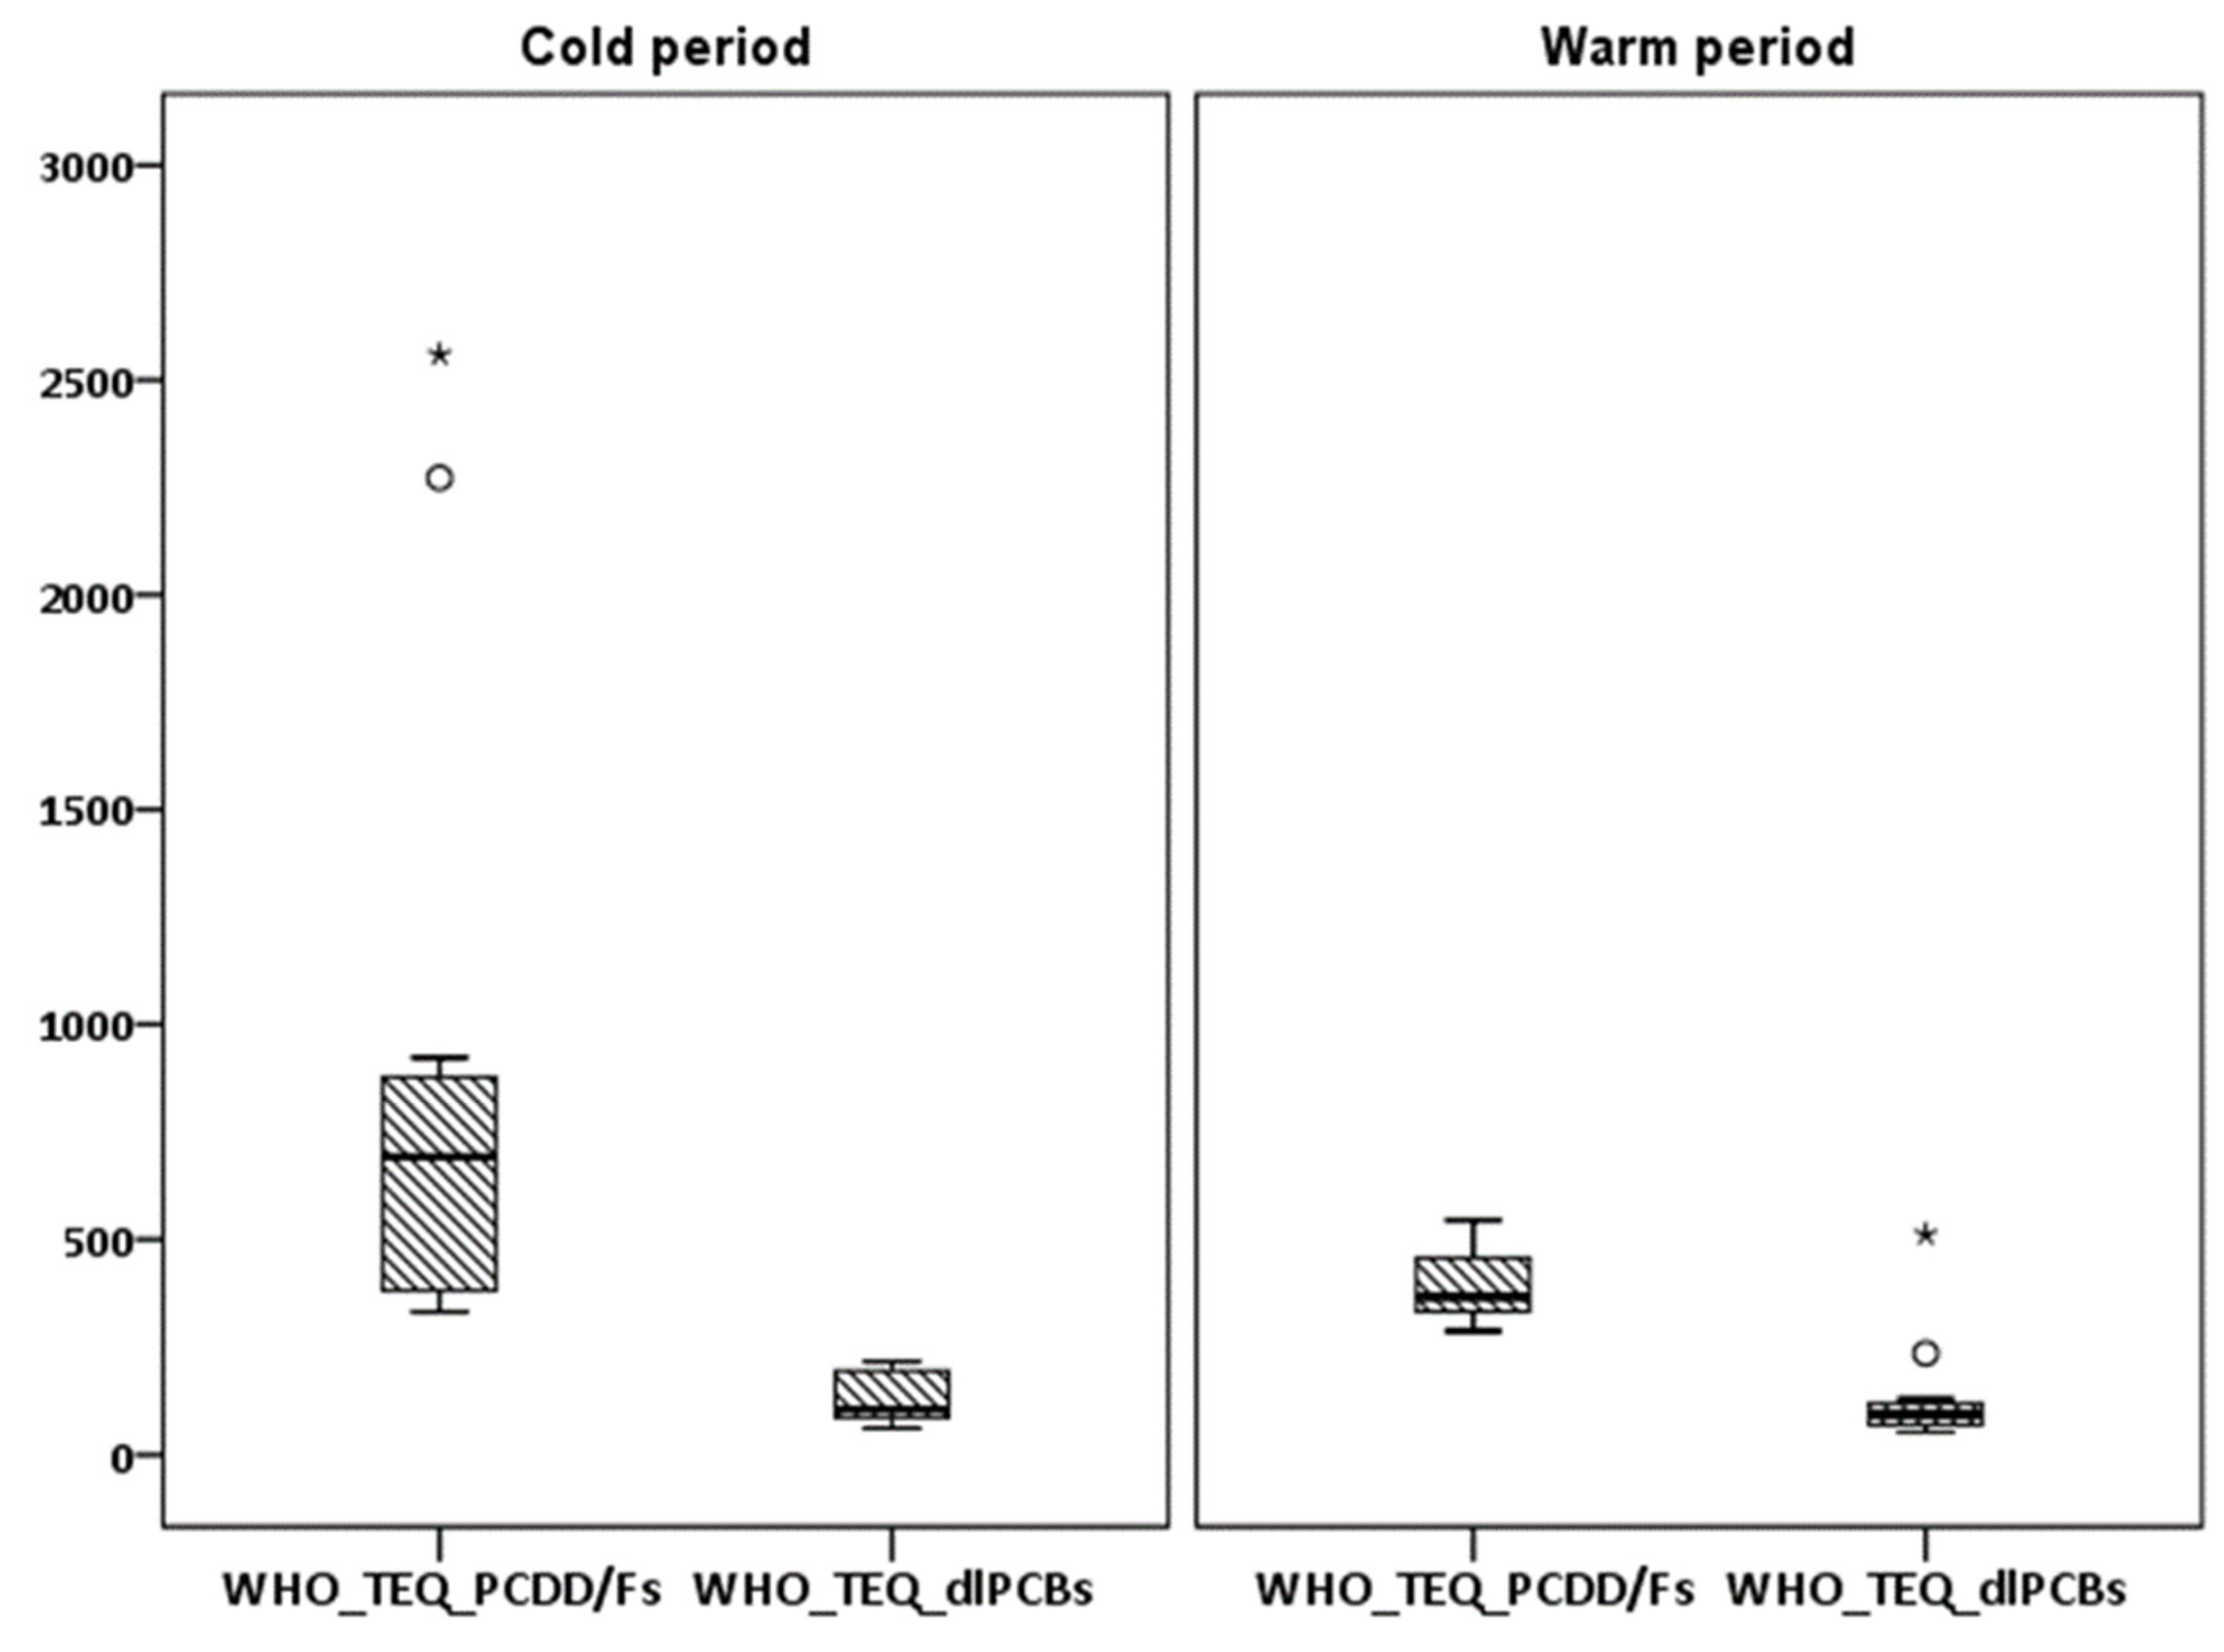
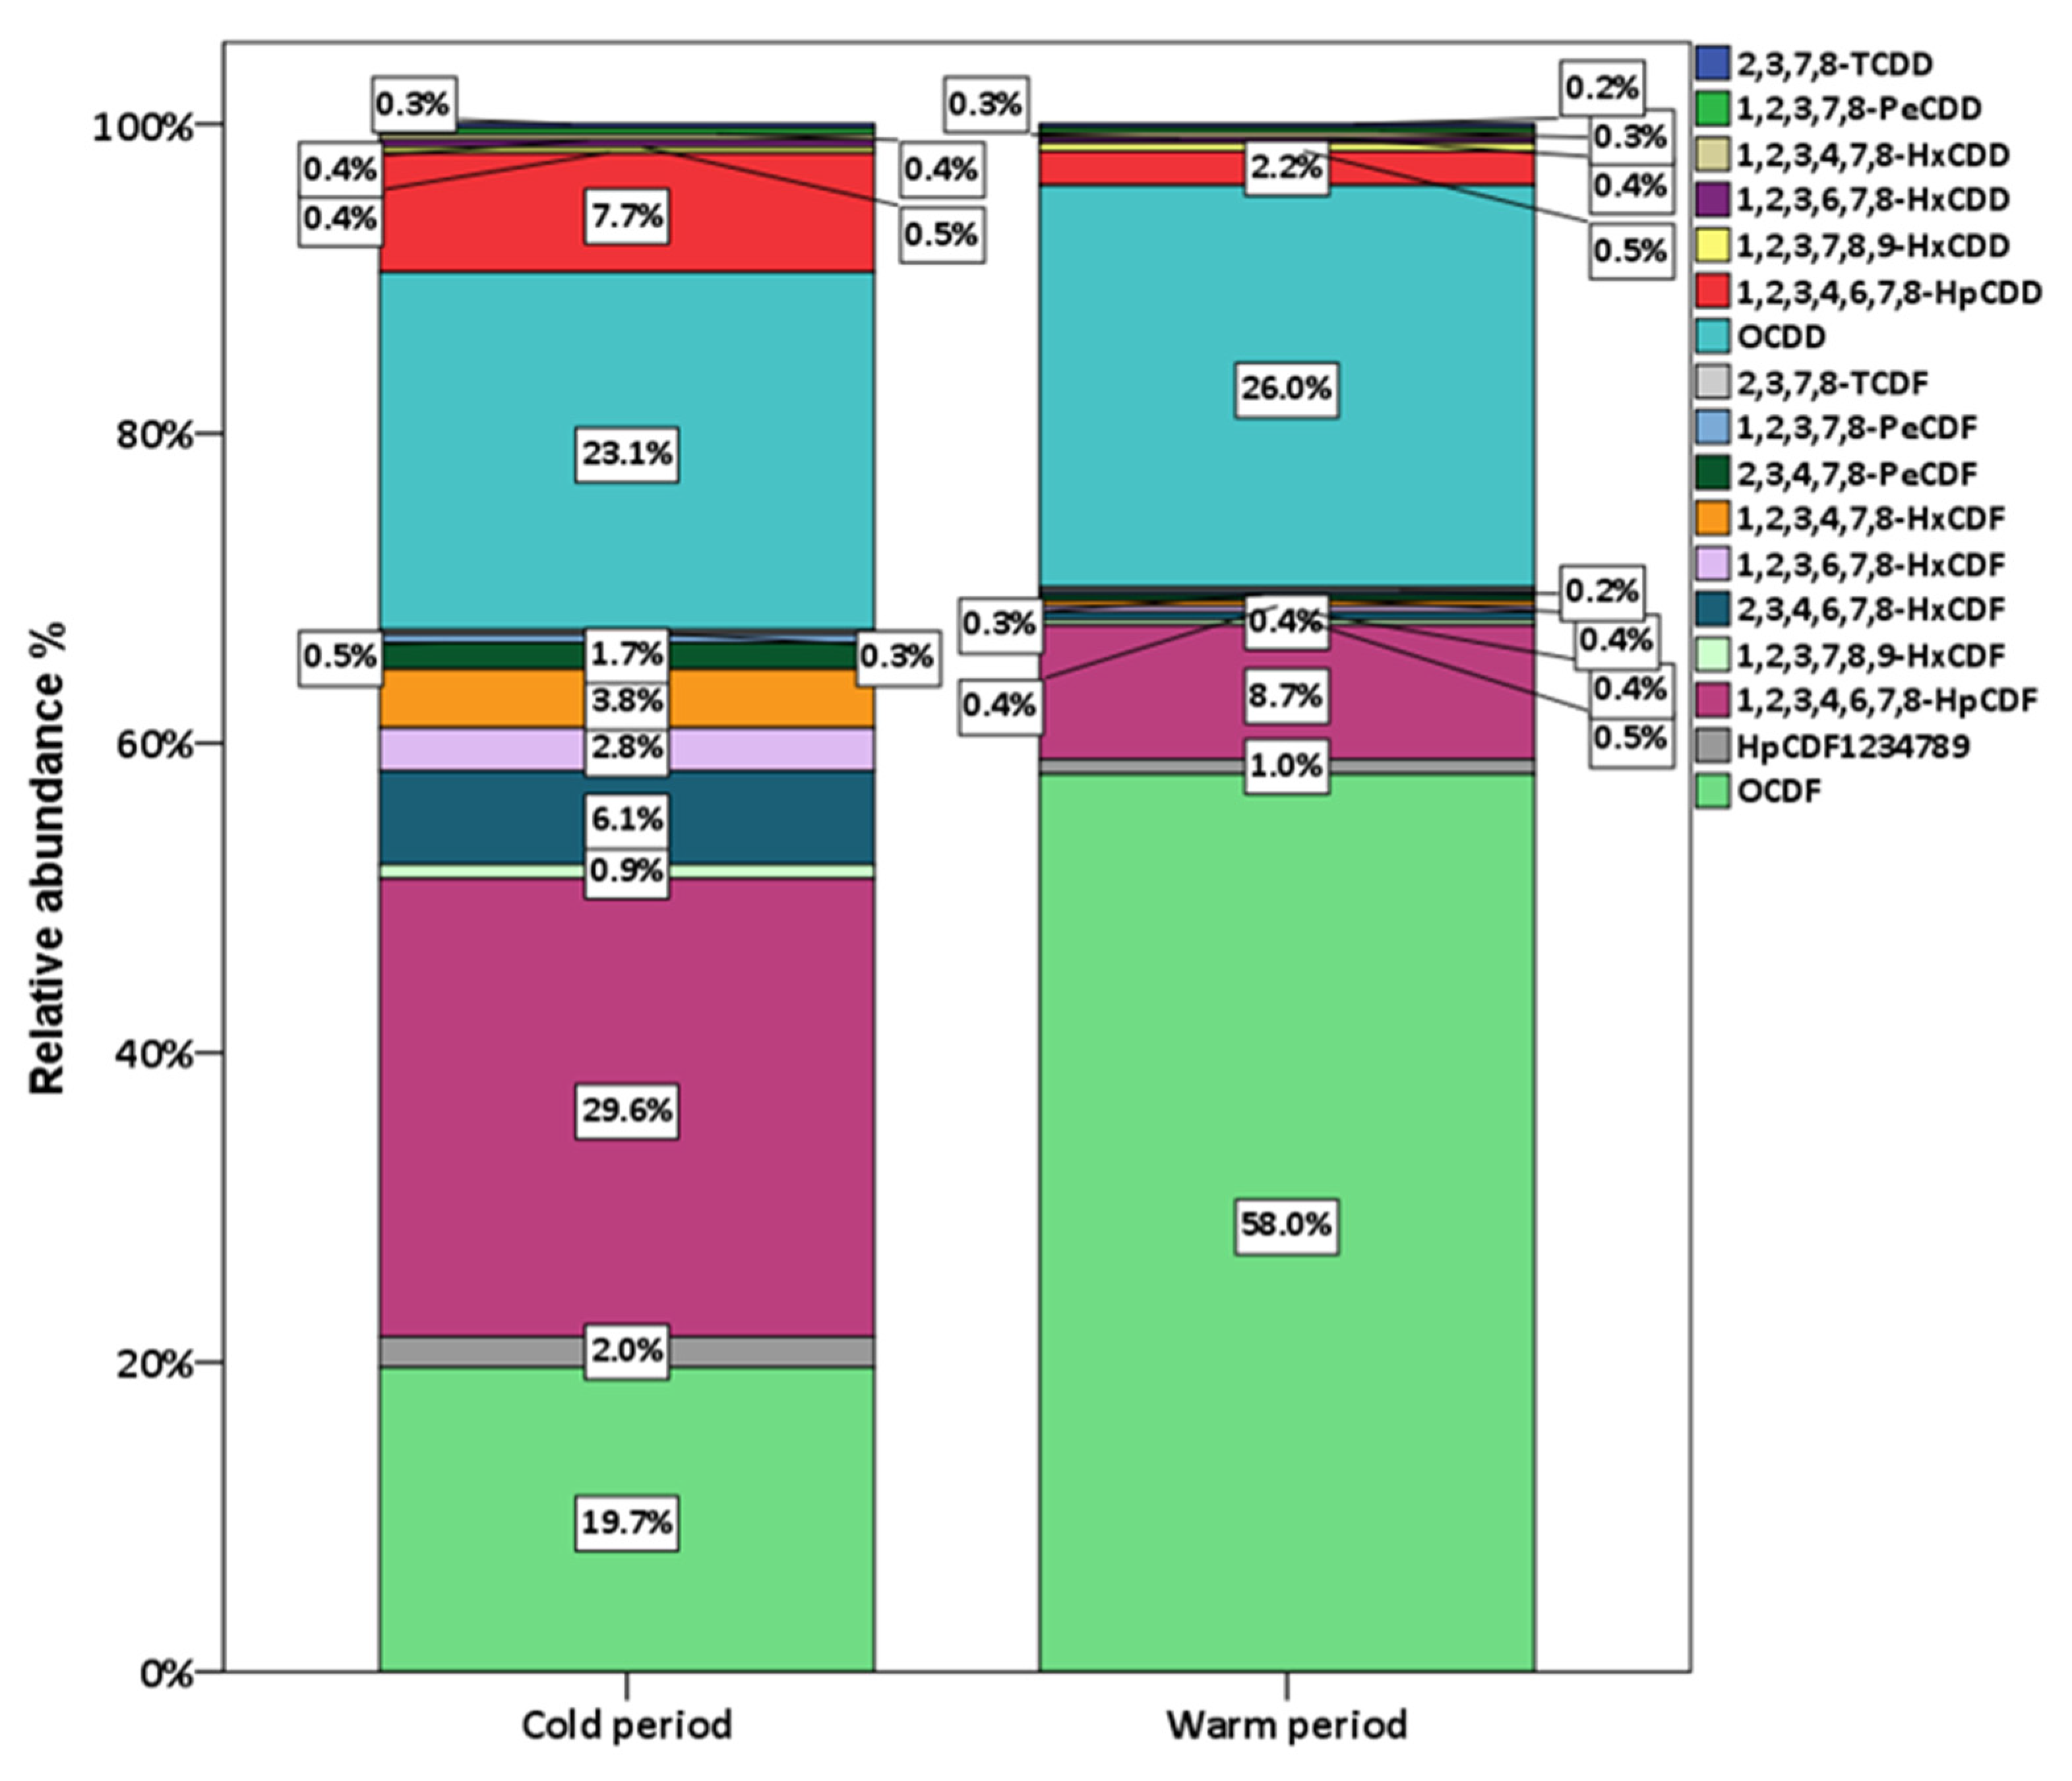
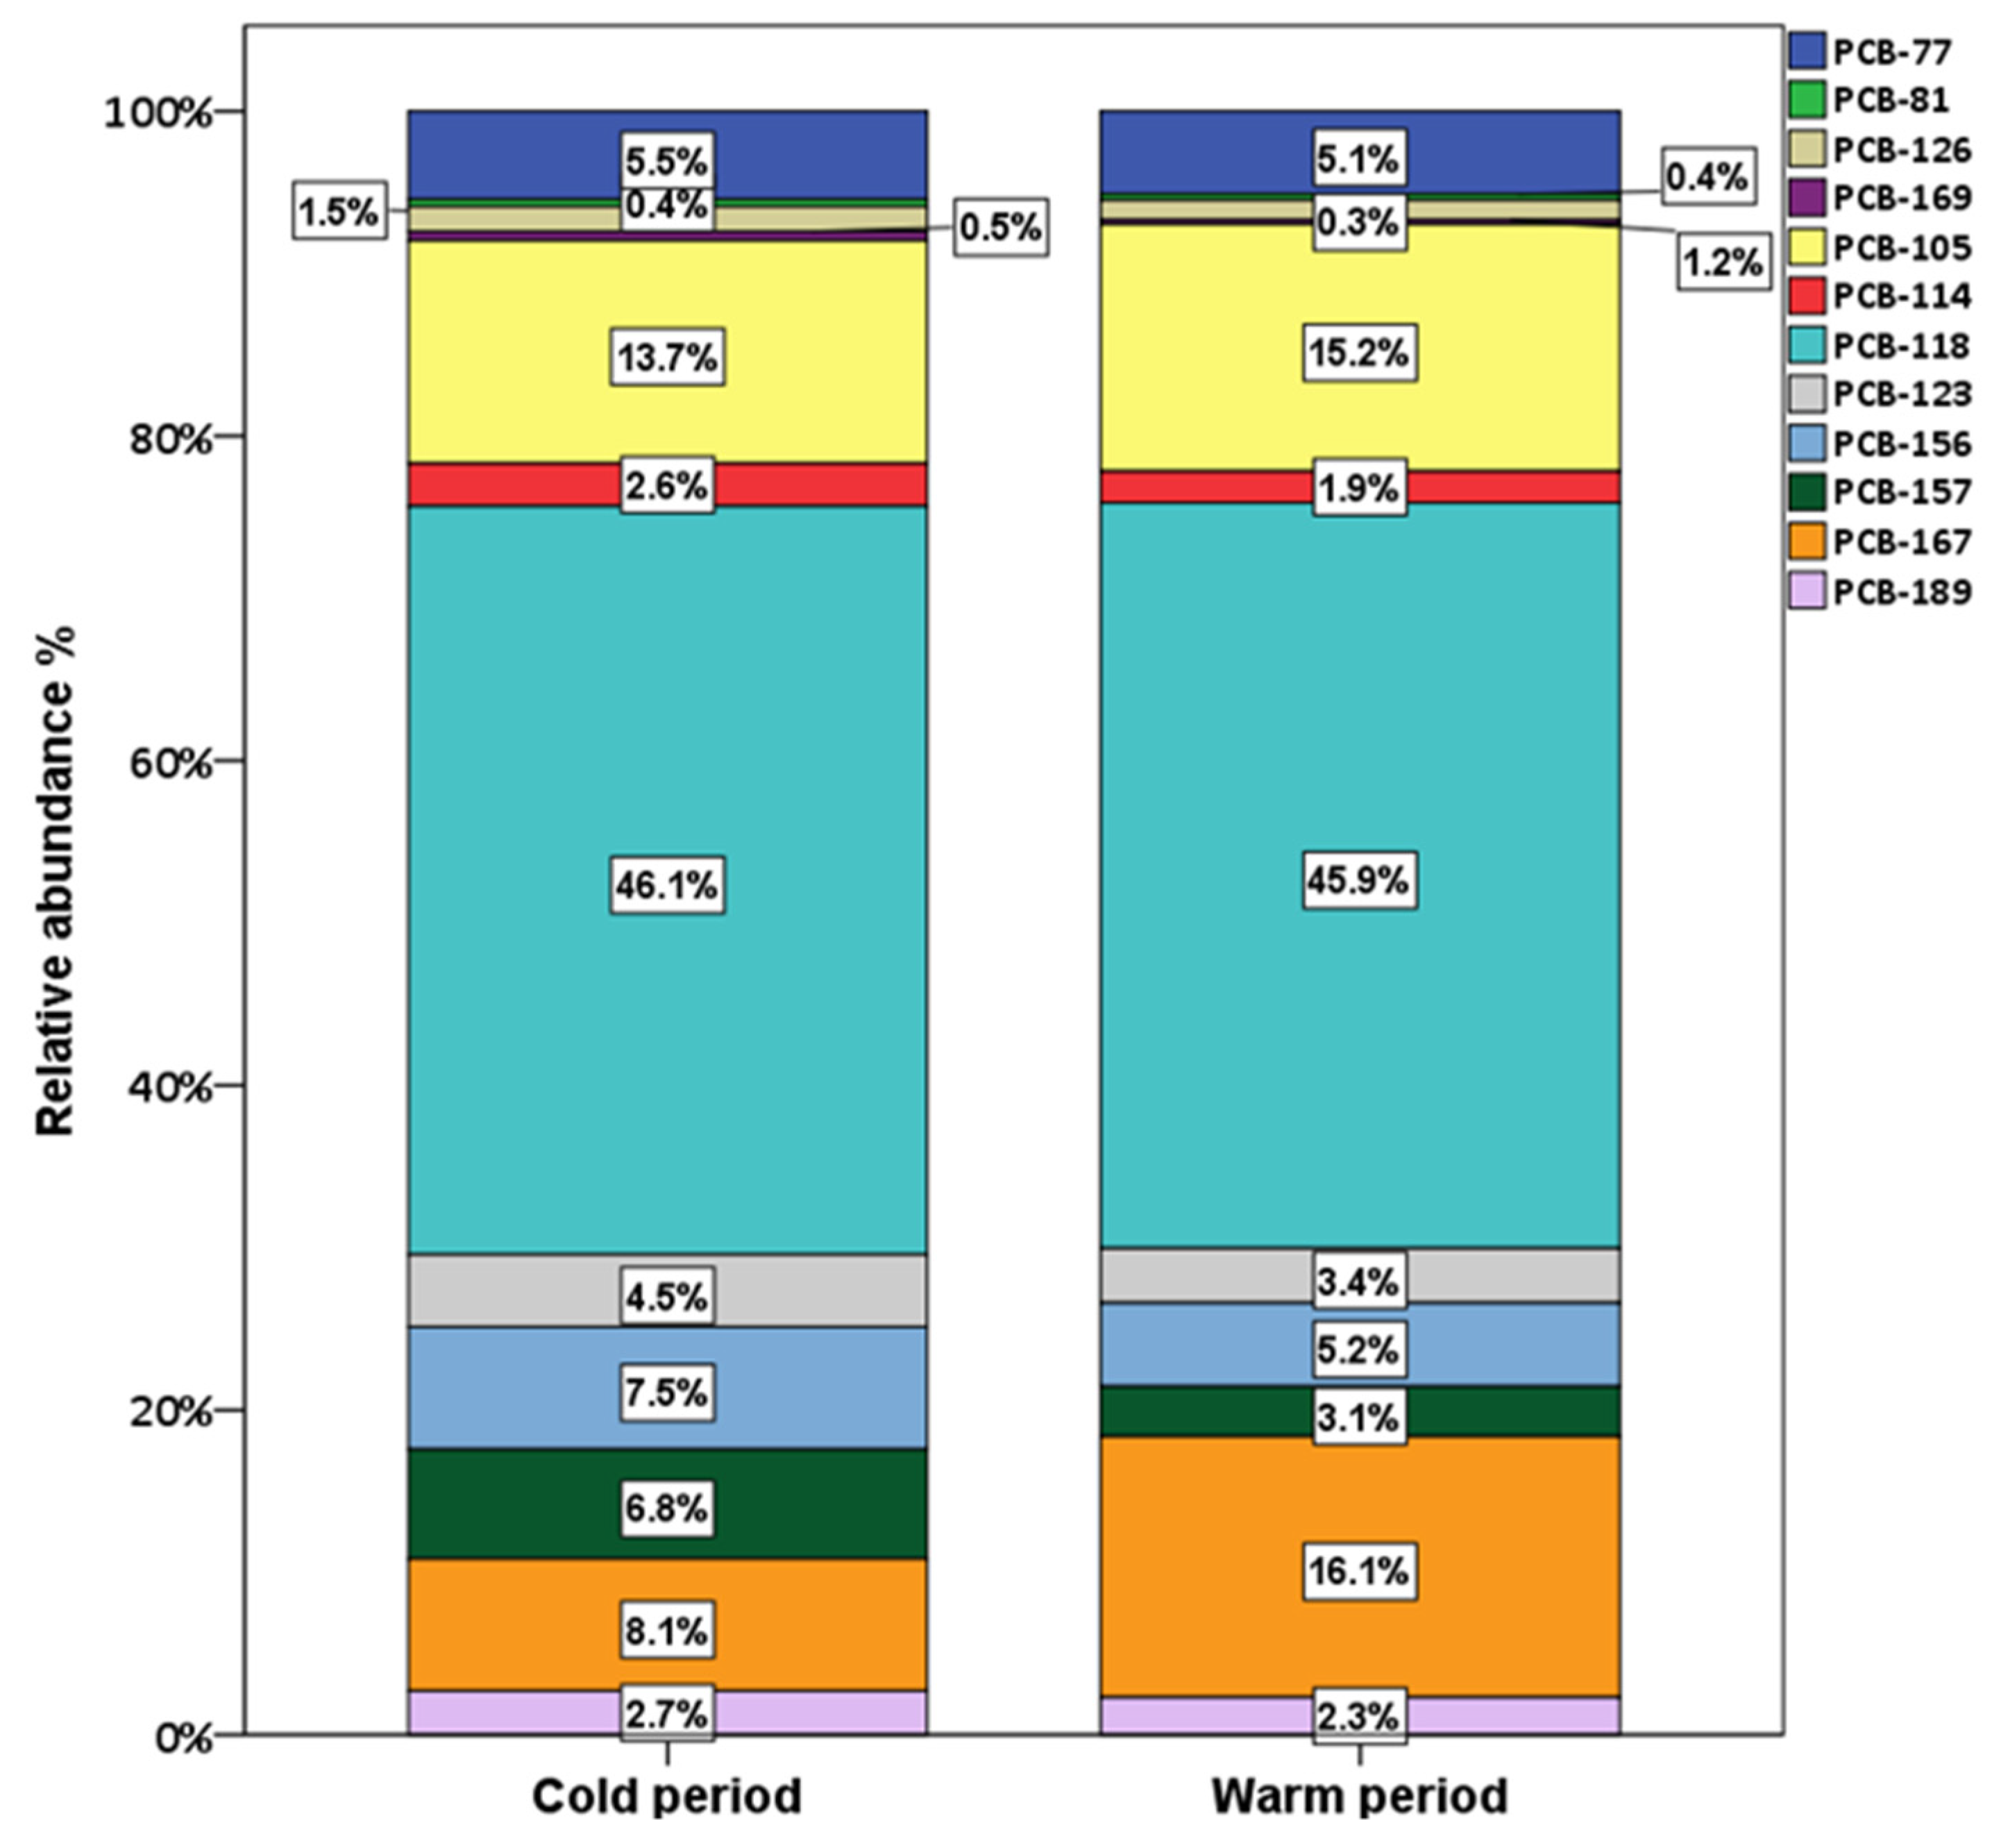
3.1.2. PCDD/Fs and dlPCBs

The PCDD/F and dlPCB results obtained in this study are summarized in Table 3 and Table 4, respectively. Toxic equivalency factors that were reconsidered by World Health Organization in 2005 were applied to calculate PCDD/F and dlPCB toxic equivalent (TEQ) concentrations [22]. Values below LOQ were assumed to be equal to LOQ (upper-bound concentrations) to evaluate the worst case scenario of exposure. PCDD/F concentrations in PM10 collected from the industrial area of Eleusis were 145–3472 fg m−3 (mean 696 fg m−3) and the PCDD/F TEQs ranged from 287 to 2560 fg WHOTEQ2005 m−3 (mean 656 fg WHOTEQ2005 m−3). Lower atmospheric (both particulate and gas phase) concentrations have been reported in a few studies around industrial sites like Shanghai, China where TEQs were calculated between 9.28–423 fg WHO-TEQ2005 m−3 (mean 88.9 fg WHOTEQ2005 m−3) [55]. Additionally, in an urban site of Brno, Czech Republic, particulate-bound concentrations of PCDD/Fs ranged from 4.63 to 661 fg m−3 [56] while in gas phase of background areas in Spain (2.18–19.1, mean 656 fg WHOTEQ2005 m−3) [57]. Similar levels of PCDDFs were measured in the atmosphere (particulate and gas phase) of Umm-Al-Aish oil field, with values of 31.2–516 fg WHOTEQ2005 m−3 [20], and in PM10 from Rome with 5.43–734 fg WHOTEQ98 m−3 [54]. Higher concentrations were also presented in many industrial sites worldwide (Table 5), and our results were classified among the lowest in global literature. The comparison emphasizes in studies performed in industrial sites even the samples derived from particulate, gas, or both atmospheric phases. To our knowledge, in Greece, only two studies referred to ambient concentrations of PCDD/Fs, with our results being in the same levels with those found in particulate phase from the center of Athens (73 fg m−3 in the background site and 462 fg m−3 in the urban site) [32] and lower than the particle-bound concentrations measured in Thessaloniki (150–12,890 fg m−3) [53]. There is no international standard about reference or target values of PCDD/Fs in the air, however, a review by Lohmann and Jones (1998) [58] reported some typical values according to the sampling point (background—remote sites: <10 fg I-TEQ m−3, rural sites: 20–50 fg I-TEQ m−3), urban or industrial sites: 100–400 fg I-TEQ m−3). Comparing our results with these values, it is obvious that the industrial area of Thriassion Plain has a significant impact on the ambient air concentration of PCDD/Fs. The mean values in our study (mean 656 fg WHO-TEQ2005/m−3) are also below the recommendations by the Environment Minister in Ontario (Canada) (5000 fg I-TEQ m−3) [3] and slightly over the atmospheric standard of Japan (600 fg WHOTEQ2005 m−3), but far higher than the standard of Germany (150 fg WHOTEQ2005 m−3) [59,60]. It is noteworthy that the results in this study referred only to the particulate phase, and the calculated WHO-TEQ values may be underestimated.
For the dlPCBs, the total particulate concentrations (expressed as the sum of m.o. and n.o. congeners) were 975–4083 fg m−3 (median 1438 fg m−3), and the WHOTEQ2005 concentrations were 53–512 fg m−3. As it is clear from Table 5, the concentrations and WHOTEQ2005 of dlPCBs are in comparable values with studies in industrial sites of Dunkirk, France (743–1747 fg m−3, particulate phase) [31], and Shanghai, China (340–7607 fg m−3, particulate plus gas phase) [55], but significantly higher concentrations have been reported in gas phase under the vicinity of a steel complex in Korea (6100–61,800 fg m−3) [61] or in the urban atmospheres (particulates and gas phase) in Hochiminh, Vietnam (1570–8300 fg m−3) [62] and Brescia, Italy (11,600–708,400 fg m−3) [23].
Table 5. Worldwide concentrations of persistent organic pollutants (POPs) according to literature in comparison with this study. (p refers to particulate phase and G to gas phase samples).
AreaArea DescriptionSampling
(Year/Phase)
ΣPCDD/Fs (fg m−3)WHO (TEQ fg m−3)ΣdlPCBsWHO (TEQ fg m−3)ΣindPCBs (pg m−3)ΣPAHs (ng m−3)Reference
Eleusis, GreeceIndustrial2018–2019/P145–3472287–2560975–408353.1–51222.9–53.21.3–16.5This study
Athens, GreeceBackground/Urban2000/P73–462 (P)73 (P + G) 1.79–4.94[32]
Thessaloniki, GreeceSemirural/Urban1999/P150–12,8904–119 0.5–29.2 [53]
Porto, PortugalUrban/Industrial1999–2004/P + G200–15,0009.8–817 [63]
Rome, ItalyUrban2000–2001/P 5.43–734 0.66–7.2888.9–372 [54]
Steel Complex, KoreaIndustrial2006/G 6100–61,800 [61]
Anshan, ChinaIndustrial2008/G20–9790 45600.3–23 [38]
Satellite cities of Seoul, KoreaIndustrial2003–2009/P + G360–55,755310–3143678–40,968200–1712 [64]
Brescia, ItalyUrban/Industrial/P380–11,39010–19011,600–708,4004–13092.7–8566 [23]
Brno, Czech RepublicUrban2009–2010/P4.3–661- 14.2–614 0.04–14.4[56]
Aliaga, TurkeyIndustrial2009–2010/G 1.6–838[21]
Shanghai, ChinaIndustrial2013/P + G258–49289.28–423340–76071.08–55.9 [55]
Dunkirk, FranceIndustrial2008–2009/P718–107012,990–25,430744–1747 0.29–1.95[31]
Istanbul, TurkeyIndustrial2011–2012/P + G 0.7–27.9 0.04–445[39]
Umm Al-Aish, KuwaitIndustrial2014–2015/P + G 31.2–516 3.9–36.8 [20]
Hochiminh, VietnamUrban2016–2017/P + G410–52,70022.2–15301570–83001.77–44.1 [62]
Tibet- Qinghai Plateau, ChinaIndustrial2015/G–1180–2180113–242490–9003.18–7.12 [4]
Jiangsu, ChinaIndustrial2018/P + G11,900–57,700136–597580–27100.64–11.3 11–18[16]

3.2. Seasonal Variations and Congeners’ Contributions

In Table 1, Table 2, Table 3 and Table 4, the results were divided by their seasonality in order to reveal any possible variation between measurements during cold and warm periods. The Mann–Whitney test was applied in each dataset for this purpose.
Regarding PAHs, seasonal variations were observed for PAHs with 4 or more rings in their molecules. These high molecular weight PAHs presented significantly higher concentrations during cold months (p < 0.05). PAHs’ seasonal variations are described also in Figure 2 and it is worth mentioning that ΣPAHs was 4 times higher during cold months (8.44 ng m−3 compared to 2.01 ng m−3), and the most carcinogenic among the compounds, BaP, exceeded the target limit of the European Commission with an average value of 1.03 ng m−3, while during warm period, it was 0.57 ng m−3. Such differences can be explicated by the increased direct emissions sources (fossil fuel combustion, biomass burning, etc.) during cold months, and by the enhanced condensation of PAHs in the particulate matter due to the lower temperatures [41], whereas increased solar radiation and atmospheric oxidants during warm months lead to PAHs’ degradation [65]. Similar seasonal trends, especially for high molecular weight PAHs, have also been reported in other studies in Greece [36,47,66] and globally [21,39,41].
In Figure 3, the relative contribution of each compound is presented for both sampling periods. Obviously, 5–6 rings PAHs were the most abundant species during cold period, accounting for about 80% of the ΣPAHs, while the percentage is about 30.4% in the warm period dominating by the low molecular weight PAHs. This inversion may be a result of the decreased emissions from combustions related with central heating during the warm period. The dominance of petrogenic low molecular weight PAHs, especially with 3–4 rings, in the warm period may be affected also by emissions from petroleum depositories from oil refineries and cargo ships [49,67,68] that both constitute a constant factor in the area working all year long. The most abundant PAH during the cold period was BbkF 27.5% followed by BaP 12.2%, while in summer BaP remained the dominant PAH with 28.2% relative abundance, followed this time by petrogenic ANT and PHE with 13.9 and 13.5%, respectively (Figure 3). BbkF and BaP were also the most abundant compounds in other studies in Aspropirgos [36], Athens [66], Volos [49], Greece, in Dunkirk, France [31], and Sao Paolo, Brazil [41].
As for the indPCB’s seasonal variations, none of the six congeners presented statistically significant differences (p values were >0.05) between the cold and warm periods, with the concentrations for both seasons being included in Table 2. The indPCBs also did not present any alteration regarding their relative abundance, with PCB28 being the most abundant congener in both sampling periods (41.7 and 46.0%, respectively) (Figure 4). The indPCBs profile also indicates a marked decrease in concentration with increasing chlorination for different congeners. The same outcome was highlighted also by Colombo et al. (2013) in the highly industrialized city of Brescia, in northern Italy [23].
Seasonal variations of dioxins are presented in Figure 5 and according to the Mann–Whitney test only 1,2,3,4,6,7,8-HpCDD, 1,2,3,4,7,8-HxCDF were found significantly higher during the cold period. Table 2 and Figure 5 show that there was not a clear seasonal pattern, with some compounds like OCDD (warm: 192 fg m−3, cold: 151 fg m−3) and OCDF (warm: 429 fg m−3, cold: 128 fg m−3) being relatively higher during the warm period. However, the WHOTEQ2005 value was significantly higher in cold months, revealing that particulate PCDD/Fs pose a higher risk to human health during cold periods due to their higher concentrations (Figure 6). This outcome could be combined with our previous studies in this area [35,36], where uncontrolled combustions in Thriassion Plain play a potential role in atmospheric degradation and the increased toxicity of the particles in the whole area, including Eleusis and Aspropirgos town (Figure 1). In particular, during cold months the wind direction is usually north, northeast (N, NE) in the sampling area and as a result the particulate matter is enriched by the site where uncontrolled combustions take part [35]. Comparing with other studies, in some of them, seasonal variations were observed with higher concentrations during cold months [38,54,64], assuming either elevated combustions for heating or relatively low boundary layer heights in cold weather [58] being the dominant reason for that outcome. Nevertheless, other studies did not describe any seasonal trend for PCDD/Fs [69].
Discussion on the congener profile of PCDD/Fs during the warm and cold periods will be based on Figure 7. The most toxic congener, 2,3,7,8-TCDD, was not detected in any sample. The congener profiles demonstrated the prevalence of OCDF, OCDD, 1,2,3,4,6,7,8,-HpCDF, and 1,2,3,4,6,7,8-HpCDD for the entire sampling period. The relative abundances of these four compounds were 19.7–58%, 23.1–26.0%, 8.7–29.6%, and 2.2–7.7%, respectively. The results are in agreement with those from other studies in industrial sites in Shanghai [55] and Anshan [38], China, in Seoul, Korea [64], and in Umm-Al-Aish oil field, Kuwait [20].
In regard to particle-bound dlPCBs, no seasonal pattern was observed during the sampling campaign (Table 3), with concentrations and WHOTEQ2005 values for each congener (Figure 6) being quite similar between the cold and warm periods. This result is in agreement with other studies [20], although there are papers reporting elevated concentrations during warm periods for PCBs in gas phase [38,64], assuming that PCBs evaporated more easily from soil to gaseous phase and could be transported long-range under high temperatures [38,70,71].
Although the sampling was performed only in the particulate phase, the dlPCBs congener fingerprint detected in our study complies with that reported in the literature. Thus, according to Figure 8, the most abundant congener was PCB118, accounting for 45.9–46.1% of the relative abundance followed by PCB105 (13.7–15.2%), PCB167 (8.1–16.7%), and PCB77 (5.1–5.7%). The outcome from our study matches the profile from other studies in both gas and particulate phase [6,20,23,72], except for PCB167, reinforcing the conclusion that the dlPCBs’ profile does not depend on the sampling location.

3.3. Source Apportionment

Calculation of different molecular diagnostic ratios (MDRs) has been applied in many studies for source apportionment of PAHs in the atmosphere [65,73,74]. The approach relies on the fact that emission of certain PAHs from characteristic sources tends to be constant, and thus the ratio receptor/source remains stable [67,68]. However, MDRs should be used with caution, as PAH components may differ in reactivity and atmospheric residence times [67]. In Table 6, the selected MDRs are presented for the whole period and for each season separately. All four MDRs conclude to the same outcome, suggesting strong pyrogenic source contributions. Moreover, there was no observed difference between the cold and warm periods, assuming that the sources are constant and strongly related with combustions in the area. The MDRs calculated here are parallel with those reported previously for Aspropirgos and Eleusis [36,47], which also suggest effects from pyrogenic sources.
One of the tools to estimate possible common sources among PCDD/Fs is the calculation of PCDD to PCDF (D/F) ratio. In general, these ratios in ambient air indicate the degree of contamination from combustion sources. Values above 1.0 suggest less contribution, while values <0.5 show increased contribution of combustion sources [75]. In our study, the D/F ratio was found in an average value of 0.45, a value ranging from 0.49 during the cold period to 0.42 during the warm period. The values suggest that in the whole sampling period, the PCDD/Fs emissions were influenced dominantly by thermal processes. The same results were obtained from other studies in industrial sites in satellite cities of Seoul, Korea [64]. Steel and iron plants’ emissions can also be considered as a continuous source of PCDD/Fs in Thriassion Plain, as reported also by Li et al. (2011) in northeast China [38].
In order to evaluate any potential associations and gain an overview of the relationships among the pollutants investigated, principal component analysis (PCA) was performed in the entire dataset (Table 7). PCA was also applied for PAHs, PCDD/Fs, and PCBs separately, but the results were overlapping so the combined PCA was preferred, including all the studied compounds. Three factors explained the 83.4% of the total variance. PC1 was heavily loaded with high molecular weight PAHs like BaP (0.805), IPY (0.821), and BbkF (0.759) together with most of the PCDFs and some of PCDDs. This factor agrees that PAHs and PCDD/Fs have common sources related with combustions, both controlled and illegal. Indeed, open burning for waste incineration in the studied area is a common practice, and these emissions combined with industrial ones could compose a constant source of both pollutants. Another possible common source for these POPs could be cement kiln factory where the conditions of the furnace; very high temperature, mixing and excess of oxygen; make it an ideal place for a ‘perfect’ combustion [39,76]. The PC2 (24.3% of variance) was tightly clustered with PCBs loadings (around 0.7) and is a factor indicating the common source of PCBs, both dlPCBs and indPCBs. PCBs were clearly distinct from PCDD/Fs and PAHs as also reported in other studies [23]. PCBs emissions may be affected of the industries and chemical plants of Thriassion Plain while uncontrolled combustions of plastic may also enrich the aerosols with PCBs. The third factor (22.9% of variance) was associated with petrogenic, low molecular weight PAHs and DBaA, suggesting a common petrogenic origin [16]. The oil refineries in this site are a dominant source of emissions, and volatile compounds could release into the atmosphere from their petroleum depositories.

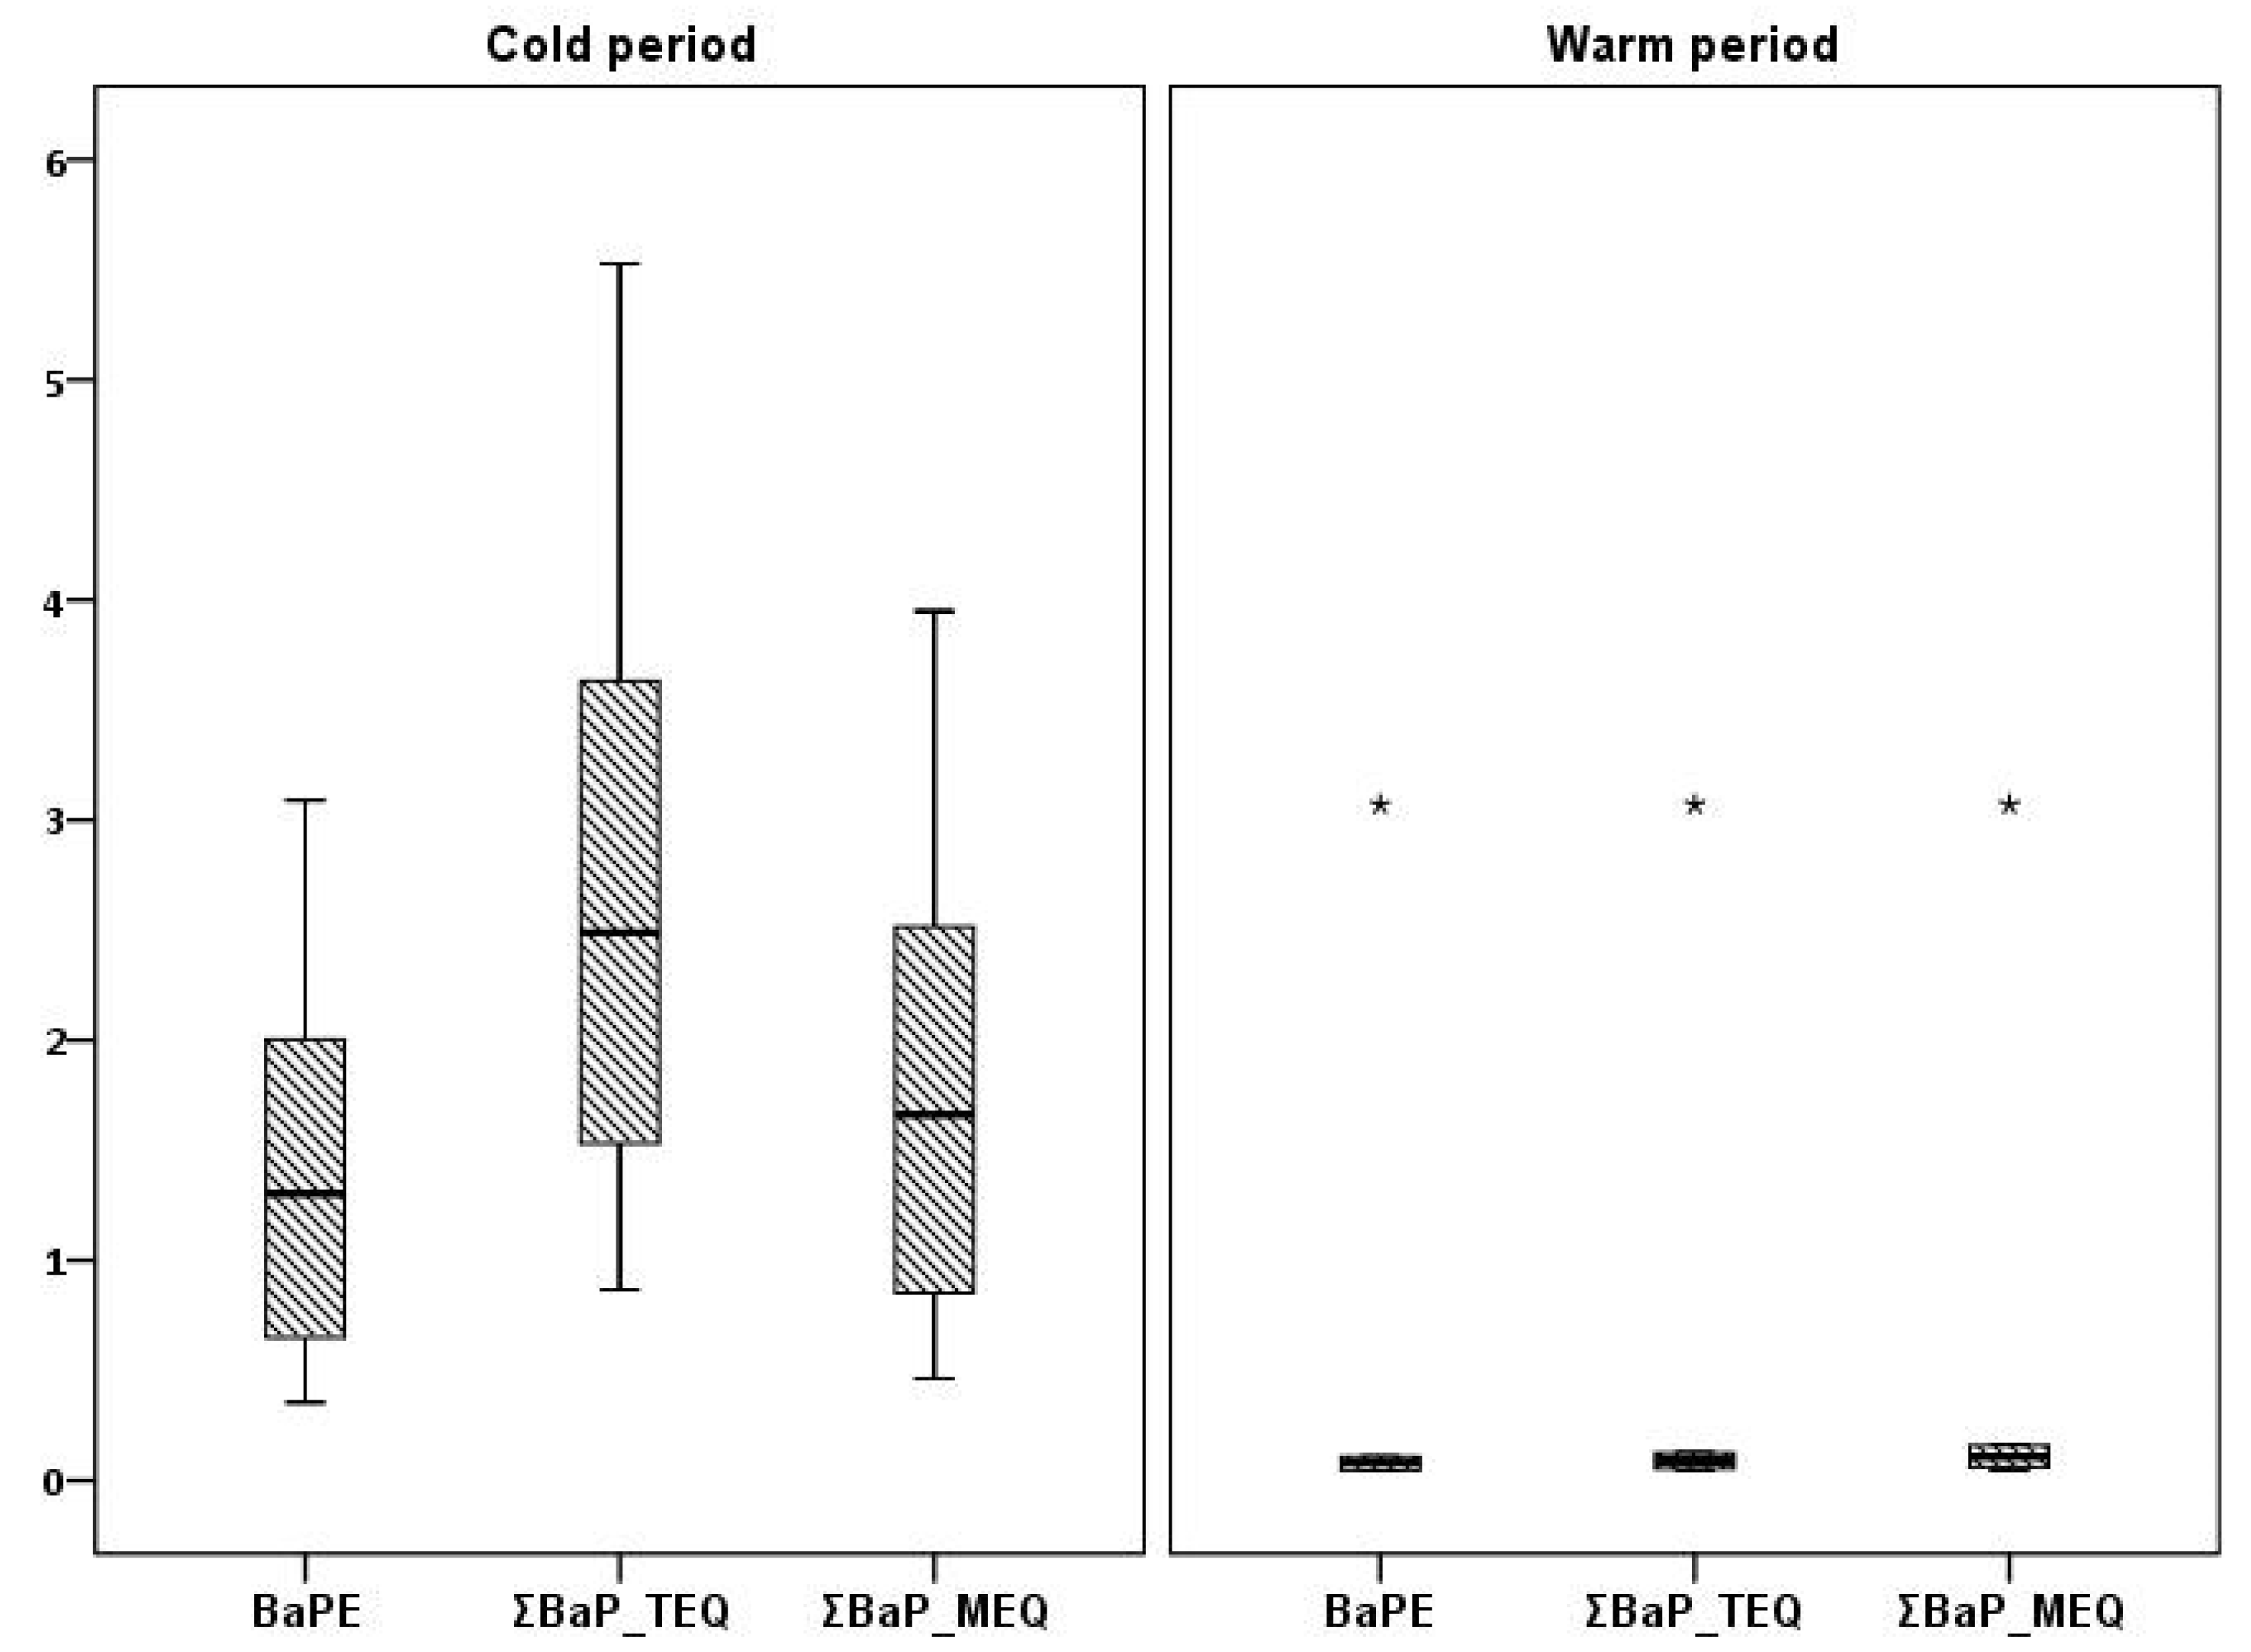
3.4. Health Risk Assessment

Starting with BaPE values, the average of 1.27 ng m−3 indicates increased toxicity of the particulate matter due to BaP related PAHs. The values were lower during the warm period (0.57 ng m−3) and are in agreement with our previous study in the area with values ranging from 0.14–4.6 ng m−3. Average ΣBaPTEQ in our study was found to be 2.29 ng m−3 (cold: 2.76 ng m−3, warm: 0.58 ng m−3), lower than in Aspropirgos (7.0 ng m−3 in autumn and 3.8 ng m−3 in winter months) [32], but higher than in Thessaloniki (1.5 ng m−3) [42]. Similar values were presented in Mestre, Venice with a BaPTEQ value of 3.6 ng m−3 during winter and 1.7 ng m−3 in autumn months [77]. Parallel seasonal patterns were calculated for ΣBaPMEQ with an average value of 1.61 ng m−3 (cold: 1.89 ng m−3, warm: 0.59 ng m−3). As it is clear from Figure 9, the cold period was strongly associated with increased toxicity of aerosol due to PAHs levels.
ICR, due to the toxicity of PAHs bound to PM10, was calculated with a mean value of 2.6 × 10⁻⁶ and 3.0 × 10⁻⁶ during the cold period and 1.1 × 10⁻⁶ during the warm period. ICR in Eleusis was higher than that calculated in Thessaloniki (1.6–1.7 × 10⁻⁶ during winter) [42], but in the same level with previous work in Thessaloniki with a value of 2.8 × 10⁻⁶ [78].
According to USEPA health risk evaluation procedure, the cancer risk from the investigated substances was calculated, and the total cancer risk from POPs in Eleusis was 3.6 × 10⁻⁵ (Table 6). This outcome could be translated as 3 to 4 cancer occurrences over 100,000 people living in Eleusis inside Thriassion Plain. The exposure in this area was considered significant as it exceeded the EPA limit of 1 × 10⁻⁶ and, as it is obvious in Table 8, cancer risks derived from PAHs, PCDD/Fs, and dlPCBs were individually above this threshold, with highest risk derived from PAHs (2.4 × 10⁻⁵). Cancer risks calculated in this study were higher than in the literature [2,45,56], but lower than the cancer risk (over 6.2 × 10⁻⁵) in Jiangsu Province, China, a place around chemical plants [16]. It has to be clarified here that risk evaluation for PCDD/Fs and dlPCBs may has been underestimated, as some particularly toxic congeners of PCDD/Fs (e.g., 2,3,7,8 TCDD, 1,2,3,7,8 PeCDD) and all dlPCBs are mostly presented in gas phase. Thus, the total cancer risk may be even higher than the calculated one.

4. Conclusions

An adequate descriptive profile of POPs contamination in particulate matter from the most affected atmosphere in Greece has been reported for the first time. Combustions were found to be the most important sources of atmospheric degradation by source apportionment tools. Although POPs concentrations were found at normal levels compared with studies from the available literature, the estimated cancer risk for the citizens was significantly elevated. As a result, the entire Thriassion Plain is a place that has to be fully monitored regarding POPs emissions, and strategies to this scope have to be scheduled and fulfilled.

Author Contributions

Conceptualization, E.B.; methodology, K.G.K., P.G.K.; software, K.G.K., P.G.K., E.C.; validation, K.G.K., P.G.K., D.C., I.V., L.L.; investigation, K.G.K., P.G.K., E.C.; data curation, K.G.K., P.G.K., E.B.; writing–original draft preparation, K.G.K., E.B.; writing–review & editing, K.G.K., P.G.K., E.C., D.C., I.V., L.L., E.B.; visualization, K.G.K., P.G.K.; supervision, E.B.; project administration, E.B. All authors have read and agreed to the published version of the manuscript.

Funding

This research received no external funding.

Conflicts of Interest

The authors declare no conflict of interest.

References

  1. El-Shahawi, M.; Hamza, A.; Bashammakh, A.; Al-Saggaf, W. An overview on the accumulation, distribution, transformations, toxicity and analytical methods for the monitoring of persistent organic pollutants. Talanta 2010, 80, 1587–1597. [Google Scholar] [CrossRef] [PubMed]
  2. Petrovic, M.; Sremacki, M.M.; Radonic, J.; Mihajlovic, I.; Obrovski, B.; Miloradov, M.V. Health risk assessment of PAHs, PCBs and OCPs in atmospheric air of municipal solid waste landfill in Novi Sad, Serbia. Sci. Total Environ. 2018, 644, 1201–1206. [Google Scholar] [CrossRef]
  3. Weber, R.; Watson, A.; Forter, M.; Oliaei, F. Review Article: Persistent organic pollutants and landfills—A review of past experiences and future challenges. Waste Manag. Res. 2011, 29, 107–121. [Google Scholar] [CrossRef] [PubMed]
  4. Hu, J.; Wu, J.; Xu, C.; Zha, X.; Hua, Y.; Yang, L.; Jin, J. Preliminary investigation of polychlorinated dibenzo-p-dioxin and dibenzofuran, polychlorinated naphthalene, and dioxin-like polychlorinated biphenyl concentrations in ambient air in an industrial park at the northeastern edge of the Tibet–Qinghai Plateau, China. Sci. Total. Environ. 2019, 648, 935–942. [Google Scholar] [PubMed]
  5. [UNEP] United Nations Environment Program. Persistant Organic Pollutants (POPs). 2017. Available online: www.unenvironment.org/explore-topics/chemicals-waste/what-wedo/persistent-organic-pollutants/why-do-persistent-organic (accessed on 28 October 2020).
  6. Zheng, G.J.; Leung, A.O.; Jiao, L.P.; Wong, M.H. Polychlorinated dibenzo-p-dioxins and dibenzofurans pollution in China: Sources, environmental levels and potential human health impacts. Environ. Int. 2008, 34, 1050–1061. [Google Scholar] [CrossRef] [PubMed]
  7. Kedikoglou, K.; Costopoulou, D.; Vassiliadou, I.; Bakeas, E.; Leondiadis, L. An effective and low cost carbon based clean-up method for PCDD/Fs and PCBs analysis in food. Chemosphere 2018, 206, 531–538. [Google Scholar] [CrossRef]
  8. Someya, M.; Ohtake, M.; Kunisue, T.; Subramanian, A.; Takahashi, S.; Chakraborty, P.; Ramachandran, R.; Tanabe, S. Persistent organic pollutants in breast milk of mothers residing around an open dumping site in Kolkata, India: Specific dioxin-like PCB levels and fish as a potential source. Environ. Int. 2010, 36, 27–35. [Google Scholar] [CrossRef]
  9. Abdel-Shafy, H.I.; Mansour, M.S. A review on polycyclic aromatic hydrocarbons: Source, environmental impact, effect on human health and remediation. Egypt. J. Pet. 2016, 25, 107–123. [Google Scholar] [CrossRef] [Green Version]
  10. Haritash, A.; Kaushik, C. Biodegradation aspects of Polycyclic Aromatic Hydrocarbons (PAHs): A review. J. Hazard. Mater. 2009, 169, 1–15. [Google Scholar] [CrossRef]
  11. De Craemer, S.; Croes, K.; Van Larebeke, N.; Sioen, I.; Schoeters, G.; Loots, I.; Nawrot, T.; Nelen, V.; Campo, L.; Fustinoni, S.; et al. Investigating unmetabolized polycyclic aromatic hydrocarbons in adolescents’ urine as biomarkers of environmental exposure. Chemosphere 2016, 155, 48–56. [Google Scholar] [CrossRef]
  12. ATSDR Agency for Toxic Substances and Disease Registry. Toxicological Profile for Polycyclic Aromatic Hydrocarbons; US Department of Health and Human Services: Atlanta, GA, USA, 1995.
  13. Boström, C.-E.; Gerde, P.; Hanberg, A.; Jernström, B.; Johansson, C.; Kyrklund, T.; Rannug, A.; Törnqvist, M.; Victorin, K.; Westerholm, R. Cancer risk assessment, indicators, and guidelines for polycyclic aromatic hydrocarbons in the ambient air. Environ. Health Perspect. 2002, 110 (Suppl. 3), 451–488. [Google Scholar] [CrossRef] [Green Version]
  14. IARC Some Non-Heterocyclic Polycyclic Aromatic Hydrocarbons and Some Related Exposures; IARC Monographs on the Evaluation of Carcinogenic Risks to Humans: Lyon, France, 2010.
  15. Vassiliadou, I.; Papadopoulos, A.; Costopoulou, D.; Vasiliadou, S.; Christoforou, S.; Leondiadis, L. Dioxin contamination after an accidental fire in the municipal landfill of Tagarades, Thessaloniki, Greece. Chemosphere 2009, 74, 879–884. [Google Scholar] [CrossRef] [PubMed]
  16. Liu, W.; Zhao, J.; Xu, S.; Liu, G.-B.; Tu, Y.; Shi, P.; Li, A. Concentrations, Sources, and Potential Human Health Risks of PCDD/Fs, dl-PCBs, and PAHs in Rural Atmosphere Around Chemical Plants in Jiangsu Province, China. Bull. Environ. Contam. Toxicol. 2020, 104, 846–851. [Google Scholar] [CrossRef] [PubMed]
  17. Dat, N.-D.; Tsai, C.-L.; Hsu, Y.-C.; Chen, Y.-W.; Weng, Y.-M.; Chang, M.B. PCDD/Fs and dl-PCBs concentrations in water samples of Taiwan. Chemosphere 2017, 173, 603–611. [Google Scholar] [CrossRef]
  18. Wu, J.; Hu, J.; Wang, S.; Jin, J.; Wang, R.; Wang, Y.; Jin, J. Levels, sources, and potential human health risks of PCNs, PCDD/Fs, and PCBs in an industrial area of Shandong Province, China. Chemosphere 2018, 199, 382–389. [Google Scholar] [CrossRef]
  19. Zhao, Y.; Zhan, J.; Liu, G.; Ren, Z.; Zheng, M.; Jin, R.; Yang, L.; Wang, M.; Jiang, X.; Zhang, X. Field study and theoretical evidence for the profiles and underlying mechanisms of PCDD/F formation in cement kilns co-incinerating municipal solid waste and sewage sludge. Waste Manag. 2017, 61, 337–344. [Google Scholar] [CrossRef]
  20. Martínez-Guijarro, K.; Ramadan, A.; Gevao, B. Atmospheric concentration of polychlorinated dibenzo-p-dioxins, polychlorinated dibenzofurans (PCDD/Fs) and dioxin-like polychlorinated biphenyls (dl-PCBs) at Umm-Al-Aish oil field-Kuwait. Chemosphere 2017, 168, 147–154. [Google Scholar] [CrossRef]
  21. Aydin, Y.M.; Kara, M.; Dumanoglu, Y.; Odabasi, M.; Elbir, T. Source apportionment of polycyclic aromatic hydrocarbons (PAHs) and polychlorinated biphenyls (PCBs) in ambient air of an industrial region in Turkey. Atmos. Environ. 2014, 97, 271–285. [Google Scholar] [CrossRef]
  22. Van den Berg, M.; Birnbaum, L.S.; Denison, M.; De Vito, M.; Farland, W.; Feeley, M.; Fiedler, H.; Hakansson, H.; Hanberg, A.; Haws, L.; et al. The 2005 World Health Organization Reevaluation of Human and Mammalian Toxic Equivalency Factors for Dioxins and Dioxin-Like Compounds. Toxicol. Sci. 2006, 93, 223–241. [Google Scholar] [CrossRef] [Green Version]
  23. Colombo, A.; Benfenati, E.; Bugatti, S.G.; Lodi, M.; Mariani, A.; Musmeci, L.; Rotella, G.; Senese, V.; Ziemacki, G.; Fanelli, R. PCDD/Fs and PCBs in ambient air in a highly industrialized city in Northern Italy. Chemosphere 2013, 90, 2352–2357. [Google Scholar] [CrossRef]
  24. Frignani, M.; Bellucci, L.G.; Carraro, C.; Raccanelli, S. Polychlorinated biphenyls in sediments of the Venice Lagoon. Chemosphere 2001, 43, 567–575. [Google Scholar] [CrossRef]
  25. World Health Organization. Health Risks of Persistent Organic Pollutants from Long-Range Transboundary Air Pollution. 2003. Available online: http://www.euro.who.int (accessed on 28 October 2020).
  26. World Health Organization. Persistent Organic Pollutants: Impact on Child Health; WHO Press: Geneva, Switzerland, 2010; ISBN 978 92 4 150110 1. [Google Scholar]
  27. Koukoulakis, K.; Kanellopoulos, P.; Chrysochou, E.; Koukoulas, V.; Minaidis, M.; Maropoulos, G.; Nikoleli, G.-P.; Bakeas, V.B. Leukemia and PAHs levels in human blood serum: Preliminary results from an adult cohort in Greece. Atmos. Pollut. Res. 2020, 11, 1552–1565. [Google Scholar] [CrossRef]
  28. IARC. IARC Monographs on the Evaluation of Carcinogenic Risks to Humans: Some Traditional Herbal Medicines, Some Mycotoxins, Naphthalene and Styrene. IARC Monogr. Eval. Carcinog. Risks Chem. Hum. 2002, 82, i-vi+1-551. [Google Scholar]
  29. IARC. Benzo[a]pyrene. IARC Monogr. 100F. 2012. Available online: https://monographs.iarc.fr/wp-content/uploads/2018/06/mono100F-14.pdf (accessed on 28 October 2020).
  30. IARC. IARC monographs on the evaluation of the carcinogenic risk of chemicals to humans. Polychlorinated biphenyls and polybrominated biphenyls. IARC Monogr. Eval. Carcinog. Risks Chem. Hum. 2016, 107, 1–501. [Google Scholar]
  31. Cazier, F.; Genevray, P.; Dewaele, D.; Nouali, H.; Verdin, A.; LeDoux, F.; Hachimi, A.; Courcot, L.; Billet, S.; Bouhsina, S.; et al. Characterisation and seasonal variations of particles in the atmosphere of rural, urban and industrial areas: Organic compounds. J. Environ. Sci. 2016, 44, 45–56. [Google Scholar] [CrossRef]
  32. Mandalakis, M.; Tsapakis, M.; Tsoga, A.; Stephanou, E.G. Gas–particle concentrations and distribution of aliphatic hydrocarbons, PAHs, PCBs and PCDD/Fs in the atmosphere of Athens (Greece). Atmos. Environ. 2002, 36, 4023–4035. [Google Scholar] [CrossRef]
  33. Lee, R.G.M.; Jones, K.C. Gas–particle partitioning of atmospheric PCDD/Fs: Measurements and observations on modelling. Environ. Sci. Technol. 1999, 33, 3596–3604. [Google Scholar] [CrossRef]
  34. Park, J.S.; Kim, J.G. Regional measurements of PCDD/PCDF concentrations in Korean atmosphere and comparison with gas–particle partitioning models. Chemosphere 2002, 49, 755–764. [Google Scholar] [CrossRef]
  35. Koukoulakis, K.; Chrysohou, E.; Kanellopoulos, P.; Karavoltsos, S.; Katsouras, G.; Dassenakis, M.; Nikolelis, D.; Bakeas, V.B. Trace elements bound to airborne PM10 in a heavily industrialized site nearby Athens: Seasonal patterns, emission sources, health implications. Atmos. Pollut. Res. 2019, 10, 1347–1356. [Google Scholar] [CrossRef]
  36. Kanellopoulos, P.G.; Verouti, E.; Chrysochou, E.; Koukoulakis, K.; Bakeas, V.B. Primary and secondary organic aerosol in an urban/industrial site: Sources, health implications and the role of plastic enriched waste burning. J. Environ. Sci. 2021, 99, 222–238. [Google Scholar] [CrossRef]
  37. Kanellopoulos, P.G.; Chrysochou, E.; Koukoulakis, K.; Vasileiadou, E.; Kizas, C.; Savvides, C.; Bakeas, V.B. Polar organic compounds in PM10 and PM2.5 atmospheric aerosols from a background Eastern Mediterranean site during the winter period: Secondary formation, distribution and source apportionment. Atmos. Environ. 2020, 237, 117622. [Google Scholar] [CrossRef]
  38. Li, X.; Li, Y.; Zhang, Q.; Wang, P.; Yang, H.; Jiang, G.; Wei, F. Evaluation of atmospheric sources of PCDD/Fs, PCBs and PBDEs around a steel industrial complex in northeast China using passive air samplers. Chemosphere 2011, 84, 957–963. [Google Scholar] [CrossRef] [PubMed]
  39. Ercan, Ö.; Dincer, F. Atmospheric concentrations of PCDD/Fs, PAHs, and metals in the vicinity of a cement plant in Istanbul. Air Qual. Atmos. Health 2015, 9, 159–172. [Google Scholar] [CrossRef]
  40. Jung, K.H.; Yan, B.; Chillrud, S.N.; Perera, F.P.; Whyatt, R.M.; Camann, D.; Kinney, P.L.; Miller, R.K. Assessment of Benzo(a)pyrene-equivalent Carcinogenicity and Mutagenicity of Residential Indoor versus Outdoor Polycyclic Aromatic Hydrocarbons Exposing Young Children in New York City. Int. J. Environ. Res. Public Health 2010, 7, 1889–1900. [Google Scholar] [CrossRef] [PubMed]
  41. Pereira, G.M.; Teinilä, K.; Custódio, D.; Santos, A.G.; Xian, H.; Hillamo, R.; Alves, C.; De Andrade, J.B.; Da Rocha, G.O.; Kumar, P.; et al. Particulate pollutants in the Brazilian city of São Paulo: 1-year investigation for the chemical composition and source apportionment. Atmos. Chem. Phys. Discuss. 2017, 17, 11943–11969. [Google Scholar] [CrossRef] [Green Version]
  42. Manoli, E.; Kouras, A.; Karagkiozidou, O.; Argyropoulos, G.; Voutsa, D.; Samara, C. Polycyclic aromatic hydrocarbons (PAHs) at traffic and urban background sites of northern Greece: Source apportionment of ambient PAH levels and PAH-induced lung cancer risk. Environ. Sci. Pollut. Res. 2016, 23, 3556–3568. [Google Scholar] [CrossRef] [PubMed]
  43. US EPA. United States Environmental Protection Agency (USEPA) Risk-Based Concentration Table 2012. Available online: http://www.epa.gov/reg3hwmd/risk/human/index.htm (accessed on 28 October 2020).
  44. US EPA. Human Health Risk Assessment Protocol for Hazardous Waste Combustion Facilities; U.S. Environmental Protection Agency: Washington, DC, USA, 1998.
  45. Čupr, P.; Flegrová, Z.; Franců, J.; Landlová, L.; Klánová, J. Mineralogical, chemical and toxicological characterization of urban air particles. Environ. Int. 2013, 54, 26–34. [Google Scholar] [CrossRef]
  46. OEHHA. Air Toxics Hot Spots Program Risk Assessment Guidelines. Part II: Technical Support Document for Describing Available Cancer Potency Factors; Office of Environmental Health Hazard Assessment: Sacramento, CA, USA, 2002.
  47. Mantis, J.; Chaloulakou, A.; Samara, C. PM10-bound polycyclic aromatic hydrocarbons (PAHs) in the Greater Area of Athens, Greece. Chemosphere 2005, 59, 593–604. [Google Scholar] [CrossRef]
  48. Manoli, E.; Chelioti-Chatzidimitriou, A.; Karageorgou, K.; Kouras, A.; Voutsa, D.; Samara, C.; Kampanos, I. Polycyclic aromatic hydrocarbons and trace elements bounded to airborne PM10 in the harbor of Volos, Greece: Implications for the impact of harbor activities. Atmos. Environ. 2017, 167, 61–72. [Google Scholar] [CrossRef]
  49. Vasilakos, C.; Veros, D.; Michopoulos, J.; Maggos, T.; O’Connor, C. Estimation of selected heavy metals and arsenic in PM10 aerosols in the ambient air of the Greater Athens Area, Greece. J. Hazard. Mater. 2007, 140, 389–398. [Google Scholar] [CrossRef]
  50. Directive, C. 107/EC of the European Parliament and of the Council of 15 December 2004: Relating to arsenic, cadmium, mercury, nickel and polycyclic aromatic hydrocarbons in ambient air (Fourth Daughter Directive). Off. J. Eur. Communities 2004, 26, 3–6. [Google Scholar]
  51. Directive, E. 50/EC of the European Parliament and of the Council of 21 May 2008 on ambient air quality and cleaner air for Europe. Off. J. Eur. Union 2008, 11, 1–44. [Google Scholar]
  52. Cheng, J.; Yuan, T.; Wu, Q.; Zhao, W.; Xie, H.; Ma, Y.; Ma, J.; Wang, W. PM10-bound Polycyclic Aromatic Hydrocarbons (PAHs) and Cancer Risk Estimation in the Atmosphere Surrounding an Industrial Area of Shanghai, China. Water Air Soil Pollut. 2007, 183, 437–446. [Google Scholar] [CrossRef]
  53. Kouimtzis, T.; Samara, C.; Voutsa, D.; Balafoutis, C.; Müller, L. PCDD/Fs and PCBs in airborne particulate matter of the greater Thessaloniki area, N. Greece. Chemosphere 2002, 47, 193–205. [Google Scholar] [CrossRef]
  54. Menichini, E.; Iacovella, N.; Monfredini, F.; Turrio-Baldassarri, L. Atmospheric pollution by PAHs, PCDD/Fs and PCBs simultaneously collected at a regional background site in central Italy and at an urban site in Rome. Chemosphere 2007, 69, 422–434. [Google Scholar] [CrossRef] [PubMed]
  55. Die, Q.; Nie, Z.; Liu, F.; Tian, Y.; Fang, Y.; Gao, H.; Tian, S.; He, J.; Huang, Q. Seasonal variations in atmospheric concentrations and gas-particle partitioning of PCDD/Fs and dioxin-like PCBs around industrial sites in Shanghai, China. Atmos. Environ. 2015, 119, 220–227. [Google Scholar] [CrossRef]
  56. Degrendele, C.; Okonski, K.; Melymuk, L.; Landlová, L.; Kukučka, P.; Čupr, P.; Klánová, J. Size specific distribution of the atmospheric particulate PCDD/Fs, dl-PCBs and PAHs on a seasonal scale: Implications for cancer risks from inhalation. Atmos. Environ. 2014, 98, 410–416. [Google Scholar] [CrossRef]
  57. Muñoz-Arnanz, J.; Roscales, J.L.; Vicente, A.; Ros, M.; Barrios, L.; Morales, L.; Abad, E.; Jiménez, B. Assessment of POPs in air from Spain using passive sampling from2008 to 2015. Part II: Spatial and temporal observations of PCDD/Fs and dl-PCBs. Sci. Total Environ. 2018, 634, 1669–1679. [Google Scholar] [CrossRef] [PubMed]
  58. Lohmann, R.; Jones, K.C. Dioxins and furans in air and deposition: A review of levels, behaviour and processes. Sci. Total Environ. 1998, 219, 53–81. [Google Scholar] [CrossRef]
  59. Government of Germany Report of the Federal Immission Control Committee (in German). 2004. Available online: https://www.lai-immissionsschutz.de/servlet/is/20170/LAI_Schutz_Publikum_Schalleinwirkungen_Anhaenge.pdf?command=downloadContent&filename=LAI_Schutz_Publikum_Schalleinwirkungen_Anhaenge.pdf (accessed on 28 October 2020).
  60. Government of Japan. Information Brochure Dioxins. 2012. Available online: https://www.env.go.jp/en/chemi/dioxins/brochure2012.pdf (accessed on 28 October 2020).
  61. Choi, S.D.; Baek, S.Y.; Chang, Y.S. Atmospheric levels and distribution of dioxin-like polychlorinated biphenyls (PCBs) and polybrominated diphenyl ethers (PBDEs) in the vicinity of an iron and steel making plant. Atmos. Environ. 2008, 42, 2479–2488. [Google Scholar] [CrossRef]
  62. Trinh, M.M.; Tsai, C.L.; Hien, T.T.; Thuan, N.T.; Chi, K.H.; Lien, C.G.; Chang, M.B. Atmospheric concentrations and gas-particle partitioning of PCDD/Fs and dioxin-like PCBs around Hochiminh city. Chemosphere 2018, 202, 246–254. [Google Scholar] [CrossRef] [PubMed]
  63. Coutinho, M.; Pereira, M.; Borrego, C. Monitoring of ambient air PCDD/F levels in Portugal. Chemosphere 2007, 67, 1715–1721. [Google Scholar] [CrossRef] [PubMed] [Green Version]
  64. Min, Y.; Lee, M.; Kim, D.; Heo, J. Annual and seasonal variations in atmospheric PCDDs/PCDFs and dioxin-like PCBs levels in satellite cities of Seoul, Korea during 2003–2009. Atmos. Environ. 2013, 77, 222–230. [Google Scholar] [CrossRef]
  65. Finardi, S.; Radice, P.; Cecinato, A.; Gariazzo, C.; Gherardi, M.; Romagnoli, P. Seasonal variation of PAHs concentration and source attribution through diagnostic ratios analysis. Urban Clim. 2017, 22, 19–34. [Google Scholar] [CrossRef]
  66. Pateraki, S.; Fameli, K.M.; Assimakopoulos, V.; Bougiatioti, A.; Maggos, T.; Mihalopoulos, N. Levels, sources and health risk of PM2.5 and PM1-bound PAHs across the Greater Athens Area: The role of the type of environment and the meteorology. Atmosphere 2019, 10, 622. [Google Scholar] [CrossRef] [Green Version]
  67. Katsoyiannis, A.; Sweetman, A.J.; Jones, K.C. PAH molecular diagnostic ratios applied to atmospheric sources: A critical evaluation using two decades of source inventory and air concentration data from the UK. Environ. Sci. Technol. 2011, 45, 8897–8906. [Google Scholar] [CrossRef]
  68. Tobiszewski, M.; Namieśnik, J. PAH diagnostic ratios for the identification of pollution emission sources. Environ. Pollut. 2012, 162, 110–119. [Google Scholar] [CrossRef]
  69. Duarte-Davidson, R.; Stewart, A.; Alcock, R.E.; Cousins, I.T.; Jones, K.C. Exploring the balance between sources, deposition, and the environmental burden of PCDD/Fs in the U.K. terrestrial environment: An aid to identifying uncertainties and research needs. Environ. Sci. Technol. 1997, 31, 1–11. [Google Scholar] [CrossRef]
  70. Motelay-Massei, A.; Harner, T.; Shoeib, M.; Diamond, M.; Stern, G.; Rosenberg, B. Using passive air samplers to assess urban–rural trends for persistent organic pollutants and polycyclic aromatic hydrocarbons. 2. Seasonal trends for PAHs, PCBs, and organochlorine pesticides. Environ. Sci. Technol. 2005, 39, 5763–5773. [Google Scholar] [CrossRef]
  71. Baek, S.Y.; Choi, S.D.; Park, H.; Kang, J.H.; Chang, Y.S. Spatial and seasonal distribution of polychlorinated biphenyls (PCBs) in the vicinity of an iron and steel making plant. Environ. Sci. Technol. 2010, 44, 3035–3040. [Google Scholar] [CrossRef]
  72. Cleverly, D.; Ferrario, J.; Byrne, C.; Riggs, K.; Joseph, D.; Hartford, P. A general indication of the contemporary background levels of PCDDs, PCDFs, and coplanar PCBs in the ambient air over rural and remote areas of the United States. Environ. Sci. Technol. 2007, 41, 1537–1544. [Google Scholar] [CrossRef] [PubMed]
  73. Guo, H.; Lee, S.C.; Ho, K.F.; Wang, X.M.; Zou, S.C. Particle-associated polycyclic aromatic hydrocarbons in urban air of Hong Kong. Atmos. Environ. 2003, 37, 5307–5317. [Google Scholar] [CrossRef]
  74. Sienra, M.D.R.; Rosazza, N.G.; Préndez, M. Polycyclic aromatic hydrocarbons and their molecular diagnostic ratios in urban atmospheric respirable particulate matter. Atmos. Res. 2005, 75, 267–281. [Google Scholar] [CrossRef]
  75. Xu, M.X.; Yan, J.H.; Lu, S.Y.; Li, X.D.; Chen, T.; Ni, M.J.; Dai, H.F.; Wang, F.; Cen, K.F. Concentrations, profiles, and sources of atmospheric PCDD/Fs near a municipal solid waste incinerator in Eastern China. Environ. Sci. Technol. 2009, 43, 1023–1029. [Google Scholar] [CrossRef]
  76. Yang, H.H.; Chen, C.M. Emission inventory and sources of polycyclic aromatic hydrocarbons in the atmosphere at a suburban area in Taiwan. Chemosphere 2004, 56, 879–887. [Google Scholar] [CrossRef] [PubMed]
  77. Masiol, M.; Hofer, A.; Squizzato, S.; Piazza, R.; Rampazzo, G.; Pavoni, B. Carcinogenic and mutagenic risk associated to airborne particle-phase polycyclic aromatic hydrocarbons: A source apportionment. Atmos. Environ. 2012, 60, 375–382. [Google Scholar] [CrossRef]
  78. Sarigiannis, D.A.; Karakitsios, S.P.; Zikopoulos, D.; Nikolaki, S.; Kermenidou, M. Lung cancer risk from PAHs emitted from biomass combustion. Environ. Res. 2015, 137, 147–156. [Google Scholar] [CrossRef]
Figure 1. The sampling point in the Thriassion Plain and the nearby capital Athens.
Applsci 10 09023 g001
Figure 2. PAH seasonal variations in ng m−3 (* outliers and o values above 3rd quartile).
Applsci 10 09023 g002
Figure 3. Relative abundance among PAH compounds for the cold and warm periods.
Applsci 10 09023 g003
Figure 4. Relative abundance among indPCB congeners for the cold and warm periods.
Applsci 10 09023 g004
Figure 5. PCDD/F seasonal variations in pg m−3 (* outliers and o values above 3rd quartile).
Applsci 10 09023 g005
Figure 6. WHO-TEQ2005 seasonal variations for PCDD/Fs and dlPCBs (* outliers and o values above 3rd quartile).
Applsci 10 09023 g006
Figure 7. Relative abundance among PCDD/F congeners for the cold and warm periods.
Applsci 10 09023 g007
Figure 8. Relative abundance among dlPCB congeners for the cold and warm periods.
Applsci 10 09023 g008
Figure 9. Seasonal variation of BaPE, ΣBaPTEQ, and ΣBaPMΕQ (* outliers).
Applsci 10 09023 g009
Table 1. Average, median, and ranged concentrations of polycyclic aromatic hydrocarbons (PAHs) (ng m−3) for the overall and seasonally divided sampling period. NAP: Naphthalene; ACY: Acenaphthylene; ACE: Acenaphthene; FL: Fluorene; PHE: Phenanthrene; ANT: Anthracene; FLT: Fluoranthene; PYR: Pyrene; CHR: Chrysene; BaA: Benzo[a]anthracene; BbkF: Benzo[b,k]fluoranthenes; BaP: Benzo[a]pyrene; IPY: Indeno[1,2,3 cd]pyrene; DBaA: Dibenzo[a,h]anthracene; BPE: Benzo[ghi]perylene.
NAPACYACEFLPHEANTFLTPYRCHRBaABbkFBaPIPYDBaABPEΣPAHs
Overall Sampling Campaign (N = 30)
Average0.220.030.030.060.350.290.230.340.600.501.820.930.800.200.657.07
Median0.170.0070.00010.060.300.300.180.340.490.391.540.660.690.190.596.12
Range0.05–0.670.0002–0.210.0001–0.200.02–0.120.19–0.790.06–0.510.05–0.690.05–0.730.00009–2.940.0002–1.630.0001–4.380.04–3.070.00005–1.860.00002–0.500.00003–1.591.27–16.5
Cold Period (N = 15)
Average0.240.030.040.060.370.300.260.340.740.632.321.031.000.250.828.44
Median0.190.0020.00010.060.310.320.210.300.600.732.390.900.990.240.768.88
Range0.07–0.670.002–0.210.0001–0.200.02–0.120.19–0.790.06–0.510.05–0.690.05–0.730.00009–2.940.09–1.630.36–4.380.23–2.340.32–1.860.10–0.500.24–1.592.88–16.5
Warm Period (N = 15)
Average0.150.040.030.040.270.280.110.340.050.030.00010.570.050.000020.042.01
Median0.130.030.00010.040.280.280.110.340.000090.040.00010.070.000050.000020.041.60
Range0.05–0.370.01–0.070.0001–0.180.02–0.060.21–0.310.22–0.330.09–0.150.32–0.360.00009–0.170.0002–0.060.0001–0.00010.04–3.070.0005–0.14<0.00020.00003–0.091.27–4.46
Table 2. Average, median, and ranged concentrations of indicator polychlorinated biphenyls (indPCBs) (pg m−3) for the overall and seasonally divided sampling period.
PCB-28PCB-52PCB-101PCB-138PCB-153PCB-180ΣPCBs
Overall Sampling Campaign (N = 30)
Average7.961.822.862.302.011.1818.1
Median8.251.712.562.261.831.1117.4
Range4.53–11.71.09–2.941.34–5.781.68–3.801.18–3.300.66–1.8711.4–26.6
Cold Period (N = 15)
Average7.361.932.472.262.341.2917.6
Median7.491.862.532.352.301.2117.1
Range4.53–9.371.09–2.941.63–3.371.72–3.071.56–3.300.80–1.8711.6–22.4
Warm Period (N = 15)
Average8.561.723.242.341.671.0718.6
Median8.461.622.802.131.580.9417.6
Range4.60–11.71.10–2.321.34–5.781.68–3.801.18–2.330.66–1.7311.4–26.6
Table 3. Average, median, and ranged concentrations of polychlorinated dibenzo-p-dioxins/dibenzofurans (PCDD/Fs) (fg m−3) for the overall and seasonally divided sampling period.
2,3,7,8-ΤCDD1,2,3,7,8-PeCDD1,2,3,4,7,8-HxCDD1,2,3,6,7,8-HxCDD1,2,3,7,8,9-HxCDD1,2,3,4,6,7,8-HpCDDOCDDΣPCDDs2,3,7,8-TCDF1,2,3,7,8-PeCDF2,3,4,7,8-PeCDF1,2,3,4,7,8-HxCDF1,2,3,6,7,8-HxCDF2,3,4,6,7,8-HxCDF1,2,3,7,8,9-HxCDF1,2,3,4,6,7,8-HpCDF1,2,3,4,7,8,9-HpCDFOCDFΣPCDFsWHO-TEQ PCDD/Fs
Overall Sampling Campaign (N = 30)
Average1.812.352.582.693.1933.21722171.832.646.9313.810.421.64.251299.93279479656
Median1.811.811.811.811.8110.81111671.811.811.813.931.922.882.1455.13.8994.0325444
Range<1.811.81–4.751.81–7.701.81–7.531.81–7.531.81–16710.4–51029.8–5281.81–2.071.81–14.01.81–74.51.81–99.31.81–77.21.81–1721.81–18.31.81–5691.81–39.62.75–291252.8–2945287–2560
Cold Period (N = 15)
Average1.812.532.412.962.4550.21514271.833.4311.224.818.039.65.8419312.8128439914
Median1.811.811.812.072.0734.01143271.811.812.078.5010.58.593.281416.8486.4311692
Range<1.811.81–4.671.81–5.011.81–7.351.81–5.365.43–16710.4–306157–8611.81–2.071.81–74.51.81–74.51.81–99.31.81–77.21.81–1721.81–18.35.06–5691.81–32.720.8–40852.9–1176332–2560
Warm Period (N = 15)
Average1.812.172.752.423.9316.31922211.831.852.662.792.783.572.6664.17.06429519398
Median1.811.811.811.811.813.5196.61701.811.811.811.811.812.021.8126.31.81181339366
Range<1.811.81–4.751.81–7.701.81–7.531.81–20.61.81–97.617.2–51029.8–5271.81–2.031.81–2.211.81–8.851.81–5.361.81–7.151.81–11.81.81–8.661.81–2791.81–39.62.75–291263–2945287–544
Table 4. Average, median, and ranged concentrations of dioxin like PCBs (dlPCBs) (fg m−3) for the overall and seasonally divided sampling period.
PCB-77PCB-81PCB-126PCB-169PCB-105PCB-114PCB-118PCB-123PCB-156PCB-157PCB-167PCB-189ΣdlPCBsWHO-TEQ dlPCBs
Non- Ortho PCBsMono- Ortho PCBs
Overall Sampling Campaign (N = 30)
Average85.86.2822.46.3723836.375262.410175.720840.51634137
Median72.95.4517.15.2518636.359460.892.974.515636.31438105
Range41.2–2681.81–19.08.26–86.61.81–22.0113–634<36.3453–202936.3–14336.0–25936.3–18836.3–96936.3–116975–408353.1–512
Cold Period (N = 15)
Average75.45.7221.47.5119036.363761.510493.311237.41382136
Median74.05.6117.26.4018436.358663.793.587.174.336.31290105
Range41.2–1131.99–9.338.47–35.61.81–14.7146–287<36.3505–87141.0–94.036.0–19536.3–18836.3–32436.3–43.91092–189362.5–217
Warm Period (N = 15)
Average96.36.8023.35.2428736.386763.397.258.030343.51887139
Median71.65.1616.02.7623736.381542.585.151.623836.3159293.9
Range50.8–2681.81–19.08.26–86.61.81–22.0113–634<36.3453–202936.3–14337.6–25936.3–81.236.3–96936.3–116975–408353.1–512
Table 6. MDRs (molecular diagnostic ratios) for the whole sampling campaign and their interpretation from literature [67].
Petrogenic OriginPyrogenic OriginThis Study
MeanColdWarm
ANT/(ANT + PHE)<0.1>0.10.460.450.51
BaA/(BaA + CHR)<0.2>0.350.560.510.62
FLT/(FLT + PYR)<0.4>0.40.460.470.45
IPY/(IPY + BPE)<0.2>0.20.550.560.52
Table 7. Principal component analysis in the whole sampling campaign.
PC1PC2PC3
Explained Variance36.2%24.3%22.9%
NAP−0.3990.329−0.213
ACY−0.223−0.2580.114
ACE0.3300.307−0.205
FL−0.1980.2100.763
PHE−0.027−0.0480.805
ANT0.439−0.077−0.260
FLT0.1160.2040.893
PYR0.1320.3700.848
CHR0.7550.4200.525
BaA0.7290.3980.501
BbkF0.7590.1820.491
BaP0.8050.026−0.005
IPY0.8210.1240.448
DBaA0.5340.3400.748
BPE0.8080.1120.433
1,2,3,7,8- PeCDD0.3140.2870.056
1,2,3,4,7,8- HxCDD0.785−0.1190.444
1,2,3,6,7,8- HxCDD−0.362−0.0290.338
1,2,3,7,8,9- HxCDD−0.173−0.3880.345
1,2,3,4,6,7,8- HpCDD0.7680.2680.015
OCDD0.1310.064−0.580
2,3,7,8- TCDF0.664−0.362−0.080
1,2,3,7,8- PeCDF0.788−0.227−0.023
2,3,4,7,8- PeCDF0.7720.499−0.174
1,2,3,4,7,8- HxCDF0.815−0.070−0.161
1,2,3,6,7,8- HxCDF0.7430.554−0.018
2,3,4,6,7,8- HxCDF0.8790.234−0.135
1,2,3,7,8,9- HxCDF0.6220.531−0.044
1,2,3,4,6,7,8- HpCDF0.8890.180−0.104
1,2,3,4,7,8,9- HpCDF0.497−0.1060.182
OCDF−0.0870.040−0.452
PCB-770.2700.1130.082
PCB-81−0.069−0.2510.010
PCB-1260.0790.7790.223
PCB-1690.1320.6000.570
PCB-105−0.0490.313−0.360
PCB-118−0.0620.583−0.388
PCB-123−0.2010.686−0.184
PCB-1560.1690.7200.128
PCB-1570.2860.7060.234
PCB-167−0.067−0.489−0.055
PCB-189−0.0820.4550.294
PCB-280.1080.384−0.630
PCB-520.2380.717−0.269
PCB-101−0.2660.473−0.472
PCB-138−0.0100.838−0.236
PCB-1530.1630.8320.216
PCB-180−0.2380.6510.299
Table 8. Cancer risk for PAHs, PCDD/Fs, and dlPCBs and total risk for citizens of Eleusis.
Cancer Risk
ΣRiskPAHs2.4 × 10−5
ΣRiskPCDD/Fs9.9 × 10−6
ΣRiskdlPCBs1.6 × 10−6
Total Cancer Risk3.6 × 10−5
Publisher’s Note: MDPI stays neutral with regard to jurisdictional claims in published maps and institutional affiliations.

