Article

The Effects of Hydrogen Distribution on the Elastic Properties and Hydrogen-Induced Hardening and Softening of α-Fe

1
Department of Physics, University of Science and Technology Beijing, Beijing 100083, China
2
Advanced Manufacturing Technology Research Centre, Department of Industrial and Systems Engineering, The Hong Kong Polytechnic University, Hung Hom, Kowloon, Hong Kong, China
3
Hong Kong Polytechnic University Shenzhen Research Institute, Shenzhen 518057, China
4
Department of Mechanical Engineering, The Hong Kong Polytechnic University, Hung Hom, Kowloon, Hong Kong, China
*
Author to whom correspondence should be addressed.
Appl. Sci. 2020, 10(24), 8958; https://doi.org/10.3390/app10248958
Submission received: 27 October 2020 / Revised: 7 December 2020 / Accepted: 11 December 2020 / Published: 15 December 2020
(This article belongs to the Section Materials Science and Engineering)

Abstract

:
In this work, we conducted a high-throughput atomistic simulation of the interstitial solid solutions of hydrogen in α-Fe. The elastic constants and moduli were calculated. Through statistical analysis of structures and results, the influences of the microscopic distribution of hydrogen on the elastic moduli, as well as hydrogen-induced hardening and softening, are discussed. We found that even though the uniformly distributed hydrogen caused slight softening in α-Fe, the distribution of hydrogen at different adjacent positions significantly affected the elastic moduli. For example, hydrogen increased the Young’s modulus and shear modulus at the 5th and 10th nearest neighbors, resulting in hardening, but decreased the bulk modulus at the 7th nearest neighbor, making the material easier to compress. These phenomena are related to the distribution densities of the positions that hydrogen atoms can occupy on the two major slip families, {110} and {112}, at different nearest neighbors distinguished by distances.

1. Introduction

In the manufacturing or service life of structural materials, such as iron and steel, a small number of hydrogen atoms dissolved in the matrix will change the structures even under extremely low loads, seriously reducing the mechanical properties and causing sudden failures and fractures, which are known as hydrogen embrittlement (HE) [1,2,3,4]. HE affects the strength of materials and is related to the interactions between hydrogen and dislocations. The hydrogen-enhanced decohesion (HEDE) mechanism suggests that the accumulated hydrogen atoms under stress will reduce the lattice strength or surface binding [3,5,6]. According to the hydrogen-enhanced local plasticity (HELP) mechanism, hydrogen promotes the emission, multiplication, and motion of dislocations, which cause the localization of shears and slips, suppress the cross slips and promote planarity of the shears and slips, thus causing HE [2,7,8,9].
Hydrogen has a complex effect on the strength of materials. In the bulk of pure iron and ferroalloys, both softening and hardening can be caused when hydrogen is uniformly distributed, which is generally considered to be determined by the interaction between hydrogen and dislocations. For example, if hydrogen decreases the elastic shielding effect on dislocations [10], pinning the screw dislocation kinks [11,12,13,14], this will lead to hardening. If hydrogen increases the elastic shielding effect on dislocations [10], increasing the mobility of dislocations [10,13,14,15,16,17], or prompting the nucleation or separation of the kinks of dislocations [12,14], this will cause softening. This effect varies with temperatures [11,18,19], hydrogen concentrations (cH) [19,20,21], sample purities [22,23], strain rates [10,15,24], hydrogen-charging methods [21], and even surface conditions [25,26].
However, softening can also occur due to the decrease of lattice flow stress [26] and Young’s modulus [16,17], and first-principle calculations demonstrated that pure iron softens due to volume expansion at large cH [27]. As the unstable stacking fault energies (γus) of the two major slip systems {110}<111> and {112}<111> in α-Fe single crystals have different trends and vary greatly with cH [28], the microscopic distribution of hydrogen may also affect the elastic moduli and the behaviors of dislocations. It is difficult to keep the ideal uniform distribution of hydrogen when HE occurs, and studies have indicated that hardening and softening can occur locally [13,14,20]. Therefore, it is helpful to understand the HE of iron and steel by studying the hardening and softening of α-Fe caused by the hydrogen distributions.
The difficulty of detecting hydrogen atoms in materials in experiments [1] led to the extensive use of atomistic simulations, such as the studies of hydrogen-induced hardening and softening [27], the interactions of hydrogen and screw dislocations [14], and the interactions of dislocations and HE [28,29,30]. With the development of statistics, it has become possible to process large amounts of data for high-throughput atomistic simulations, and such technologies have been applied in new materials discoveries, the synthesis of compounds, and phase transformation studies [31,32,33]. Previously, we also combined atomistic simulations with statistics to study the connections between the microscopic distribution of hydrogen in α-Fe single crystals and HE [34]. In this work, we performed clustering after calculating the elastic constants and moduli of the interstitial solid solutions of hydrogen in α-Fe under different cH using atomistic simulations, and we discuss the hardening and softening induced by the microscopic distribution of hydrogen with structural analysis.

2. Calculation Methods

2.1. Elastic Constants

In this work, by using the large-scale atomic/molecular massively parallel simulator (LAMMPS) [35], we performed the molecular statics (MS) and molecular dynamics (MD) simulations for structural relaxations and the calculations of the elastic constant tensor C . The Fe–Fe interaction is described by the embedded atom method (EAM) potential developed by Mendelev [36], and the Fe–H interaction is fitted by Ramasfubramaniam et al. [37].
C is defined by Hooke’s law:
σ = C ε
where σ and ε are the stress and strain tensors, respectively. Each component of σ is calculated according to the following formula [38]:
σ i j = 1 V ( a N m a v a i v a j + a N r a i f a j )
V is the volume; fa is the force applied to atom a by other atoms. Respectively, ma, va, and ra are the mass, velocity, and position vector of atom a. Different orientations are denoted by i, j; N is the total number of atoms in the system; and N′ is the number considering the periodic image atoms.
For cubic structures, C has only three independent components: C11, C12, and C44. If a deformation is applied to a single direction, it satisfies:
C i j = σ i / ε j
where i, j = 1, 2, 4, which, respectively, represent the stretching along the x, y axis, and the angle change between the y, z directions. In this work, εj = 0.00001; for accuracy, we rotate the x, y, and z axes, and then average the results when calculating Cij.
The influence of interstitial hydrogen atoms on the elastic parameters is often decomposed into a linear combination of various factors. For example, Psiachos et al. considered the elastic parameters of α-Fe single crystals under high cH as effects of the chemical interactions and volume expansion [27]. Zhang et al. decomposed the increase of the Young’s modulus under hydrogen-charging conditions into the hydrogen-induced changes in cohesion energy and the effect of stresses [39]. Similarly to them, we write the elastic constant Cij of the structure q as follows:
C i j q ( c H ) = C i j p ( c H ) + Δ C i j d i s , q ( c H ) + Δ C i j d e f , q ( c H , c d e f )   = C i j   ( 0 ) + Δ C i j c o h ( c H ) + Δ C i j v o l ( Δ V ( c H ) ) + Δ C i j d i s , q ( c H ) + Δ C i j d e f , q ( c H , c d e f )
in which p is the structure number. C i j p ( c H ) is the average value of Cij for all structures with hydrogen concentration of cH, representing the elastic constant of the solid solution of hydrogen perfectly uniformly distributed in α-Fe. It is decomposed into the elastic constant C i j   ( 0 ) of pure α-Fe single crystal; the change Δ C i j c o h ( c H ) caused by the cohesion of iron and hydrogen; and the change Δ C i j v o l ( Δ V ( c H ) ) caused by the volume change of Δ V ( c H ) .
Δ C i j d i s , q ( c H ) is the deviation of the elastic constant of structure q from the average result, which is caused by the deviation of hydrogen from the ideal uniform distribution in microscopic distribution. Δ C i j d e f , q ( c H , c d e f ) is the change in elastic constant caused by the concentration of other defects ( c d e f ) except for the interstitial hydrogen atoms.
In this work, as Δ C i j d e f , q ( c H , c d e f ) is not considered for the time being, Equation (4) can be simplified as:
C i j q ( c H ) = C i j p ( c H )   + Δ C i j d i s , q ( c H )     =   C i j   ( 0 ) + Δ C i j c o h ( c H ) + Δ C i j v o l ( Δ V ( c H ) ) + Δ C i j d i s , q ( c H )
where C i j   ( 0 ) is calculated by using MS according to Equation (3), and its structure is established by periodically stacking the unit cells of α-Fe along the three axes 52 times each, with a total of 281216 iron atoms. The cell lattice constant is 2.85573Å. C i j q ( c H ) , which is calculated using a similar method, but with randomly inserted hydrogen atoms (with concentrations of cH ∈ [0.0002, 0.01]) in the sites of the tetrahedral interstitials (Tet-sites) using the Knuth-shuffle algorithm [40] after stacking the super cell when making structures.
The changes of volume and its influences on the elasticity of α-Fe can be connected by temperatures, as the variations of volume with temperature (T) (expressed as Δ V ( T ) = V ( T ) V ( 0 ) ) can be calculated by relaxing the structures under different temperatures in the isothermal–isobaric (NPT, N, P, and T denote the given particle number, pressure, and temperature, respectively) ensemble [41,42]. Each structure consists of α-Fe unit cells stacked for 10 cycles along the three axes, and a total of 2000 iron atoms. With the time step ts = 0.1 fs, the equilibrium structure Se and the system volume V(T) were obtained after running 50,000 steps at each temperature T. We use Equation (6) to fit the results:
Δ V ( T ) = y 1 + b 1 e T / b 2
where y1, b1, and b2 are the parameters to be determined.
The elastic constants at finite temperatures were obtained using the fluctuation method. Using Se as the initial structure, when T is not too high, there is [43]:
C i j k l ( T ) = ε i j σ m n ε m n ε k l 1
where i, j, k, l, m, n = 1, 2, 3. Given strain εj, Equation (7) is simplified as follows for the body-centered cubic (bcc) structures:
C i j ( T ) = σ i / ε j
where i, j = 1, 2, 4. Accordingly, C i j ( T ) can be calculated in the NhT ensemble (N, h, and T denote the given particle number, scale matrix, and temperature, respectively) [44]. In this work, let ts= 0.1 fs, T ∈ [3, 500] K, Se is relaxed under the NhT ensemble [41,42] for 10,000 steps, and strain εj = 0.01 is applied in each direction. After each strain was applied, 3000 steps were run under the NhT ensemble.
The variations of Cij with temperature T was fitted by Equation (9):
Δ C i j t e m p ( T ) = C i j ( T ) C i j ( 0 ) = y 2 i j + b 3 i j e T / b 4 i j
where y 2 i j ,   b 3 i j , and b 4 i j are the undetermined parameters. Substituting them to Equation (6), we obtain:
Δ C i j v o l ( Δ V ) = y 2 i j + b 3 i j ( Δ V y 1 b 1 ) b 2 / b 4 i j
Averaging the results of many structures under the same cH eliminates Δ C i j d i s , q ( c H ) ; thus, the Δ C i j c o h ( c H ) can be calculated from Equation (11):
Δ C i j c o h ( c H ) = 1 N p = 1 N ( C i j p ( c H ) C i j   ( 0 ) Δ C i j v o l ( Δ V p ) )
where N is the total number of structures and Δ V p is the equilibrium volume of structure p. First-principle calculations show that, for maintaining structural stability, the space between hydrogen atoms in the equilibrium structure of iron should be greater than 2.1 Å [45], or greater than the fourth-nearest neighbor (4NN) distance between the Tet-sites that can be occupied by hydrogen atoms [27]. Therefore, we generated hundreds of structures under each cH for relaxation and screening, so that the number of calculated structures at each cH was no less than 50. At cH = 0.8% we obtained 101 structures, which was the most of all cH.

2.2. Hardening and Softening Due to Hydrogen Microscopic Distribution

According to the Voigt–Reuss–Hill polycrystalline approximation, Young’s modulus E, the bulk modulus B, and shear modulus G can be obtained from Cij [46]
E = ( C 11 C 12 + 3 C 44 ) ( C 11 + 2 C 12 ) 2 C 11 + 3 C 12 + C 44 B = 1 3 ( C 11 + 2 C 12 ) G = 1 5 ( C 11 + 3 C 44 C 12 )
They can reflect the strength, stiffness, and hardness of materials [27]. Denoting these moduli as M, the following results can be obtained:
M ( c H ) = M ( C ( c H ) ) Δ M v o l ( Δ V ) = M ( C ( 0 ) + Δ C v o l ( Δ V ( c H ) ) ) M ( C ( 0 ) ) Δ M c o h ( c H ) = 1 N p = 1 N ( M ( C p ( c H ) ) M ( C ( 0 ) + Δ C v o l ( Δ V ( c H ) ) ) ) Δ M d i s , q ( c H ) = M ( C q ( c H ) ) M ( C ( 0 ) + Δ C v o l ( Δ V ( c H ) ) ) Δ M c o h ( c H )
These represent the elastic moduli of different cH, as well as the influence of volume change, the cohesion of Fe-H, and the microscopic distribution of hydrogen on the elastic moduli, respectively.
As the strength of metals are related to E and G, and the compressibility is related to B, we used Δ E d i s , q and Δ G d i s , q to discuss the hardening and softening caused by the microscopic hydrogen distribution, and Δ B d i s , q to discuss the influences on compression. In the following, we write Δ E d i s , q , Δ G d i s , q , and Δ B d i s , q as Δ E d i s , Δ G d i s , and Δ B d i s , respectively.
We used the mean-shift algorithm [47] provided by the machine learning library scikit-learn [48] to perform clustering on Δ E d i s , Δ G d i s , and Δ B d i s at cH = 0.8%, using the distance between data points as the clustering criterion. Then, we calculated the partial pair-correlation function (PCF) between hydrogen atoms in each structure according to Equation (14) [49]:
g ( r ) = 1 ρ H N H i j δ ( r | R i R j | )
where ρH and NH are the average atomic density and the number of hydrogen atoms respectively, and Ri, Rj are the position vectors. The average result of the g(r) of different structures in each group according to the clustering results is obtained as g ¯ ( r ) , based on which the distributions of hydrogen atoms inducing hardening or softening in distances can be found, and then the related slip planes can be discussed. The crystal structures in the article were drawn with the visualization software VESTA [50].

3. Results and Discussion

The EAM potential [36,37] used in this work is widely used when simulating the HE of α-Fe single crystals [28,34,51] and is also suitable for elasticity and thermal expansion problems [52]. As shown in Table 1, we calculated that the elastic constants and moduli of α-Fe single crystals were also very close to the experimental results.
After calculating the elastic constants of α-Fe single crystal at T ∈ [0, 500] K using the fluctuation method [44], by fitting Equations (6) and (9), we obtained the following parameters, listed in Table 2:
Figure 1 was obtained from Equations (9) and (10). C11, C12, and C44 all decreased with the temperature increase and volume expansion, and their changing trend is basically in accordance with previous studies [52,53].
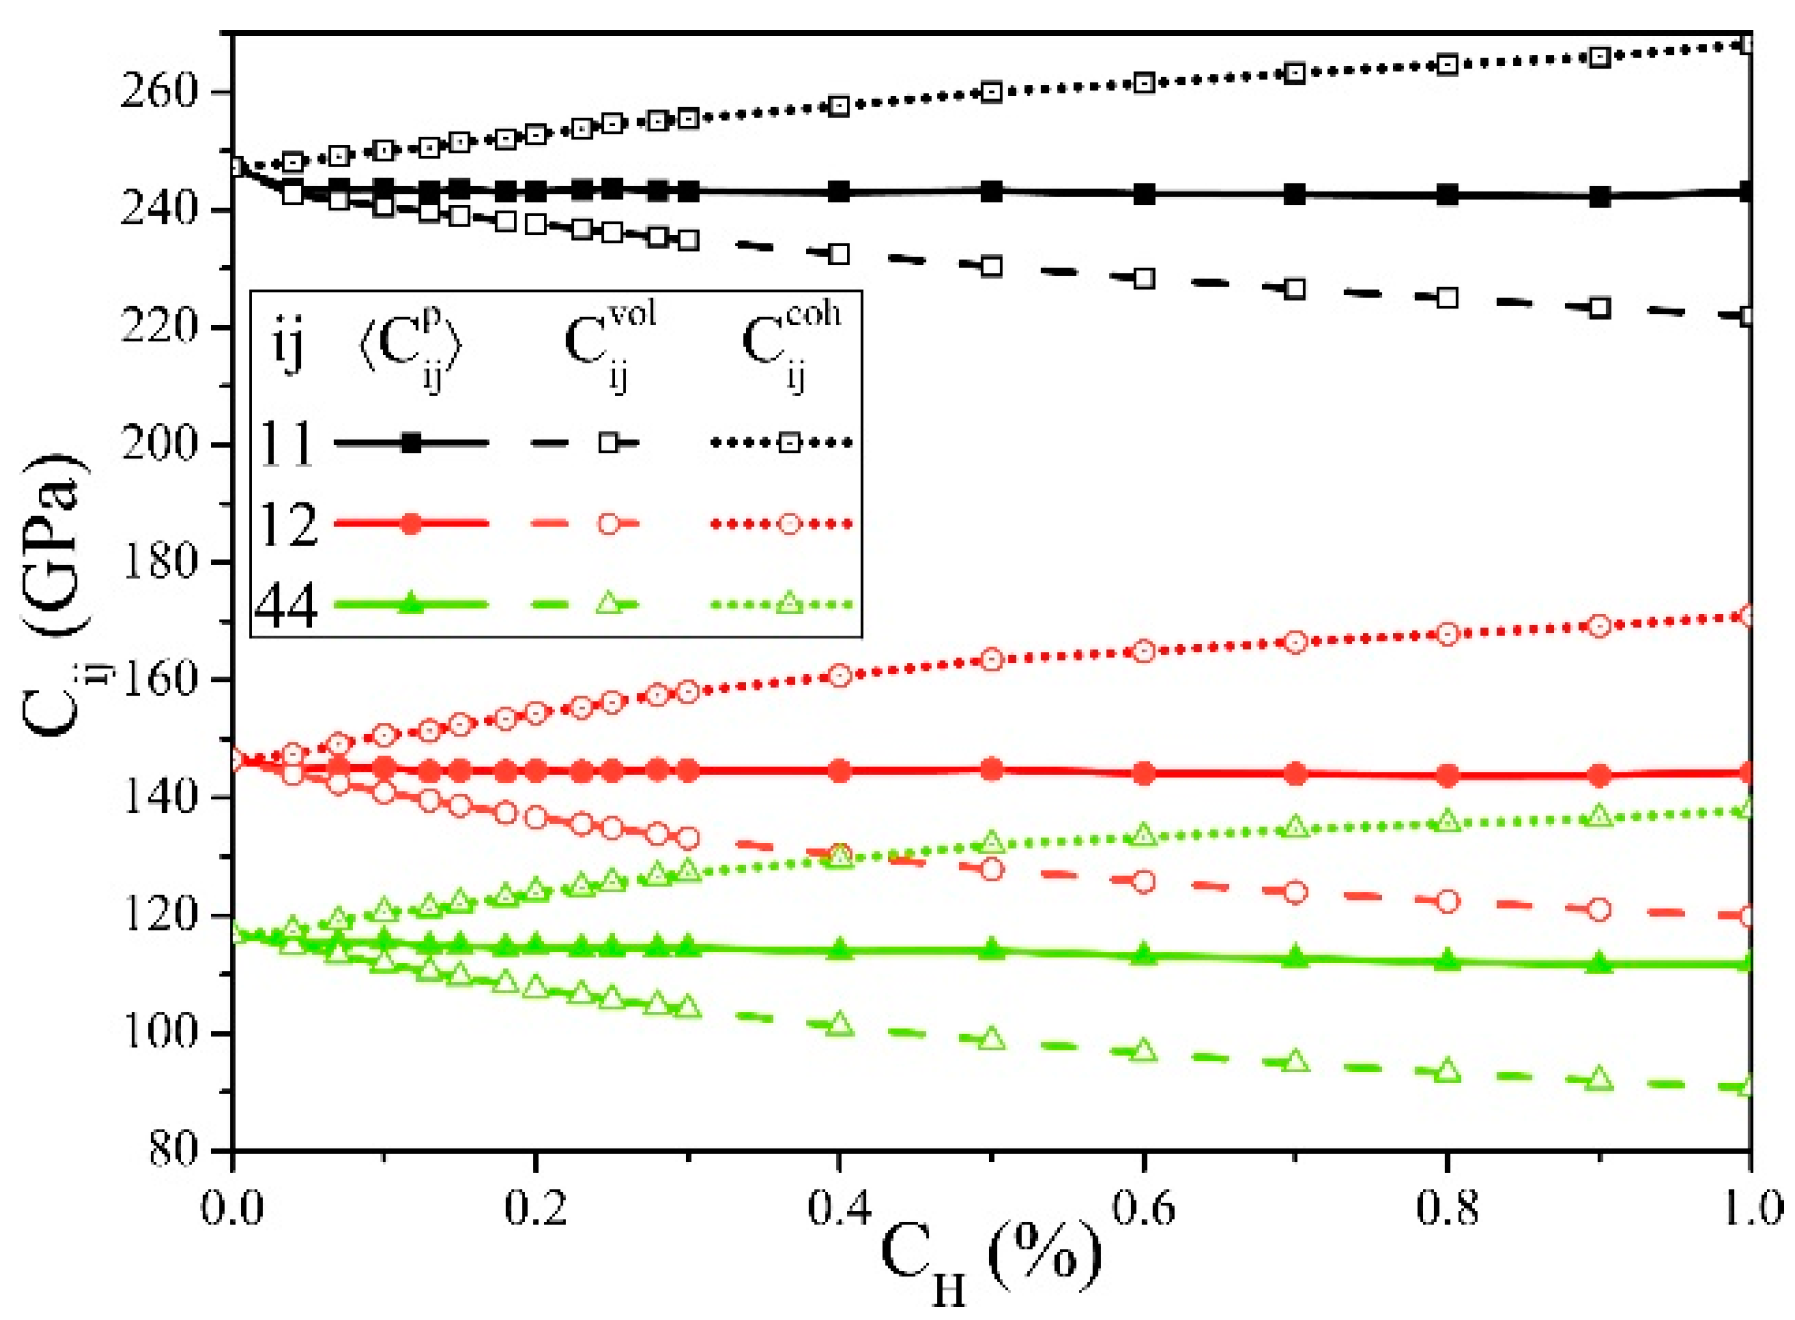
Figure 2 shows the changes of the elastic constants Cij with cH. C i j v o l and C i j c o h are defined as follows:
C i j v o l ( c H ) = C i j ( 0 ) + Δ C i j v o l ( Δ V ( c H ) ) C i j c o h ( c H ) = C i j ( 0 ) + Δ C i j c o h ( Δ V ( c H ) )
From Figure 2, if the cH increases, Δ C i j v o l always decreases, while Δ C i j c o h continues increasing, and their total effect reflected by C i j p is slightly reduced, which is consistent with the first-principle calculation results [27].
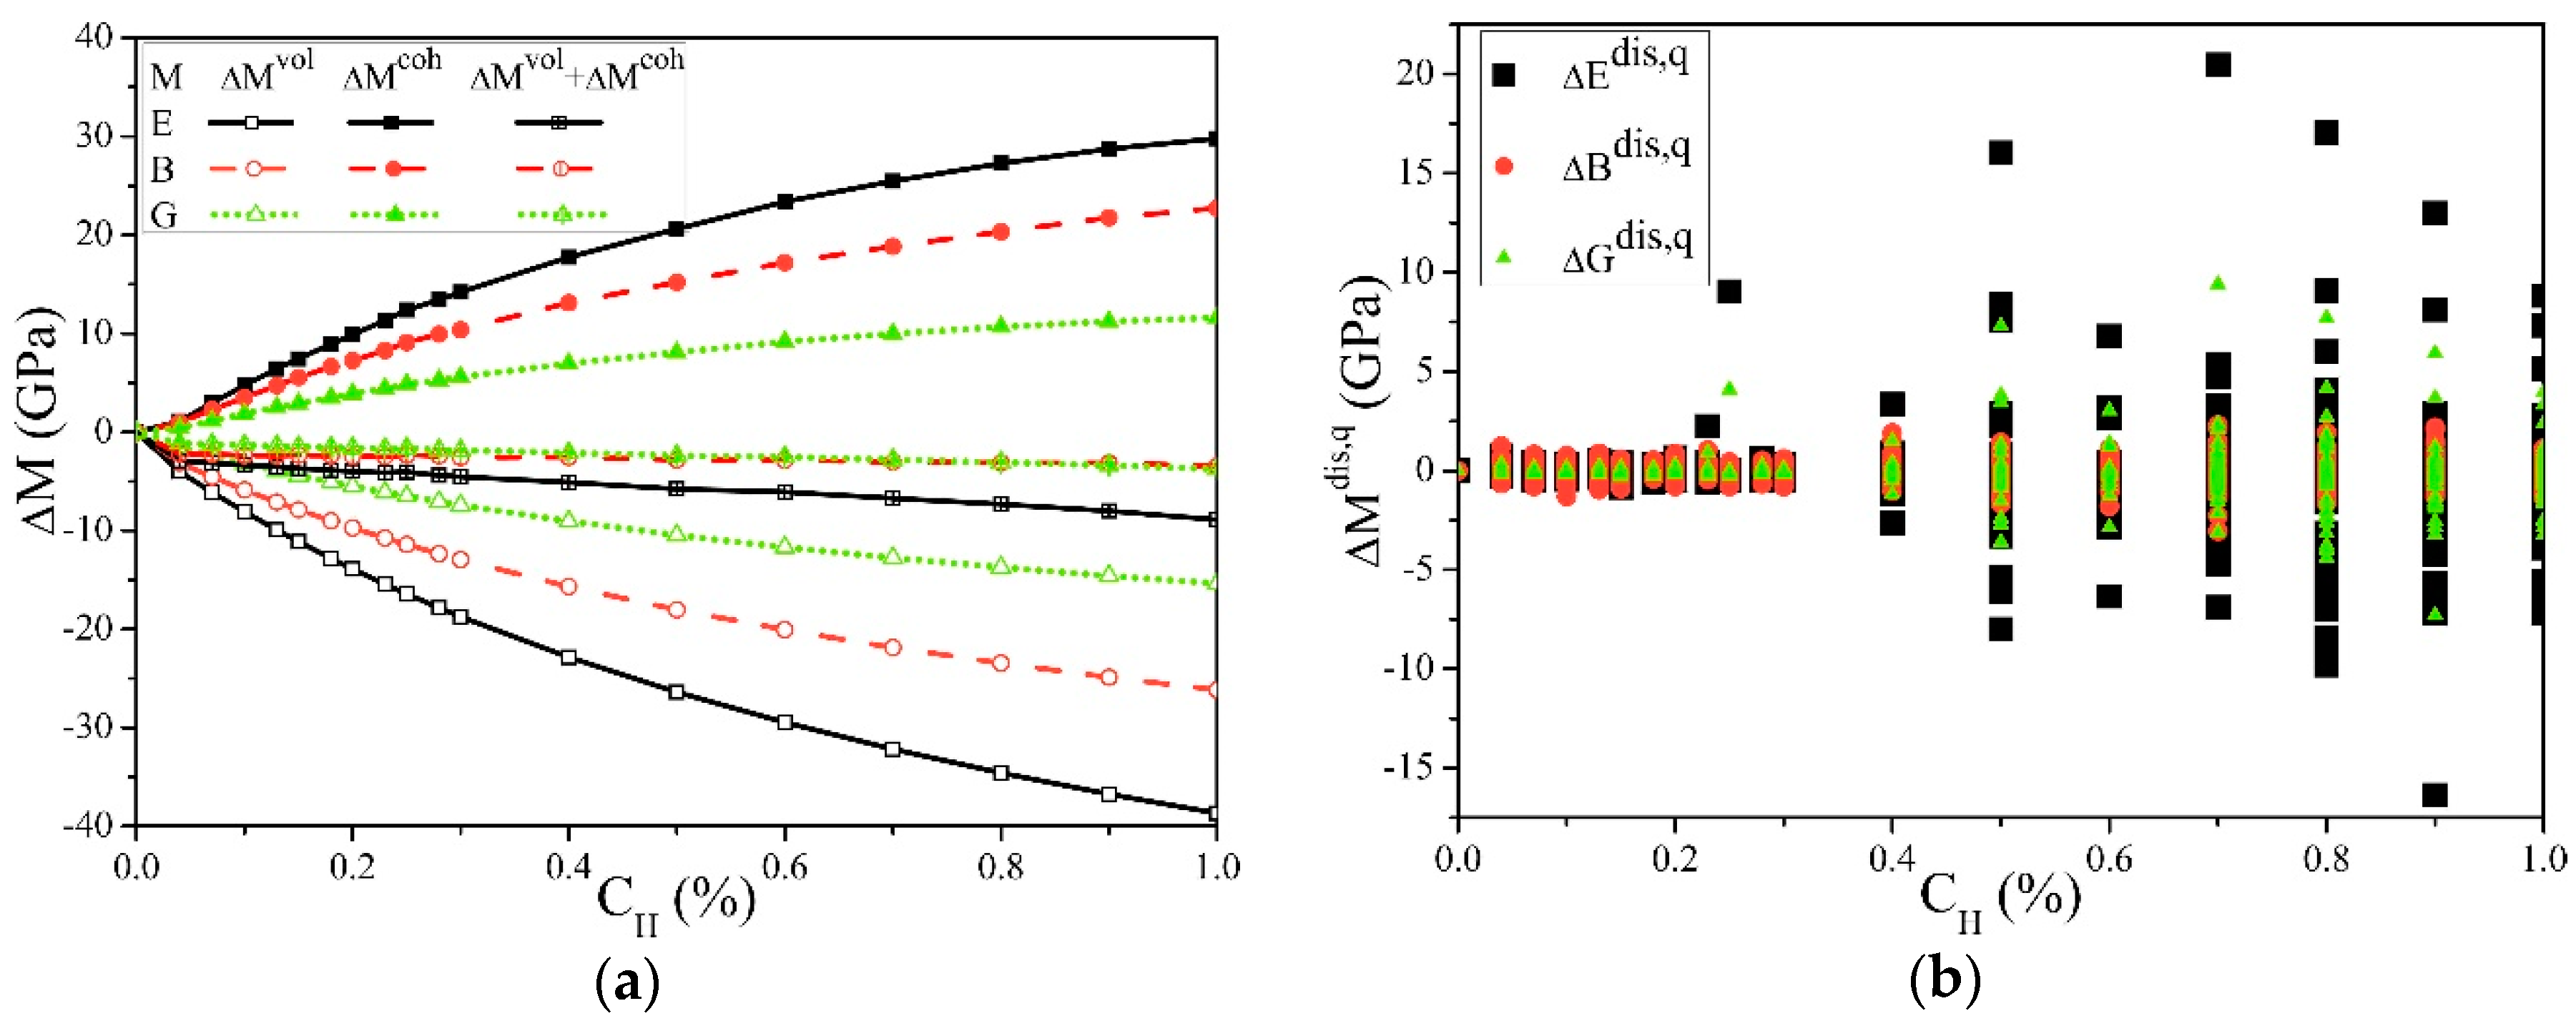
Figure 3 shows the effect of the cH on the elastic moduli. It can be seen from Figure 3a that for E, B, or G, as cH increases, Δ M c o h always increases, while Δ M v o l always decreases. Their common result is a slight decrease, and the reduction of E is more obvious. This indicates that when hydrogen is ideally uniformly distributed in α-Fe single crystals, the chemical bonding process causes hardening, the volume expansion causes softening, and the overall result is light-softening, which is also consistent with the first-principle calculations [27]. In this work, the cH was significantly lower than the first-principle calculations but still higher than the general experimental conditions, and the observed softening was still very slight, which may be the reason why the change of E in the experiment was not easily detected [39].
Figure 3b shows that the microscopic distribution of hydrogen caused the elastic moduli deviations and the average results. Although all the structures had a uniform distribution of hydrogen atoms randomly arranged, when cH > 0.2%, the differences in the microscopic distribution still led to significant changes in the results. Combined with Table 1, these differences can reach up to 15% and increase with the cH. Such significant changes caused by the deviations of hydrogen atoms from uniform distribution conditions are likely to occur during HE and other processes and significantly impact the material service security.
According to the interstitial hydrogen atom spacing condition in iron [27,45], the relaxed structures were screened. When cH = 0.8%, there are enough hydrogen atoms in the system for statistics and comparison, the structures that meet the conditions are the most present (101 groups in total), and the elastic moduli of each structure are significantly different at this concentration. Thus, we selected them for the clustering calculation. Clustering algorithms are increasingly used in materials science and condensed matter physics research for complex data [32,54,55].
In this work, we used the mean-shift algorithm [47], which does not require manually setting the clustering centers and the number of classifications and can handle arbitrary shapes of data distributions. We established a coordinate system S, with Δ E d i s , Δ G d i s , and Δ B d i s as the values on the x, y, and z axes, and the values of the structure q as the coordinates of the point Mq. All points were clustered, and the results were projected to the Δ E d i s - Δ G d i s , and Δ E d i s - Δ B d i s planes, as shown in Figure 4a,b. It can be seen from Figure 4a that Δ E d i s was proportional to Δ G d i s , the proportional coefficient R = 2.2, and there were obvious gaps between different groups.
The Δ E d i s and Δ G d i s in the second, third, and fourth groups were less than 0. The elastic moduli of the structures in these groups were lower than the average results when cH =0.8%, and more obvious softening occurred; correspondingly, the 1, 5, 6, and 7 groups had obvious hardening. It can be seen from Figure 4b that the number of structures in group 0 was the most, and the Δ E d i s and Δ G d i s of these structures were also the closest to 0, indicating that the microscopic distribution of hydrogen atoms in most randomly generated structures deviated little from the ideal uniform distribution. In addition, there was no linear relationship between Δ E d i s and Δ B d i s .
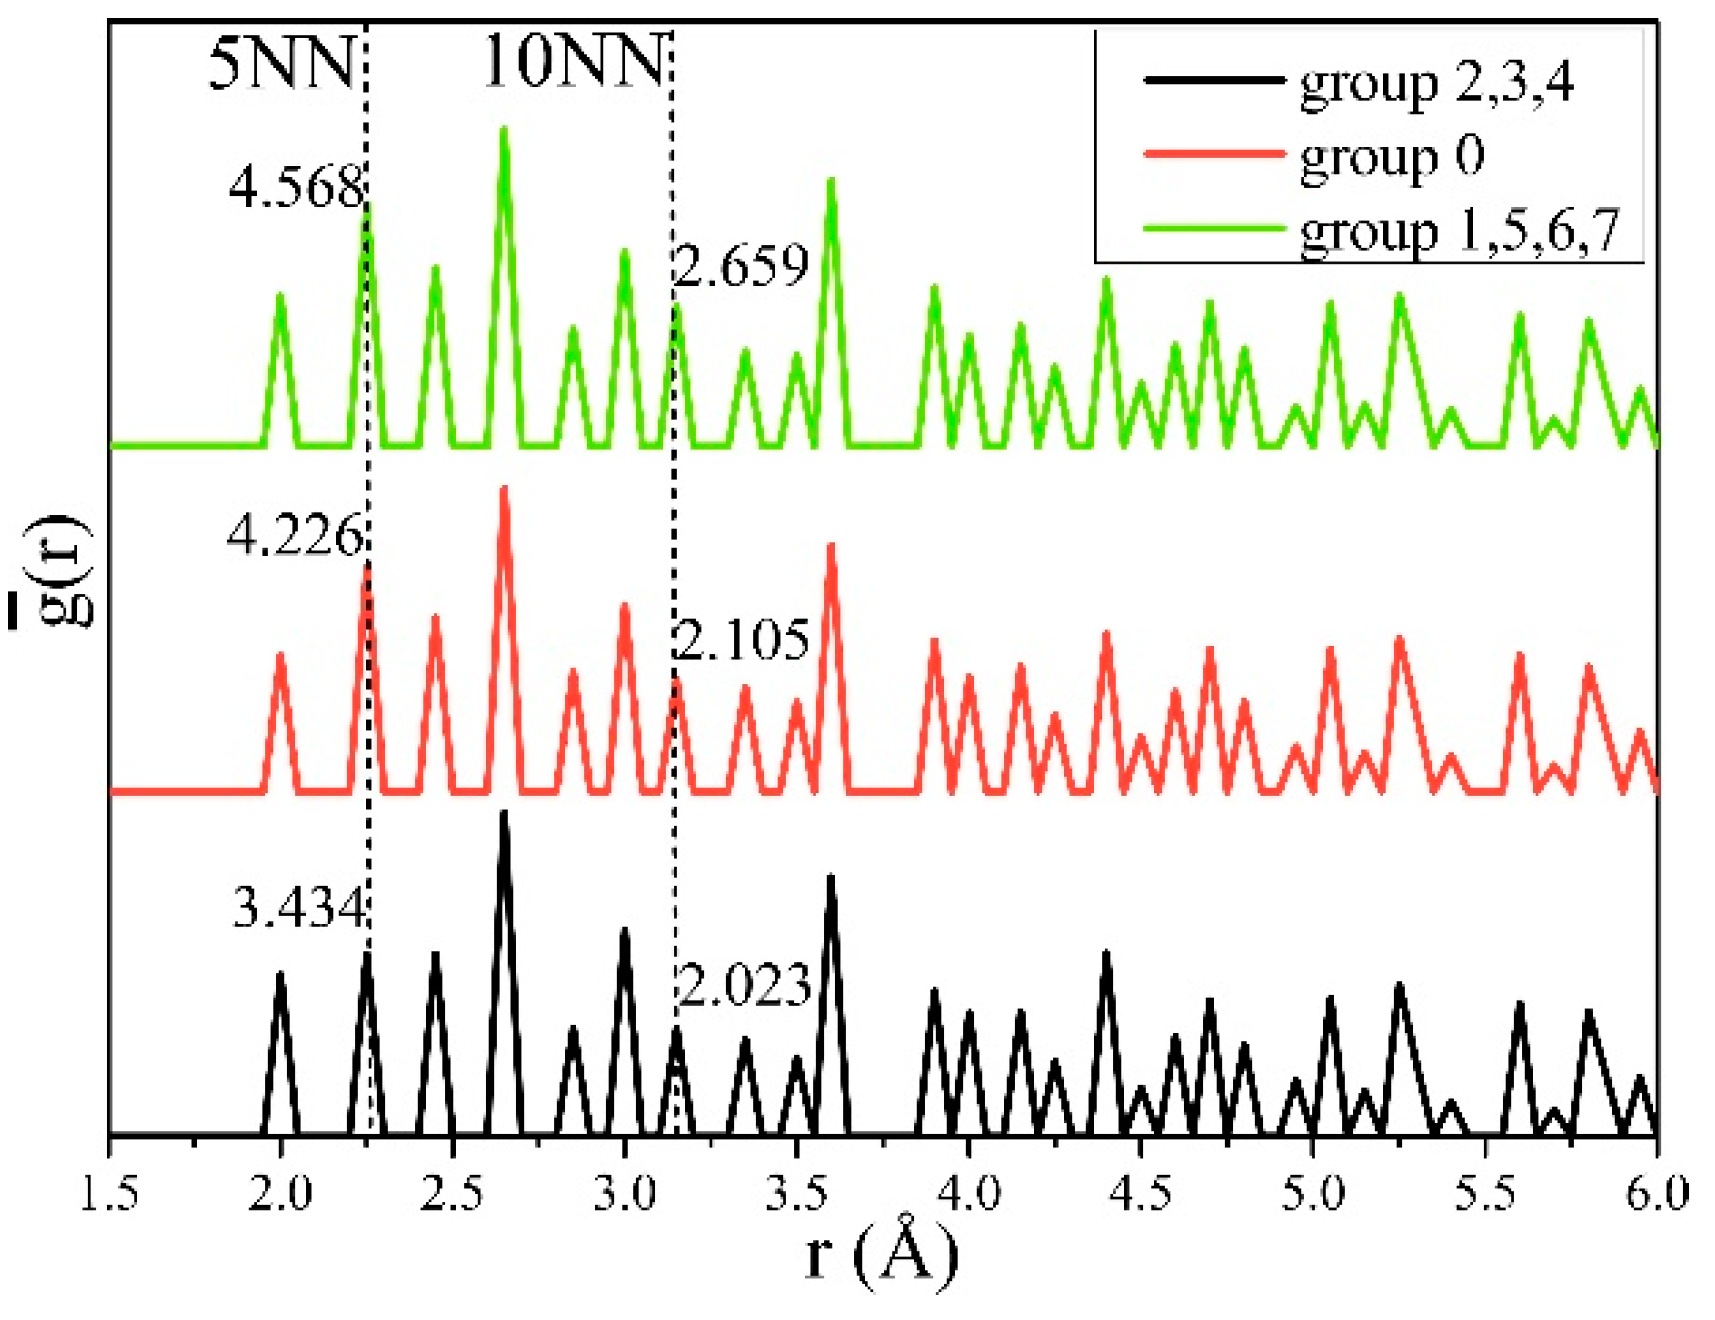
We calculated g(r) for each structure according to Equation (14), and then averaged it for groups 2, 3, and 4, group 0, and groups 1, 5, 6, and 7, respectively, to obtain g ¯ ( r ) . As shown in Figure 5, the peaks at the 5th nearest neighbor (5NN) and the 10th nearest neighbor (10NN) between hydrogen atoms were clearly related to Δ E d i s and Δ G d i s . The values of the three groups of g ¯ ( r ) obtained at 5NN, were 3.434, 4.226, and 4.568, and, at 10NN were 2.023, 2.105, and 2.659, all of which increased gradually. This indicates that the increase of cH at positions 5NN (s5NN) and 10NN (s10NN) between hydrogen and hydrogen increased E and G, thus inducing hardening.
A two-dimensional coordinate system S′ can be established by making a transformation as Equation (16) for the moduli Δ M d i s :
Δ M E G d i s = Δ E d i s sin ( θ ) + Δ G d i s cos ( θ ) θ = 180 ( 1 acos ( R ) / π )
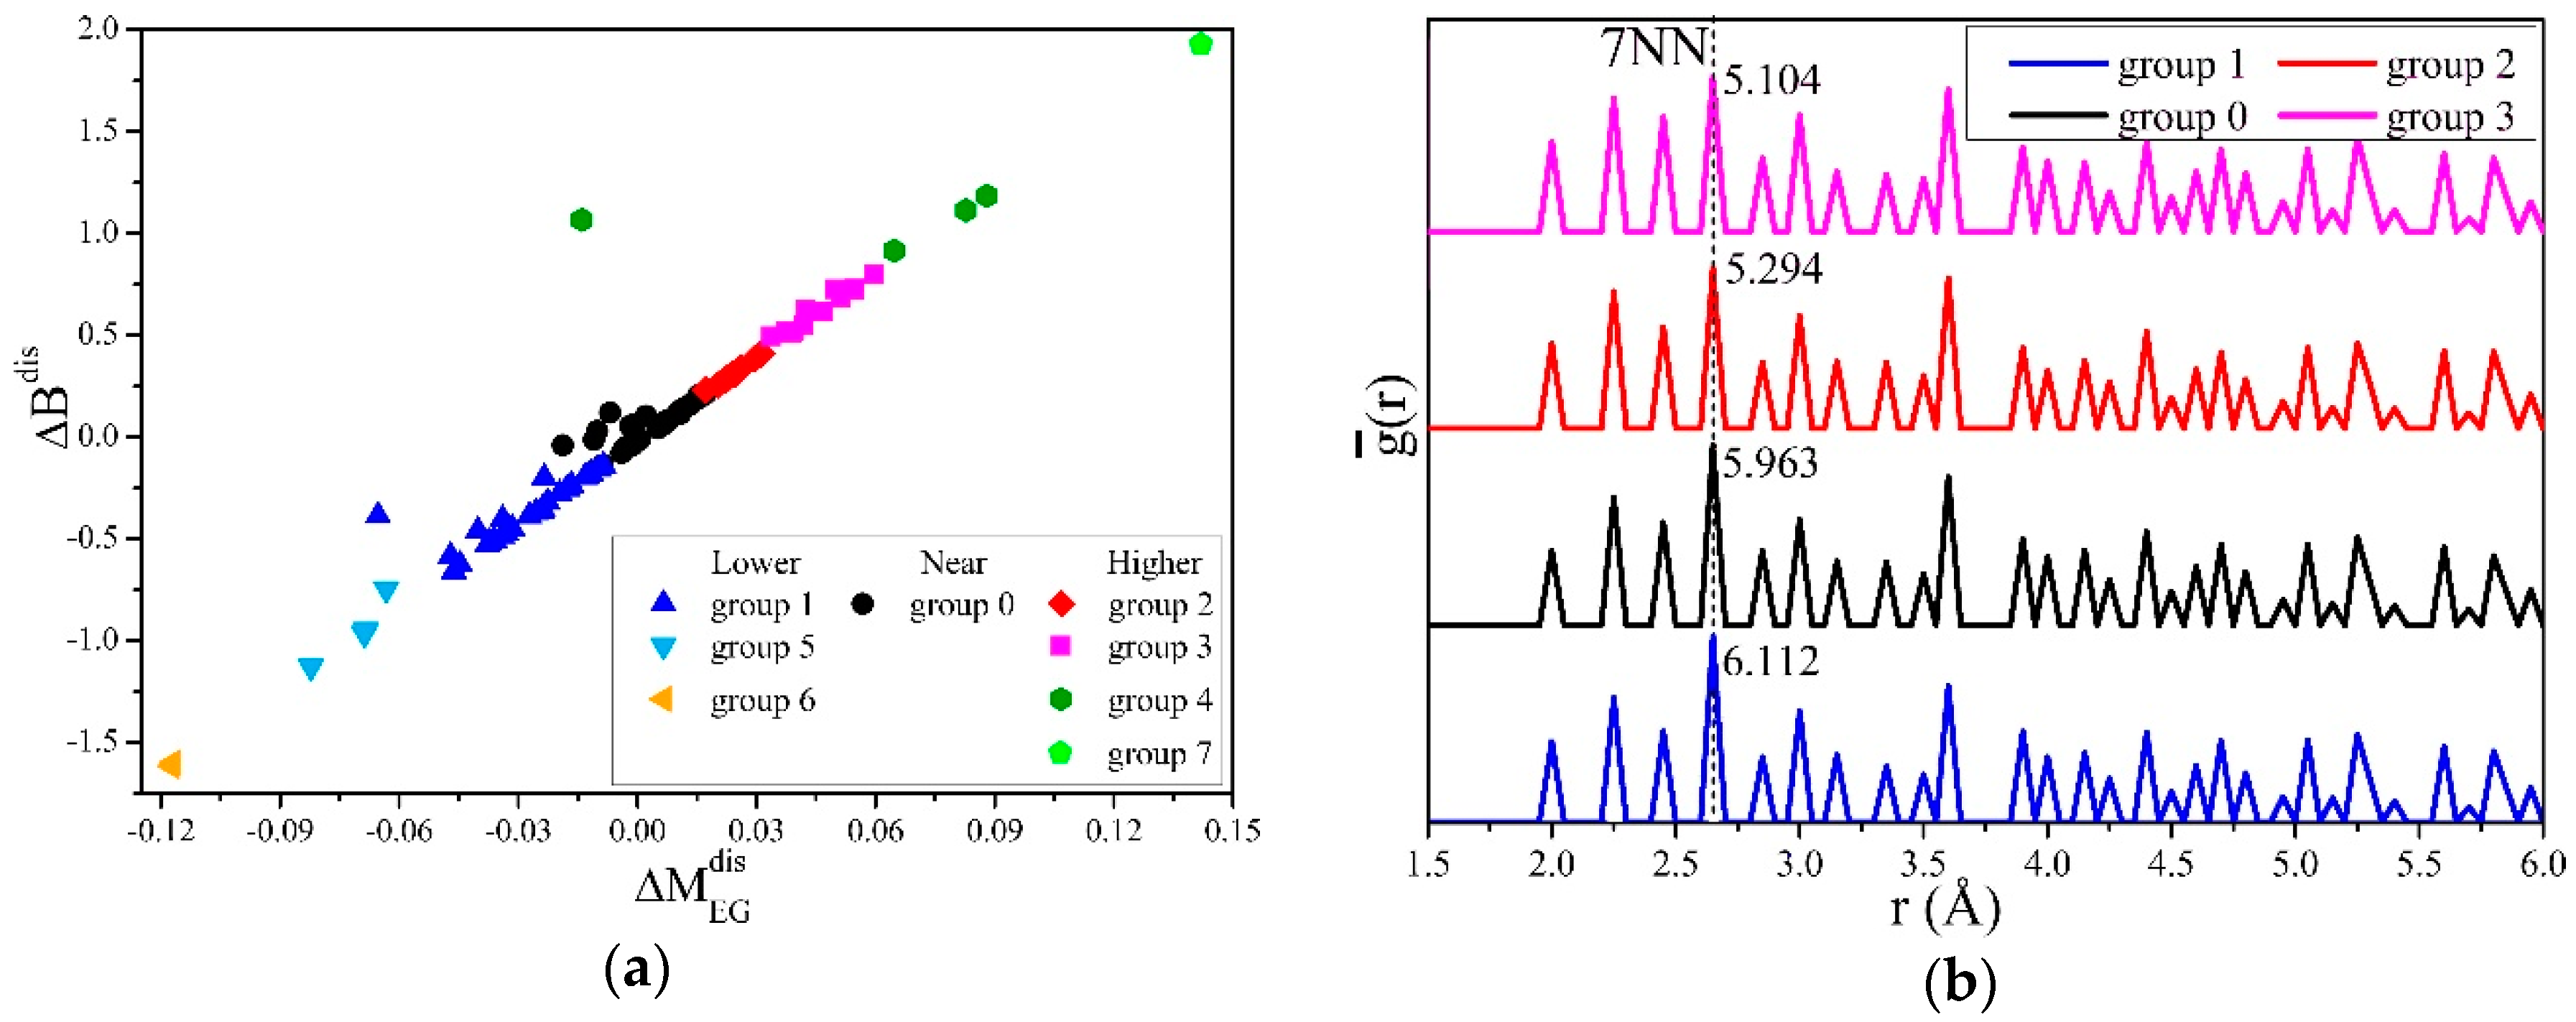
We set Δ M E G d i s and Δ B d i s as the values on the x and y axes, clustering the transformed points, and g ¯ ( r ) could then be calculated. Ignoring groups 4, 6, and 7 with too few structures, the results are shown in Figure 6. Figure 6a shows that Δ M E G d i s was proportional to Δ B d i s with a ratio of R’=0.076. From Figure 6b, the g ¯ ( r ) of the structures in groups 1, 0, 2, and 3 at the 7th nearest neighbor (7NN) clearly decreased with the increase of Δ B d i s . Since the larger the B is, the more difficult it is for the material to be compressed, the results indicate that in α-Fe, the fewer hydrogen atoms are distributed at the positions of 7NN (s7NN), the more difficult the compression.
Most mechanical properties of metallic materials are generally influenced by shears and slips; however, what we observed was that E, B, and G were affected by the distribution of the amount of hydrogen atoms occupied at 5NN, 7NN, and 10NN in α-Fe, which is also likely related to the effects of hydrogen and slip systems. For this reason, we analyzed the relationship between the Tet-sites that can be occupied by hydrogen atoms and the specific crystal faces. As shown in Figure 7a, if any Tet-site is selected as the reference position Z, the Tet-sites on its neighbors are distributed on concentric spherical shells, and the radius of the nth spherical shell is the distance between one of its n nearest neighbor (nNN) sites and Z.
We cut any spherical shell with a crystal plane with an index of (hkl). If the number of Tet-sites on the cross-section was greater than or equal to three, then we say that they fell on the crystal plane with index (hkl). Dividing the number of these sites by the area of the crystal face determined by them, we obtained the area density of the hydrogen-occupied positions on the crystal face, which is decided by the crystal index (hkl). This means that at the same cH, if hydrogen is more distributed in a certain spherical shell, this may affect the difficulties of shears and slips of different crystal planes and cause different effects. Since the crystal faces in the {hkl} family are equivalent by the symmetry of the lattice of α-Fe, the effect of hydrogen on elastic moduli of {hkl} should be the same on ρ. We considered all (hkl) crystal planes in the {hkl} family when calculating ρ{hkl} of the nNN spherical shell.
As the major slip planes of α-Fe belong to the {110} and {112} families [56], we calculated the areal densities ρ{110} and ρ{112} of Tet-sites on planes at different NN locations. As shown in Figure 7b, there were more NNs where ρ{110} ≠ 0 than ρ{112} ≠ 0, and ρ{110} > ρ{112} in most NNs. The rise of cH caused γus of the {112}<111> slip system to rise and that of the {110}<111> slip system to fall [28], that is, to inhibit the slips of the {112} planes and promote the slips of the {110} planes. Therefore, at most NNs, ρ{110} > ρ{112} is clearly beneficial to the occurrence of shears and slips when cH rises. This is the reason why the uniformly distributed hydrogen generally induces softening in α-Fe.
At the same time, ρ{112} was the greatest at 10NN and was significantly larger than ρ{110}; therefore, an increment of occupied hydrogen atoms at this position will inhibit shears and slips, which can increase E and G, and cause hardening. Figure 7b shows that ρ{112} at 7NN is second only to 10NN but is still smaller than ρ{110}. This indicates that the increase of hydrogen on 7NN will affect the elastic properties, but without inducing hardening. At 13NN, 14NN, and 27NN, ρ{112} and ρ{110} are very close, and their effects on shears and slips may cancel each other out.
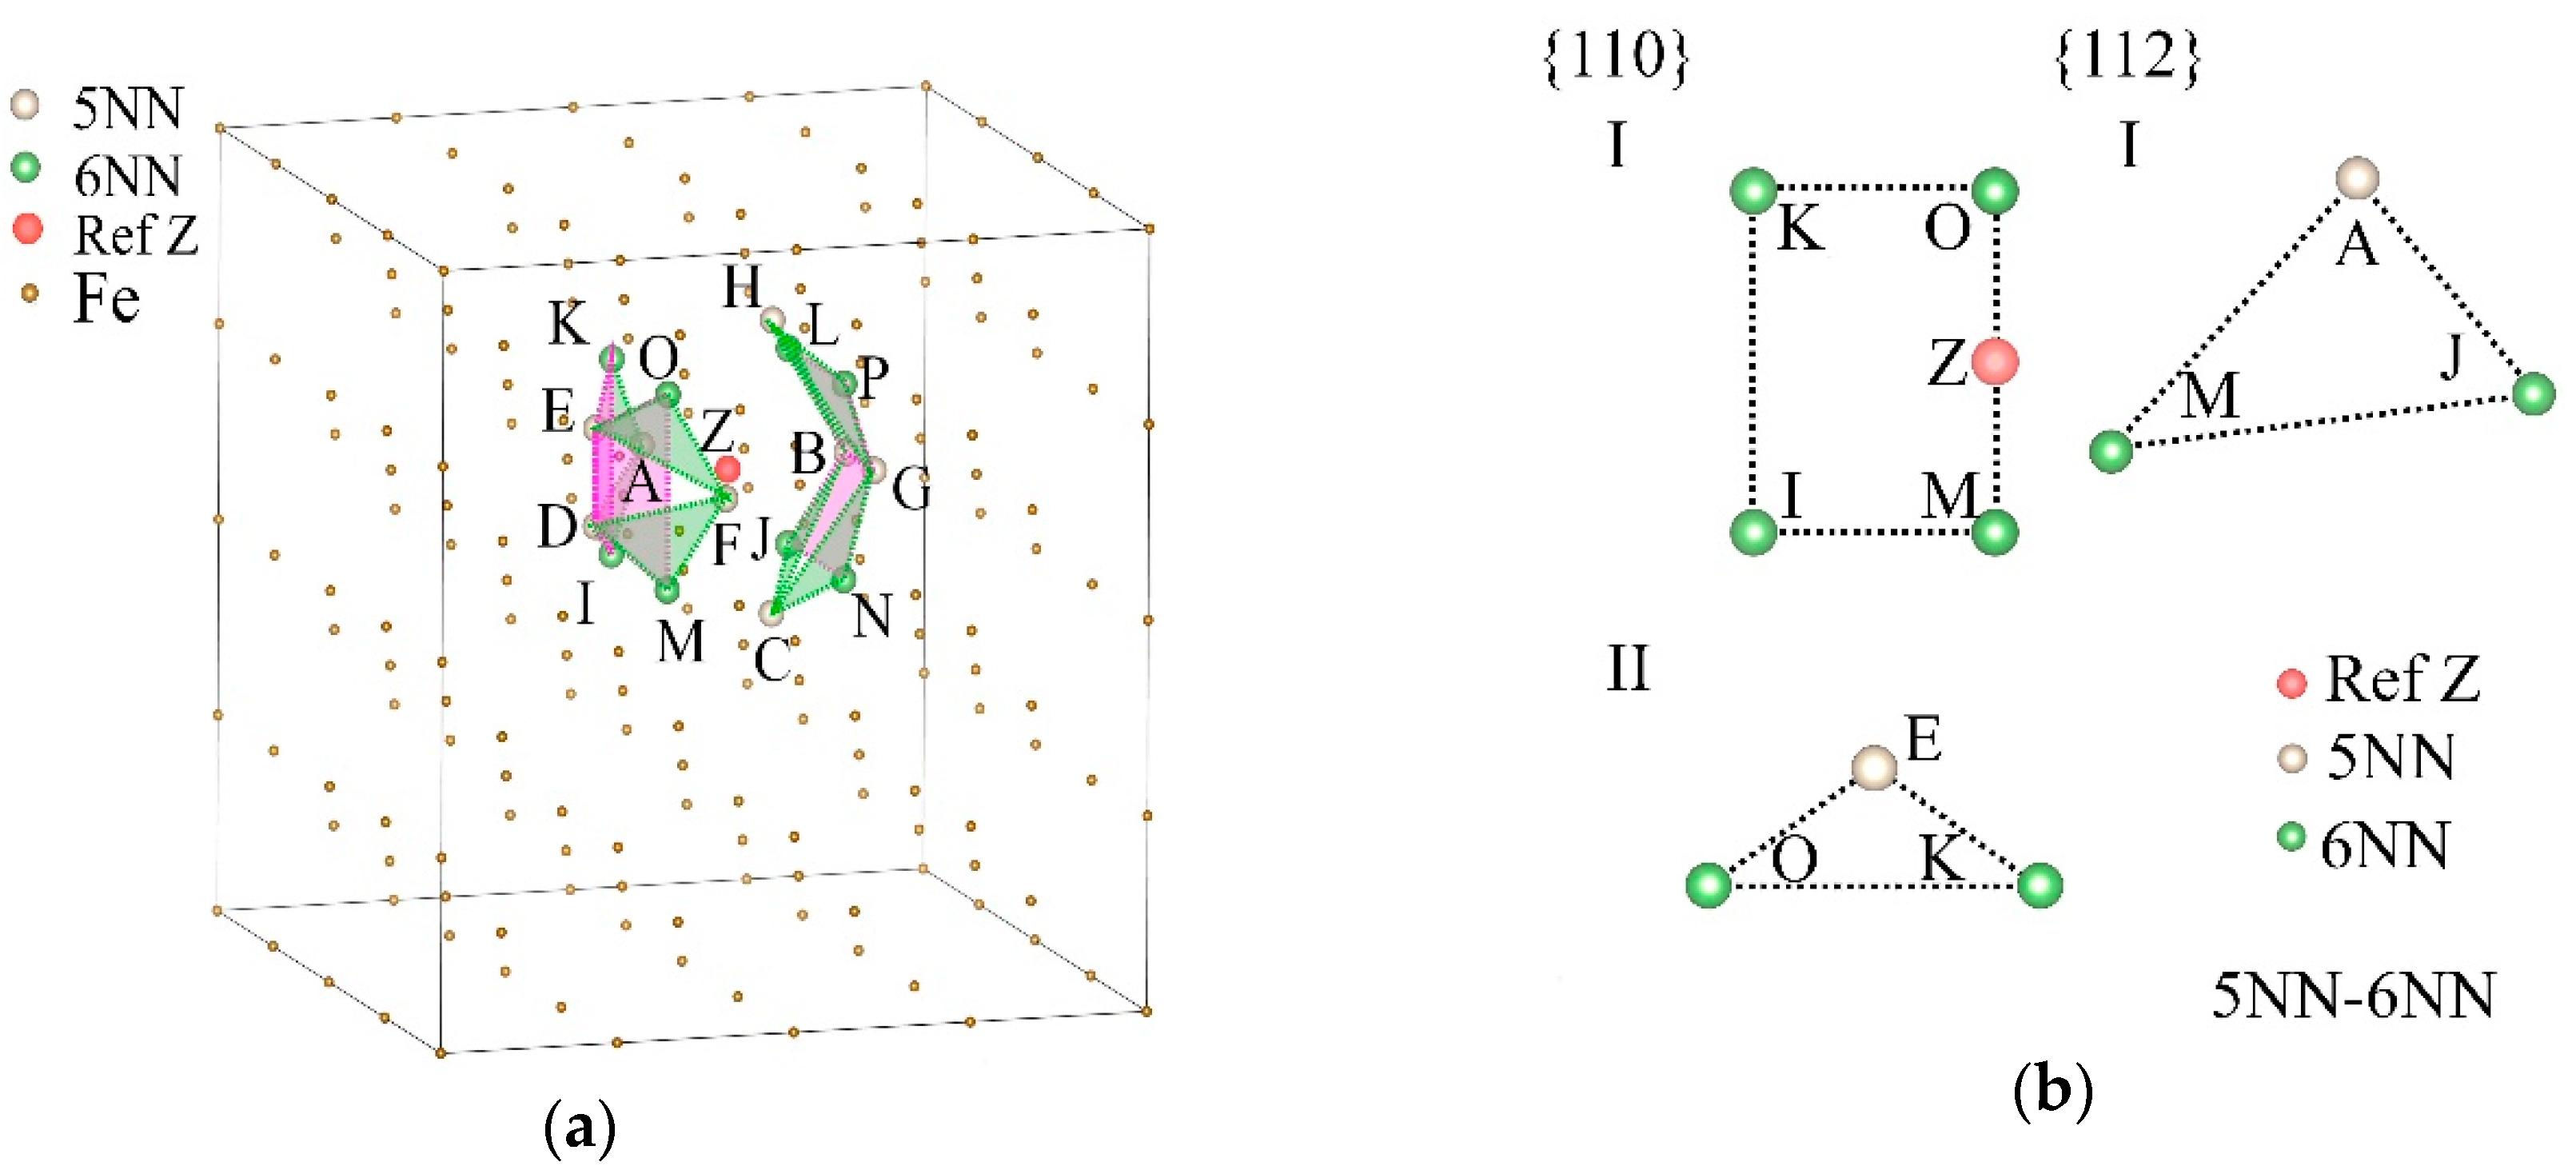
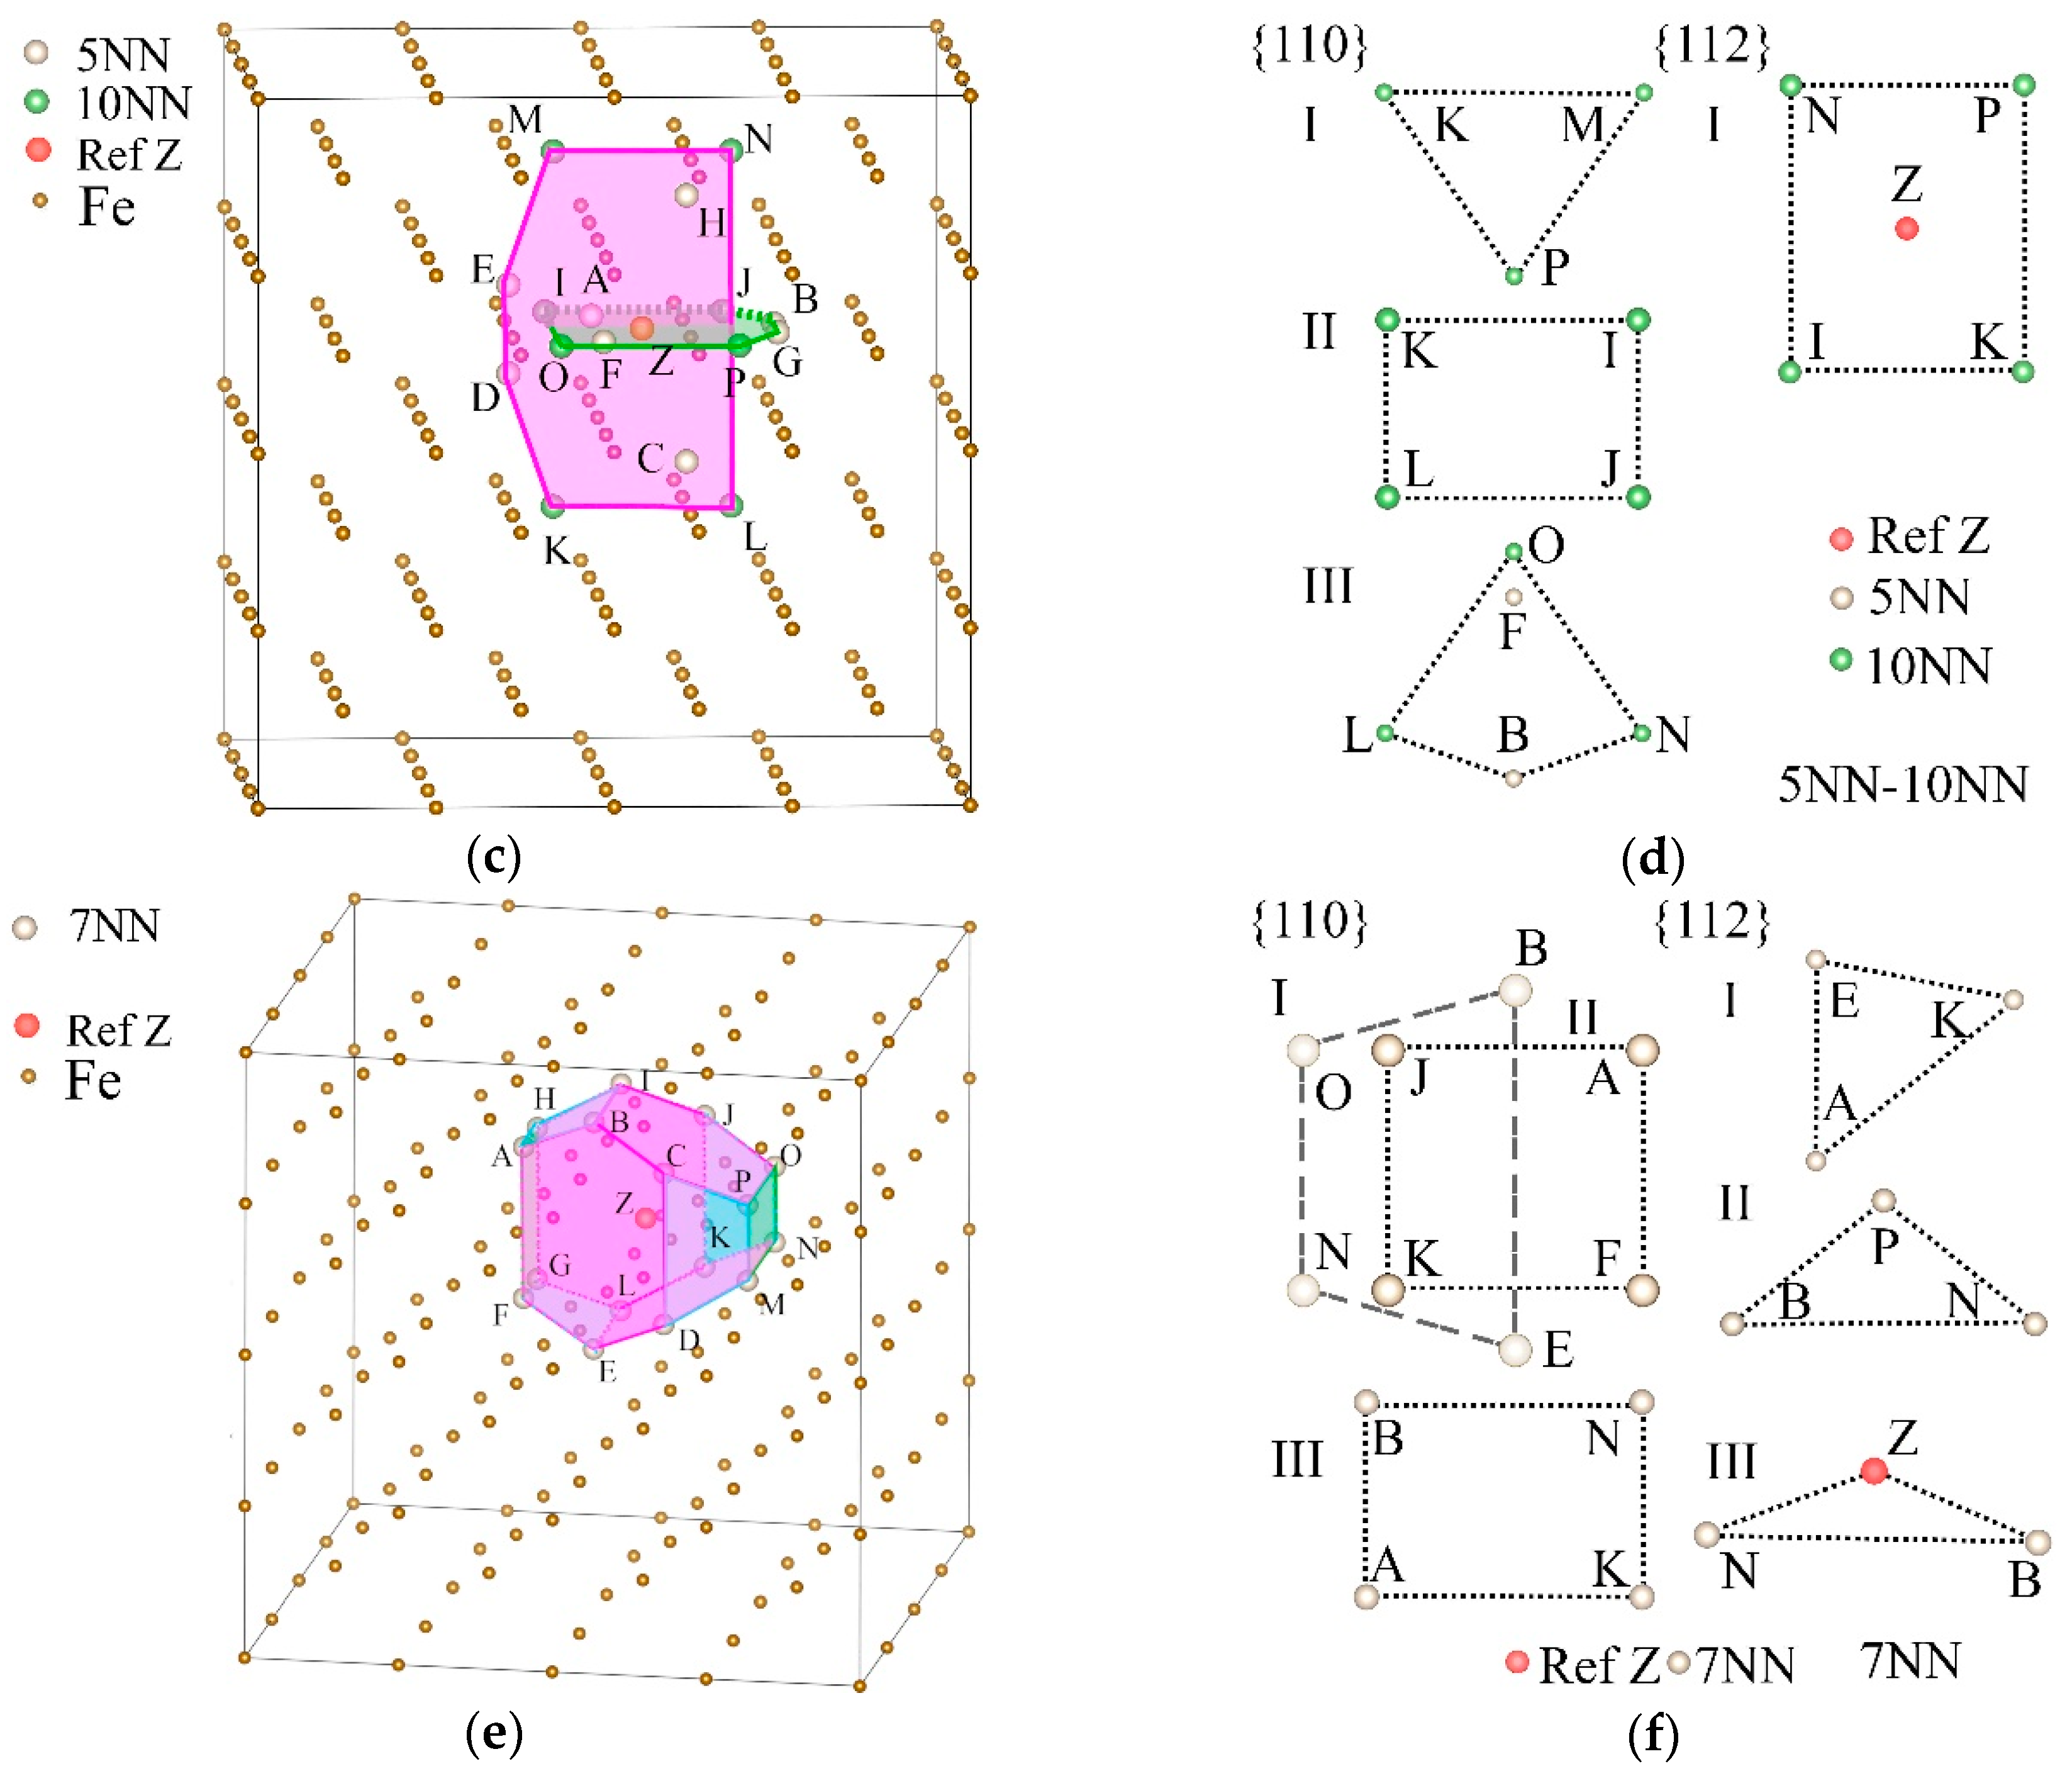
It can be seen from Figure 5 that the hydrogen occupancy of 5NN also significantly promoted E and G, and Figure 6 shows that hydrogen occupancy of 7NN significantly inhibited B; thus, we analyzed the planes that 5NN and other nearby neighbors jointly affect, and the effect of s7NN planes. The positions of 5NN and 6NN (denoted as s5NN-6NN) jointly determined the {112} planes, while considering the positions of 5NN and 10NN (denoted as s5NN-10NN) increased ρ{110}. And the geometric structure of the densest planes (DPs) of s7NN may be the reason why it affects B.
Figure 8a,c,e shows the positions of s5NN-6NN, s5NN-10NN, and s7NN in the lattice of α-Fe, and the DPs determined by them. The DPs determined by s5NN-6NN belong to the {210} and {531} planes, which are colored by green and pink, respectively, in Figure 8a, and they are located on both sides of Z. There are only two DPs of s5NN-10NN, belonging to the {100} family, and they are perpendicular to each other, and are colored by green and pink respectively in Figure 8c; The DPs of s7NN contain two different sets of {120} (blue and pink respectively) and one set of {100} faces (green). The details of these DPs are listed in Table 3.
As shown in Figure 8b,d,f and listed in Table 4, most of the points in the DP are also situated on the {110} and {112} planes; thus, the slips of the {110} and {112} planes will affect the structures of the DPs. The DPs of s7NN completely surround Z to form a closed convex decahedron structure, which makes the effect of hydrogen distributed on the {110} and {112} planes tend to be more isotropic. It can be seen from Figure 7b that, at 7NN, ρ{112} is the second largest compared with other NNs. ρ{110} > ρ{112}, which shows that the shears and slips were promoted by the increase of hydrogen atoms situated on these positions. Combined with the phenomenon of the DP surrounding structure, these shears and slips may eventually act on the volume, resulting in the reduction of B and making the material easier to compress.
Figure 8b,d,f shows the positions of s5NN-6NN, s5NN-10NN, and s7NN, as well as the plane types in the {110} and {112} families where they are distributed. These positions form different polygons on different types of crystal planes, and the areal densities of these positions are also different. The classification of the crystal planes is listed in Table 4. It can be seen from Figure 7b and Figure 8b that compared with s6NN, s5NN-6NN newly determines a group of {112} faces and a group of {110} faces, which makes ρ{112} increase from 0 sites/Å2 to 0.2814 sites/Å2, and ρ{110} increases from 0.3625 sites/Å2 to 0.4028 sites/Å2, that is, the increase of hydrogen atoms on 5NN will significantly increase the amount of hydrogen atoms on the {112} planes, which will bring greater resistance to shears and slips and weaken the softening effect.
From Figure 8d, the addition of s5NN will also increase the ρ{110} of the type III {110} planes determined by s10NN, which will enhance the shears and slips. However, although the total ρ{110} = 0.2637 sites/Å2 determined by s5NN-10NN is higher than the original ρ{110} = 0.2372 sites/Å2 determined by s10NN, it is still less than the areal density of ρ{112} = 0.2772 sites / Å2 of {112} planes, that is, the occupation of s5NN by hydrogen atoms will not eliminate the possibility of hardening caused by occupation of s10NN. Therefore, hydrogen can weaken the softening effect of 6NN by occupying the 5NN positions, and can achieve hardening by occupying the 10NN positions.

4. Conclusions

In this work, we used atomistic simulation methods combined with clustering to study the influences of the concentration and microscopic distribution of hydrogen atoms on the elastic moduli in the interstitial solid solution of hydrogen in α-Fe. Through this research, we made the following conclusions:
The uniformly distributed hydrogen atoms slightly decreased the elastic constants and moduli of the α-Fe, thereby causing softening, which was the result of the combined effect of the hardening of the Fe–H cohesion and the softening of the volume expansion of the lattice of α-Fe.
Different microscopic hydrogen distributions caused significant differences in the elastic moduli and induced softening or hardening. In the crystal planes determined by the Tet-sites on 10NN, ρ{112} > ρ{110}, and the increase of hydrogen atoms occupying these positions increased E and G. The positions in 5NN affected those in 6NN, and made ρ{112} increased significantly, in the crystal planes which were determined by the Tet-sites of 5NN and 6NN, thereby, weakening the promotion effect of hydrogen on shears and slips. This explains why hardening can be induced by the hydrogen distributed in the 5NN, 6NN, and 10NN positions.
Hardening was not be induced by hydrogen atoms occupying the Tet-sites on 7NN. In the crystal planes determined by such sites, ρ{112} was relatively large, but still less than ρ{110}. This caused an increase in the shears and slips with the increasing hydrogen occupation. However, the enclosed decahedral structure by the DPs determined by these positions makes the effect of hydrogen on shears and slips tends to be isotropic; thus, the occupation of these positions by hydrogen will reduce B and make the α-Fe easier to compress.

Author Contributions

Methodology, conceptualization, formal analysis, writing—original draft preparation, writing—review and editing, Z.W.; methodology, conceptualization, X.S.; writing—review and editing, funding acquisition, X.-S.Y.; writing—review and editing, Z.L.; writing—review and editing, S.-Q.S.; conceptualization, methodology, writing—review and editing, funding acquisition, X.M. All authors have read and agreed to the published version of the manuscript.

Funding

This work is funded by the National Natural Science Foundation of China (Grant No. 11174030, 51701171). The authors acknowledge the foundation for financial support.

Conflicts of Interest

The authors declare no conflict of interest.

References

  1. Nagumo, M. Fundamentals of Hydrogen Embrittlement; Springer: Singapore, 2016; ISBN 9789811001611. [Google Scholar]
  2. Robertson, I.M.; Sofronis, P.; Nagao, A.; Martin, M.L.; Wang, S.; Gross, D.W.; Nygren, K.E. Hydrogen Embrittlement Understood. Metall. Mater. Trans. A 2015, 46, 2323–2341. [Google Scholar] [CrossRef] [Green Version]
  3. Troiano, A.R. The Role of Hydrogen and Other Interstitials in the Mechanical Behavior of Metals. Metallogr. Microstruct. Anal. 2016, 5, 557–569. [Google Scholar] [CrossRef]
  4. Lynch, S. Hydrogen embrittlement phenomena and mechanisms. Corros. Rev. 2012, 30, 105–123. [Google Scholar] [CrossRef]
  5. Pfeil, L.B. The effect of occluded hydrogen on the tensile strength of iron. J. Franklin Inst. 1927, 203, 331–332. [Google Scholar] [CrossRef]
  6. Oriani, R.A. The Physical and Metallurgical Aspects of Hydrogen in Metals. In Proceedings of the Fourth International Conference on Cold Fusion, Lahaina, Maui, 6–9 December 1993. [Google Scholar]
  7. Beachem, C.D. A new model for hydrogen-assisted cracking (hydrogen “embrittlement”). Metall. Mater. Trans. B 1972, 3, 441–455. [Google Scholar] [CrossRef]
  8. Sofronis, P.; Robertson, I.M. Transmission electron microscopy observations and micromechanical/continuum models for the effect of hydrogen on the mechanical behaviour of metals. Philos. Mag. A Phys. Condens. Matter, Struct. Defects Mech. Prop. 2002, 82, 3405–3413. [Google Scholar] [CrossRef]
  9. Ferreira, P.J.; Robertson, I.M.; Birnbaum, H.K. Hydrogen effects on the interaction between dislocations. Acta Mater. 1998, 46, 1749–1757. [Google Scholar] [CrossRef] [Green Version]
  10. Lee, D.H.; Lee, J.A.; Seok, M.Y.; Baek, U.B.; Nahm, S.H.; Jang, J. Il Stress-dependent hardening-to-softening transition of hydrogen effects in nanoindentation of a linepipe steel. Int. J. Hydrogen Energy 2014, 39, 1897–1902. [Google Scholar] [CrossRef]
  11. Kimura, H.; Matsui, H. Mechanism of hydrogen-induced softening and hardening in iron. Scr. Metall. 1987, 21, 319–324. [Google Scholar] [CrossRef]
  12. Kirchheim, R. Solid solution softening and hardening by mobile solute atoms with special focus on hydrogen. Scr. Mater. 2012, 67, 767–770. [Google Scholar] [CrossRef]
  13. Miresmaeili, R.; Liu, L.; Kanayama, H. A possible explanation for the contradictory results of hydrogen effects on macroscopic deformation. Int. J. Press. Vessel. Pip. 2012, 99–100, 34–43. [Google Scholar] [CrossRef]
  14. Katzarov, I.H.; Pashov, D.L.; Paxton, A.T. Hydrogen embrittlement I. Analysis of hydrogen-enhanced localized plasticity: Effect of hydrogen on the velocity of screw dislocations in α-Fe. Phys. Rev. Mater. 2017, 1, 1–11. [Google Scholar] [CrossRef] [Green Version]
  15. Tomatsu, K.; Omura, T.; Nishiyama, Y.; Todaka, Y. Influence of hydrogen on local mechanical properties of pure Fe with different dislocation densities investigated by electrochemical nanoindentation. ISIJ Int. 2016, 56, 2298–2303. [Google Scholar] [CrossRef] [Green Version]
  16. Du, J.J.; Mao, O.; Wang, X. Softening and Hardening Due to Hydrogen in Iron and Iron Based Alloys. Mech. Behav. Mater. V 1988, 855–860. [Google Scholar] [CrossRef]
  17. Ogawa, T.; Koyama, M.; Noguchi, H. Suppression mechanism of strain-age hardening in carbon steel associated with hydrogen uptake. Tetsu Hagane J. Iron Steel Inst. Japan 2015, 101, 546–551. [Google Scholar] [CrossRef] [Green Version]
  18. Hirth, J.P. Effects of hydrogen on the properties of iron and steel. Metall. Trans. A 1980, 11, 861–890. [Google Scholar] [CrossRef]
  19. Kimura, A.; Kimura, H. Hydrogen embrittlement in high purity iron single crystals. Mater. Sci. Eng. 1986, 77, 75–83. [Google Scholar] [CrossRef]
  20. Taketomi, S.; Matsumoto, R.; Hagihara, S. Molecular statics simulation of the effect of hydrogen concentration on {112}<111> edge dislocation mobility in alpha iron. ISIJ Int. 2017, 57, 2058–2064. [Google Scholar] [CrossRef] [Green Version]
  21. Zhao, Y.; Seok, M.Y.; Choi, I.C.; Lee, Y.H.; Park, S.J.; Ramamurty, U.; Suh, J.Y.; Jang, J. Il The role of hydrogen in hardening/softening steel: Influence of the charging process. Scr. Mater. 2015, 107, 46–49. [Google Scholar] [CrossRef]
  22. Matsui, H.; Kimura, H.; Moriya, S. The effect of hydrogen on the mechanical properties of high purity iron I. Softening and hardening of high purity iron by hydrogen charging during tensile deformation. Mater. Sci. Eng. 1979, 40, 207–216. [Google Scholar] [CrossRef]
  23. Oguri, K.; Takaki, S.; Kimura, H. Hydrogen-induced softening and hardening in high purity FeC alloys. Mater. Sci. Eng. 1982, 53, 223–232. [Google Scholar] [CrossRef]
  24. Hashimoto, M.; Latanision, R.M. The role of dislocations during transport of hydrogen in hydrogen embrittlement of iron. Metall. Trans. A 1988, 19, 2799–2803. [Google Scholar] [CrossRef]
  25. Wang, S.; Ohnuki, S.; Hashimoto, N.; Chiba, K. Hydrogen effects on tensile property of pure iron with deformed surface. Mater. Sci. Eng. A 2013, 560, 332–338. [Google Scholar] [CrossRef] [Green Version]
  26. Asano, S.; Otsuka, R. The lattice hardening due to dissolved hydrogen in iron and steel. Scr. Metall. 1976, 10, 1015–1020. [Google Scholar] [CrossRef]
  27. Psiachos, D.; Hammerschmidt, T.; Drautz, R. Ab initio study of the modification of elastic properties of α-iron by hydrostatic strain and by hydrogen interstitials. Acta Mater. 2011, 59, 4255–4263. [Google Scholar] [CrossRef] [Green Version]
  28. Xing, X.; Yu, M.; Chen, W.; Zhang, H. Atomistic simulation of hydrogen-assisted ductile-to-brittle transition in α-iron. Comput. Mater. Sci. 2017, 127, 211–221. [Google Scholar] [CrossRef]
  29. Song, J.; Curtin, W.A. Atomic mechanism and prediction of hydrogen embrittlement in iron. Nat. Mater. 2013, 12, 145–151. [Google Scholar] [CrossRef]
  30. Matsumoto, R.; Taketomi, S.; Matsumoto, S.; Miyazaki, N. Atomistic simulations of hydrogen embrittlement. Int. J. Hydrogen Energy 2009, 34, 9576–9584. [Google Scholar] [CrossRef]
  31. Nosengo, N. The material code. Nature 2016, 533, 22–25. [Google Scholar] [CrossRef] [Green Version]
  32. Schleder, G.R.; Padilha, A.C.M.; Acosta, C.M.; Costa, M.; Fazzio, A. From DFT to machine learning: Recent approaches to materials science—A review. J. Phys. Mater. 2019, 2, 032001. [Google Scholar] [CrossRef]
  33. Bedolla, E.; Padierna, L.C.; Castañeda-Priego, R. Machine Learning for Condensed Matter Physics. J. Phys. Condens. Matter 2020. [Google Scholar] [CrossRef]
  34. Wang, Z.; Shi, X.; Yang, X.-S.; He, W.; Shi, S.-Q.; Ma, X. Atomistic simulation of the effect of the dissolution and adsorption of hydrogen atoms on the fracture of α-Fe single crystal under tensile load. Int. J. Hydrogen Energy 2020. [Google Scholar] [CrossRef]
  35. Plimpton, S. Fast Parallel Algorithms for Short-Range Molecular Dynamics for the United States Department of Energy under Contract DE.ACO4-76DPOO789. J. Comput. Phys. 1995, 117, 1–19. [Google Scholar] [CrossRef] [Green Version]
  36. Mendelev, M.I.; Han, S.; Srolovitz, D.J.; Ackland, G.J.; Sun, D.Y.; Asta, M. Development of new interatomic potentials appropriate for crystalline and liquid iron. Philos. Mag. 2003, 83, 3977–3994. [Google Scholar] [CrossRef]
  37. Ramasubramaniam, A.; Itakura, M.; Carter, E.A. Interatomic potentials for hydrogen in alpha-iron based on density functional theory. Phys. Rev. B 2010, 81, 099902. [Google Scholar] [CrossRef] [Green Version]
  38. Thompson, A.P.; Plimpton, S.J.; Mattson, W. General formulation of pressure and stress tensor for arbitrary many-body interaction potentials under periodic boundary conditions. J. Chem. Phys. 2009, 131, 154107. [Google Scholar] [CrossRef] [Green Version]
  39. Zhang, T.Y.; Jiang, F.X.; Chu, W.Y.; Hsiao, C.M. Effect of hydrogen on the Young’s modulus of iron. Metall. Trans. A 1985, 16, 1655–1662. [Google Scholar] [CrossRef]
  40. Knuth, D.E. The Art of Computer Programming: Seminumerical Algorithms, 3rd ed.; Addison Wesley Longman: Reading, MA, USA, 1997. [Google Scholar]
  41. Shinoda, W.; Shiga, M.; Mikami, M. Rapid estimation of elastic constants by molecular dynamics simulation under constant stress. Phys. Rev. B 2004, 69, 1341031. [Google Scholar] [CrossRef]
  42. Parrinello, M.; Rahman, A. Strain fluctuations and elastic constants. J. Chem. Phys. 1982, 76, 2662–2666. [Google Scholar] [CrossRef]
  43. Gusev, A.A.; Zehnder, M.M.; Suter, U.W. Fluctuation formula for elastic constants. Phys. Rev. B 1996, 54, 1–4. [Google Scholar] [CrossRef]
  44. Ray, J.R. Ensembles and Computer Simulation Calculation of Response Functions BT—Handbook of Materials Modeling: Methods; Yip, S., Ed.; Springer: Dordrecht, The Netherlands, 2005; pp. 729–743. ISBN 978-1-4020-3286-8. [Google Scholar]
  45. Switendick, A.C. Band Structure Calculations for Metal Hydrogen Systems. Zeitschrift Phys. Chem. 1979, 117, 89. [Google Scholar] [CrossRef] [Green Version]
  46. Newnham, R.E. Properties of Materials:Anisotropy, Symmetry, Structure, 1st ed.; Oxford University Press: Oxford, UK, 2005; ISBN 0-19-852075-1. [Google Scholar]
  47. Comaniciu, D.; Meer, P. Mean shift: A robust approach toward feature space analysis. IEEE Trans. Pattern Anal. Mach. Intell. 2002, 24, 603–619. [Google Scholar] [CrossRef] [Green Version]
  48. Pedregosa, F.; Varoquaux, G.; Gramfort, A.; Michel, V.; Thirion, B.; Grisel, O.; Blondel, M.; Prettenhofer, P.; Weiss, R.; Dubourg, V.; et al. Scikit-learn: Machine Learning in Python. J. Mach. Learn. Res. 2011, 12, 2825–2830. [Google Scholar]
  49. Ni, X.D.; Wang, Z.; Sun, X.; Shen, J.; Chen, N.X. Mechanism of Ag and Al on improving the glass forming ability of CuZr-based alloys. Int. J. Miner. Metall. Mater. 2011, 18, 424–429. [Google Scholar] [CrossRef]
  50. Momma, K.; Izumi, F. VESTA3 for three-dimensional visualization of crystal, volumetric and morphology data. J. Appl. Crystallogr. 2011, 44, 1272–1276. [Google Scholar] [CrossRef]
  51. Zhou, X.Y.; Yang, X.S.; Zhu, J.H.; Xing, F. Atomistic simulation study of the grain-size effect on hydrogen embrittlement of nanograined Fe. Int. J. Hydrogen Energy 2020, 45, 3294–3306. [Google Scholar] [CrossRef]
  52. Dragoni, D.; Ceresoli, D.; Marzari, N. Vibrational and thermoelastic properties of bcc iron from selected EAM potentials. Comput. Mater. Sci. 2018, 152, 99–106. [Google Scholar] [CrossRef] [Green Version]
  53. Adams, J.J.; Agosta, D.S.; Leisure, R.G.; Ledbetter, H. Elastic constants of monocrystal iron from 3 to 500 K. J. Appl. Phys. 2006, 100. [Google Scholar] [CrossRef]
  54. Shirkhorshidi, A.S.; Aghabozorgi, S.; Wah, T.Y.; Herawan, T. Big data clustering: A review. Lect. Notes Comput. Sci. 2014, 8583 LNCS, 707–720. [Google Scholar] [CrossRef]
  55. Parker, A.J.; Barnard, A.S. Selecting Appropriate Clustering Methods for Materials Science Applications of Machine Learning. Adv. Theory Simulations 2019, 2, 1–8. [Google Scholar] [CrossRef]
  56. Spitzig, W.A.; Keh, A.S. Orientation and temperature dependence of slip in iron single crystals. Metall. Trans. 1970, 1, 2751. [Google Scholar] [CrossRef]
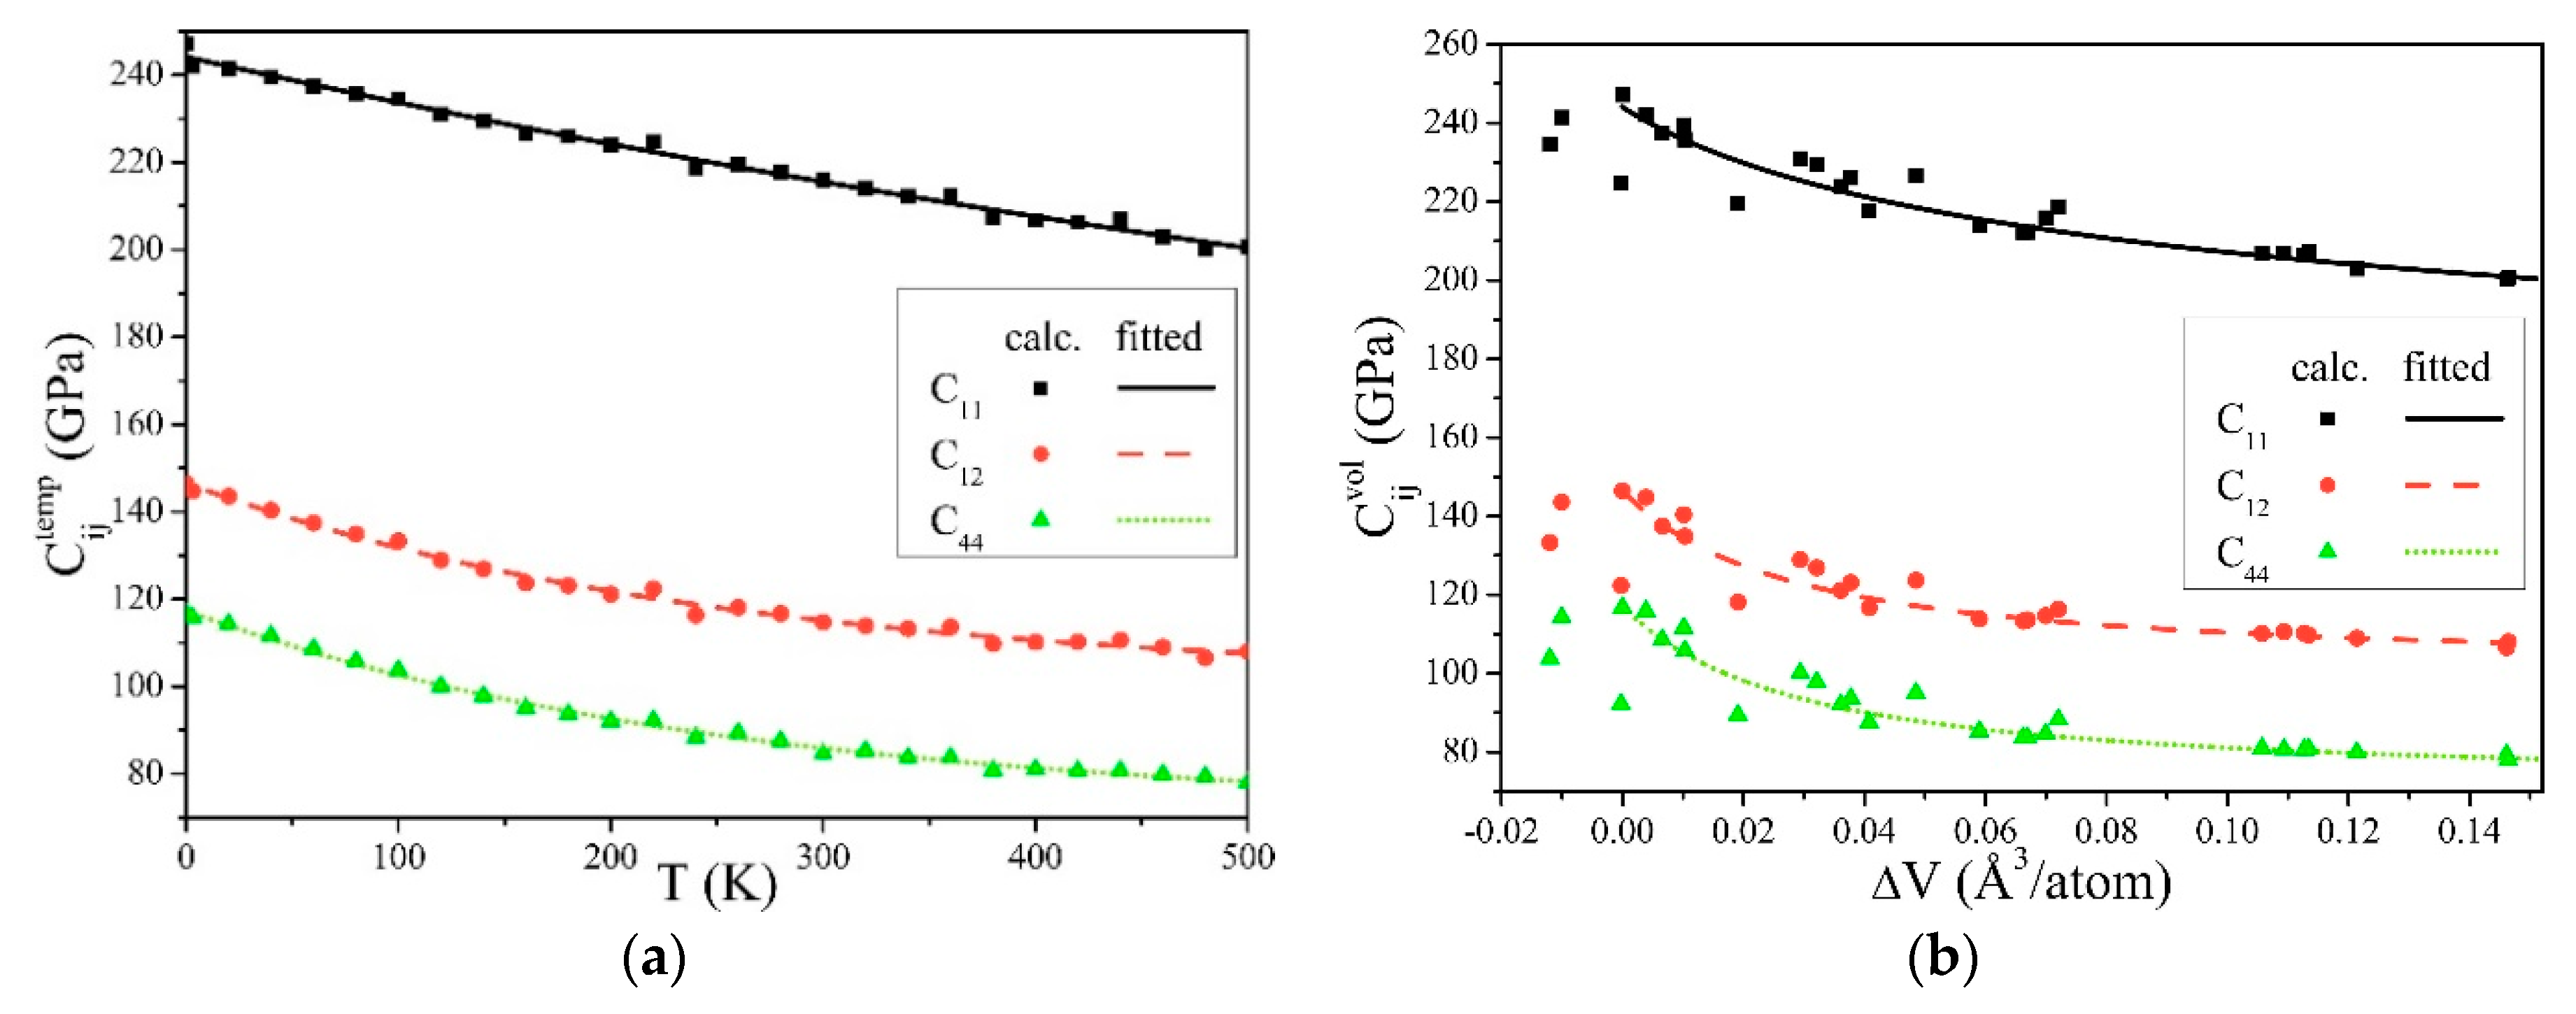
Figure 1. Elastic constants of α-Fe, influenced by (a) the temperatures, and (b) the changes of volumes.
Applsci 10 08958 g001
Figure 2. Elastic constants of α-Fe influenced by hydrogen concentrations (cH), in which the C i j v o l decreases and the C i j c o h increases with the increase of cH.
Applsci 10 08958 g002
Figure 3. Solute hydrogen atom effects on the elastic moduli of the α-Fe single crystal. (a) Averaged elastic moduli changes. This shows that Young’s modulus E, the bulk modulus B, and shear modulus G were all slightly decreased by the hydrogen solution, which is a combination of the decrease by volume and the increasing by cohesion. (b) The hydrogen distribution influences on the moduli in each structure, which indicates that the slight differences in the microscopic distribution of hydrogen atoms might cause different effects from the averaged results.
Applsci 10 08958 g003
Figure 4. Mean-shift clustering for the differences of the elastic moduli in generated structures. (a) The projection of points in the S system and the clustering results on the Δ E d i s - Δ G d i s plane, which shows the linear correlation of Δ E d i s and Δ G d i s . (b) The projection of points in the S system and the clustering results on the Δ E d i s - Δ B d i s plane, which shows that group 0 contained the most structures, and that there was no linear relationship of Δ E d i s and Δ B d i s .
Applsci 10 08958 g004
Figure 5. The averaged partial pair-correlation function (PCF) g ¯ ( r ) for structures in clustered groups. Δ E d i s and Δ G d i s increased with the hydrogen atoms distributed in the 5th nearest neighbor (5NN) and 10th nearest neighbor (10NN) sites.
Applsci 10 08958 g005
Figure 6. Clustering and averaged partial PCF analysis for the hydrogen distribution effects on Δ B d i s . (a) Mean-shift clustering for Δ B d i s , with an x axis of Δ M E G d i s , transformed using Equation (16). (b) The averaged partial PCF g ¯ ( r ) for structures in clustered groups. Δ B d i s decreased with the hydrogen atoms distributed in the 7NN.
Applsci 10 08958 g006
Figure 7. Statistics of the densities of the sites on nth nearest neighbors, which can be occupied by hydrogen atoms on different slip planes in α-Fe. (a) The sketch map of the sites can be occupied by hydrogen atoms on the section of (hkl) planes and the spherical shells can be determined by the positions at the same distance from the reference site Z. The positions are distributed on the concentric spherical shells determined by the distances from Z, and those positions with the same distance from Z are distributed on the same spherical shell. Using one of the {hkl} planes to intersect a certain shell, the hydrogen atoms shared by the shell and the plane determine the local cH on this plane. A set of parallel planes intersects this spherical shell, and the effect on the slip depends on the averaged concentration of this set of crystal planes. (b) The Tet-site densities ρ{110} and ρ{112} on the {110} and {112} planes at the nth NN. They are greater than 0 at many NN, and generally ρ{110} > ρ{112}. ρ{112} is the largest at 10NN and 7NN, and is significantly larger than ρ{110} at 10NN.
Applsci 10 08958 g007
Figure 8. A selected reference site Z, its 5NN, 6NN, 10NN, and 7NN positions, and the planes decided by them in the α-Fe single crystal. (a) The 5NN and 6NN positions of Z (s5NN-6NN) and the maximum density planes of them. (b) Two types of {110} and one type of {112} plane decided by s5NN-6NN. (c) The 5NN and 10NN positions of Z (s5NN-10NN) and the maximum density planes of them. (d) Three types of {110} and one type of {112} plane decided by s5NN-10NN. (e) The 7NN positions of Z (s7NN) and the maximum density planes of them. (f) Two types of {110} and three types of {112} planes decided by s7NN, in which the type I and II planes of {110} are parallel but with different shapes.
Applsci 10 08958 g008aApplsci 10 08958 g008b
Table 1. The elastic constants and moduli of α-Fe.
Data SourceElastic Constants (GPa)Elastic Moduli (GPa)
C11C12C44EBG
This work247.13146.47116.75231.83180.0290.18
Experiment [53]239.55135.75120.75236.50170.3593.21
Table 2. Fitted parameters for the relationships of the elastic constants and the changes of temperatures and volumes.
ParameterResultParameterResultParameterResult
y 1 3/atom)−0.03212 b 1 3/atom)0.03199 b 2 (K)−286.533
y 2 11 (GPa)−121.484 b 3 11 (GPa)118.488 b 4 11 (K)1085.129
y 2 12 (GPa)−45.014 b 3 12 (GPa)45.113 b 4 12 (K)250.363
y 2 44 (GPa)−44.799 b 3 44 (GPa)45.431 b 4 44 (K)253.642
Table 3. The densest planes (DPs) of s5NN-6NN, s5NN-10NN, and s7NN.
s5NN-6NNs5NN-10NNs7NN
Plane FamilyDensity (Sites/Å2)Mark by SitesPlane FamilyDensity (Sites/Å2)Mark by SitesPlane FamilyDensity (Sites/Å2)Mark by Sites
{210}0.5122DEMO, BGJN, DEIK, BGLP{100}0.5163IJBGPO, DEMNLK{120}0.5122CDMP, JKON, EFGL, ABHI
{531}0.4845ADI, BCJ, CGN, DFM, GHP, AEK, BHL, EFO{120}0.4704ABCDEF, BCIJOP, GHIJKL, DEKLMN
{100}0.4652AFGH, MNOP
Table 4. The {110} and {112} planes decided by the s5NN-6NN, s5NN-10NN, and s7NN as well as the selected reference hydrogen atom Z.
Plane Familys5NN-6NNs5NN-10NNs7NN
TypeMark by SitesTypeMark by SitesTypeMark by Sites
{110}IILMPZ, IKNPZ, JLMOZ, JKNOZIJKM, JKP, JMP, KMPIBENO, ILMP, ADHK, CFGJ
IIAIK, BJL, CJN, DIM, EKO, FMO, GNP, HLPIIIJLK, IJMN, MNOP, KLOPIIAFKJ, BIMN, ELOP, CDGH
IIIAGLNI, BFLNO, CEIOL, DHIONIIIABNK, CGLP, EFJO, DHIM
{112}IAJM, ALO, BIN, BKP, CIL, CMP, DJK, DNO, EIL, EMP, FIN, FKP, GJM, GLO, HJK, HNOIIKNPZ, ILMPZ, JKNOZ, IJMOZIAEK, BFJ, CGI, BDN, CEO, DHL, IKM, JLP
IIBNP, EMO, IMO, LNP, ACG, AGK, DFH, FHJ
IIIBNZ, IMZ, EOZ, LPZ
Publisher’s Note: MDPI stays neutral with regard to jurisdictional claims in published maps and institutional affiliations.