Fatigue Life Simulation of Tractor Spiral Bevel Gear According to Major Agricultural Operations

 ,
,  , ,
, ,  ,
,
Abstract
1. Introduction
2. Simulation Model Development
2.1. Software
2.2. Tractor Power Transmission System
2.3. Spiral Bevel Gear
2.4. Simulation Model
2.5. Fatigue Life Evaluation Method
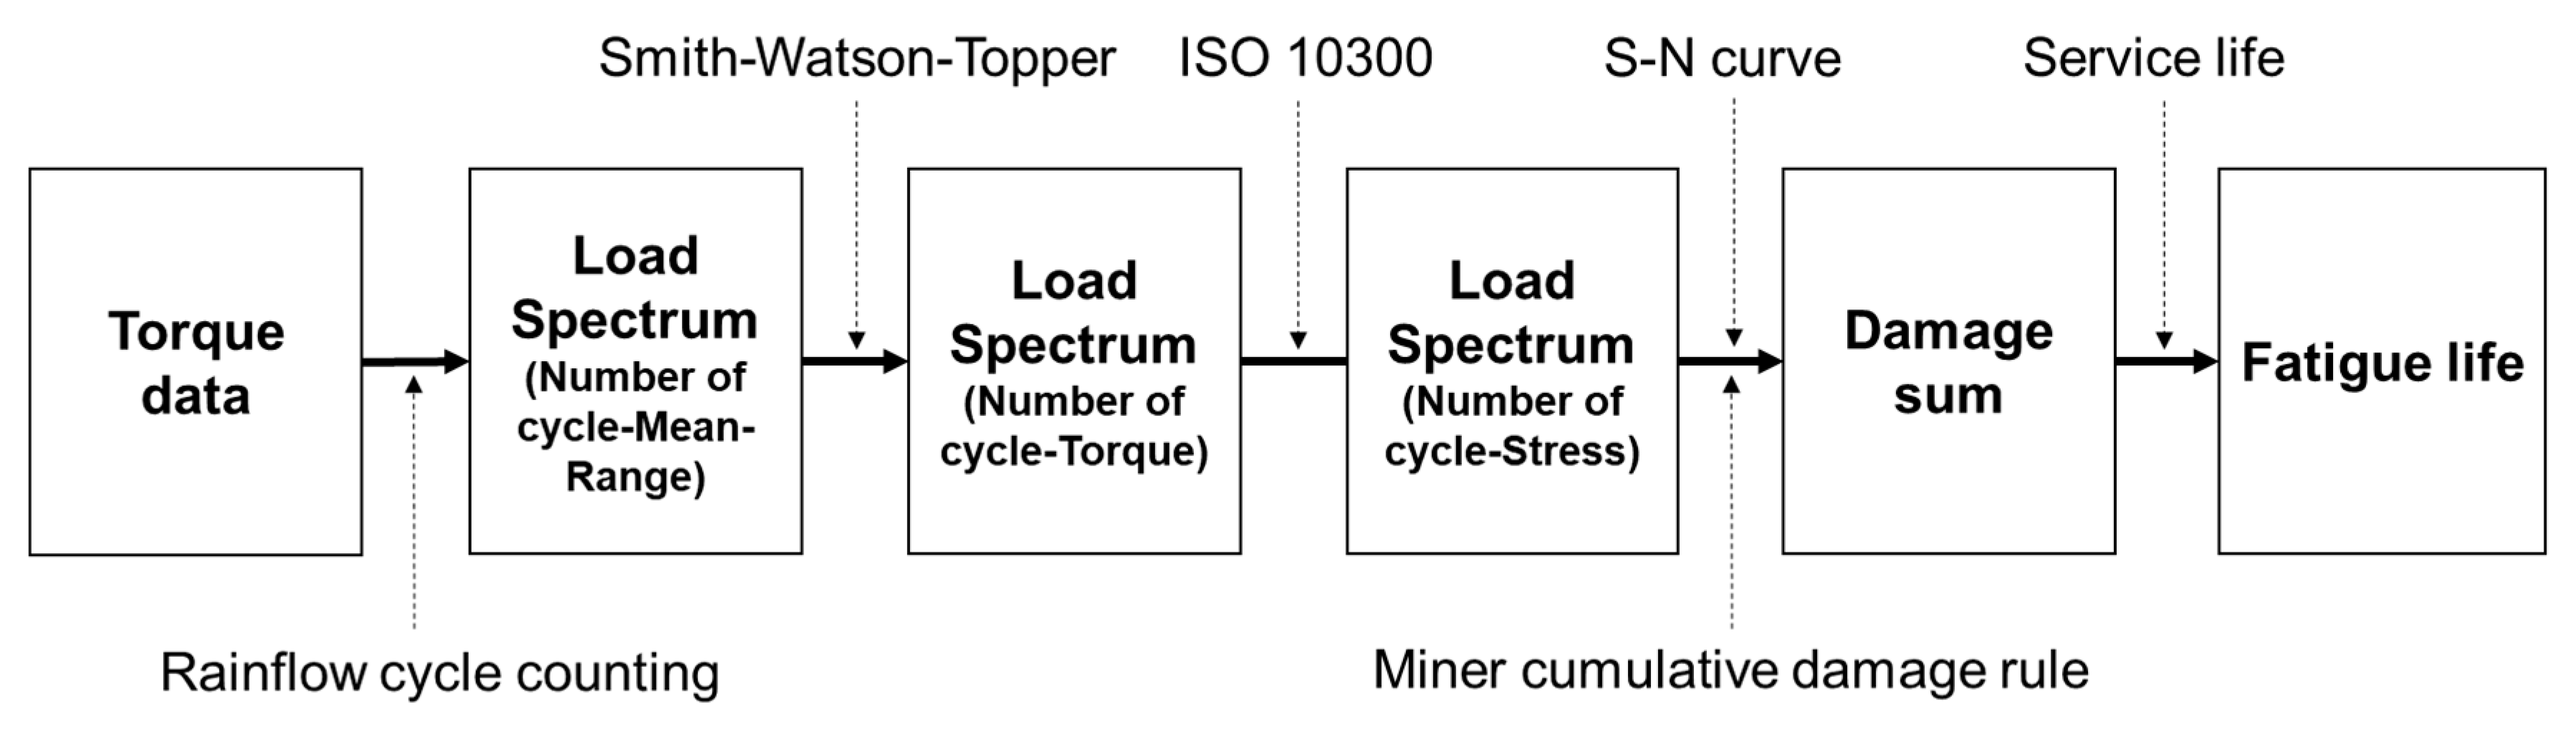
2.5.1. Procedure
2.5.2. RFC and Load Spectrum
2.5.3. Damage Sum
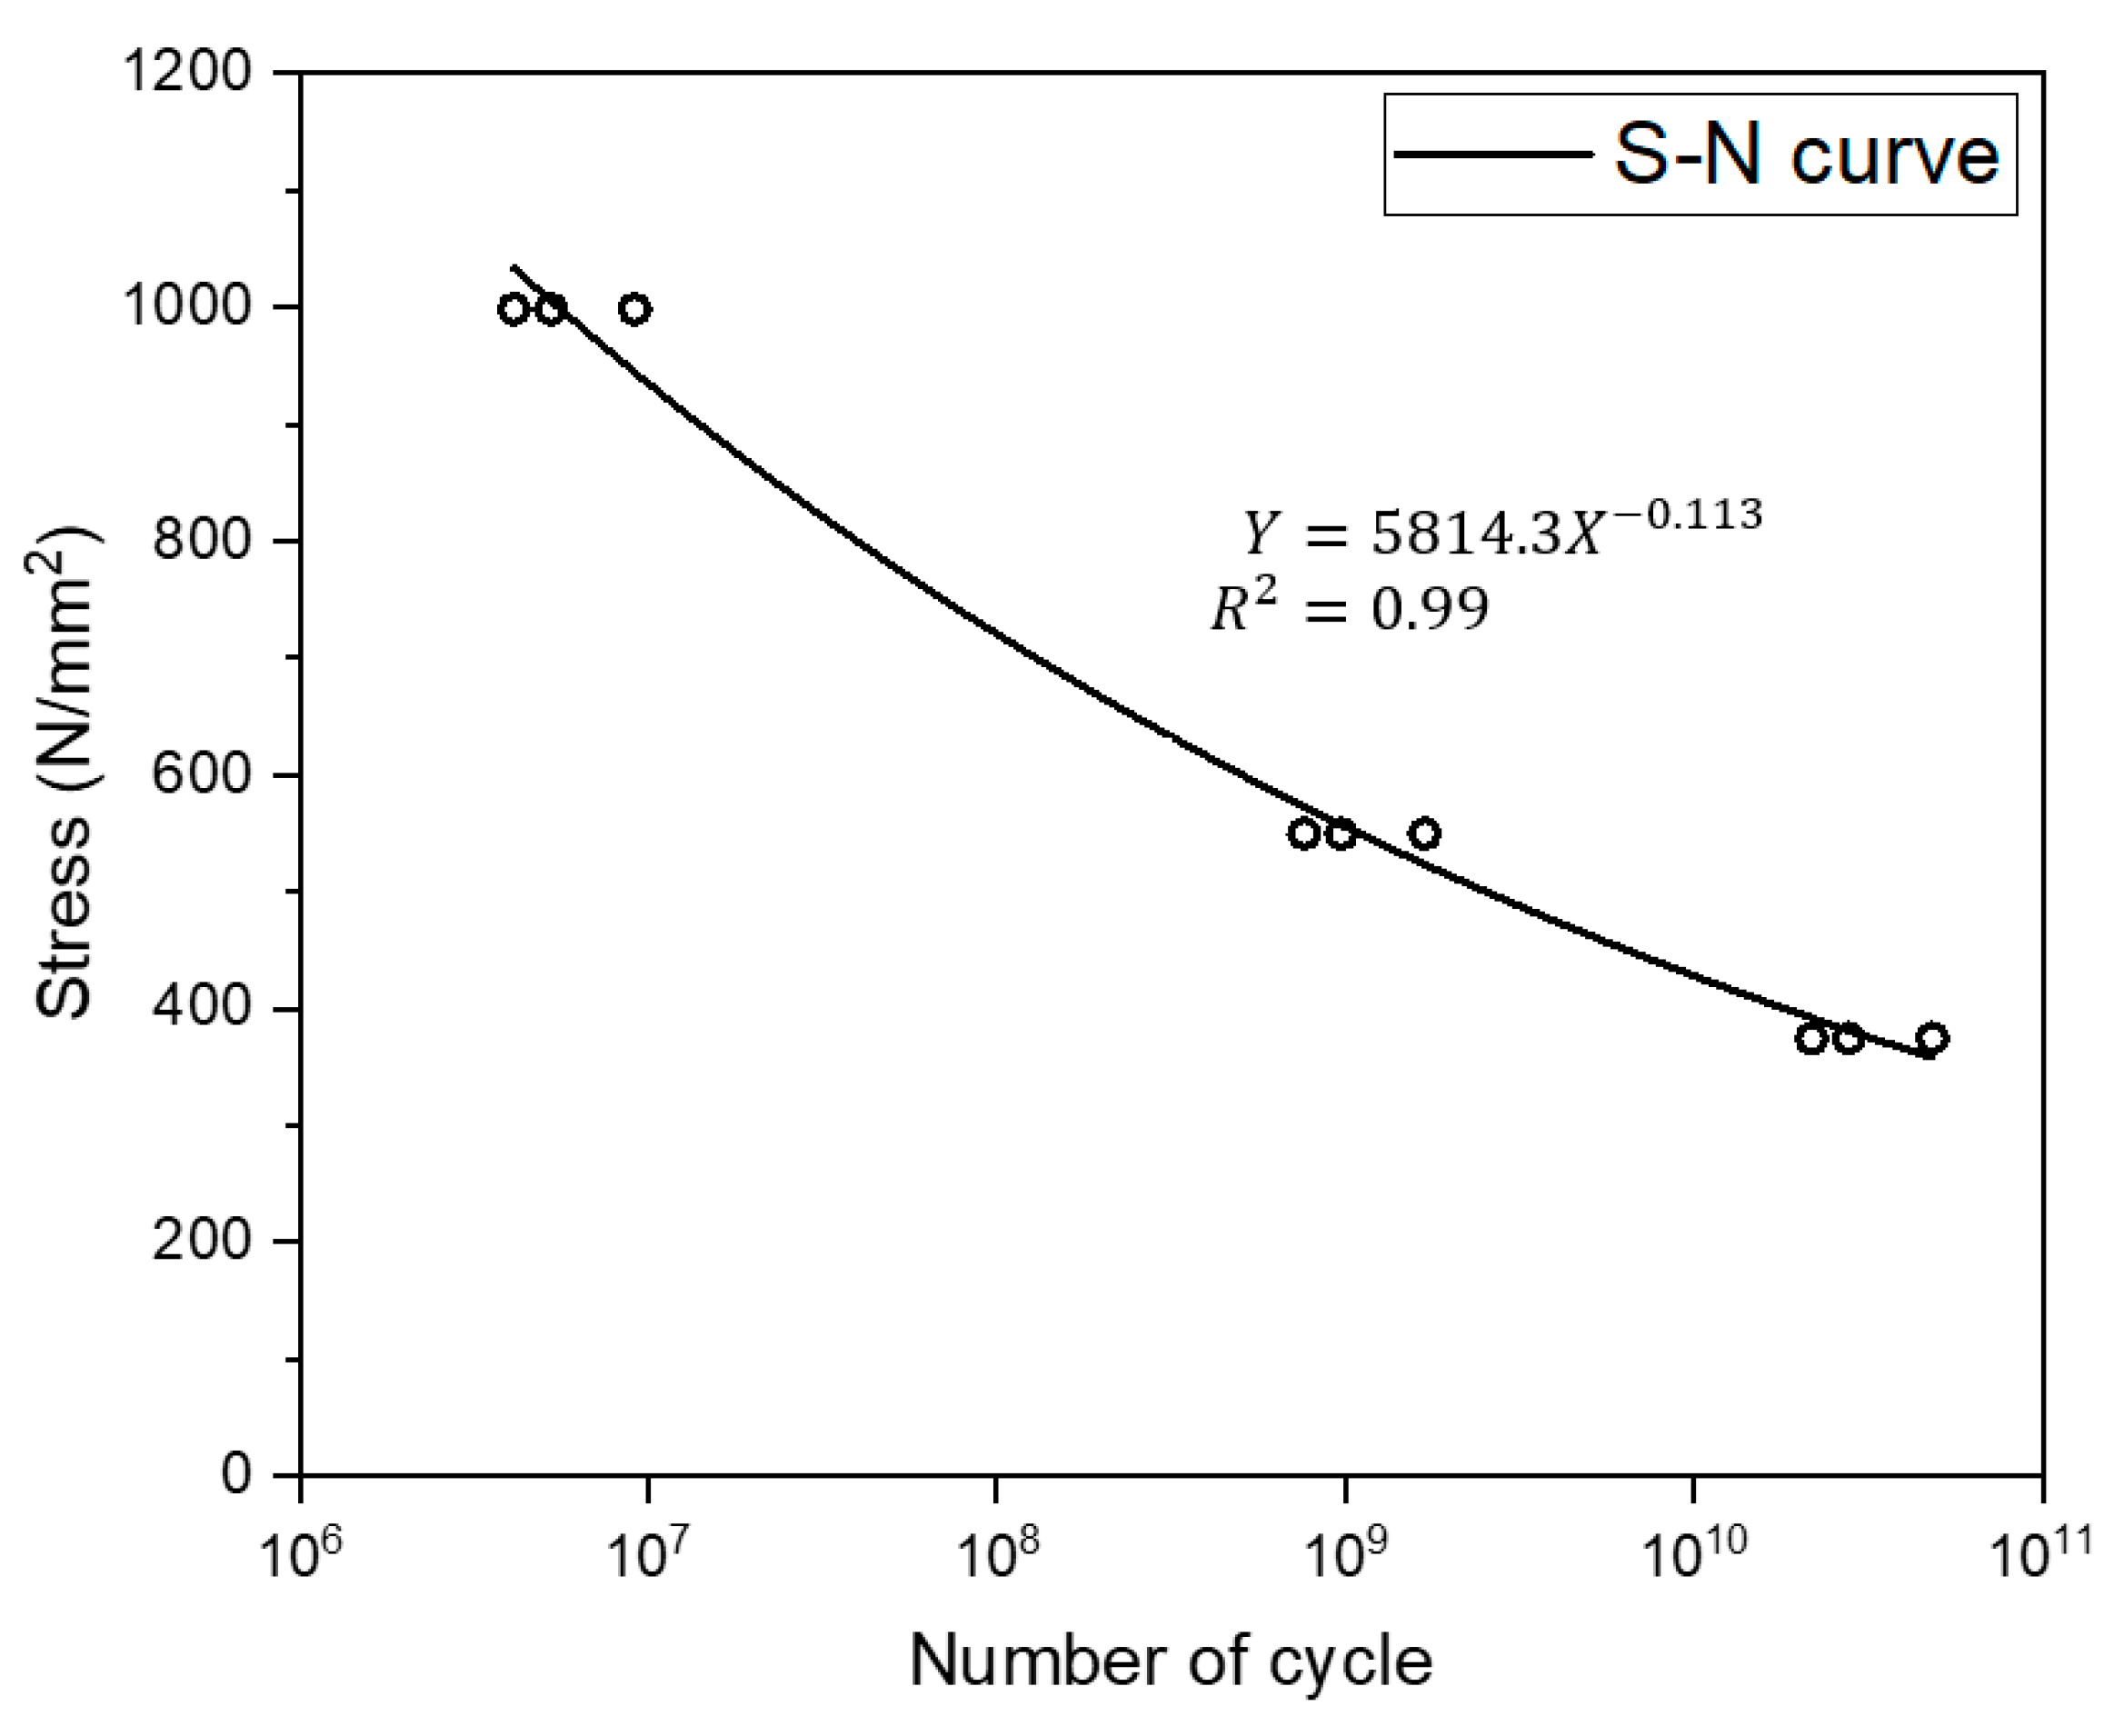
2.5.4. Fatigue Life
2.6. Simulation Conditions
3. Field Data Acquisition
3.1. Data Measurement System
3.2. Field Sites
3.3. Major Agricultural Field Operations
4. Results
4.1. Dynamic Load Analysis
4.2. Load Spectra
4.3. Fatigue Life Evaluation Based on Simulation Model
5. Discussion
6. Conclusions
Author Contributions
Funding
Conflicts of Interest
References
- The Freedonia Group. Freedonia Group Global Agricultural Equipment. Study #: 3872. 2019. Available online: https://www.freedoniagroup.com/World-Agricultural-Equipment.html (accessed on 30 September 2020).
- KAMICO; KSAM. Agricultural Machinery Yearbook in Republic of Korea, Korea Agricultural Machinery Industry Cooperative and Korean Society for Agricultural Machinery; KAMICO: Cheonan, Korea; KSAM: Cheonan, Korea, 2019. [Google Scholar]
- Kim, Y.J.; Chung, S.O.; Choi, C.H. Effects of gear selection of an agricultural tractor on transmission and PTO load during rotary tillage. Soil Tillage Res. 2013, 134, 90–96. [Google Scholar] [CrossRef]
- Kim, W.S.; Kim, Y.J.; Baek, S.Y.; Baek, S.M.; Kim, Y.S.; Park, S.U. Development of a prediction model for tractor axle torque during tillage operation. Appl. Sci. 2020, 10, 4195. [Google Scholar] [CrossRef]
- Kim, D.C.; Kang, Y.S. Case study of accelerated life test method for agricultural tractor transmission. J. Biosyst. Eng. 2009, 34, 325–330. [Google Scholar] [CrossRef]
- Ashmore, S.C.; Piersol, A.G.; Witte, J.J. Accelerated service life testing of automotive vehicles on a test course. Veh. Syst. Dyn. 1992, 21, 89–108. [Google Scholar] [CrossRef]
- Kim, Y.S.; Lee, P.U.; Kim, W.S.; Kwon, O.W.; Kim, C.W.; Lee, K.H.; Kim, Y.J. Strength analysis of a PTO (Power Take-Off) gear-train of a multi-purpose cultivator during a rotary ditching operation. Energies 2019, 12, 1. [Google Scholar] [CrossRef]
- Kim, T.J.; Kim, W.S.; Kim, Y.S.; Chung, S.O.; Park, S.U.; Hong, S.J.; Choi, C.H.; Kim, Y.J. Strength analysis of mechanical transmission using equivalent torque of plow tillage of an 82 kW-class tractor. Korean J. Agric. Sci. 2019, 46, 723–735. [Google Scholar]
- Baek, S.M.; Kim, W.S.; Kim, Y.S.; Lee, N.G.; Kim, N.H.; Kim, Y.J. Analysis of the load distribution and contact safety factor of PTO gears of a 71 kW class agricultural tractor. Korean J. Agric. Sci. 2020, 47, 327–335. [Google Scholar]
- Litvin, F.L.; Fuentes, A.; Fan, Q.; Handschuh, R.F. Computerized design, simulation of meshing, and contact and stress analysis of face-milled formate generated spiral bevel gears. Mech. Mach. Theory 2002, 37, 441–459. [Google Scholar] [CrossRef]
- Kong, M.G.; Song, C.K.; Kim, Y.D. Strength Design Evaluation of the Multi-range Transmission. J. Korea Soc. Power Syst. Eng. 2011, 15, 12–17. [Google Scholar] [CrossRef]
- Wu, Y.R.; Tran, V.T. Transmission and load analysis for a crowned helical gear pair with twist-free tooth flanks generated by an external gear honing machine. Mech. Mach. Theory 2016, 98, 36–47. [Google Scholar] [CrossRef]
- Dong, W.; Xing, Y.; Moan, T.; Gao, Z. Time domain-based gear contact fatigue analysis of a wind turbine drivetrain under dynamic conditions. Int. J. Fatigue 2013, 48, 133–146. [Google Scholar] [CrossRef]
- Islam, M.N.; Iqbal, M.Z.; Kabir, M.S.N.; Jung, K.Y.; Mun, D.H.; Chung, S.O. Performance evaluation of trenchless subsurface drainage piping machine. J. Biosyst. Eng. 2019, 44, 218–225. [Google Scholar] [CrossRef]
- Okyere, F.G.; Qasim, W.; Basak, J.K.; Khan, F.; Lee, Y.J.; Park, J.; Arulmozhi, E.; Yoon, Y.C.; Kang, D.S.; Kim, H.T. Analysis of draft force requirement of a compact disc harrow and model development for future predictions. J. Biosyst. Eng. 2019, 44, 47–56. [Google Scholar] [CrossRef]
- Kim, W.S.; Kim, Y.S.; Kim, T.J.; Park, S.U.; Choi, Y.; Choi, I.S.; Kim, Y.K.; Kim, Y.J. Analysis of power requirement of 78 kW class agricultural tractor according to the major field operation. Trans. Korean Soc. Mech. Eng. A 2019, 43, 911–922. [Google Scholar] [CrossRef]
- Kim, Y.J.; Chung, S.O.; Park, S.J.; Choi, C.H. Analysis of power requirement of agricultural tractor by major field operation. J. Biosyst. Eng. 2011, 36, 79–88. [Google Scholar] [CrossRef]
- Kim, W.S.; Kim, Y.J.; Park, S.U.; Hong, S.J.; Kim, Y.S. Evaluation of PTO severeness for 78 kW-class tractor according to disk plow tillage and rotary tillage. J. Drive Control 2019, 16, 23–31. [Google Scholar]
- Kim, W.S.; Baek, S.Y.; Kim, T.J.; Kim, Y.S.; Park, S.U.; Choi, C.H.; Hong, S.J.; Kim, Y.J. Work load analysis for determination of the reduction gear ratio for a 78 kW all wheel drive electric tractor design. Korean J. Agric. Sci. 2019, 46, 613–627. [Google Scholar]
- Renius, K.T. Random load fatigue in tractor transmissions. Landtechnik 2001, 56, 390–391. [Google Scholar]
- Kim, J.H.; Kim, K.U.; Wu, Y.G. Analysis of transmission load of agricultural tractors. J. Terramechanics 2000, 37, 113–125. [Google Scholar] [CrossRef]
- Lee, J.S.; Yu, H.Y.; Lee, G.T.; Kim, D.C. Analysis of load spectrum of 70kW-class tractor for plowing operation. J. Agric. Life Sci. 2014, 45, 18–22. [Google Scholar]
- Graham, J.A.; Berns, D.K.; Olberts, D.R. Cumulative damage used to analyze tractor final drives. Trans. ASAE 1962, 5, 0139–0146. [Google Scholar] [CrossRef]
- Lee, D.H.; Kim, Y.J.; Chung, S.O.; Choi, C.H.; Lee, K.H.; Shin, B.S. Analysis of the PTO load of a 75 kW agricultural tractor during rotary tillage and baler operation in Korean upland fields. J. Terramechanics 2015, 60, 75–83. [Google Scholar] [CrossRef]
- Han, K.H.; Kim, K.U.; Wu, Y.G. Severeness of transmission loads of agricultural tractor for rotary operations in poorly drained paddy field. J. Biosyst. Eng. 1999, 24, 293–300. [Google Scholar]
- Mattetti, M.; Molari, G.; Sereni, E. Damage evaluation of driving events for agricultural tractors. Comput. Electron. Agric. 2017, 135, 328–337. [Google Scholar] [CrossRef]
- Bai, J.; Wu, X.; Gao, F.; Li, H. Analysis of powertrain loading dynamic characteristics and the effects on fatigue damage. Appl. Sci. 2017, 7, 1027. [Google Scholar] [CrossRef]
- ASM. Fatigue and Fracture; Campbell, F., Ed.; ASM International: Almere, The Netherlands, 2012; ISBN 9781615039760. [Google Scholar]
- Xiong, J.J.; Shenoi, R.A. A reliability-based data treatment system for actual load history. Fatigue Fract. Eng. Mater. Struct. 2005, 28, 875–889. [Google Scholar] [CrossRef]
- Dowling, N.E. Fatigue failure predictions for complicated stress-strain histories. J. Mater. 1972, 7, 71–87. [Google Scholar]
- Chen, J.; Li, W.; Sheng, L.; Jiang, S.; Li, M. Study on reliability of shearer permanent magnet semi-direct drive gear transmission system. Int. J. Fatigue 2020, 132, 105387. [Google Scholar] [CrossRef]
- Yan, Y. Load characteristic analysis and fatigue reliability prediction of wind turbine gear transmission system. Int. J. Fatigue 2020, 130, 105259. [Google Scholar] [CrossRef]
- Smith, K.N.; Watson, P.; Topper, T.H. A stress-strain fuction for the fatigue of metals. J. Mater. 1970, 5, 767–778. [Google Scholar]
- Fatemi, A.; Yang, L. Cumulative fatigue damage and life prediction theories. Int. J. Fatigue 1998, 20, 9–34. [Google Scholar] [CrossRef]
- Lee, D.H. Analysis of Power Requirements of Tractor for Field Operations; Sungkyunkwan University: Suwon, Korea, 2011. [Google Scholar]
- Lee, P.U.; Chung, S.O.; Choi, C.H.; Park, Y.J.; Kim, Y.J. Analysis of the effects of operating point of tractor engine on fatigue life of PTO gear using simulation. Korean J. Agric. Sci. 2016, 43, 441–449. [Google Scholar] [CrossRef]
- Fernandes, P.J.L. Tooth bending fatigue failures in gears. Eng. Fail. Anal. 1996, 3, 219–225. [Google Scholar] [CrossRef]
- ISO. ISO 10300-1:2014. Calculation of Load Capacity of Bevel Gears—Part 1: Introduction and General Influence Factors; Vernier: Geneva, Switzerland, 2014. [Google Scholar]
- ISO. ISO 10300-2:2014. Calculation of Load Capacity of Bevel Gears—Part 2: Calculation of Surface Durability (Pitting); Vernier: Geneva, Switzerland, 2014. [Google Scholar]
- ISO. ISO 10300-3:2014. Calculation of Load Capacity of Bevel Gears—Part 3: Calculation of Tooth Root Strength; Vernier: Geneva, Switzerland, 2014. [Google Scholar]
- Park, S.U. Fatigue life evaluation of spiral bevel gear of transmission using agricultural workload of tractor. Ph.D. Thesis, Chungnam National University, Daejeon, Korea, 2019. [Google Scholar]
- Miner, M.A. Cumulative damage in fatigue. J. Appl. Mech. 1945, 3, 159–164. [Google Scholar]
- Lias, M.R.; Isa, M.J.; Ahmad, A.S. Bending Fatigue Life Prediction of Spur Gear in Axial Misalignment Condition. IOP Conf. Ser. Mater. Sci. Eng. 2020, 864, 012109. [Google Scholar] [CrossRef]
- Korean Standards Association. Cylindrical Gears-ISO System of Accuracy-Part 1: Definitions and Allowable Values of Deviations Relevant to Corresponding Flanks of Gear Teeth; Korean Standards Association: Seoul, Korea, 2015. [Google Scholar]
- Kim, W.S.; Kim, Y.J.; Baek, S.M.; Baek, S.Y.; Moon, S.P.; Lee, N.G.; Kim, T.J.; Siddique, M.A.A.; Jeon, H.H.; Kim, Y.S. Effect of the Cone Index on the Work Load of the Agricultural Tractor. J. Drive Control 2020, 17, 9–18. [Google Scholar]


| Items | Specifications | |
|---|---|---|
| Dimension | 4225 × 2140 × 2830 mm | |
| Weight (ratio of front and rear axle) | 3985 (42.4% and 57.6%) | |
| Engine | Model | D34P |
| Rated power | 78 kW at 2300 rpm | |
| Rated torque | 324 Nm at 2300 rpm | |
| Maximum torque | 430 Nm at 1400 rpm | |
| Powertrain | Type | Power Shuttle |
| Number of gear stages | 32 Forward/32 Reverse | |
| Power shift | 2 (High and Low) | |
| Driving shift | 4 (1, 2, 3, and 4) | |
| Range shift | 4 (C, L, M, and H) | |
| Tire (Front and rear axle) | Type | Bias ply |
| Size | 13.6–24 8PR and 18.4–34 10PR | |
| Pressure | 216 and 157 kPa | |
| Static loaded radius | 0.545 and 0.740 m | |
| Parameters | Pinion Gear | Ring Gear |
|---|---|---|
| Tooth profile | Gleason | |
| Module (mm) | 6.5 | |
| Pressure angle (°) | 20 | |
| Helix angle (°) | 35 | |
| Center distance (mm) | 89 | |
| Material | SCM822 | |
| Number of teeth | 11 | 42 |
| Face width (mm) | 42.5 | 42.5 |
| Pitch circle diameter (mm) | 71.5 | 273 |
| Cone distance (mm) | 141.104 | 141.104 |
| Parameters | Values |
|---|---|
| 2.89 | |
| 1.58 | |
| 0.63 | |
| 1.027 | |
| 0.963 | |
| 1 | |
| 1 | |
| 3.37 | |
| 1 |
| Sites | Soil Texture | Soil Moisture Content (%) | Cone Index (kPa) by Depth | |||||
|---|---|---|---|---|---|---|---|---|
| 0 cm | 5 cm | 10 cm | 15 cm | 20 cm | 25 cm | |||
| Site 1 | Loam | 27 | 199 | 474 | 828 | 1484 | 2467 | - |
| Site 2 | Loam | 32 | 270 | 875 | 1146 | 1670 | 3549 | 3743 |
| Site 3 | Loam | 42 | 114 | 389 | 720 | 1552 | 2794 | 2750 |
| Site 4 | Clay loam | 37 | 191 | 423 | 476 | 742 | 2241 | 3052 |
| Implements | Model | Dimensions (Length × Width × Height; mm) | Weight (kg) | Number of Ridges (Blades) | Working Width (mm) | Required Power (kW) |
|---|---|---|---|---|---|---|
| Moldboard plow | WJSP-8 (WOONGJIN) | 2180 × 2800 × 1285 | 495 | 8 | 2800 | 78 ↑ |
| Subsoiler | WHDP500 (WECAN GLOBAL) | 1800 × 2095 × 1380 | 870 | 5 | 2095 | 75 ↑ |
| Rotavator | SW 230 GL (SUNGWOO) | 930 × 2640 × 1280 | 735 | 54 | 2300 | 60 ↑ |
| Round baler | L325 (LIVEMAC) | 3490 × 2430 × 2400 | 3180 | - | 2000 | 67 ↑ |
| Field Operations | Spiral Bevel Gear Torque (Nm) | |||
|---|---|---|---|---|
| Working Period (A) | Steering Period (B) | |||
| Max. | Avg. ± Std. | Max. | Avg. ± Std. | |
| Moldboard plow tillage | 750.7 | 614.7 ± 45.1 | 784.8 | 214.0 ± 202.1 |
| Subsoiler tillage | 1324 | 876.5 ± 293.9 | 1205 | 400.3 ± 238 |
| Rotary tillage | 617.8 | 47.2 ± 46.3 | 481.4 | 305.1 ± 74.1 |
| Baler operation | 584.0 | 55.9 ± 49.5 | 358.9 | 212.8 ± 87.0 |
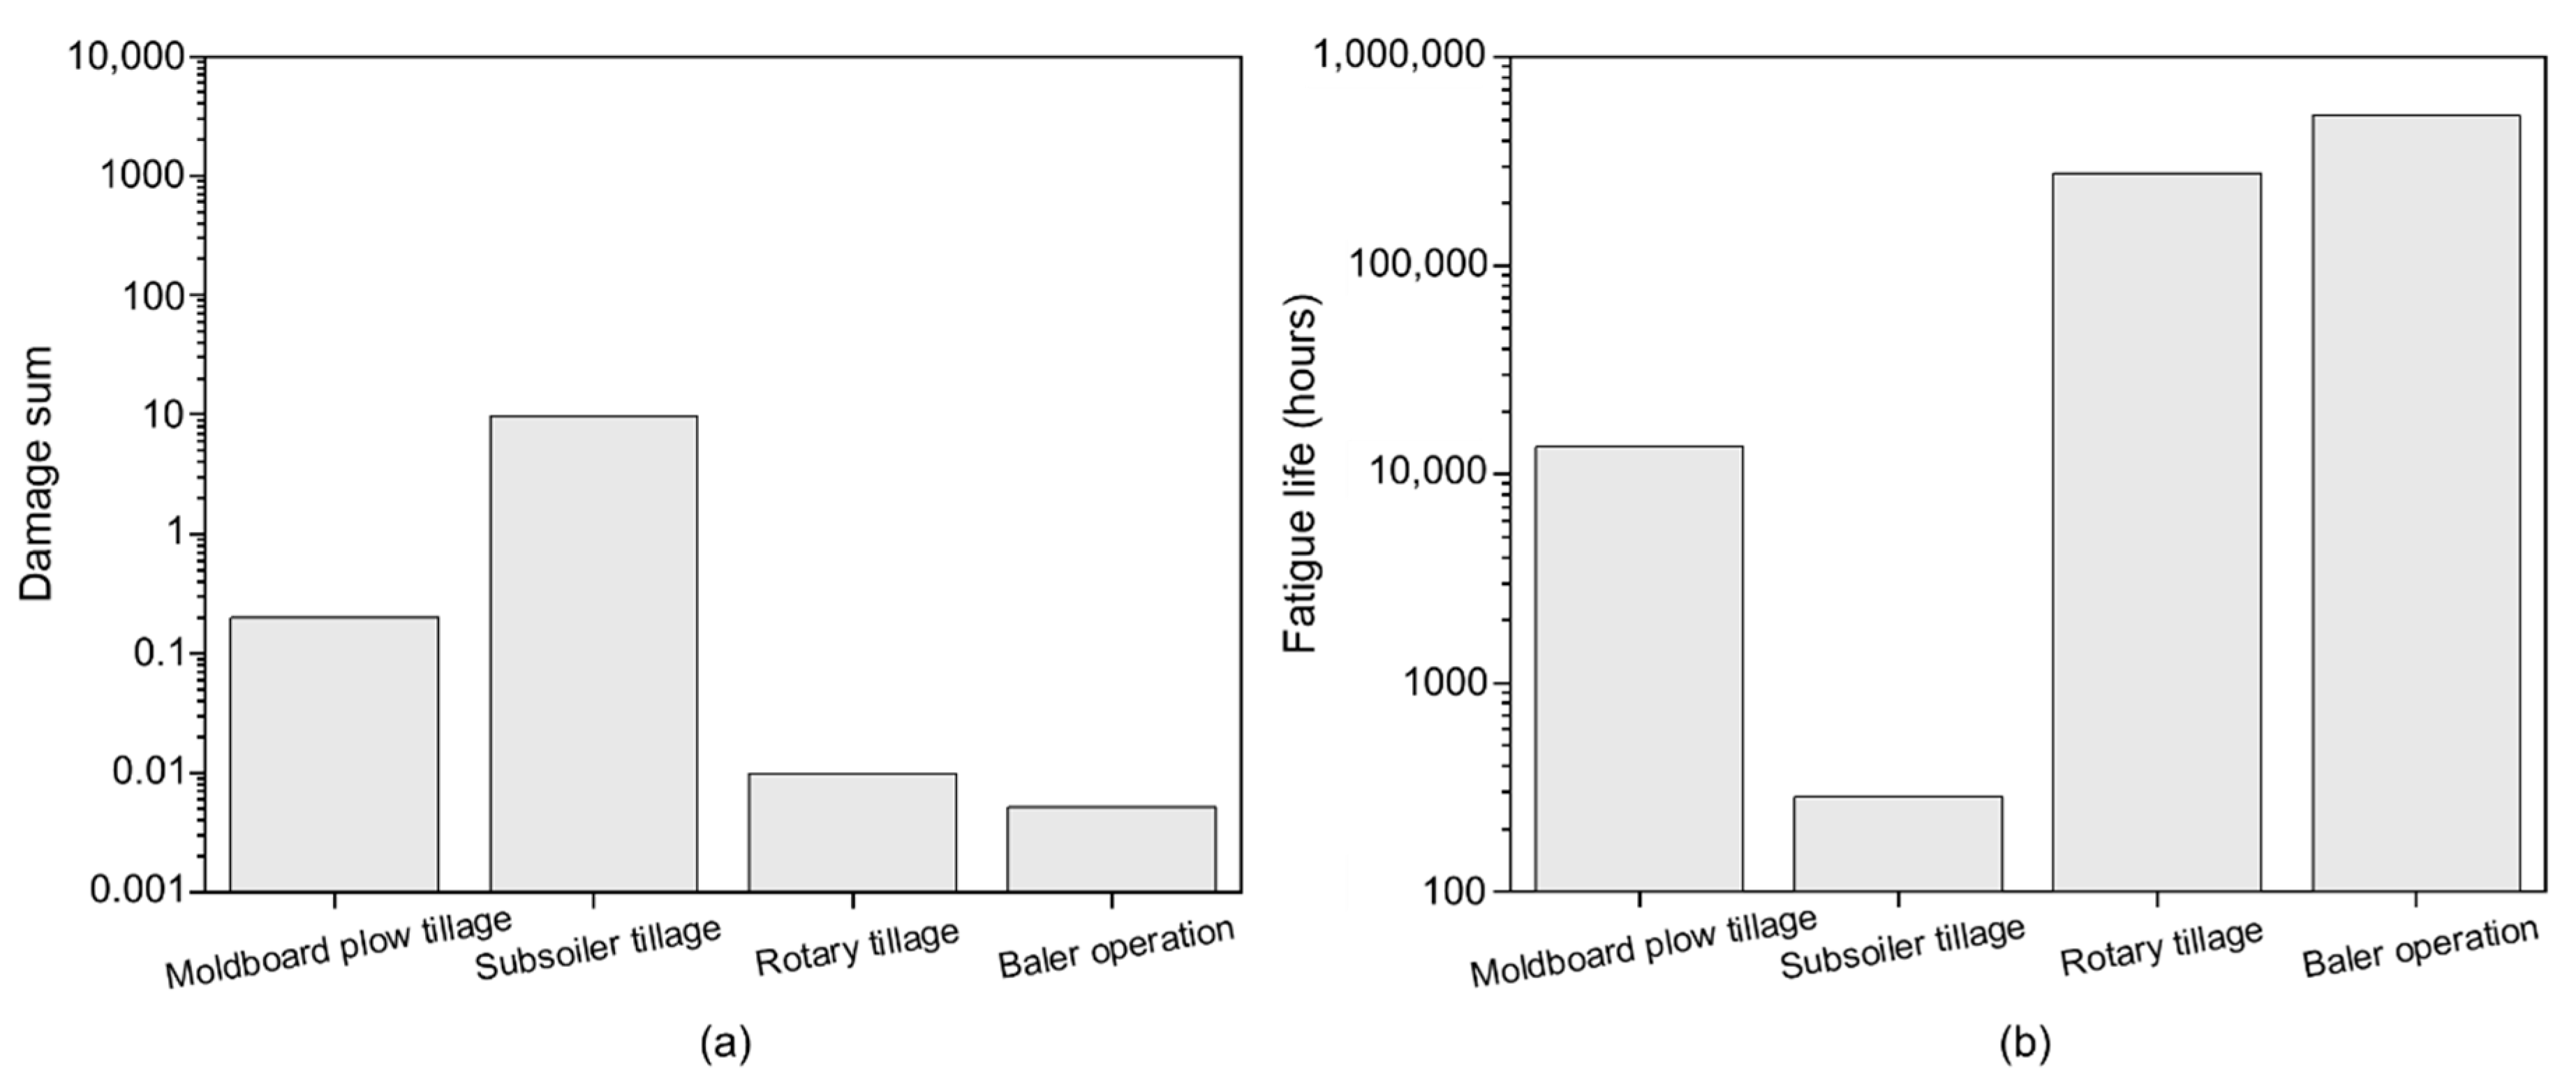
| Field Operations | Damage Sum | Fatigue Life (h) |
|---|---|---|
| Moldboard plow tillage | 0.2012 | 13,599 |
| Subsoiler tillage | 9.6000 | 285 |
| Rotary tillage | 0.0098 | 278,884 |
| Baler operation | 0.0052 | 525,977 |
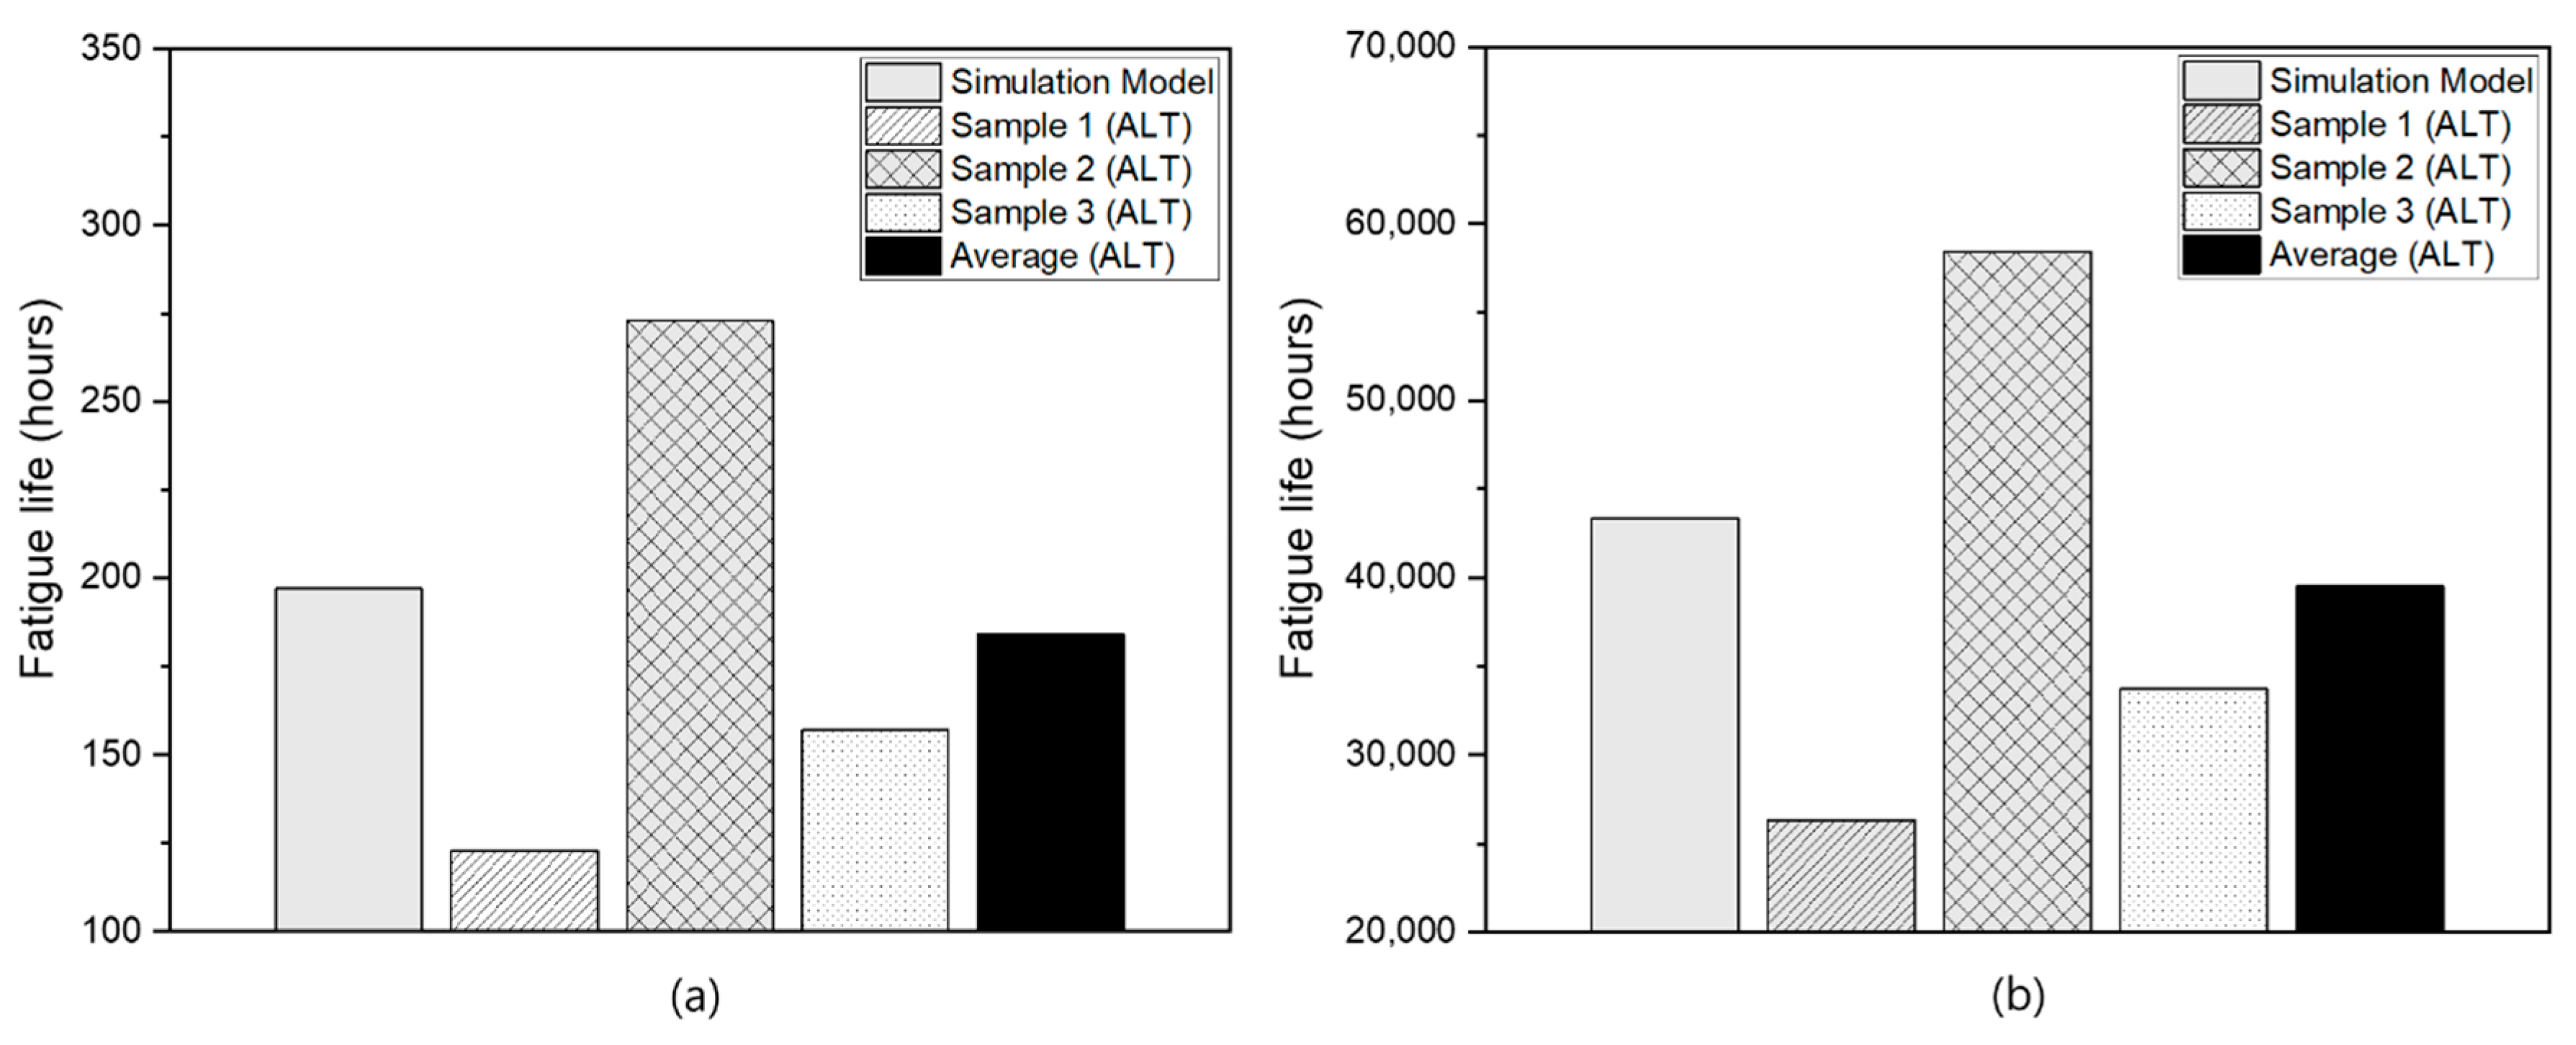
| Cases | Fatigue Life (h) | ||||
|---|---|---|---|---|---|
| Simulation | Previous Study Based on ALT [41] | ||||
| Sample 1 | Sample 2 | Sample 3 | Average | ||
| 1 | 197 | 123 | 273 | 157 | 184 |
| 2 | 43,315 | 26,330 | 58,453 | 33,702 | 39,495 |
Publisher’s Note: MDPI stays neutral with regard to jurisdictional claims in published maps and institutional affiliations. |
© 2020 by the authors. Licensee MDPI, Basel, Switzerland. This article is an open access article distributed under the terms and conditions of the Creative Commons Attribution (CC BY) license (http://creativecommons.org/licenses/by/4.0/).
Share and Cite
Kim, W.-S.; Kim, Y.-J.; Baek, S.-M.; Moon, S.-P.; Lee, N.-G.; Kim, Y.-S.; Park, S.-U.; Choi, Y.; Kim, Y.-K.; Choi, I.-S.; et al. Fatigue Life Simulation of Tractor Spiral Bevel Gear According to Major Agricultural Operations. Appl. Sci. 2020, 10, 8898. https://doi.org/10.3390/app10248898
Kim W-S, Kim Y-J, Baek S-M, Moon S-P, Lee N-G, Kim Y-S, Park S-U, Choi Y, Kim Y-K, Choi I-S, et al. Fatigue Life Simulation of Tractor Spiral Bevel Gear According to Major Agricultural Operations. Applied Sciences. 2020; 10(24):8898. https://doi.org/10.3390/app10248898
Chicago/Turabian StyleKim, Wan-Soo, Yong-Joo Kim, Seung-Min Baek, Seok-Pyo Moon, Nam-Gyu Lee, Yeon-Soo Kim, Seong-Un Park, Yong Choi, Young-Keun Kim, Il-Su Choi, and et al. 2020. "Fatigue Life Simulation of Tractor Spiral Bevel Gear According to Major Agricultural Operations" Applied Sciences 10, no. 24: 8898. https://doi.org/10.3390/app10248898
APA StyleKim, W.-S., Kim, Y.-J., Baek, S.-M., Moon, S.-P., Lee, N.-G., Kim, Y.-S., Park, S.-U., Choi, Y., Kim, Y.-K., Choi, I.-S., Choi, D.-K., & Choi, C.-H. (2020). Fatigue Life Simulation of Tractor Spiral Bevel Gear According to Major Agricultural Operations. Applied Sciences, 10(24), 8898. https://doi.org/10.3390/app10248898