Article

Determination of Transformer Oil Contamination from the OLTC Gases in the Power Transformers of a Distribution System Operator

School of Industrial Engineering, University of Cantabria, Av. Los Castros s/n, 39005 Santander, Spain
*
Author to whom correspondence should be addressed.
Appl. Sci. 2020, 10(24), 8897; https://doi.org/10.3390/app10248897
Submission received: 17 November 2020 / Revised: 7 December 2020 / Accepted: 10 December 2020 / Published: 13 December 2020
(This article belongs to the Special Issue Machine Health and Condition Monitoring)

Abstract

:
Power transformers are considered to be the most important assets in power substations. Thus, their maintenance is important to ensure the reliability of the power transmission and distribution system. One of the most commonly used methods for managing the maintenance and establishing the health status of power transformers is dissolved gas analysis (DGA). The presence of acetylene in the DGA results may indicate arcing or high-temperature thermal faults in the transformer. In old transformers with an on-load tap-changer (OLTC), oil or gases can be filtered from the OLTC compartment to the transformer’s main tank. This paper presents a method for determining the transformer oil contamination from the OLTC gases in a group of power transformers for a distribution system operator (DSO) based on the application of the guides and the knowledge of experts. As a result, twenty-six out of the 175 transformers studied are defined as contaminated from the OLTC gases. In addition, this paper presents a methodology based on machine learning techniques that allows the system to determine the transformer oil contamination from the DGA results. The trained model achieves an accuracy of 99.76% in identifying oil contamination.

1. Introduction

Power transformers are considered to be the most important assets in power substations. Thus, their maintenance is important to ensure the reliability of the power transmission and distribution system [1,2].
Different maintenance strategies are used for assets based on the condition of and available information about the components and sub-components of the substation equipment, according to [3]. The current trend in maintenance strategies is to maintain a predictive maintenance approach based on prognostics to predict the future asset degradation [3].
Dissolved gas analysis (DGA) is the most commonly used method for managing the maintenance and establishing the health status of power transformers, with much weight given to the results [4]. The DGA method measures the gas concentrations in the oil. The gases normally measured are hydrogen (H 2 ), acetylene (C 2 H 2 ), methane (CH 4 ), ethylene (C 2 H 4 ), ethane (C 2 H 6 ), carbon monoxide (CO) and carbon dioxide (CO 2 ). These gases are formed by the decomposition processes of insulation, which are caused by active faults. From the gas concentrations obtained in the DGA results, it is possible to identify the type of fault. Although DGA continues to be performed in the laboratory, there is a trend toward online DGA monitoring, because it makes it possible to detect or diagnose faults that occur in the power transformer [1].
The presence of acetylene in the DGA results may indicate arcing or high-temperature thermal faults in the transformer [5,6,7]. Although the presence of acetylene in the DGA results does not always indicate a transformer fault, in old transformers with an on-load tap-changer (OLTC), oil or gases can be filtered from the OLTC compartment to the main transformer tank. Gas leakage between oil compartments may influence the DGA results and the identification of transformer insulation faults [6,7,8,9]. This case was shown in [10]: two faults were identified as low energy discharges (D1); later, it was determined by inspection of the equipment that it was oil contamination from the OLTC gases.
The guides [6,7] utilise the C 2 H 2 /H 2 ratio to give an indication of the transformer oil contamination from the OLTC gases. According to [11], the C 2 H 2 /H 2 ratio is used to determine the filtering of fault gases in the main tank from the OLTC compartment when the ratio is greater than or equal to two and, furthermore, when the C 2 H 2 concentration is greater than or equal to 30 ppm. When electrical discharges occur in the transformer oil, the amount of acetylene is usually less than the amount of hydrogen. Since the solubility of acetylene is greater than the solubility of hydrogen, when electrical discharge is generated in the OLTC compartment, acetylene diffuses faster out of the OLTC tank. This results in the acetylene concentration in the transformer oil being greater than the hydrogen concentration. Several studies [12,13,14] have used this ratio to define the transformer oil contamination from the OLTC gases in several samples.
In the data processing for the calculation of the typical gas concentration, gas generation rates and fault identification are influenced by the lack of knowledge about the existence of communication with the OLTC [14]. The report uses the gas ratios included in [7] to identify faults and the C 2 H 2 /H 2 ratio to indicate the oil contamination from the OLTC gases.
According to [15], there are three steps to follow in the fault identification rules, including the application of the C 2 H 2 /H 2 ratio. The first step is to decide if the values of the gas concentrations are enough to establish that there is an active fault in the transformer oil. The second step consists of applying the C 2 H 2 /H 2 ratio to distinguish between contamination or not from the OLTC gases. If there is contamination from the OLTC gases, the rest of the evaluation will be performed by an expert who determines whether there is also an active fault; otherwise, proceed to Step 3, where the type of fault is identified by traditional DGA interpretation methods.
Although the C 2 H 2 /H 2 ratio [6,7] can be used to consider transformer oil contamination from the OLTC gases, it is necessary to take into account that high H 2 concentrations affect this ratio. A high H 2 concentration could be due to the fact that H 2 is produced in the transformer oil in almost all incipient faults. Applying this ratio with a high C 2 H 2 concentration would not show the contamination of the transformer oil because of the high H 2 concentration. This situation occurred in [12]: the application of the C 2 H 2 /H 2 ratio did not show the communication between oil compartments; it was necessary to inspect the conservator, and two holes were found on the barrier between the main conservator and the OLTC conservator.
Machine learning (ML) techniques are widely used to assess the condition of a transformer [16,17,18,19,20,21,22] and identify potential faults in a transformer [23,24,25,26,27,28] using DGA, oil quality analysis (OQA), the furfuraldehyde (FFA) content of the oil, polarisation and depolarisation current (PDC) measurements and dielectric frequency domain spectroscopy (FDS). Through the application of ML algorithms, models are generated that create predictions of the transformer health status and automatically diagnose potential faults in the transformer insulation from the data provided.
According to [20,23,25], a decision tree (DT) classifier is easy to interpret because the output is a set of conditional if-then tests of the input data. In addition, it is easy to train, and it works better than other ML techniques. The accuracy of the results obtained in these studies was better than that of those obtained with the DT algorithm.
This paper presents a method for determining the contamination of the transformer oil from the OLTC gases in a group of power transformers of a distribution system operator (DSO) based on the DGA results for the last two years, the application of the guides [6,7] and the knowledge of experts. The method proposed in this paper improves the detection of transformer oil contamination from the OLTC gases that is not determined by traditional DGA interpretation methods. Based on this transformer oil contamination classification methodology, a DT algorithm is applied to develop a prediction model that automatically recognises transformer oil contamination from the OLTC gases in DGA samples.

2. Background Theory

Power transformers are maintained based on the information available for the components and sub-components of the transformer. A risk index is used to prioritise maintenance work in a group of transformers [3,29]. This risk index is a function of the probability of failure and the consequences of failure. The probability of transformer failure is a parameter that is associated with the health index (HI) and varies over time. The consequences of failure evaluate and define the results of a failure event and do not vary if the transformer is not relocated.
In the calculation of the transformer’s HI, more condition parameters are used than for any other substation asset. The condition parameters used to calculate the HI for a power transformer are shown in Figure 1.
Based on the condition parameters shown in Figure 1, oil analyses (DGA, OQA and FFA) are the easiest to perform without de-energising the transformer and provide the most useful health information [2].
The most commonly used method to identify and diagnose transformer oil faults is DGA. The combination of gas concentrations generated in the transformer oil is a result of the nature of the fault, as well as the temperature and energy at the fault location. Faults can be identified from the gas concentrations in the DGA results using the methods for interpreting the DGA results reported in [6,7,10]. The key gases that are generated depending on the potential fault are listed in Table 1.
Acetylene is one of the combustible gases that can be produced when a fault occurs in a transformer [6,7]. The transformer insulation faults associated with the presence of acetylene in DGA results are high and low energy discharges and high thermal faults (Table 1). As seen in Figure 2, very high temperatures (>800 C) followed by very rapid cooling are needed for the acetylene concentration to increase, causing it to accumulate in the oil, which occurs during arcing [5]. Traces of acetylene can also be formed at temperatures below 800 C, as shown in Figure 2.
The presence of acetylene in DGA results may also be due to the filtration of OLTC gases. According to [6,7], the C 2 H 2 /H 2 ratio can be used to determine the transformer oil contamination from the OLTC gases. When this ratio is greater than two or three, this indicates contamination.
As expected, the DGA results for transformers with oil contamination from the OLTC gases will show a higher acetylene concentration than normal. According to the guides for the interpretation of the gases generated in the transformer oil [6,7], there are different acetylene concentration limits based on whether or not there is communication between the OLTC compartment and the main tank, or even whether or not OLTC is used, as seen in Table 2. Table 2 shows the acetylene concentration limits collected in the guides [6,7]. The IEEE guide indicates the gas limit depending on the result of the O 2 / N 2 ratio, also showing the 90th and 95th percentile of the typical acetylene concentration. The IEC guide indicates the 90th percentile of the typical acetylene concentration for cases where there is communication between oil compartments, called communicating OLTC, and when there is no communication between oil compartments or no OLTC is used. The acetylene concentration range when there is no communication between oil compartments or no OLTC is used is 1–20 ppm, while the range is 60–280 ppm when there is communication between the OLTC compartment and the main tank.
Acetylene is generated in the OLTC during tap changes as a result of arcing between the fixed and moving parts [30,31]. Acetylene appears mainly in a non-vacuum-type OLTC, but acetylene traces can be produced in a vacuum-type OLTC [30,31].
There are several OLTC classifications according to [30,31,32]. The classification proposed in [30] is one of the simplest and most commonly used. It is given in Figure 3.
According to [30], the OLTC design influences the gases that can be generated due to normal operation depending on the gas generating components, as shown in Table 3.
The types of oil compartments used for the different OLTC designs are listed in Figure 3, and the pathways through which OLTC gases can contaminate the transformer insulation are shown in Figure 4 and Figure 5, respectively. The transformer oil contamination from the OLTC gases via the gaskets and oil compartment (which is not gas tight) mainly occurs when the OLTC compartment is inside the main tank, as shown in Figure 4a–c. Contamination via the common air space occurs when the transformer and OLTC share an oil expansion tank with a common air space. This type of connection usually applies to in-tank OLTC types because compartment-type OLTCs generally have a gas space under the tank cover [8,33].
One of the most commonly used methods for identifying faults using an OLTC DGA is the Duval triangle 2 for OLTCs according to [5,30,31,34]. The Duval triangle 2 makes it possible to distinguish between normal and abnormal gas formations. The Duval triangle 2 uses the concentration ratio of three combustible gases (acetylene, ethylene and methane) to identify faults or normal operation. The faults that this method can identify, in addition to normal operation, are similar to those listed in Table 1, except for partial discharges (PD). Interpreting several DGAs of the same OLTC on the triangle helps to visualise the evolution of the gas formation in the OLTC over time. The use of the triangle for a sample of OLTCs makes it possible to visualise gas formation patterns in a population of OLTCs.

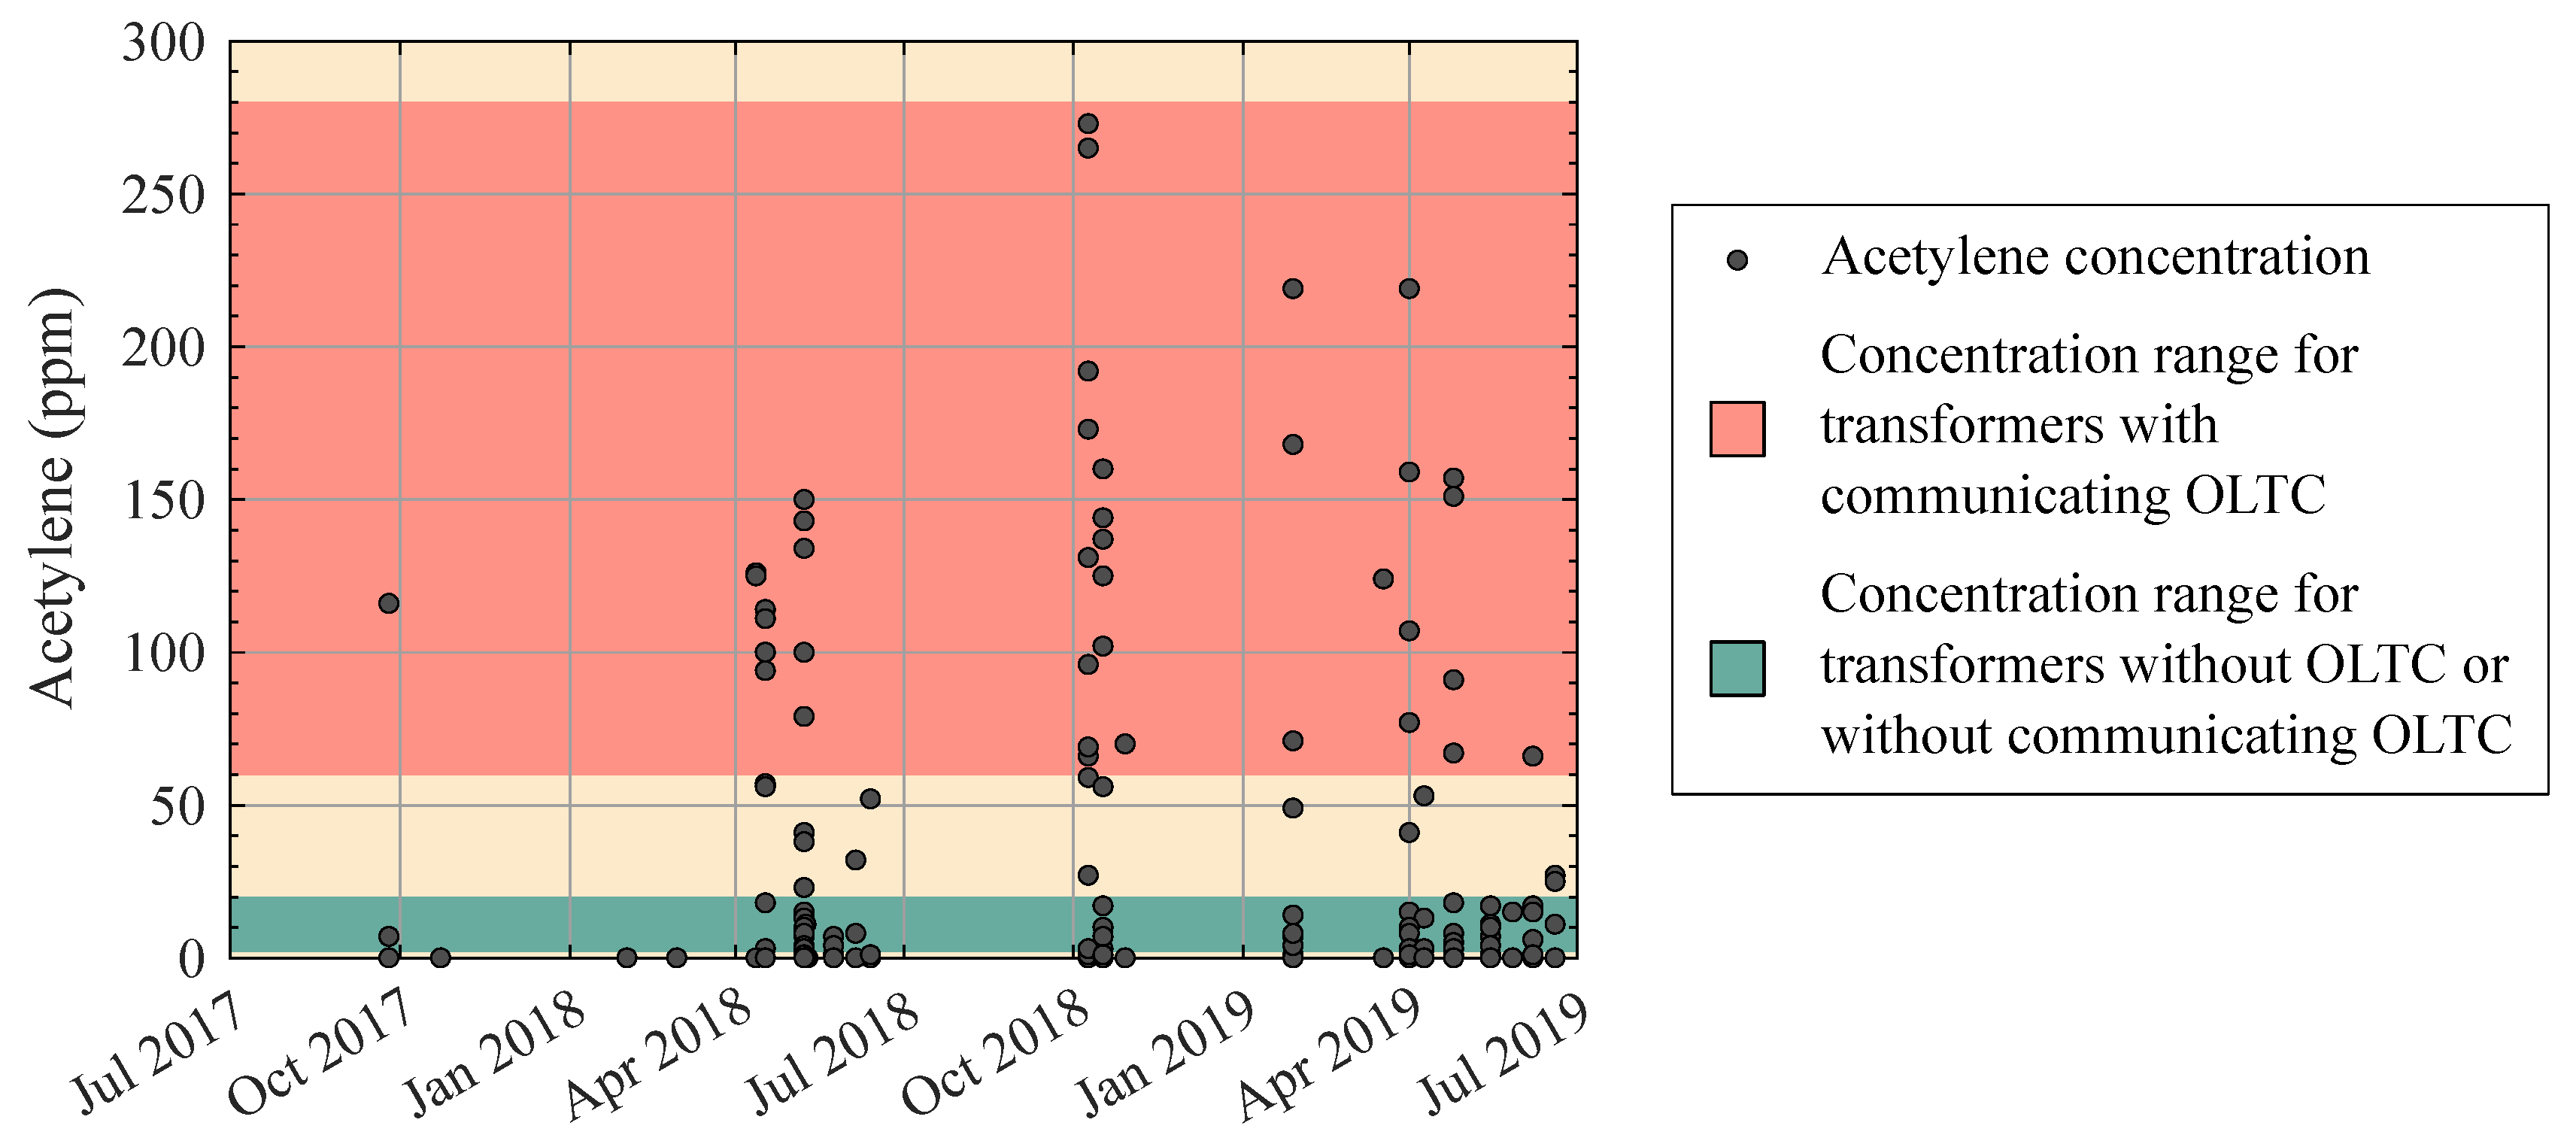
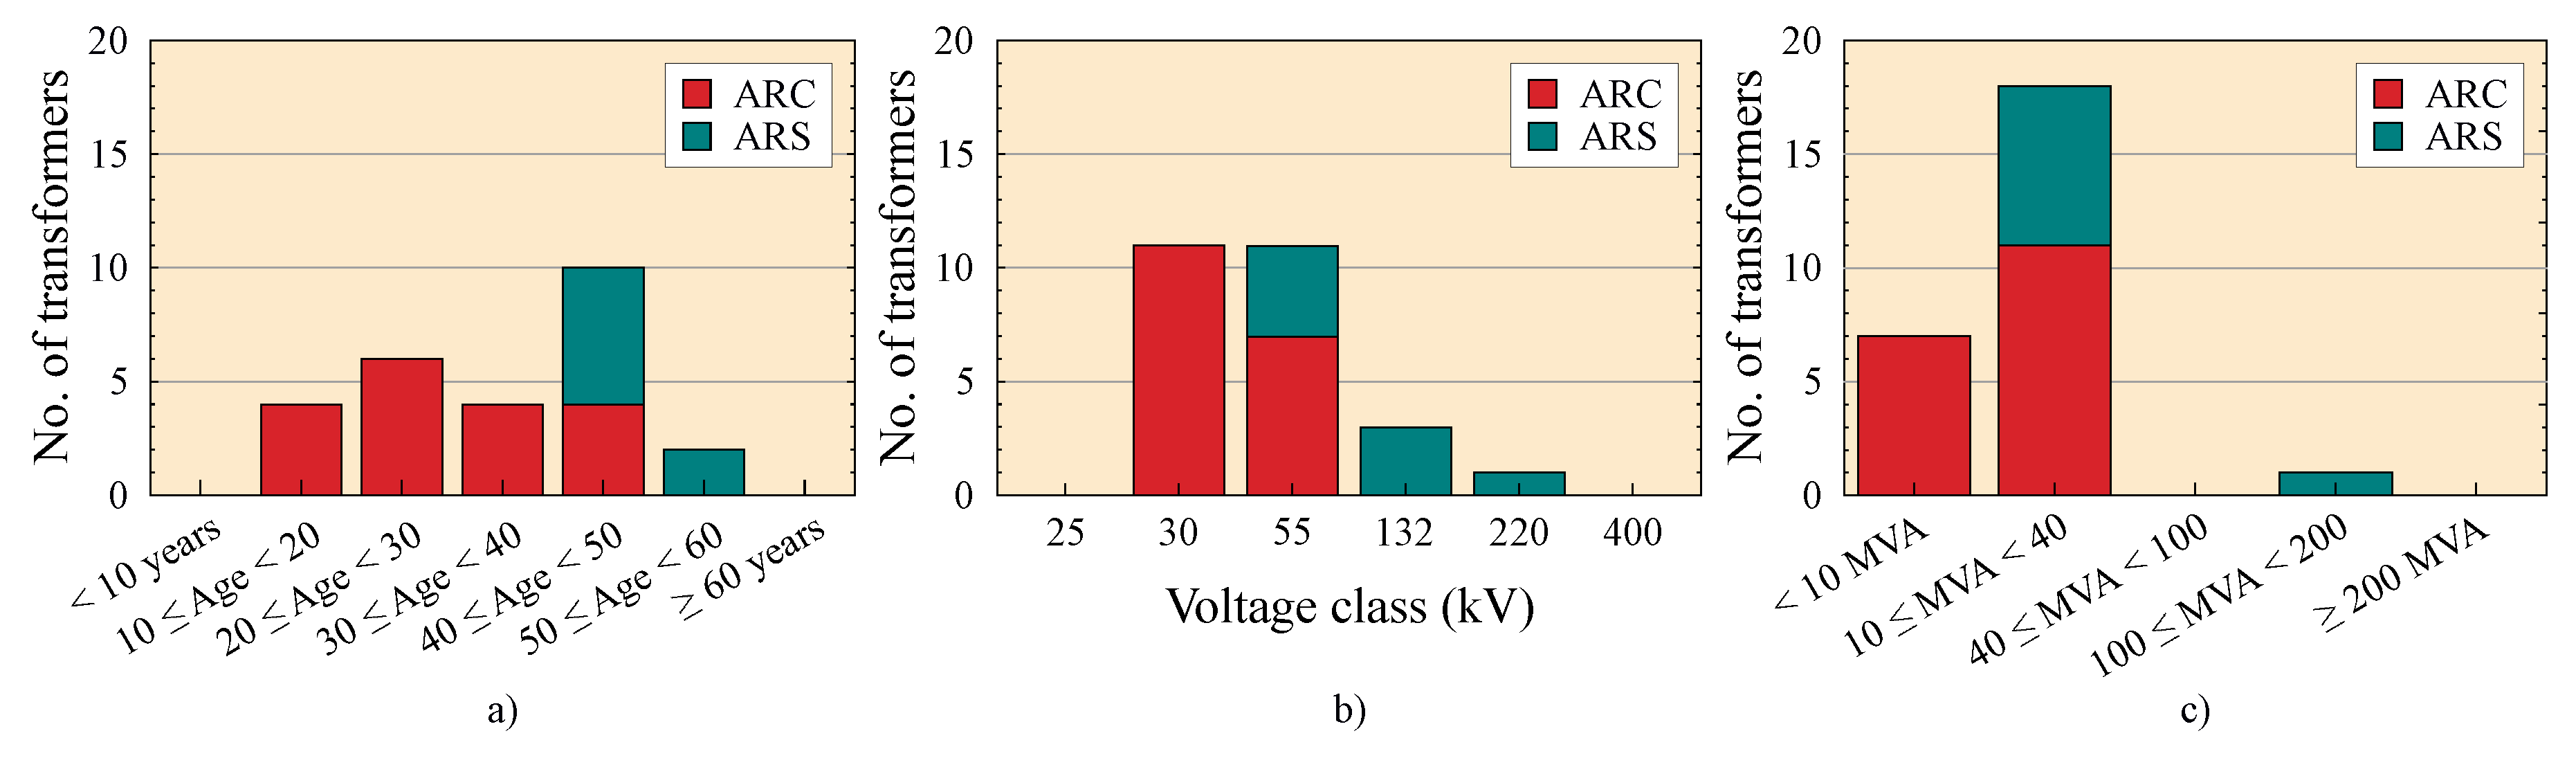
3. Study Characteristics

This study was based on 388 laboratory DGAs of 175 transformers with OLTCs performed over a period from the middle of 2017 to the middle of 2019 (two years). The transformers had age, voltage class and power rating ranges of 1–69 years, 25–400 kV and 3–450 MVA, respectively. Figure 6 shows the distribution of these transformers according to age, voltage class and power rating.
In addition, the different types of OLTCs that were installed in the power transformers are shown in Figure 6 according to the classification of Figure 3. Abbreviations that show the type of OLTC were generated from the concatenation of the letters in Figure 3: the first letter indicates the type of contacts used by the OLTC (arcing (A) or vacuum contacts (V)); the second letter indicates the type of bridge (resistor (R) or reactor type (X)); the last letter shows the type of compartment of the diverter switch and the tap selector (different (S) or the same (C)). Most of the OLTC types for the transformers studied corresponded to the in-tank types of Figure 4a,b. The newer transformers have the double compartment installation type, as shown in Figure 4e.
Figure 7 shows the acetylene concentrations measured in the DGAs as a function of the sampling date. The concentration range for transformers without an OLTC or communication with the main tank, as specified in the IEC guide [7], is shown in green. The concentration range for transformers with communicating OLTC, according to [7], is shown in red.
Before applying the C 2 H 2 /H 2 ratio to the data, it was necessary to check the reliability of the data in cases that presented an abnormal acetylene concentration, following the indications given in the IEEE guide [6].
After studying the data in which there was a large increase in the acetylene concentration, the results due to gas formation in the transformer were differentiated from those of a bad sample. With this revision, it was possible to discard a result showing 1443 ppm of acetylene (not included in Figure 7), and three DGA results were considered uncertain pending the new DGA results.
Once the data due to a bad sample were removed from the dataset, the C 2 H 2 /H 2 ratio was applied.
After applying the ratio, five results with errors were observed and needed investigation. These errors were due to a hydrogen concentration of 0 ppm. Table 4 lists the gas concentrations of the five transformers in which no ratio result was obtained.
Based on the trend for the rest of the DGAs related to these five transformers, three transformers were discarded because of a lack of contamination from the OLTC, and Transformers 3 and 4 were defined as contaminated from the OLTC.
Table 5 lists the DGA results for the transformers with C 2 H 2 /H 2 ratios greater than two. Comparing the DGA results listed in Table 5 with the rest of the DGA results related to the same transformer, it was observed that Transformers 12 and 13, despite having ratios greater than two, had a very low acetylene concentration in all of their DGA results. The acetylene concentrations of these transformers had ranges of 4–6 and 1–8 ppm, respectively. Thus, these transformers were defined as uncontaminated by the OLTC gases.
Based on the comparison of the DGA results listed in Table 5 with the rest of the DGA results for each transformer, twelve transformers were defined as contaminated from the OLTC gases, in addition to Transformers 3 and 4, which were previously defined as contaminated.
Table 6 lists the transformers with DGA results that exceeded 10 ppm of acetylene and C 2 / H 2 ratios smaller than two. The transformers established as contaminated in Table 5 are excluded from Table 6. As listed in Table 6, the acetylene concentrations of these transformers and their ages had ranges of 11–219 ppm and 18–50 years, respectively.
As in the previous cases, the transformers in Table 6 were compared with the rest of the DGA samples corresponding to each one. Transformers 28 and 33 had acetylene concentration ranges of 7–23 and 8–11 ppm, respectively.
Transformer 33 was discarded as contaminated because of its low acetylene concentration values and stability over time.
Based on the acetylene concentration listed in Table 6, Transformer 28 could be contaminated. All of the DGA results except for that of one sample (23 ppm) indicated low and stable acetylene concentrations. Because of this and the fact that it was connected to the power transmission network, it was defined as uncontaminated. In this way, the transformer was controlled by applying the limits of Table 2 corresponding to a transformer without OLTC to its monitoring.
From Table 6, the old transformers (Nos. 19, 20, 21, 22, 23, 24, 25 and 27) in the 43–50 year range had hydrogen and acetylene concentrations with high values. The high hydrogen values were due to gas accumulation over time because hydrogen is produced in almost all incipient faults. The historical data for each transformer were reviewed, and no fault that indicated arcing in the insulation was found. Thus, it could be said that the high acetylene values were due to OLTC gas contamination. Transformers 19, 20, 21, 22, 23, 24, 25 and 27 were defined as contaminated.
As in the previous case, the historical data for Transformers 26, 29, 30, 31 and 32 were reviewed, and no arcing fault was found in the transformer insulation. As can be seen in Table 6, this group of transformers had low acetylene concentrations, except for Transformer 26, and a relatively stable trend. Despite this, they were classified as contaminated from OLTC gases because no arcing fault was found in the historical data.
In summary, twenty-six of the 175 transformers were defined as contaminated from the OLTC gases. Out of these, eighteen of the 26 transformers defined as contaminated were of the OLTC ARC type, and the remaining eight were of the OLTC ARS type. Figure 8 shows the distribution of these transformers according to age, voltage class and power rating. In addition, the different types of OLTCs installed in these power transformers are shown in Figure 8.
It should be noted that the methodology followed in this section is an assumption of transformer oil contamination based on the study of the DGA samples. Neither the application of the ratio nor EK can guarantee this contamination. Given the DGA results, it is possible to assume the contamination in the 26 transformers and evaluate their future DGA results with the acetylene values for transformers with communicating OLTC (Table 2). It will be necessary to take into account the increases between DGA samples and check if they correlate with an increase in the number of OLTC operations in order to be able to discard the existence of faults in the transformer insulation.
From the results of the proposed method, a comparison was made with the traditional fault identification methods. The traditional fault identification methods used were the Duval triangle method (DTM) and the Duval pentagon method (DPM), as can be seen in Figure 9. The abbreviations used correspond to those shown in Table 1.
In Figure 9, the results obtained through the application of the C 2 H 2 /H 2 ratio are shown in red, and the results obtained through EK are represented in magenta. It is observed that most of the results are located in the areas that indicate high and low energy discharge failures, D2 and D1, respectively.
Transformers identified as contaminated through the C 2 H 2 /H 2 ratio are well defined in zones D1 and D2, except for one transformer whose DGA results are in zone T3 in the triangle and on the boundary between D2 and T3 in the pentagon. It can be interpreted that this transformer had a thermal fault in addition to the oil contamination from the OLTC gases.
The transformers identified as contaminated through EK are scattered over zones D1, D2 and D+T in the triangle and in zones D1 and D2 in the pentagon, because the predominant gas was no longer acetylene, making the results more distributed throughout the areas.

4. Machine Learning Methodology

Based on the previously described results, ML techniques were used to allow the classifier algorithm to automatically detect transformer oil contamination from the OLTC gases. Figure 10 shows the flowchart of the ML methodology applied and explained in this section.

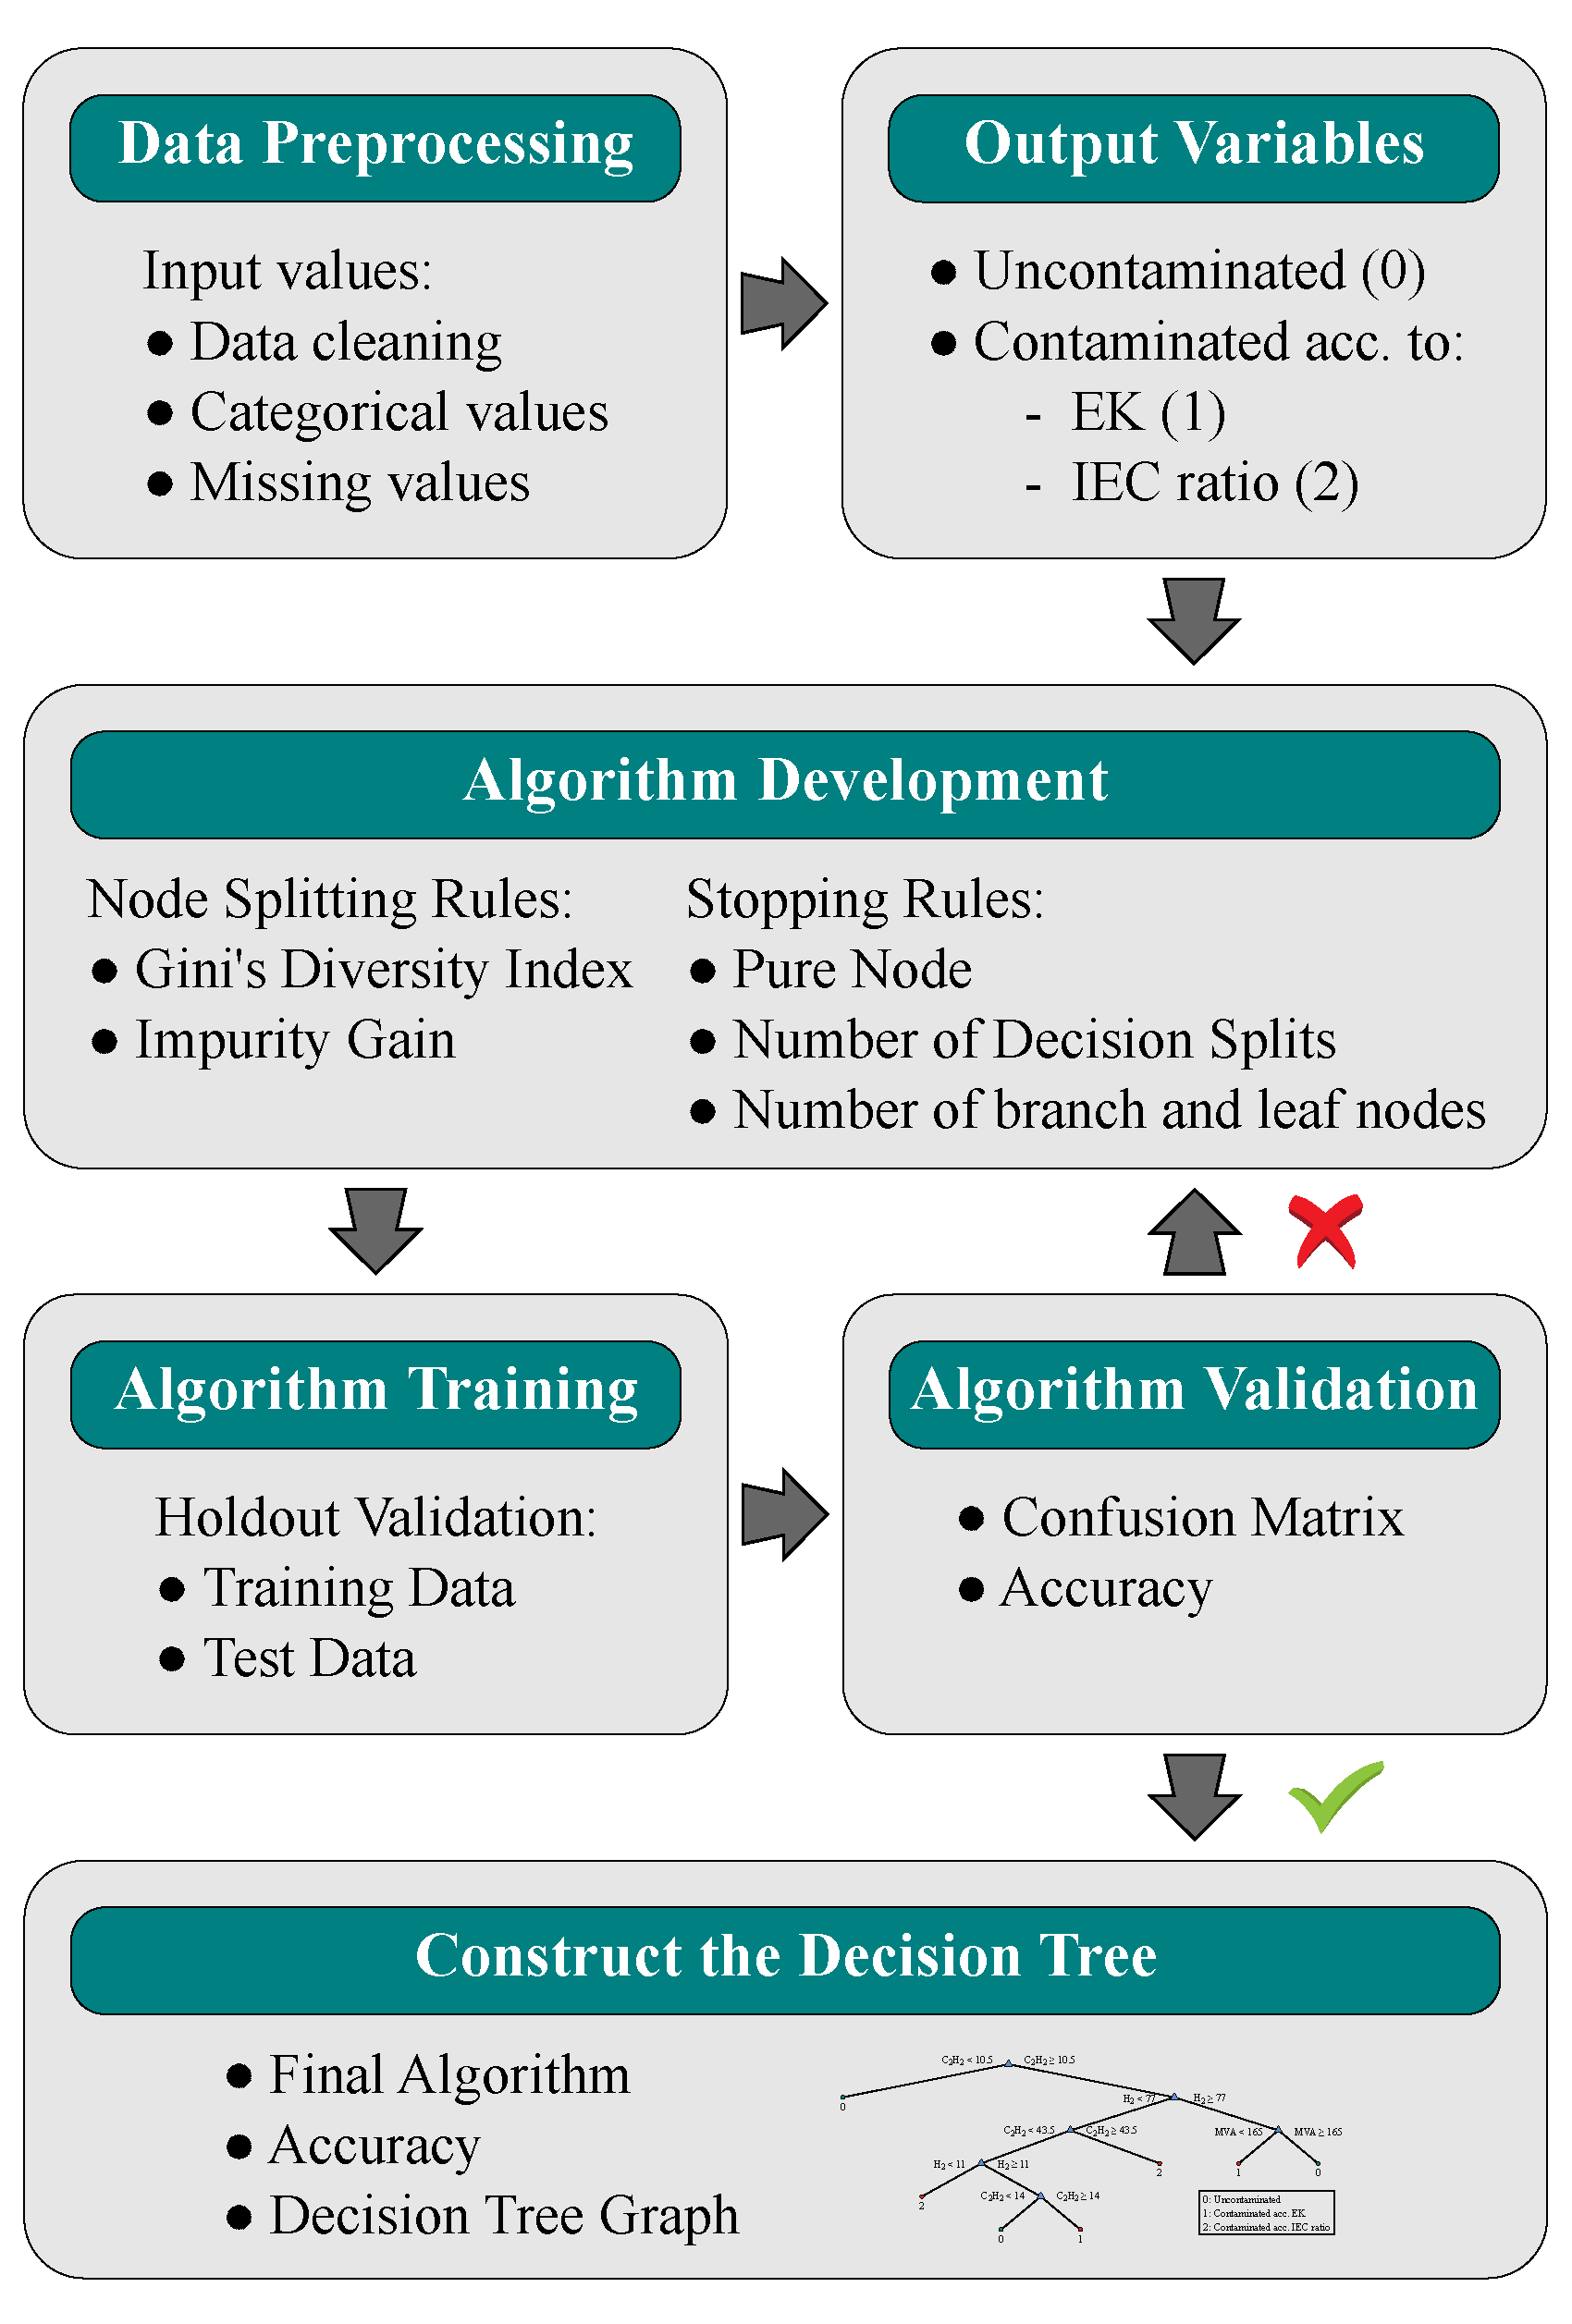
4.1. Data Preprocessing

Before starting, it was necessary to check the reliability of the data in cases that presented missing values or abnormal gas concentrations, following the indications given in the IEEE guide [6].
Then, four-hundred sixteen DGA datasets (388 DGA datasets for transformers with OLTCs and 28 DGA datasets for transformers without OLTCs) and several characteristics of the transformers were used to train the algorithm. The input variables (also known as predictors) included 12 numerical and two categorical variables. The numerical predictors included the age, power rating, voltage class and concentrations of hydrogen, acetylene, methane, ethylene, ethane, carbon monoxide, carbon dioxide, oxygen and nitrogen. The categorical predictors indicated whether or not (“Yes” or “No”) the transformer was connected to the transmission network and possessed an OLTC.

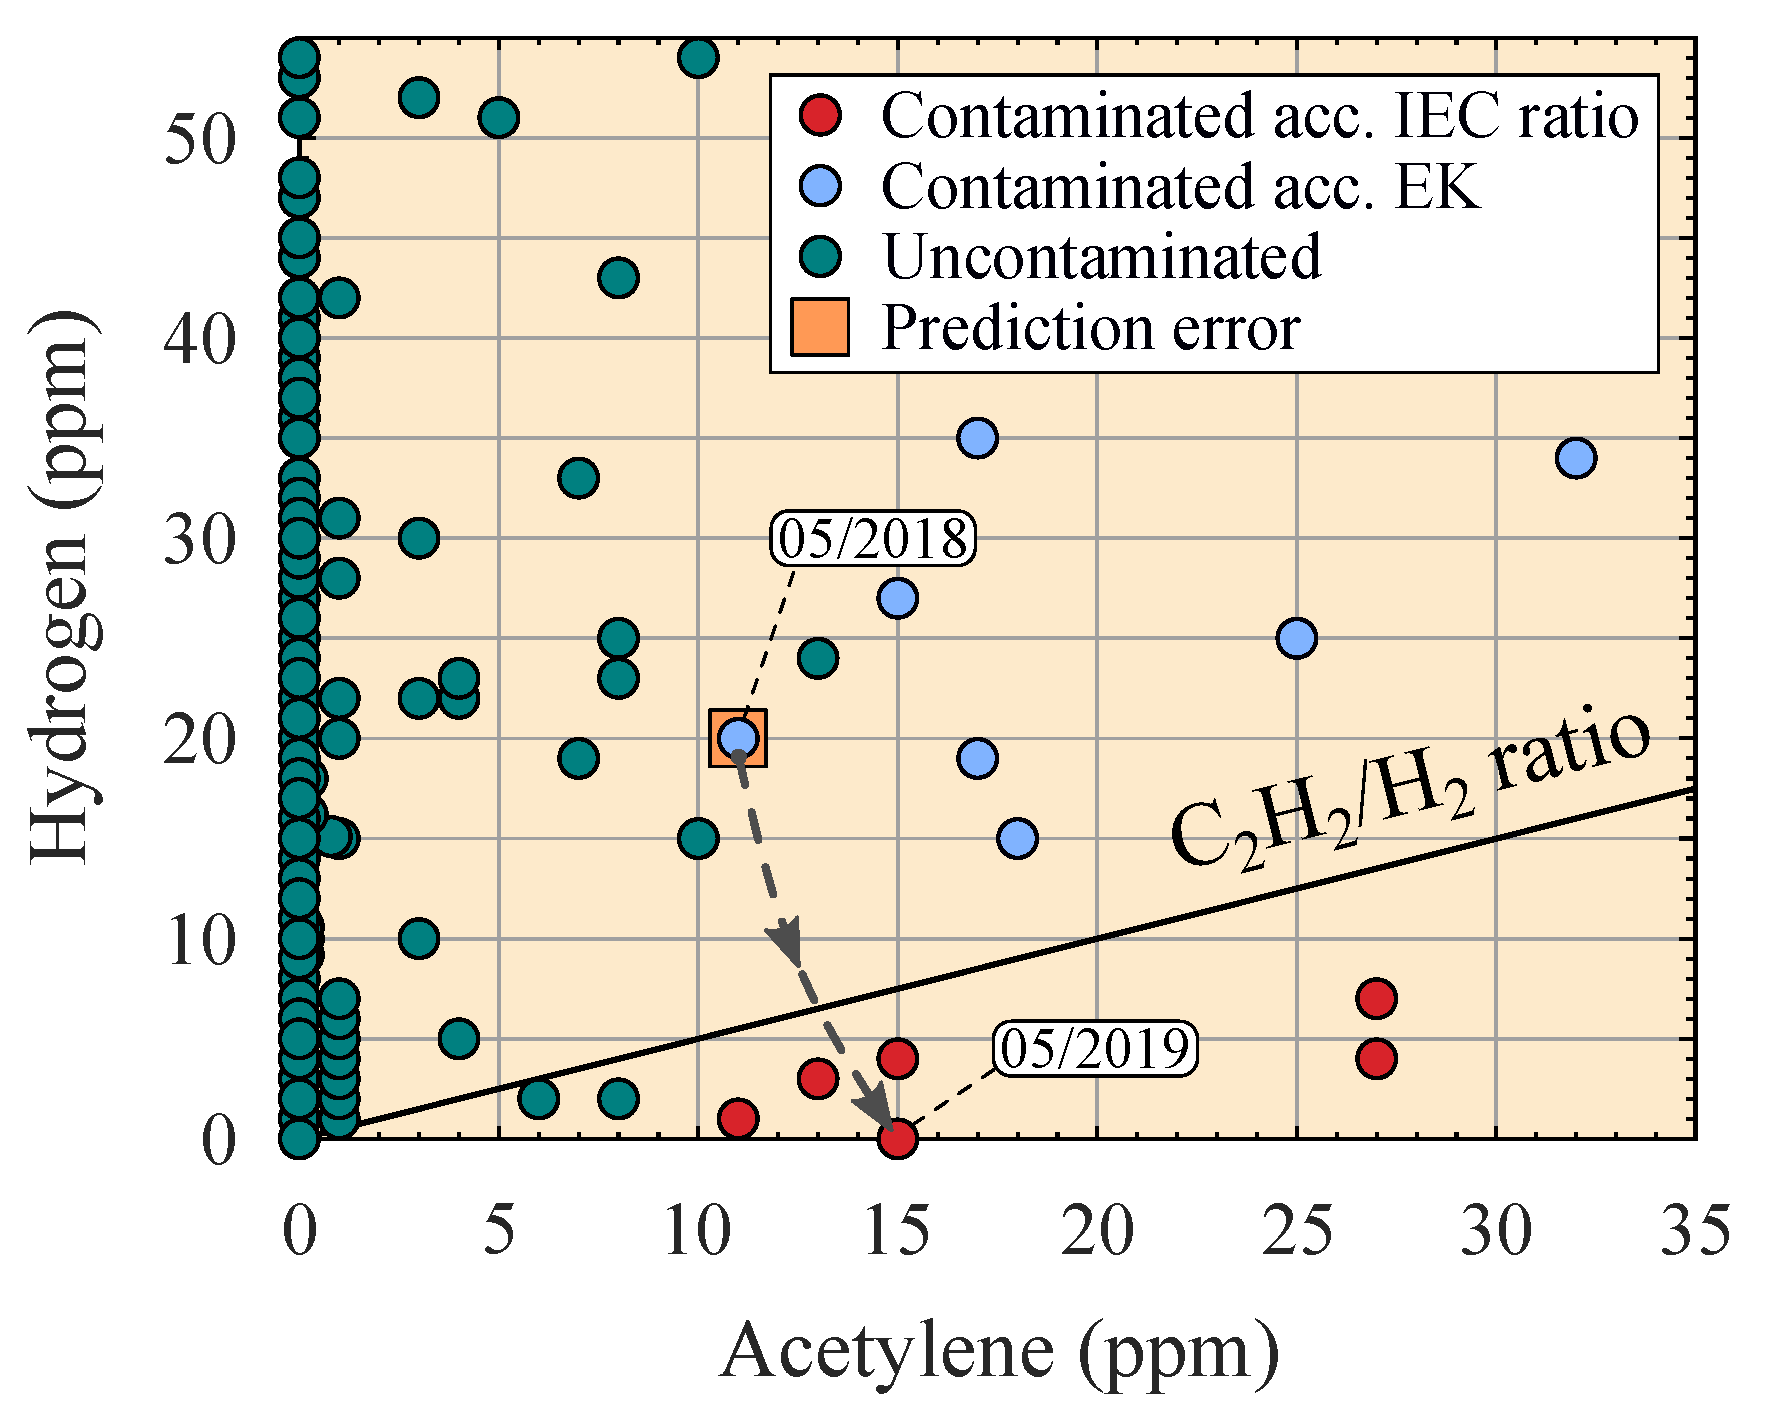
4.2. Calculation of Output Variables

The output variable (known response) used in the training of the algorithm was the classification developed in Section 3, but the responses classified as contaminated were divided into two categories according to the C 2 H 2 /H 2 ratio and expert knowledge (EK). Based on the division of the responses classified as contaminated into two classes and the responses of uncontaminated transformers, a total of three classes were defined, as can be seen in Figure 11. The responses of the 28 observations of transformers without OLTCs were defined as uncontaminated, which helped the algorithm to learn to classify them using the ML techniques.

4.3. Algorithm Development

The DT classifier was the algorithm selected to be trained based on the accuracy results collected in [20,23,25]. The software used to develop the classifier algorithm was MATLAB R2018b [35].
The developed algorithm obtains an adjusted binary classification DT based on the input variables and responses [36,37], in order to predict responses for new data. The obtained binary tree divides branching nodes based on the values of the attributes.
Based on the predictors and responses explained in Section 4.1 and Section 4.2, the dataset used in the algorithm development was as follows:
T = T 1 , T 2 , . . . , T m x i = x 1 , x 2 , . . . , x p S = S 1 , S 2 , . . . , S m
where T is the set of all observations, m is the number of observations, x i is the set of values of a predictor, p is the number of predictors and S is the set of responses to be predicted; each response takes one of the three classes defined in Section 4.2.
The calculation procedure to develop the optimal DT, starting from the node t that contains the set of all observations T, follows the next steps.
1.
Calculate the impurity of node t.
Gini’s diversity index ( I t ) measures the impurity of node t and can be written as:
I t = 1 i p 2 ( i )
where the sum is over the classes i at the node, and p ( i ) is the probability of class i at the node. A pure node (a node with just one class) has a Gini index of zero; otherwise, the Gini index is positive.
2.
Calculate the probability at node t.
The probability that an observation is in node t is given as:
P ( T ) = j T w j
where w j is the weight of observation j and T is the set of all observations at node t. If no different weights are used, w j = 1 / n , where n is the sample size.
3.
Sort predictor elements in ascending order.
Each ordered element of the predictor x i can be a candidate to split the node.
4.
Calculate the impurity gain ( Δ I ).
In order to determine the best way to split node t using x i , the Δ I over all splitting candidates is calculated. For all splitting candidates of x i , the algorithm splits node t into left ( t L ) and right ( t R ) nodes, each with its set of observations, T L and T R , respectively. Then, the Δ I is calculated as follows:
Δ I = P ( T ) I t P ( T L ) I t L P ( T R ) I t R
where P ( T L ) and P ( T R ) are the probabilities that an observation is at node t L and t R , respectively, and I t L and I t R are the impurities at the child nodes.
5.
Selection of splitting node.
The algorithm selects the splitting candidate that produces the largest Δ I .
6.
Once the splitting node has been selected, the child nodes ( t L and t R ) become parent nodes (node t). Then, the previous steps are recursively repeated to split the new parent nodes until pure nodes are achieved or the stopping rules are reached.
Following the previous steps, a very deep DT can be generated with many small leaves, achieving a low training error, but the test error is usually high. To avoid deep growth, stopping rules should be imposed. The stopping rules used were:
  • The maximum number of decision splits was 50.
  • The minimum number of branch node observations was 10.
  • The minimum number of leaf node observations was one.

4.4. Algorithm Training and Validation

In order to verify the accuracy of the algorithm [38], the dataset was divided into two groups, training data and test data, using a percentage ratio of 90:10 or 50:50 to observe how the amount of training data influenced the accuracy of the algorithm. Because the observations in the training data differed in each execution of the algorithm, even with the same ratio, the algorithm was executed five times with the same ratio.
Accuracy (A) was obtained in each execution of the algorithm to validate the trained model. A is calculated as:
A ( % ) = T P + T N T P + T N + F P + F N · 100
where T P is the number of predicted true positives, T N is the number of predicted true negatives, F P is the number of predicted false positives, and F N is the number of predicted false negatives.
The accuracy results based on the percentages of training and test data are listed in Table 7. In addition, Table 7 lists the confusion matrices obtained in each case. It is important to keep in mind that a transformer misclassified as contaminated (false positive) would be evaluated with high C 2 H 2 limits (Table 2). Thus, its status assessment would go unnoticed in terms of C 2 H 2 .
From Table 7, it is observed that a larger training group resulted in fewer false positives and negatives.
Since the accuracy results shown in Table 7 were correct, the trained algorithm was validated; otherwise, it would be necessary to modify the parameters defined in the algorithm development to improve the algorithm accuracy.

4.5. Construct the DT

The final training of the algorithm [38] was performed with all the observations, achieving an accuracy of 99.76% for the responses. As a result, an adjusted binary classification decision tree was obtained based on the predictors and responses contained in the dataset, as shown in Figure 12.
As expected, Figure 12 shows that the most important predictor was the acetylene concentration, followed by the hydrogen concentration and power rating.
The DGA sample that was poorly predicted by the trained algorithm belonged to Transformer 4. This transformer had two DGA samples that were used in the algorithm training (Table 4 and Table 6). The responses of the DGA samples and the wrong prediction of the Transformer 4 are shown in Figure 13. The wrong prediction was defined as uncontaminated by the trained algorithm, while it was defined as contaminated according to EK, since its acetylene and hydrogen concentrations were 11 and 20 ppm, respectively. The wrong prediction was in the vertical zone generated between the responses of uncontaminated and contaminated transformers according to EK (Figure 11 and Figure 13); therefore, the trained algorithm could not determine the transformer contamination accurately.
As new DGA samples are obtained, the trained algorithm will be run using the predictors explained in Section 4.1. The algorithm will output the predictions of whether or not there is contamination. These results will be compared to previous transformer oil contamination definitions. In cases where the algorithm is not correct, each sample must be studied individually to know if it is an error or the transformer has gone from being uncontaminated to being contaminated from OLTC gases (applying the methodology explained in Section 3). From the results of the application of the trained algorithm, it will be improved if necessary.

5. Conclusions

This paper presents the application and expert knowledge of the C 2 H 2 /H 2 ratio collected in [6,7] in order to determine transformer oil contamination from the OLTC gases in a group of power transformers of a DSO. The 175 power transformers studied based on 388 DGA results have different ages, voltage classes, and power ratings.
Based on the application of the ratio, thirteen transformers are defined as contaminated, and one transformer is classified as uncontaminated due to low acetylene values, in the 8–11 ppm range. The expert interpretations of the DGA results for 13 power transformers define them as contaminated based on a study of the rest of the DGA results for each of them.
As expected, the trend in the results is that old transformers are contaminated by the OLTC gases, and sixty-three percent of the contaminated transformers have ages in the range of 30–60 years. Based on these results, it is observed that the youngest contaminated transformers have their tap selector and diverter switch in different compartments, whereas the oldest contaminated transformers have their tap selector and diverter switch in the same compartment.
It should be noted that the methodology performed in this study is an assumption of transformer oil contamination based on the study of the DGA samples. Neither the application of the ratio, nor the EK can guarantee this contamination. The evaluation of the future DGA results of the transformers defined as contaminated will have to be performed taking into account the number of operations of the OLTCs, in order to discard the existence of faults in the insulation of the transformer.
In addition, this paper proposes the application of ML techniques in the developed classification methodology. The proposed approach achieves an effective technique to distinguish whether or not there is transformer oil contamination from the OLTC gases using a DT. The algorithm is trained using different percentages of training and test data to obtain the optimal DT.
Based on the proposed approach, a trained classifier is obtained to make it possible to perform the classification automatically. The results of the trained classifier versus the classifications made in this study show an accuracy of 99.76%.
From the classification of transformers as contaminated or uncontaminated performed in this study, the calculation results for the limit values of the C 2 H 2 concentration [39] are improved and divided into two groups, depending on the OLTC communication between the main tank and the OLTC compartment, similar to the IEC classification.
In future work, the model trained from the ML techniques will be used with new DGA results. Its accuracy will be checked, and the model will be improved if necessary.

Author Contributions

Conceptualisation, S.B., M.M. and A.A.; methodology and software, S.B.; validation, all authors contributed equally; formal analysis, S.B., R.M. and A.L.; investigation and resources, all authors contributed equally; data analysis, S.B.; writing, original draft preparation, review and editing, all authors contributed equally; and funding acquisition, M.M. All authors read and agreed to the published version of the manuscript.

Funding

This work was partially financed by the EU Regional Development Fund (FEDER) and the Spanish Government under RETOS-COLABORACIÓN RTC-2017-6782-3 and by the European Union’s Horizon 2020 research and innovation programme under Grant Agreement No. 864579 (FLEXIGRID).

Acknowledgments

The authors acknowledge the support received from Viesgo. The authors thank CIGRE for permission to reproduce information from its Technical Brochures. The authors thank the International Electrotechnical Commission (IEC) for permission to reproduce information from its International Standards. All such extracts are copyrighted by IEC, Geneva, Switzerland. All rights reserved. Further information on the IEC is available from www.iec.ch. The IEC has no responsibility for the placement and context in which the extracts and contents are reproduced by the author, nor is the IEC in any way responsible for the other content or accuracy therein.

Conflicts of Interest

The authors declare no conflict of interest.

Abbreviations

The following abbreviations are used in this manuscript:
CH 4 Methane
C 2 H 2 Acetylene
C 2 H 4 Ethylene
C 2 H 6 Ethane
D1Discharges of low energy
D2Discharges of high energy
DGADissolved gas analysis
DPMDuval pentagon method
DSODistribution system operator
DTDecision tree
DTMDuval triangle method
EKExpert knowledge
FDSFrequency domain spectroscopy
FFAFurfuraldehyde
H 2 Hydrogen
HIHealth index
MLMachine learning
OLTCOn-load tap-changer
OQAOil quality analysis
PDPartial discharges
PDCPolarisation and depolarisation current
T1Thermal faults (<300 C)
T2Thermal faults (300–700 C)
T3Thermal faults (>700 C)

References

  1. Wu, X.; He, Y.; Duan, J. A Deep Parallel Diagnostic Method for Transformer Dissolved Gas Analysis. Appl. Sci. 2020, 10, 1329. [Google Scholar] [CrossRef] [Green Version]
  2. Bohatyrewicz, P.; Płowucha, J.; Subocz, J. Condition Assessment of Power Transformers Based on Health Index Value. Appl. Sci. 2019, 9, 4877. [Google Scholar] [CrossRef] [Green Version]
  3. CIGRE. Ageing High Voltage Substation Equipment and Possible Mitigation Techniques; WG A3.29. Technical Brochure No. 725; CIGRE: Paris, France, 2018. [Google Scholar]
  4. Azmi, A.; Jasni, J.; Azis, N.; Kadir, M.A. Evolution of transformer health index in the form of mathematical equation. Renew. Sustain. Energy Rev. 2017, 76, 687–700. [Google Scholar] [CrossRef]
  5. CIGRE. Advances in DGA Interpretation; JWG D1/A2.47. Technical Brochure No. 771; CIGRE: Paris, France, 2019. [Google Scholar]
  6. IEEE. IEEE Guide for the Interpretation of Gases Generated in Mineral Oil-Immersed Transformers; IEEE Std C57.104-2019 (Revision of IEEE Std C57.104-2008); IEEE: Piscataway, NJ, USA, 2019; pp. 1–98. [Google Scholar] [CrossRef]
  7. IEC. Mineral Oil-Filled Electrical Equipment in Service—Guidance on the Interpretation of Dissolved and Free Gases Analysis; IEC 60599 ed.3.0; IEC: Geneva, Switzerland, 2015. [Google Scholar]
  8. Frotscher, R. Common oil expansion tank for transformers and tap-changers. Transform. Mag. 2017, 4, 20–25. [Google Scholar]
  9. N’cho, J.; Fofana, I.; Hadjadj, Y.; Beroual, A. Review of Physicochemical-Based Diagnostic Techniques for Assessing Insulation Condition in Aged Transformers. Energies 2016, 9, 367. [Google Scholar] [CrossRef]
  10. Duval, M.; dePabla, A. Interpretation of gas-in-oil analysis using new IEC publication 60599 and IEC TC 10 databases. IEEE Electr. Insul. Mag. 2001, 17, 31–41. [Google Scholar] [CrossRef]
  11. Mollmann, A.; Pahlavanpour, B. New guidelines for interpretation of dissolved gas analysis in oil-filled transformers. Electra 1999, 186, 31–51. [Google Scholar]
  12. Samsudin, R.; Ramli, A.Q.; Berhanuddin, A.; Zaidey, Y. Field experience of transformer untanking to identify electrical faults and comparison with Dissolved Gas Analysis. In Proceedings of the 2009 3rd International Conference on Energy and Environment (ICEE), Malacca, Malaysia, 7–8 December 2009; pp. 299–305. [Google Scholar] [CrossRef]
  13. Jadav, R.B.; Saha, T.K.; Ekanayake, C. Transformer diagnostics using dissolved gas analysis and polarisation and depolarisation current measurements—A case study. In Proceedings of the AUPEC 2011, Brisbane, Australia, 25–28 September 2011; pp. 1–6. [Google Scholar]
  14. Istad, M.K.; Foros, J.; Tveten, E.G.; Kolstad, M.L.; Solvang, E.; Rosenlund, G.H.; Hagner, S.; Henderson, M.G.; Coullon, J.L. Use Case Testing—SAMBA WP5 Report; Technical Report; SINTEF Rapport: Trondheim, Norway, 2019. [Google Scholar]
  15. Werle, P.; Radigk, C.; Sorgatz, W.; Hahn, M.; Wasserberg, V. Comparison of Different DGA (Dissolved Gas Analysis) Methods for the Condition Assessment of Power Transformers. In Proceedings of the International Conference Large Power Transformers-Modern Trends in Application, Operation & Maintenance, New Delhi, India, 12–13 October 2006. [Google Scholar]
  16. Alqudsi, A.; El-Hag, A. Application of Machine Learning in Transformer Health Index Prediction. Energies 2019, 12, 2694. [Google Scholar] [CrossRef] [Green Version]
  17. Qi, B.; Zhang, P.; Rong, Z.; Wang, J.; Li, C.; Chen, J. Rapid Transformer Health State Recognition Through Canopy Cluster-Merging of Dissolved Gas Data in High-Dimensional Space. IEEE Access 2019, 7, 94520–94532. [Google Scholar] [CrossRef]
  18. Kadim, E.; Azis, N.; Jasni, J.; Ahmad, S.; Talib, M. Transformers Health Index Assessment Based on Neural-Fuzzy Network. Energies 2018, 11, 710. [Google Scholar] [CrossRef] [Green Version]
  19. Liu, Y.; Song, B.; Wang, L.; Gao, J.; Xu, R. Power Transformer Fault Diagnosis Based on Dissolved Gas Analysis by Correlation Coefficient-DBSCAN. Appl. Sci. 2020, 10, 4440. [Google Scholar] [CrossRef]
  20. Benhmed, K.; Shaban, K.B.; El-Hag, A. Cost effective assessment of transformers using machine learning approach. In Proceedings of the 2014 IEEE Innovative Smart Grid Technologies—Asia (ISGT ASIA), Kuala Lumpur, Malaysia, 20–23 May 2014; pp. 328–332. [Google Scholar] [CrossRef]
  21. Ashkezari, A.D.; Ma, H.; Saha, T.K.; Ekanayake, C. Application of fuzzy support vector machine for determining the health index of the insulation system of in-service power transformers. IEEE Trans. Dielectr. Electr. Insul. 2013, 20, 965–973. [Google Scholar] [CrossRef] [Green Version]
  22. Akhavanhejazi, M.; Gharehpetian, G.; Faraji-dana, R.; Moradi, G.; Mohammadi, M.; Alehoseini, H. A new on-line monitoring method of transformer winding axial displacement based on measurement of scattering parameters and decision tree. Expert Syst. Appl. 2011, 38, 8886–8893. [Google Scholar] [CrossRef]
  23. Guo, C.; Dong, M.; Wu, Z. Fault Diagnosis of Power Transformers Based on Comprehensive Machine Learning of Dissolved Gas Analysis. In Proceedings of the 2019 IEEE 20th International Conference on Dielectric Liquids (ICDL), Roma, Italy, 23–27 June 2019; pp. 1–4. [Google Scholar] [CrossRef]
  24. Huang, X.; Wang, X.; Tian, Y. Research on Transformer Fault Diagnosis Method based on GWO Optimized Hybrid Kernel Extreme Learning Machine. In Proceedings of the 2018 Condition Monitoring and Diagnosis (CMD), Perth, Australia, 23–26 September 2018; pp. 1–5. [Google Scholar] [CrossRef]
  25. Han, Y.; Zhao, D.; Hou, H. Oil-immersed Transformer Internal Thermoelectric Potential Fault Diagnosis Based on Decision-tree of KNIME Platform. Procedia Comput. Sci. 2016, 83, 1321–1326. [Google Scholar] [CrossRef]
  26. Samantaray, S.; Dash, P. Decision Tree based discrimination between inrush currents and internal faults in power transformer. Int. J. Electr. Power Energy Syst. 2011, 33, 1043–1048. [Google Scholar] [CrossRef]
  27. Fei, S.-W.; Zhang, X.-B. Fault diagnosis of power transformer based on support vector machine with genetic algorithm. Expert Syst. Appl. 2009, 36, 11352–11357. [Google Scholar] [CrossRef]
  28. Ganyun, L.; Haozhong, C.; Haibao, Z.; Lixin, D. Fault diagnosis of power transformer based on multi-layer SVM classifier. Electr. Power Syst. Res. 2005, 74, 1–7. [Google Scholar] [CrossRef]
  29. CIGRE. Condition Assessment of Power Transformers; WG A2.49. Technical Brochure No. 761; CIGRE: Paris, France, 2019. [Google Scholar]
  30. CIGRE. DGA in Non-Mineral Oils and Load Tap Changers and Improved DGA Diagnosis Criteria; WG D1.32. Technical Brochure No. 443; CIGRE: Paris, France, 2010. [Google Scholar]
  31. IEEE. IEEE Guide for Dissolved Gas Analysis in Transformer Load Tap Changers; IEEE Std C57.139-2015 (Revision of IEEE Std C57.139-2010); IEEE: Piscataway, NJ, USA, 2016; pp. 1–45. [Google Scholar] [CrossRef]
  32. IEC. Tap-Changers—Part 2: Application Guide; IEC 60214-2 ed.1.0; IEC: Geneva, Switzerland, 2004. [Google Scholar]
  33. Frotscher, R. Hermetical sealing of transformers and tap-changers. Transform. Mag. 2017, 4, 24–29. [Google Scholar]
  34. Duval, M. The duval triangle for load tap changers, non-mineral oils and low temperature faults in transformers. IEEE Electr. Insul. Mag. 2008, 24, 22–29. [Google Scholar] [CrossRef]
  35. MATLAB. version 9.5.0.1033004 (R2018b); The MathWorks Inc.: Natick, MA, USA, 2019. [Google Scholar]
  36. Breiman, L.; Friedman, J.H.; Olshen, R.A.; Stone, C.J. Classification and Regression Trees; Wadsworth and Brooks: Monterey, CA, USA, 1984. [Google Scholar]
  37. Coppersmith, D.; Hong, S.J.; Hosking, J.R.M. Partitioning Nominal Attributes in Decision Trees. Data Min. Knowl. Discov. 1999, 3, 197–217. [Google Scholar] [CrossRef]
  38. Bustamante, S.; Manana, M.; Arroyo, A.; Martinez, R.; Laso, A. Developed Algorithms—Transformer oil contamination from the OLTC gases. Mendeley Data 2020. [Google Scholar] [CrossRef]
  39. Bustamante, S.; Manana, M.; Arroyo, A.; Martinez, R.; González, A.; Rodríguez, J.I. Case Study—Calculation of DGA Limit Values and Sampling Interval in Power Transformers. In Proceedings of the 2019 6th International Advanced Research Workshop on Transformers (ARWtr), Cordoba, Spain, 7–9 October 2019; pp. 64–68. [Google Scholar] [CrossRef]
Figure 1. Locations of condition parameters used to calculate the HI of the transformer.
Applsci 10 08897 g001
Figure 2. Gas generation based on temperature (reprinted with permission from CIGRE [5], ©2019).
Applsci 10 08897 g002
Figure 3. OLTC classification (reprinted with permission from CIGRE [30], © 2010).
Applsci 10 08897 g003
Figure 4. Types of oil compartments used by different OLTC designs [32].
Applsci 10 08897 g004
Figure 5. Different pathways for transformer oil contamination from the OLTC gases [8].
Applsci 10 08897 g005
Figure 6. Distribution of power transformers according to (a) age, (b) voltage class and (c) power rating. A, arcing; R, resistor; V, vacuum.
Applsci 10 08897 g006
Figure 7. Acetylene concentration measurements.
Applsci 10 08897 g007
Figure 8. Distribution of power transformers defined as contaminated according to (a) age, (b) voltage class and (c) power rating.
Applsci 10 08897 g008
Figure 9. Fault identification through (a) DTM and (b) DPM.
Applsci 10 08897 g009
Figure 10. Machine learning methodology flowchart.
Applsci 10 08897 g010
Figure 11. Responses used for algorithm training.
Applsci 10 08897 g011
Figure 12. Decision tree obtained from the trained algorithm (concentrations in ppm and power rating in MVA).
Applsci 10 08897 g012
Figure 13. Transformer 4 responses and prediction error.
Applsci 10 08897 g013
Table 1. Gas formation based on the type of failure [6,7].
Fault TypeGas Generated
H 2 CH 4 C 2 H 6 C 2 H 4 C 2 H 2
Thermal faults in oil (<300 C)T1·
Thermal faults in oil (300–700 C)T2·
Thermal faults in oil (>700 C)T3
Partial dischargesPD ·
Low energy discharge—sparkingD1
High energy discharge—arcingD2
•: major concentration; ∘: secondary concentration; ·: trace concentration.
Table 2. Acetylene concentration limits (ppm).
IEEE [6]IEC [7]
O 2 / N 2 Ratio 0.2O 2 / N 2 Ratio > 0.2No OLTCCommunicating OLTC
90th percentile122–2060–280
95th percentile2 *7--
*: This value is 4 ppm when the transformer age is >30 years.
Table 3. Gas source based on OLTC design (reprinted with permission from CIGRE [30], ©2010).
OLTC ComponentsGas Sources
Arc-switching contactsHigh energy discharge gases
Commutation contacts, by-pass contactsLow energy discharge gases
Vacuum interruptersNo gases
Transition resistorsHeating gases 300 C (normal operation)
Heating gases > 300 C (overload, fault case)
Transition reactance (preventive autotransformer, inside transformer tank)No gases
Table 4. Transformer data without the C 2 H 2 /H 2 ratio result.
Transformer
No.
Sample
Date
C 2 H 2 /H 2
Ratio
Age
(Years)
Acetylene
(ppm)
Hydrogen
(ppm)
125/04/20195400
224/05/20181000
313/06/201844520
427/05/201929150
525/09/20172600
Table 5. Transformer data with the C 2 H 2 /H 2 ratio greater than 2.
Transformer
No.
Sample
Date
C 2 H 2 /H 2
Ratio
Age
(Years)
Acetylene
(ppm)
Hydrogen
(ppm)
317/10/20189.3344566
328/01/20193.27444915
309/04/20192.30445323
619/06/20196.7530274
728/01/20192.54237128
817/04/20183.92209424
828/01/20192.442016869
907/06/20193.47186619
1001/04/20193.065110735
1017/10/20182.785112545
1125/09/20172.044411657
1207/06/201934462
1328/01/201945082
1412/04/201825341255
1409/10/20188.273427333
1509/10/201810.603426525
1512/04/20186.633412619
1625/04/20193.19286721
1708/05/20184.3326133
1709/10/20183.8626277
1707/06/20193.7526154
1815/05/20191145111
Table 6. Transformer data with the C 2 H 2 /H 2 ratio less than 2 and a high C 2 H 2 concentration.
Transformer
No.
Sample
Date
C 2 H 2 /H 2
Ratio
Age
(Years)
Acetylene
(ppm)
Hydrogen
(ppm)
409/05/20180.55291120
1901/04/20190.8848219248
1917/10/20180.9248144157
1917/04/20180.6848114168
2028/01/20190.9047219244
2009/10/20181.1747192164
2008/05/20180.7647150198
2101/04/20190.9550159168
2117/10/20180.8550137162
2117/04/20180.6950100144
2225/04/20191.744915187
2208/05/20181.374913498
2209/10/20181.3149131100
2318/03/20190.9545124130
2308/05/20180.8145100123
2309/10/20181.07459690
2417/10/20180.6548102158
2417/04/20180.364856156
2525/04/20191.12499181
2508/05/20180.80497999
2509/10/20180.85496981
2609/10/20180.181859326
2617/04/20180.221857264
2601/04/20190.131841310
2705/06/20180.94433234
2719/06/20191432525
2808/05/20180.25482393
2917/04/20180.131818135
2915/05/20190.49181735
3025/04/20191.20321815
3101/04/20190.061915260
3128/01/20190.061914231
3207/06/20190.90291719
3319/06/20190.15231173
Table 7. Decision tree classifier accuracy results and confusion matrices from different training and test data.
Run
No.
Class90% Training
and 10% Test
80% Training
and 20% Test
70% Training
and 30% Test
60% Training
and 40% Test
50% Training
and 50% Test
P012012012012012
T
1035007010104101392017412
1040080010201430182
2002004034026047
A (%): 100A (%): 98.80A (%): 95.16A (%): 95.78A (%): 95.67
2035007000104101401017420
1040080013011600183
2002005033026029
A (%): 100A (%): 100A (%): 96.77A (%): 97.59A (%): 96.63
3035007100104101411017420
1040080012001333144
20020040070260110
A (%): 100A (%): 100A (%): 99.19A (%): 96.39A (%): 95.19
4034106910105001401017510
1040080013001600200
2002005006036147
A (%): 97.56A (%): 98.80A (%): 100A (%): 97.59A (%): 97.11
5035007000105001420017420
1040080111111500210
2002005114125047
A (%): 100A (%): 100A (%): 96.77A (%): 97.59A (%): 97.11
T: true class; P: predicted class; A: accuracy.
Publisher’s Note: MDPI stays neutral with regard to jurisdictional claims in published maps and institutional affiliations.

