1. Introduction
With the aging of a bridge, the deterioration of materials and downgrading service level, as well as natural disasters such as typhoons and earthquakes, all increase the potential for bridge damage and require frequent and routine maintenance. For preventing such disasters caused by unsafe implementation of bridge maintenance, governments invest in bridge maintenance projects every year to ensure the safety of people and property. For example, in the United States, the cost of repairing and replacing deteriorating bridges was approximated as USS 100 billion in 2010 [
1]. Therefore, the cost optimization of bridge structure maintenance becomes an important challenge in bridge management problems [
2].
In recent years, it has been theoretically assumed that the budget plan should be prepared from the life cycle perspective [
3,
4,
5,
6,
7,
8], where the ideal budget plan is somewhat unrealistic in terms of being applicable to the real world. However, solutions to resolve the mismatch between the planned budget and the awarded budget have been rarely discussed in previous studies related to bridge maintenance problems. Thus, with practical considerations, a crucial question arises, the question of exploring how to allocate the budget where the life cycle maintenance plan violates the current budgeting policy. Such policy only complies with the needs of short-term budget expenditure and not the assessment of concerns that apply to the long-term life cycle. Thus, there exits difficulties in budget implementation, owing to the different perspectives of budget planners and budget reviewers. In Taiwan, budgeting is prepared based on a bottom-up flow. Competent authorities (e.g., budget planners) submit proposed annual budgets to higher-level authorities (e.g., budget reviewers), according to their own current situation. Subsequently, the higher-level authorities review the submitted plans, contemplate annual expenditures holistically, and allocate limited budgets. As a result, the budget plan for the following year may not necessarily be approved, as has been the case for previous proposals regarding each facility. This may be due to insufficient funds in the current year, policy changes, and other reasons, resulting in some facilities failing to obtain funds or a sufficient budget. Budget allocation does not meet the requirements of lower-level authorities (budget recipients). Thus, they must readjust maintenance plans accordingly to achieve maximum benefits, where some plans may be evaluated through a life cycle point of view.
Despite a reasonable bridge maintenance plan based on a life cycle based analysis, the required budget can often not be fully obtained owing to the aforementioned practical circumstances, which fit into the domain of resource-constrained project scheduling problems (RCPSP) [
9,
10,
11,
12]. The RCPSP mainly focuses on a contractor’s constraints in terms of resource possession and the available quantity of usable resources. Thus, an upper limit is set regarding the usage of each type of resource, and the project is then scheduled. Therefore, if each bridge requiring maintenance is regarded as a resource according to the RCPSP definitions, as long as the resource is being used continuously, the serviceable condition of all the bridges can be ensured. Thus, the concept of bridge maintenance scheduling is consistent with the goal of resolving the RCPSP. In addition, project budget limitation in RCPSP is similar to the condition of limited budget utilization caused by the present reduced maintenance budget. Therefore, this study proposes the application of the RCPSP in solving maintenance scheduling problems for bridges under budget constraints.
To aid problem solving, two-stage optimization models are presented in this paper. IBM ILOG CPLEX Optimizer software and the constraint programming (CP) approach is adopted for model development [
13]. In the life cycle lifespan evaluation model (Model-I), the maintenance actions for all bridges under the supervising unit has been planned, based on a life cycle perspective, to obtain the longest operation time while ensuring the serviceable condition of all the bridges. This can be helpful for bridge managers while drafting maintenance budget proposals. After the proposal is approved, according to the actual budget awarded, Model-II (the annual budget allocation model), then reallocates the actual budget to take into account the importance of all bridges and the different costs and benefits of maintenance plans. In this stage, the recalculation of life cycle maintenance scheduling is conducted to adjust the overall maintenance plan. This two-stage optimization model implemented recursively can effectively help bridge managers to solve maintenance scheduling problems for which their maintenance units are responsible.
The following sections are organized as follows. First, a literature review on infrastructure maintenance, CP applications, and RCPSP areas related to this study is briefly provided. Then, the methodology introduces how to apply the RCPSP framework in order to solve life cycle maintenance scheduling problems in relation to bridge infrastructure. The two-stage models proposed in this paper are then developed. Bridge infrastructure located in southern Taiwan is further used as case study to demonstrate the applicability of the proposed model. Finally, conclusions are presented.
2. Literature Review
Facility maintenance is an important issue for the safety of people and government finance. Maintenance must be carried out immediately at a fast-deteriorating facility as the deterioration rate will reduce the service life span [
3,
14,
15]. Infrastructure can be used optimally if it is supported by economical and efficient maintenance [
16,
17]. A great deal of research focuses on this issue. Srinivasan and Parlikad [
18] utilized a partially observable Markov decision process to capture the condition of infrastructure assets and provide a mechanism to monitor asset condition value. Stajano et al. [
19] investigated wireless sensors, network applications, and the implementation of data visualization in large civil engineering infrastructure monitoring and discussed various problems and solutions. Liden and Joborn [
20] introduced a regime called maintenance windows, which is used in the Swedish Transport Administration to provide a framework that can smooth the impacts on railway traffic while executing maintenance actions. Lu and et al. [
21] categorized common field measuring instruments for scoring bridge conditions, and highlighted the benefits and shortcomings of such instruments to validate bridge safety assessments. Feng et al. [
22] introduced nature frequency as an index to monitor bridge safety. These studies aimed at monitoring the facilities and providing a real time warning to avoid property loss from failure of the facility. A bridge serves as a guarantor for transportation between two places. Not only a suitable monitoring system, but also a reasonable maintenance plan, which corresponds to the government’s annual budget preparation is needed. In annual budget preparations, maintenance costs are wasted when the preventive maintenance is inefficient [
4,
5]. The government public sector has a limited annual budget that is always insufficient to serve the needs of routine maintenance [
23,
24]. Alberto et al. [
25] and Xie and Zhang [
26] considered these maintenance budget limitations to reduce the bridge maintenance cost ratio, in order to optimize structure safety from earthquake events. Orcesi and Frangopol [
27] proposed a model to optimize the maintenance strategies based on structural health monitoring information on highway bridges, which considers the maintenance cost and monitor cost. Ghodoosi et al. [
2] used a genetic algorithm to develop a rational method in which deterioration, intervention effects, and financial models are considered.
Moreover, the bridge element deterioration model plays an important role in the planning model. There are two types of deterioration model, as follows: (1) Progressive deterioration affects the structure capacity continuously at a slow rate that may change randomly over time, and (2) Shock-based deterioration generates significant changes on the structure caused by extraordinary events such as natural disasters [
28]. The deterioration model adopted in this study is the progressive deterioration model. Ghodoosi et al. [
29] also presented a reliability deterioration model at the system level for conventional bridges, and this model can be adopted through a new reliability index. Garavaglia and Sgambi [
30] proposed the Markovian renewal process as a deterioration law for maintenance strategies for a steel bridge, and a Monte Carlo methodology was finally suggested to evaluate the structural health. Saydam and Frangopol [
6] utilized Markov chains to evaluate the performance of deteriorated components of composite bridge superstructures that are composed of five steel girders and reinforced concrete decks. Furthermore, Wu et al. [
31] employed semi-Markov chains to create a bridge structure deterioration model based on the Federal Highway Administration (FHWA) condition ratings. Later, Fang and Sun [
7] proposed a Weibull distribution based semi-Markov process model for urban bridge deterioration prediction and concluded that their model can predict the deterioration behavior of bridge infrastructure with a higher accuracy rate than existing regression analysis methods. Yang et al. [
32] proposed a deterioration model for bridge structures based on a probabilistic method using Monte Carlo simulations, with Latin hypercube sampling. Choi et al. [
33] introduced a performance degradation model, using a deep-learning algorithm called the long short-term memory (LSTM) algorithm—a representative recurrent neural network model—to employ bridge concrete deck inspection data which have been recorded in bridge management systems in Korea from 1995 up to 2017. The authors also suggested the model can be used in bridge inspection, maintenance and repair cycles, and for estimation of the inspection cost. Derived from the interaction between different defect mechanisms, Calvert et al. [
34] developed a bridge structure deterioration model employing a dynamic Bayesian network.
Besides the maintenance costs, researchers are also aware of other environmental factors when constructing a maintenance plan. Orcesi and Cremona [
35] developed a framework for bridge maintenance problems which considers user cost, bridge owner cost, and the specific location of each bridge in the transportation network. Thompson and et al. [
36] proposed the user cost model of bridges with three considerations, which are (1) bridge widening affects accident risk, (2) bridge strengthening affects the ability of heavy trucks to pass and so consideration must be given to the detour costs, and (3) bridge raising affects the ability of tall trucks to pass under the bridge. Although this paper is not aimed at bridge maintenance, these concepts in terms of user cost, especially occur when a bridge is in the maintenance period. Huang and Huang [
37] considered reducing user cost when a bridge in maintenance and provide a bridge maintenance plan model which aims to discuss applicable maintenance schedules of various bridge components. Hu et al. [
38] intended to reduce user cost based on traveling distance within a bridge network, from the perspective of waiting time. Lwambuka and Mtenga [
8] attempted to reduce the user cost that is caused by bridge maintenance. Therefore, most of the studies are from the perspective of life cycle, and take structural health in terms of deterioration into consideration. Frangopol and Soliman [
39] provided an overview in the field of life cycle engineering for civil and marine structural systems, as well as future research directions.
Constraint programming (CP) is a computer implementation integrated AI (artificial intelligence) and OR (operations research) technique [
40,
41]. It has been adopted to solve many combinatorial problems in different fields. For example, Liu and Wang [
42] proposed a new linear scheduling model for construction sites which allows for consideration of a multi-skill work crew with high productivity and great work continuity, and it adopts a CP optimization process to solve linear scheduling problems. Meng et al. [
43] and Lunardi et al. [
44] performed a comparison between CP and mixed-integer linear programming to minimize the make-span in a shop scheduling problem. Pour et al. [
45] combined hybrid approaches of constraint programming and mixed-integer programming to develop an initial feasible solution—the “warm start” solution. This model was applied in the Danish railway system and produced significant initial solutions for solving large-scale scheduling problems. Moreover, Hauder et al. [
46] also adopted a combination of mixed-integer and CP methods to consolidate flexible project scheduling problems. Wallace and Smith [
47] created a new constraint programming model to solve the cyclic hoist scheduling problem, which was proven to be more effective than the previous CP-based models. Hojabri et al. [
48] developed a CP-based adaptive neighborhood search model to solve vehicle routing problems dealing with the logistical issues of large items for retailer companies, where the solution focuses on the synchronization of arrival times of delivering items and the crew for installation in customer sites. Kizilay and et al. [
49] proposed CP models to solve he integrated port container terminal problem (IPCTP) that considers the optimization of the intersectional operations quay and yard crane assignments and scheduling, yard location selection, and yard truck assignment and scheduling. For maintenance issues, Lazarev and et al. [
50] proposed an optimization algorithm for locomotive maintenance scheduling. Different objectives were discussed in this research. Such objectives include the minimization of several important time-related variables, such as total and average waiting times of locomotives, and the start and finish time of maintenance on all locomotives. Compared with the heuristic algorithm, CP with the ILOG CPLEX Optimizer provides better results in less time.
On the other hand, resource limitation is another issue to consider and has great influence on optimization problems in various fields. In construction sites, resource allocation issues are crucial to a project’s success, since the available resources are always less than the required resources. In the proposed two-stage optimization model, the bridge maintenance problem is treated as the special case in the resource-constrained project scheduling problem (RCPSP). RCPSP is a problem domain used to search for the optimal solution in terms of project schedules, in order to minimize the project’s duration based on resource limitations and precedence constraints [
9]. RCPSP became a challenging problem for project managers based on project characteristics, such as different types of activities, massive resource usage, and complex precedence relationships [
10,
11]. On the other hand, the main reason for project delays is a lack of proper resource-constrained scheduling [
12]. In a resource-constrained environment, typical time–cost trade-off analyses are discussed, and moreover, the overall evaluations of project performance in regard to quality and environmental impacts should be further considered [
51,
52]. The RCPSP framework was adopted to solve scheduling problems in project management, manufacturing planning, and construction management. Several RCPSP applications in the construction management field have been conducted in the last decade. Liu and Wang [
53] proposed a CP-based optimization model which aims to integrate RCPSP and cash flow problems, where typical calculations of cash flows usually ignore resource usage. This model was developed from a contractor’s point of view and attempted to tackle the management goal of profit maximization. Goncalves et al. [
54] used a genetic algorithm (GA) to solve the resource constrained multi-project scheduling problem (RCMPSP). The goal is to find a schedule of the activities (i.e., to determine the start and completion times of the detailed activities). It takes into consideration multi-resource and inter-project precedence constraints, and the objective function is overall project duration minimization. Several alternative solutions representing different decoding methods were tested with different sizes of projects from 10 to 50 projects, where activity number varies from 1200 to 6000 activities. Hu and Flood [
55] also adopted a GA to solve RCPSPs with the consideration of two objectives: minimization of the project’s overall duration and total cost. The strength Pareto evolutionary approach II (SPEA II) was assessed with a proposed innovative chromosome design. In the past decade, research of RCPSP has utilized many metaheuristics methods, such as particle swarm optimization (PSO), genetic algorithm (GA), ant colony optimization (ACO), and simulated annealing (SA). However, none of these methods can well perform in all situations [
56].
4. Model Description
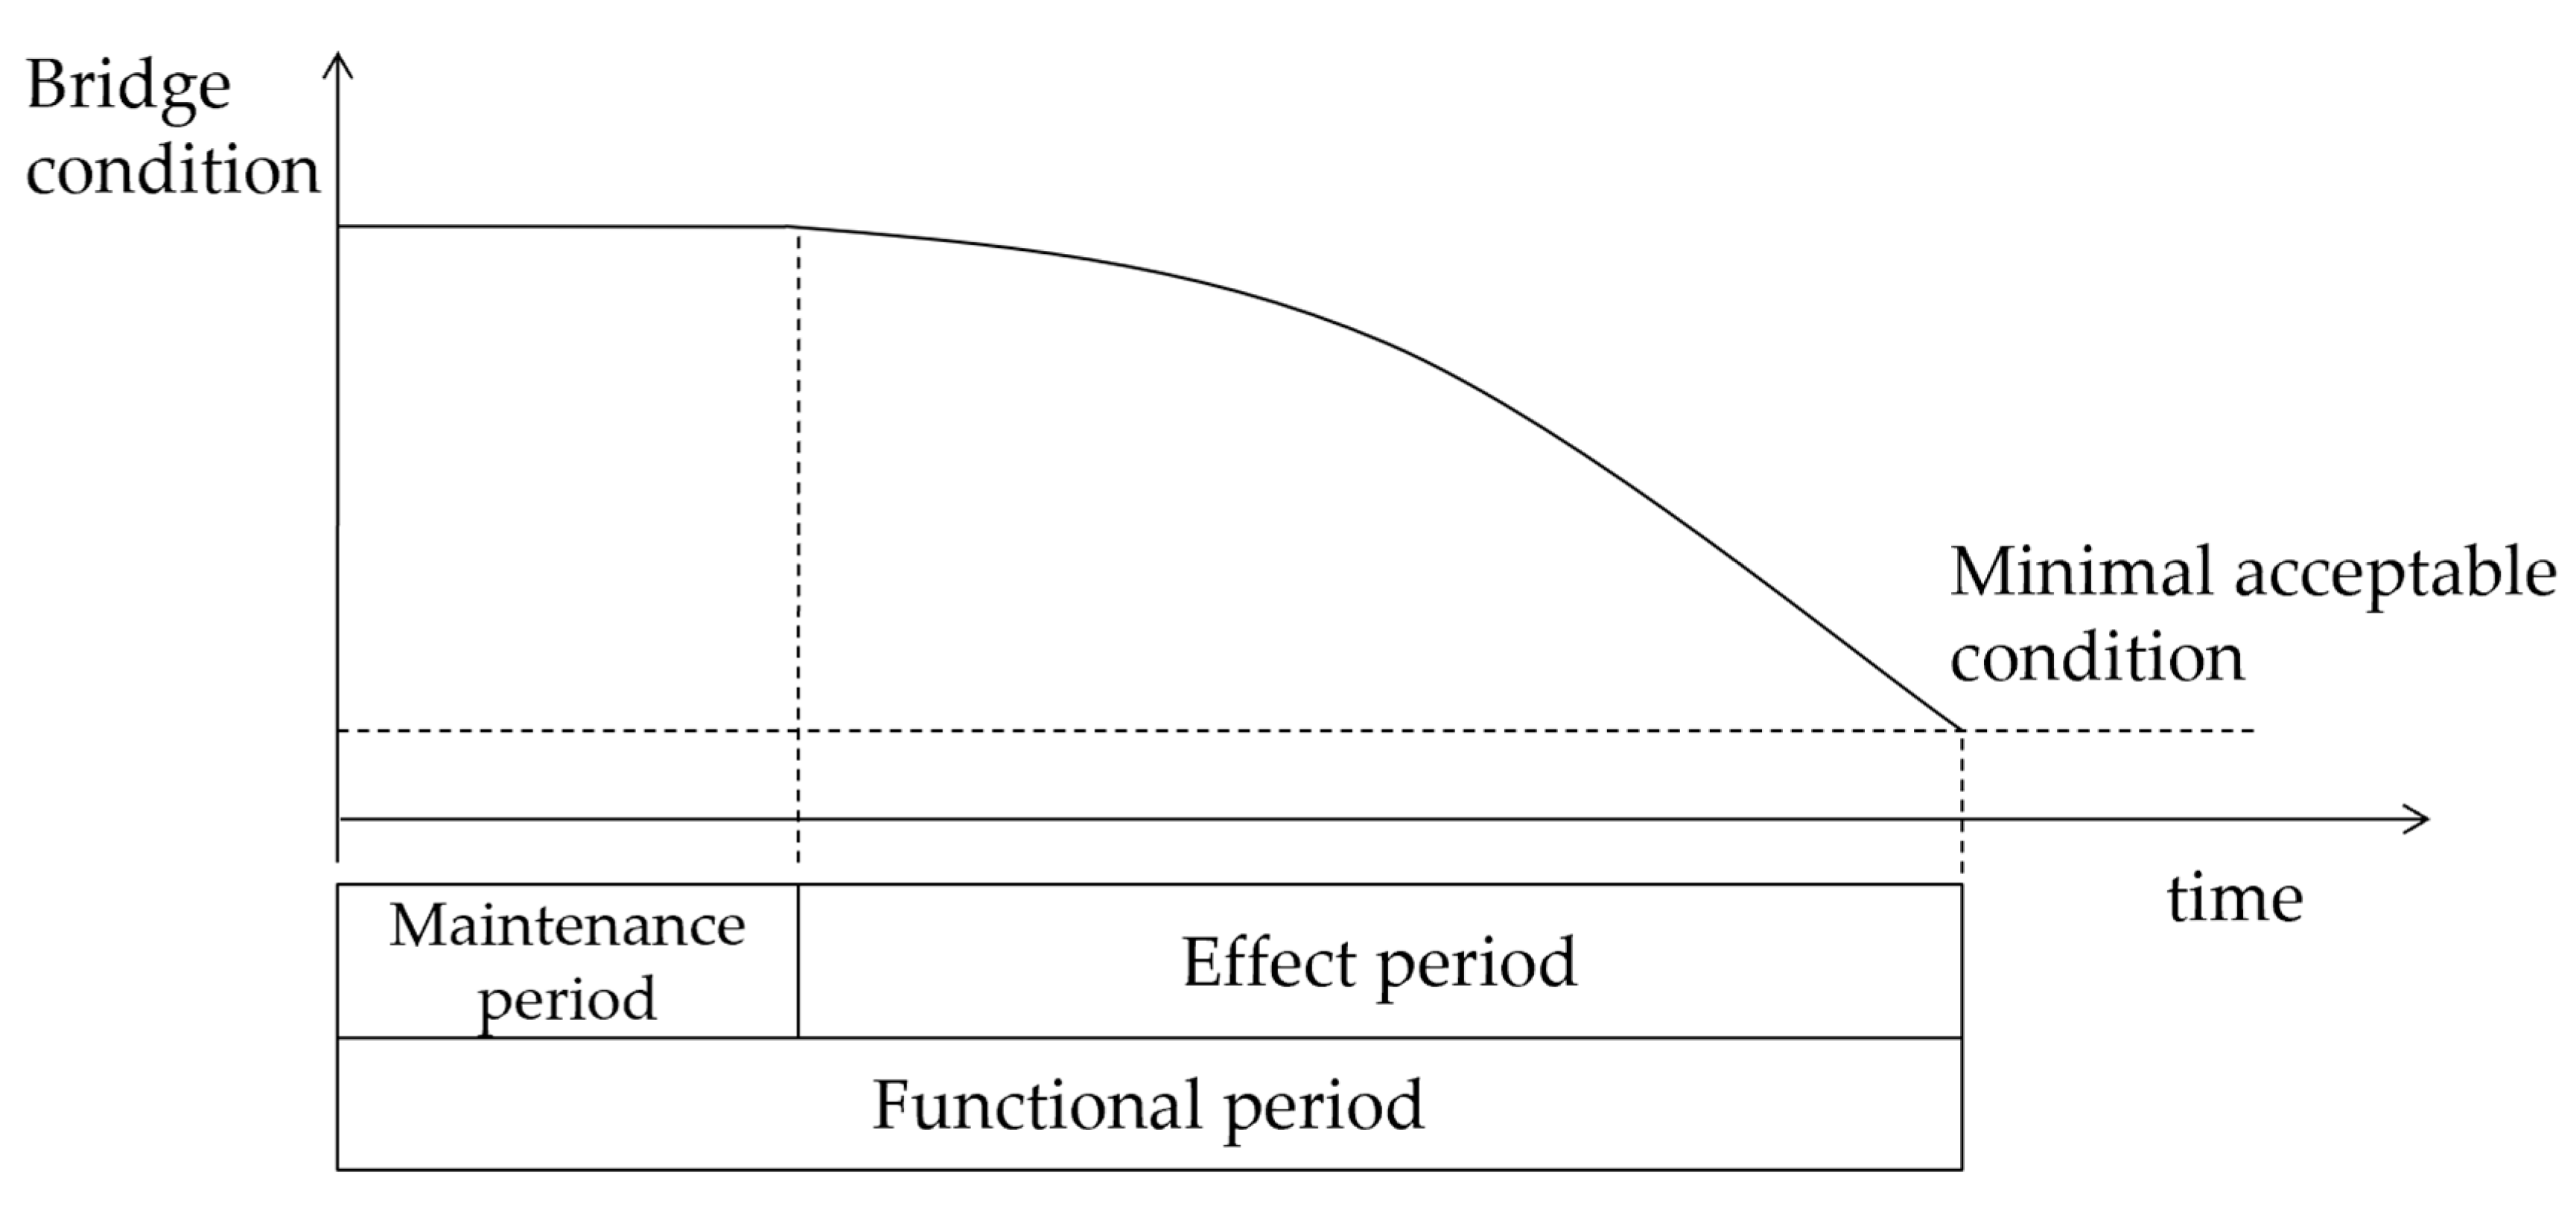
In this study, the concept of RCPSP is used to find a proper plan for bridge maintenance. A one-time maintenance strategy of the bridge and its effectiveness are shown in
Figure 1.
The plan includes two periods. These are named the maintenance period and the effect period in this study. Additionally, the total period of a plan is named as the functional period in this study.
Table 2 shows the parameters of the two periods corresponding to the RCPSP.
The cost incurred during the maintenance period is the construction cost, and the cost incurred during the effect period refers to the daily expenditure for maintenance operations. The overall duration (the aforementioned functional period) includes the maintenance period and the effect period.
Considering the implementation time of maintenance work, this study concludes the following points based on [
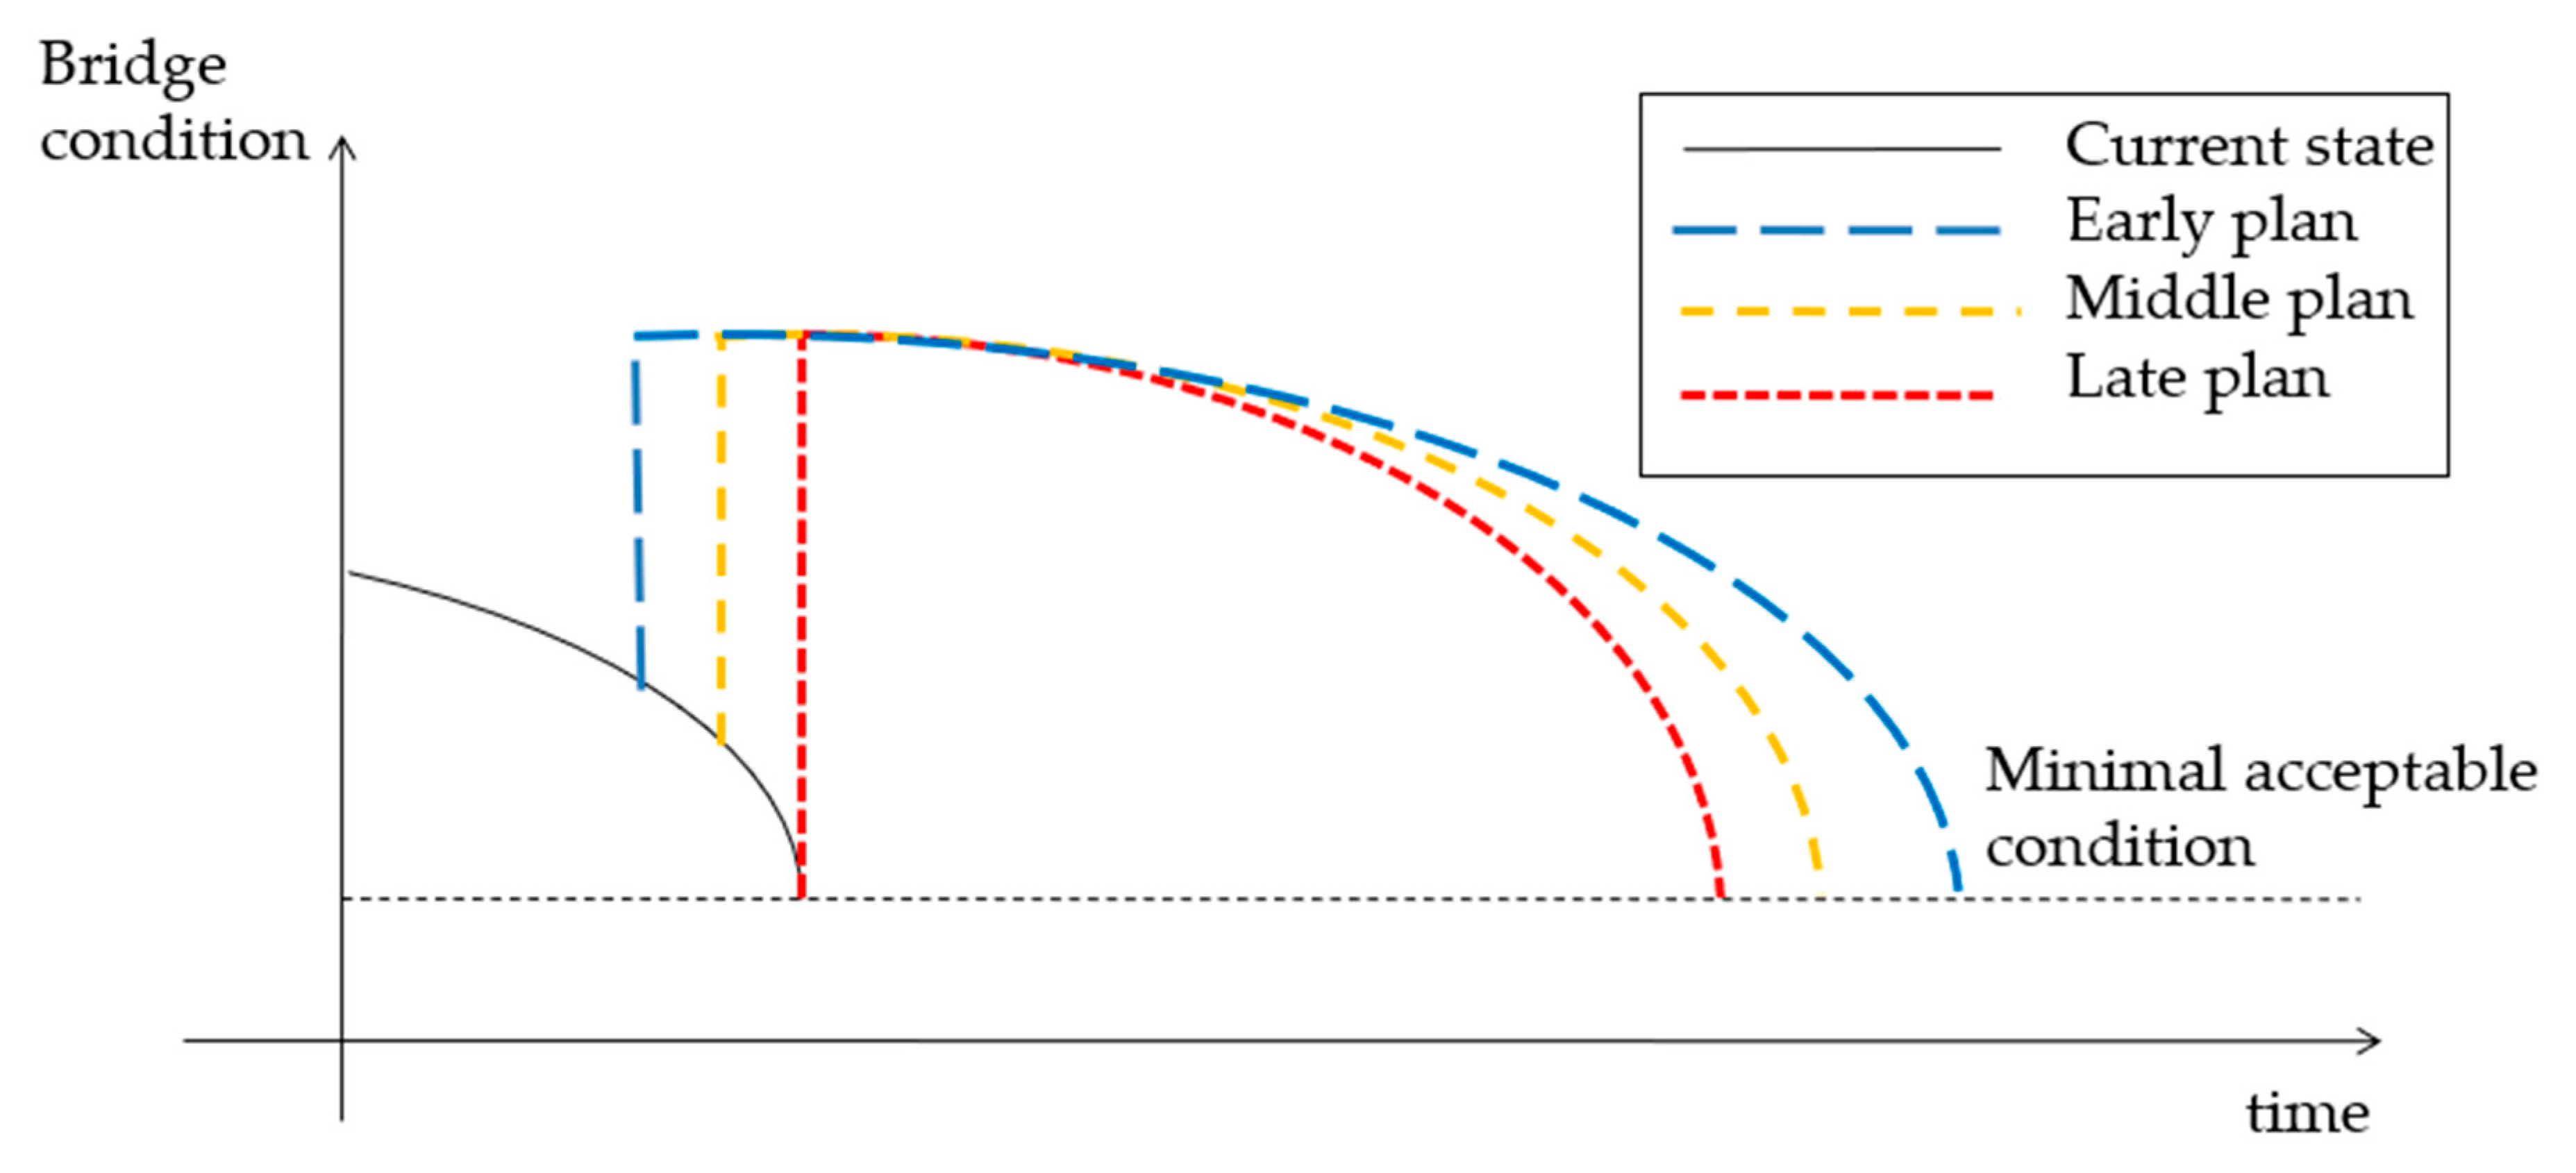
32]: if a bridge is maintained earlier, the operating period can be extended more, suggesting a longer effect period; meanwhile, if the maintenance is carried out late, the effect period becomes shorter.
Figure 2 elaborates on this concept, with the horizontal and vertical axes referring to the time and the condition of the bridge, respectively. The larger the vertical axis value, the better the bridge’s condition. However, the model retains flexibility in the setting of parameters, where the parameters can be adjusted according to the actual conditions.
Moreover, as shown in
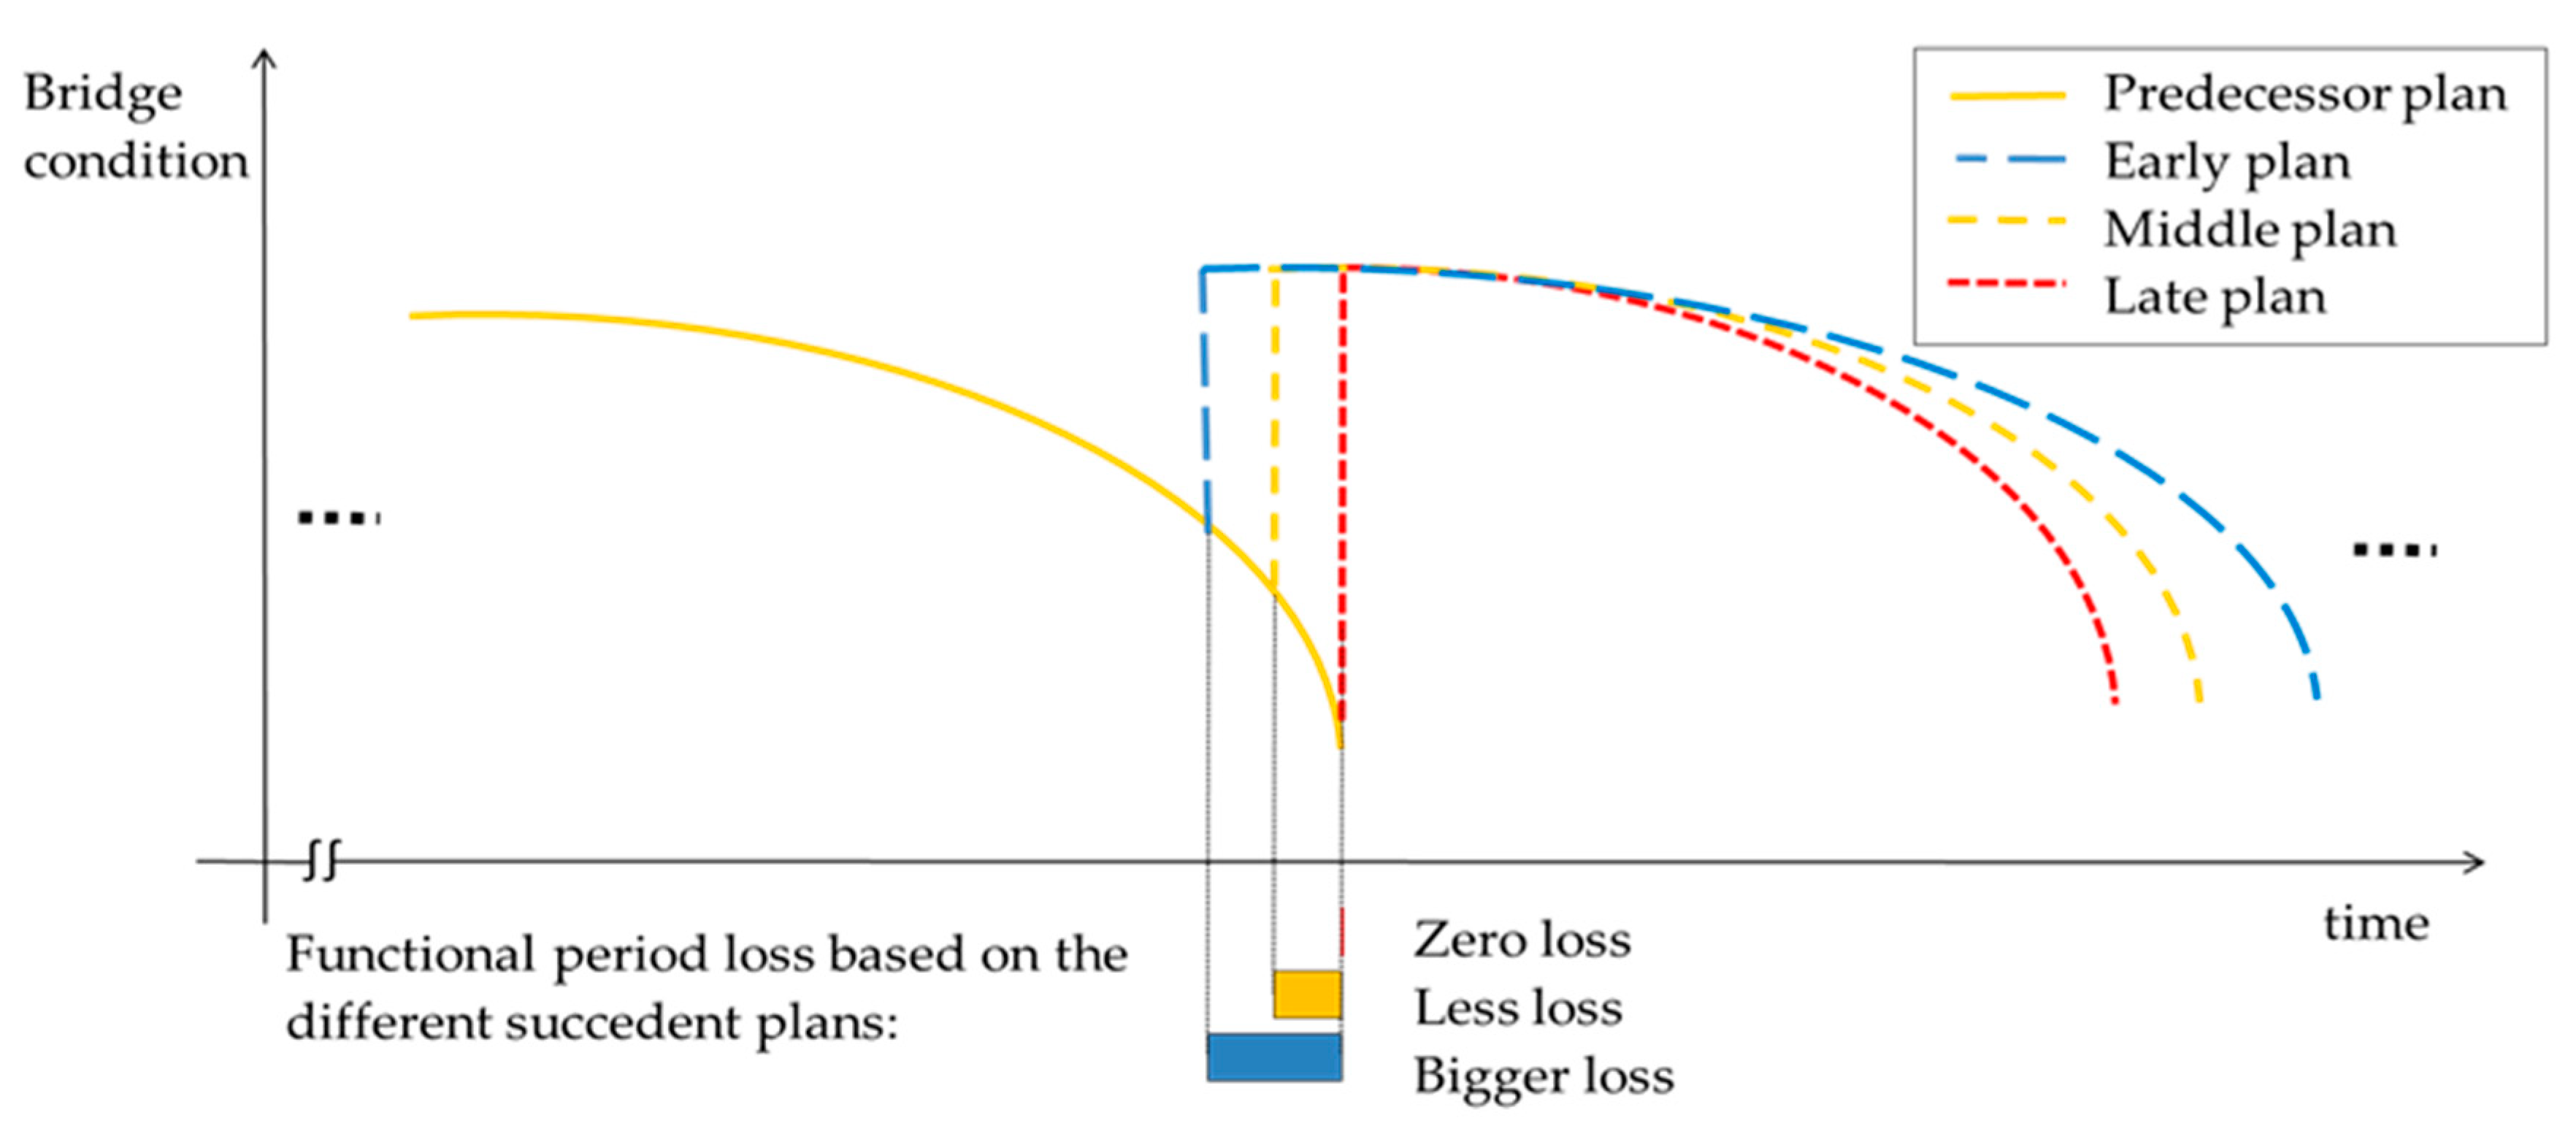
Figure 2, this study classifies the implementation of the plan into three scenarios (i.e., early, middle, and late) and refers them as early, middle, and late plans, respectively. These plans are implemented on the bridge in its current state (i.e., early and middle plans) at three different time frames. Therefore, the selection of plans will have an impact on the remaining operation duration of the current plan of the bridge. Naturally, the earlier the plan is executed, the longer the remaining duration of the leading plan will be sacrificed. As shown in
Figure 3, subsequent plans change the duration of the current plan. In general, the early plan significantly reduces the functional period of the leading plan, while the late plan does not affect it.
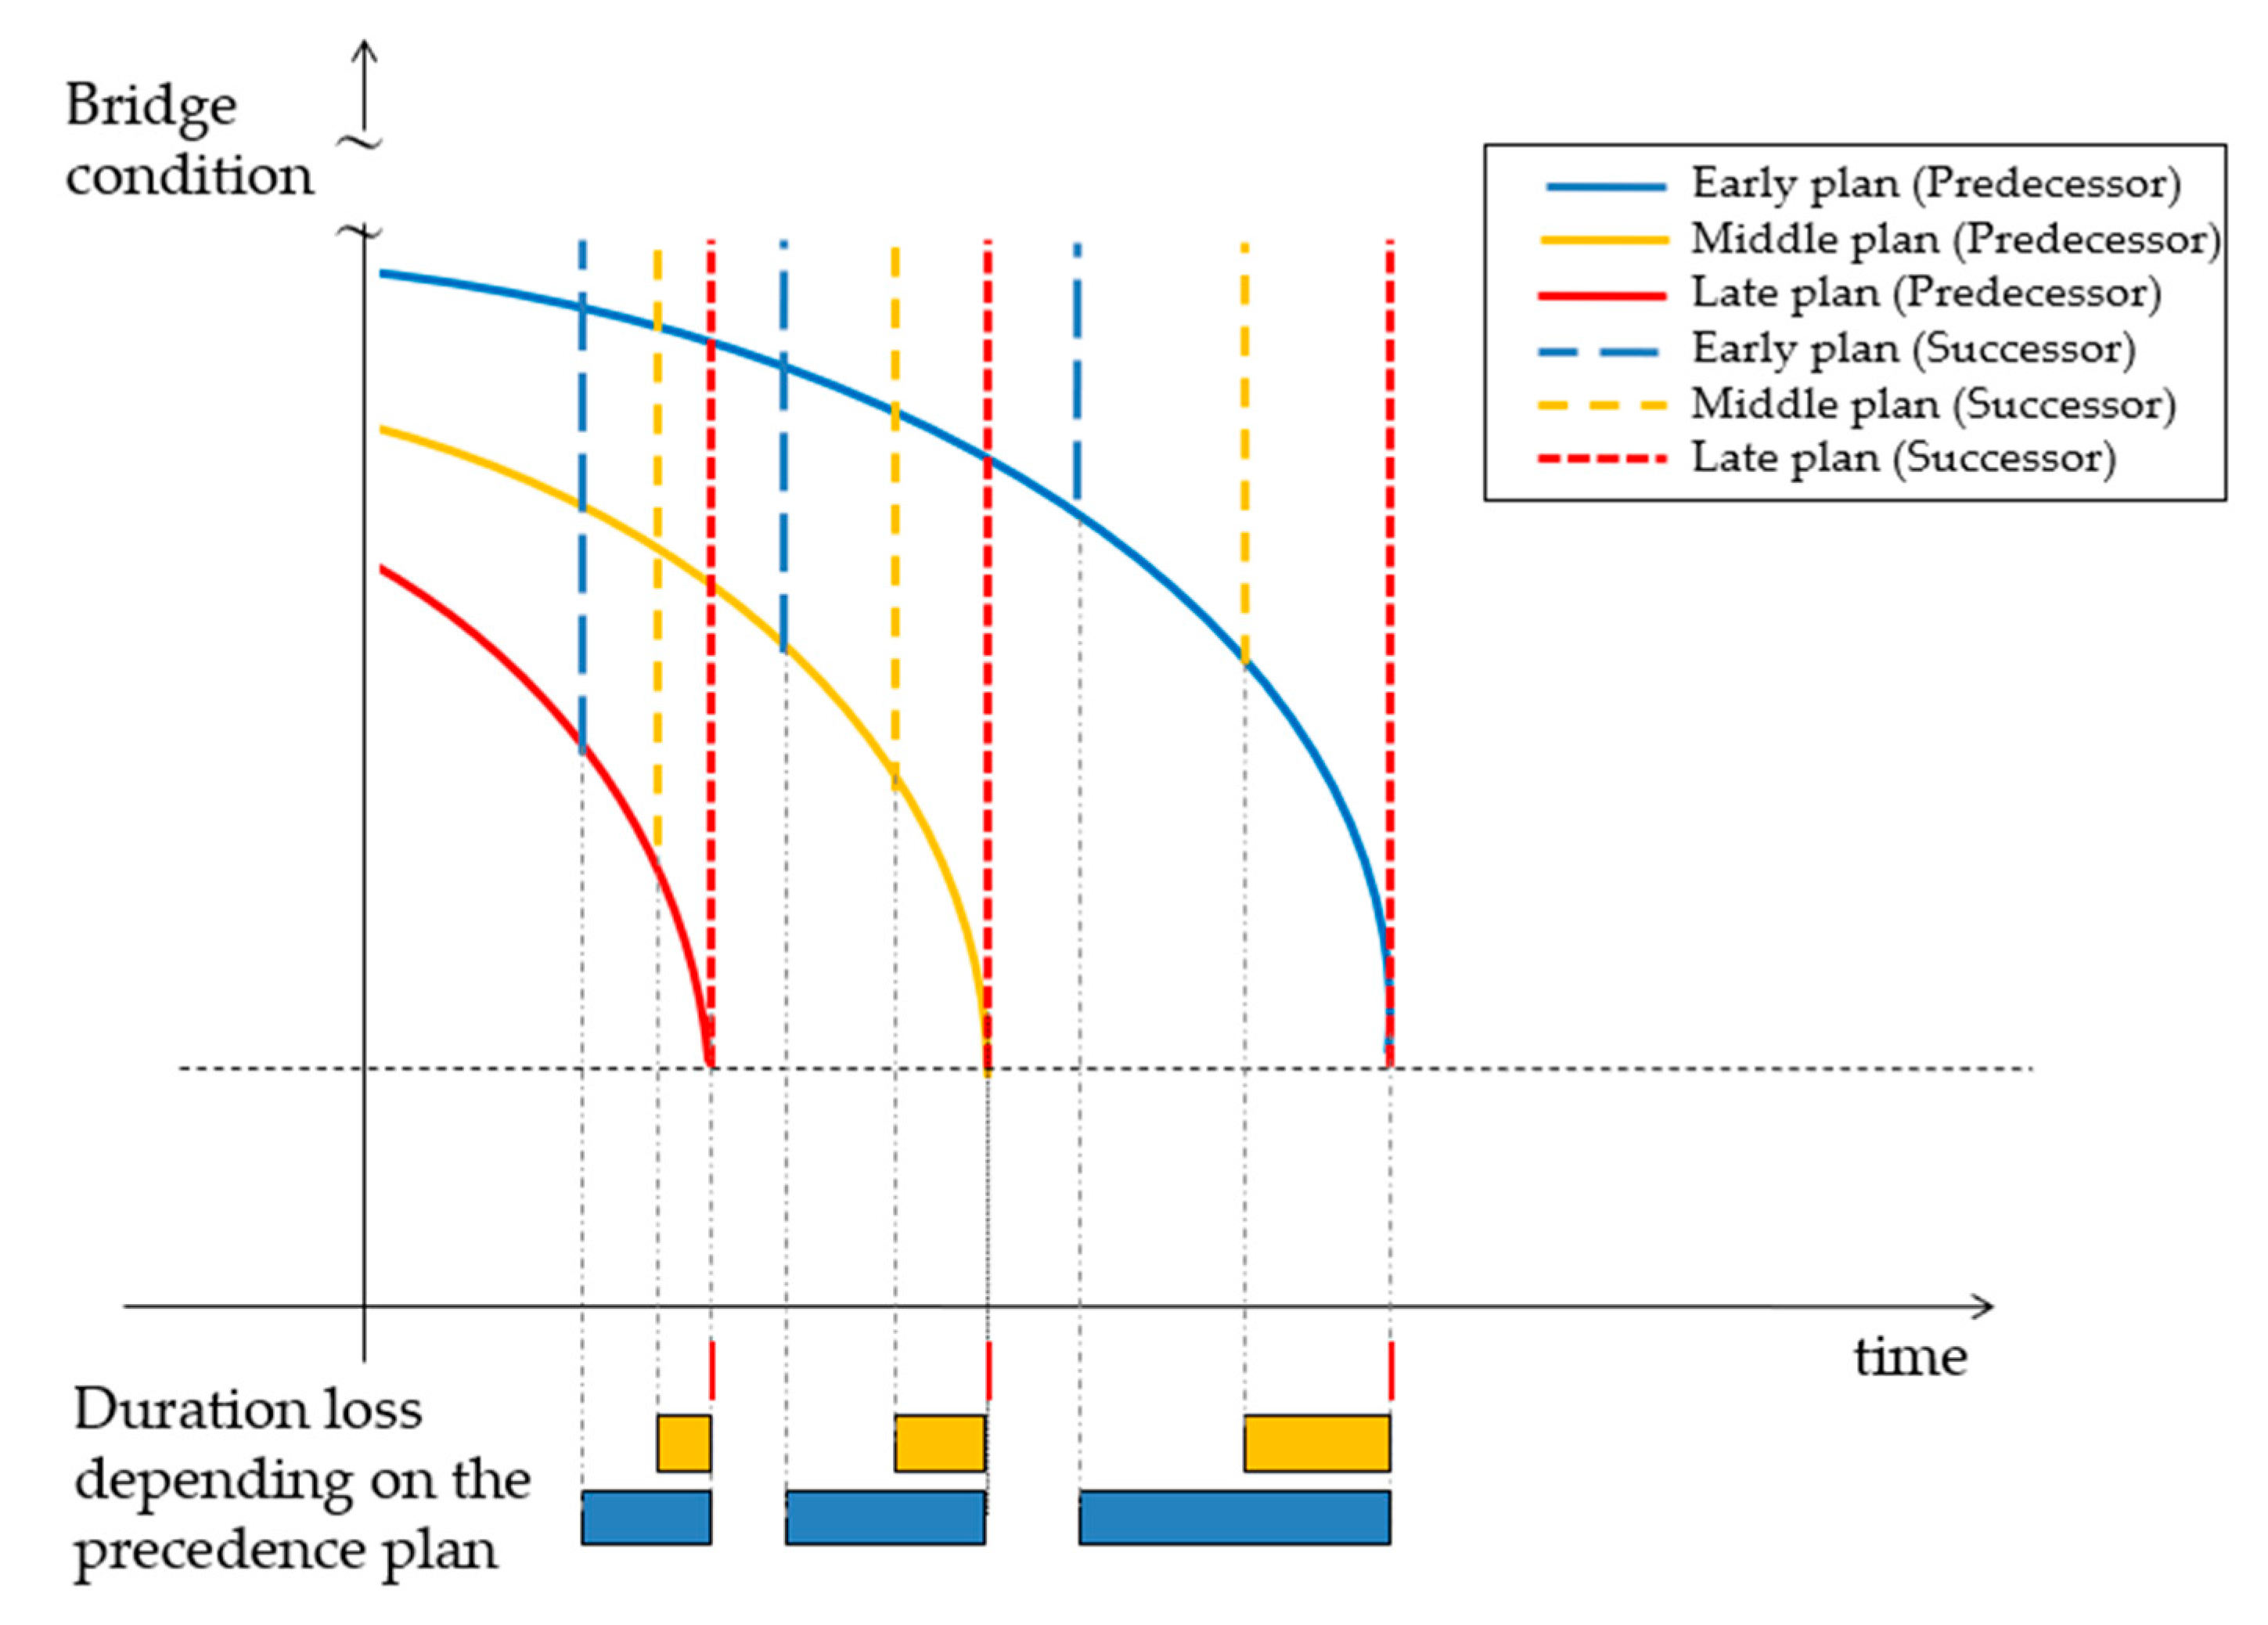
Greater variation can be observed while reducing the functional period of the leading plan. When there are different leading programs and an early plan, a middle or late plan is selected, shown in
Figure 4.
This difference can be represented by an influence matrix (
Table 3). Each value in the matrix represents the amount of service life lost for each plan combination. The influence matrix can be used to find the best plan combination.
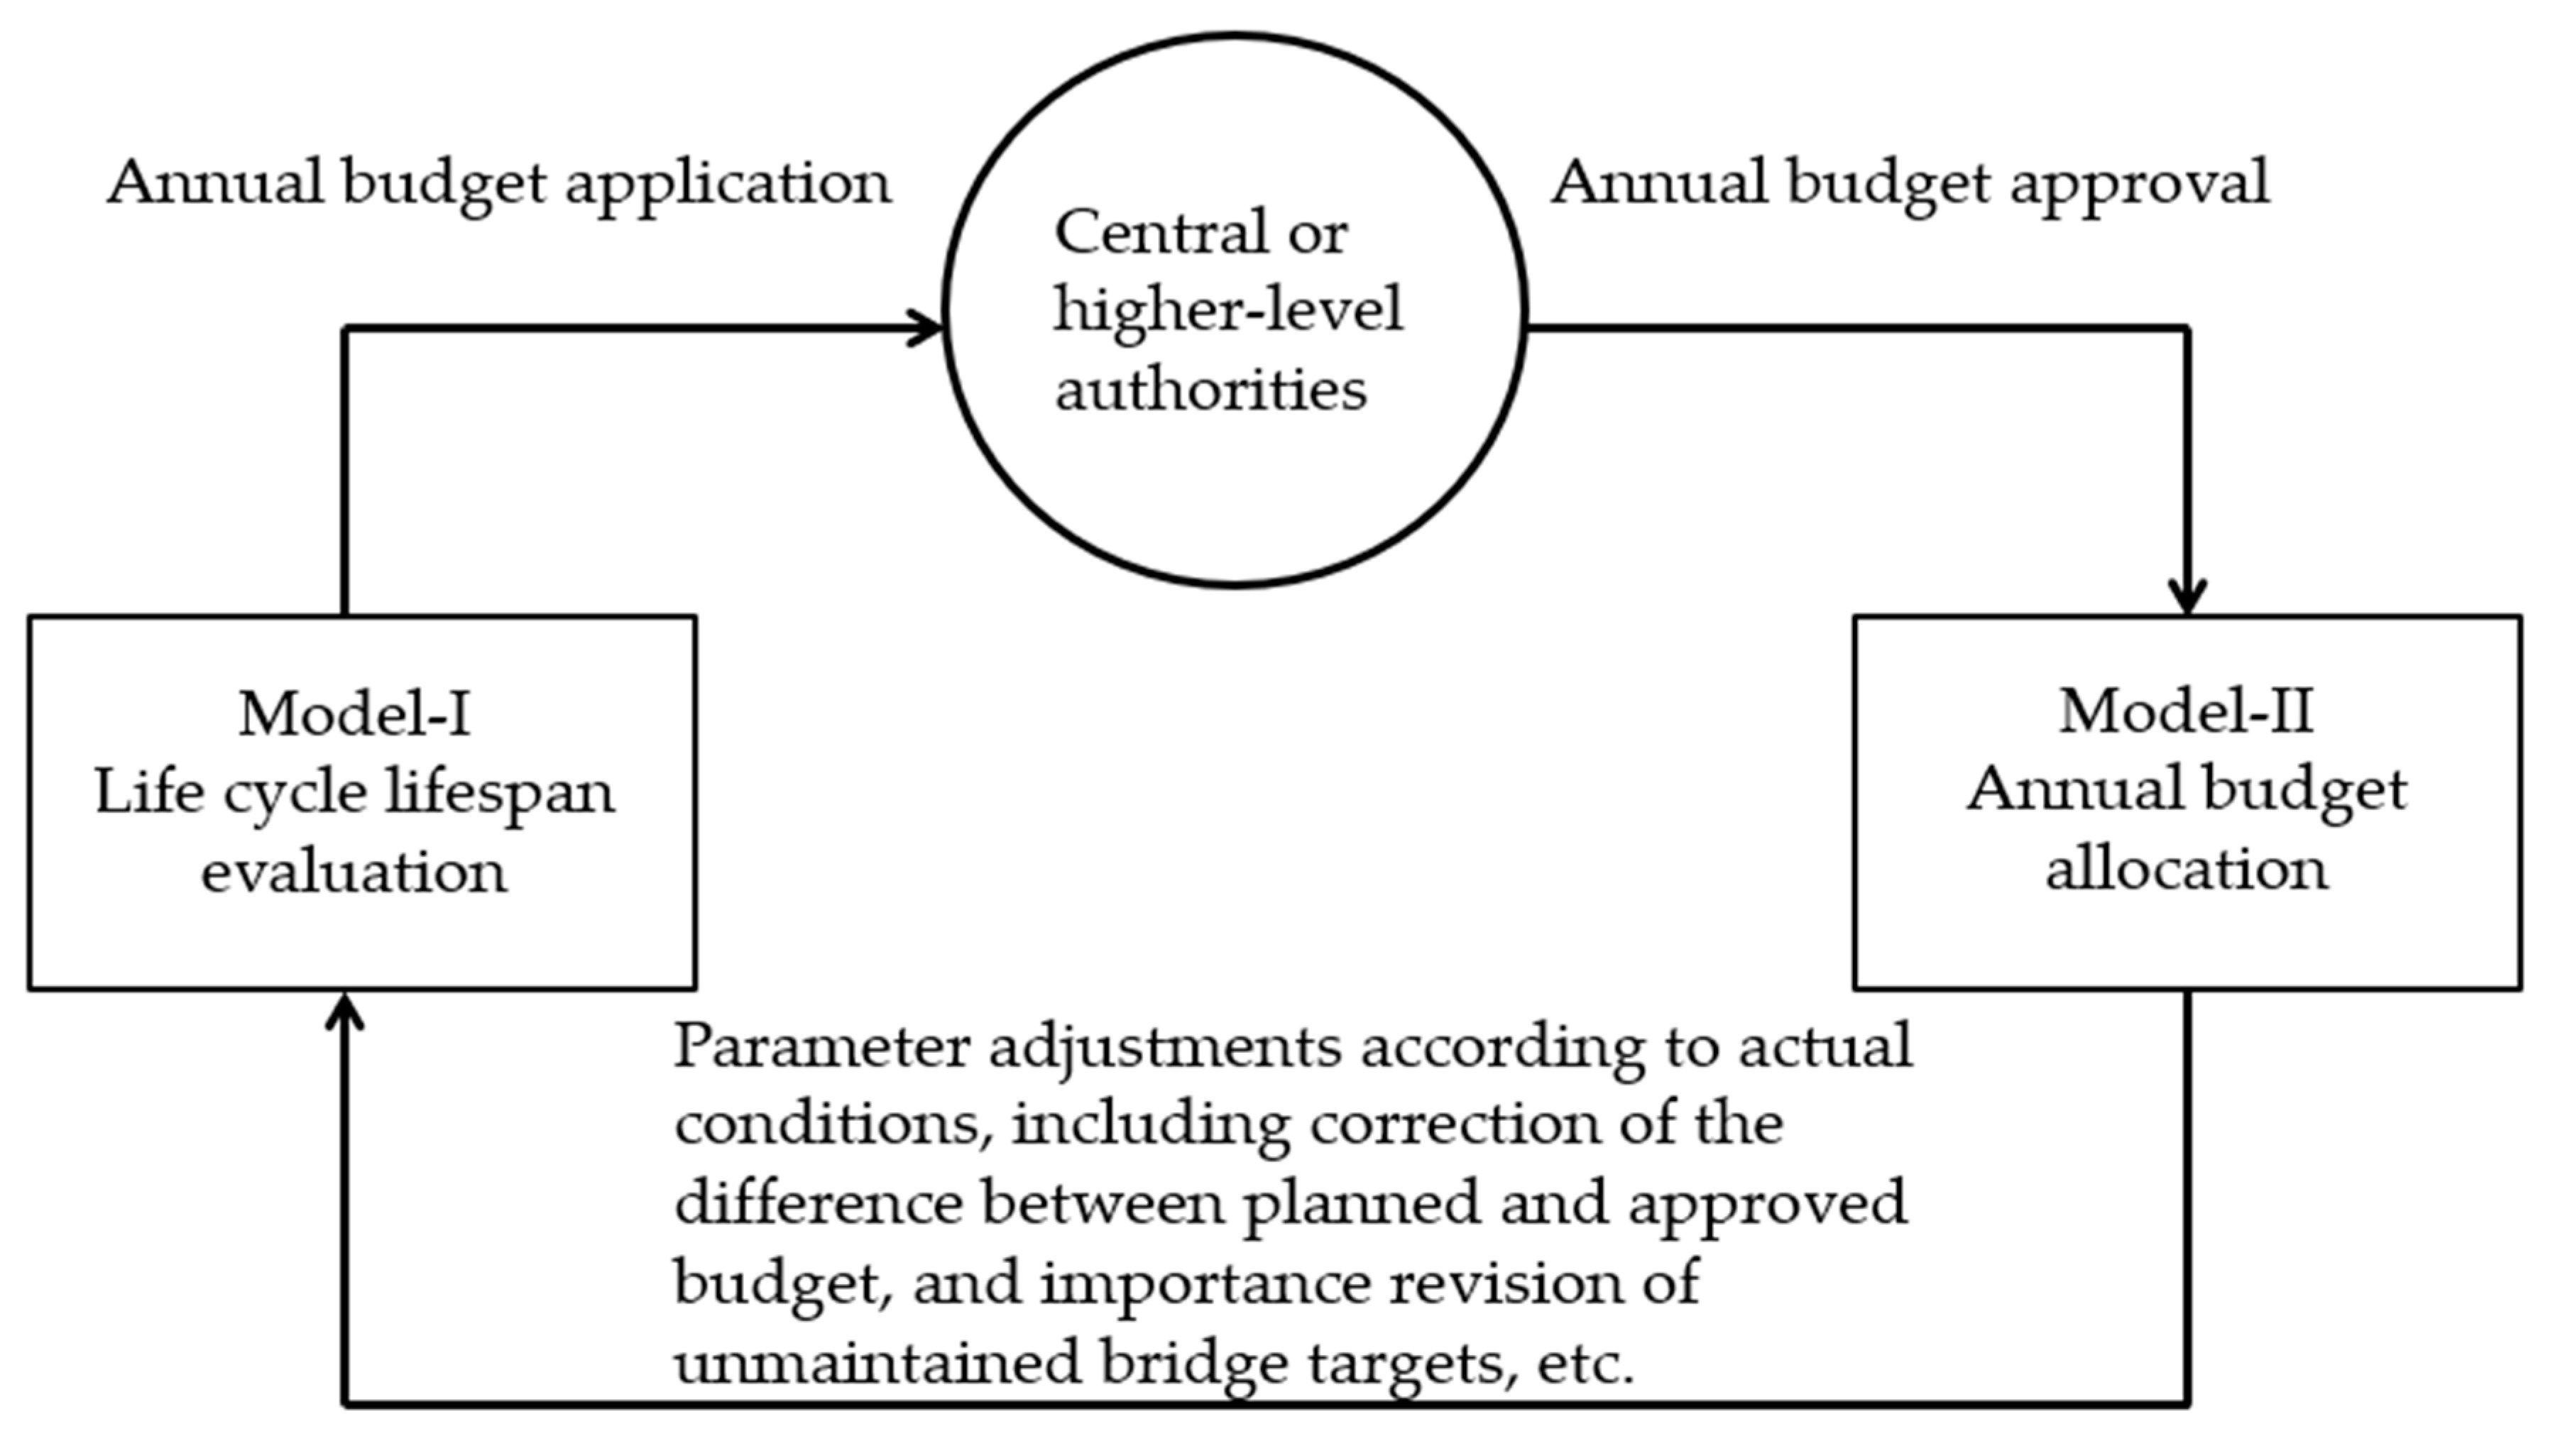
Overall, this study proposes two models according to the actual requirements. The recursive yearly implementation process is shown in
Figure 5. Subordinate authorities use Model-I to evaluate the annual maintenance cost for all bridges in the planning cycle, and use the results of the model as a reference basis for utilizing the following year’s budget, though the result of Model-I is calculated in a budget-free setup.
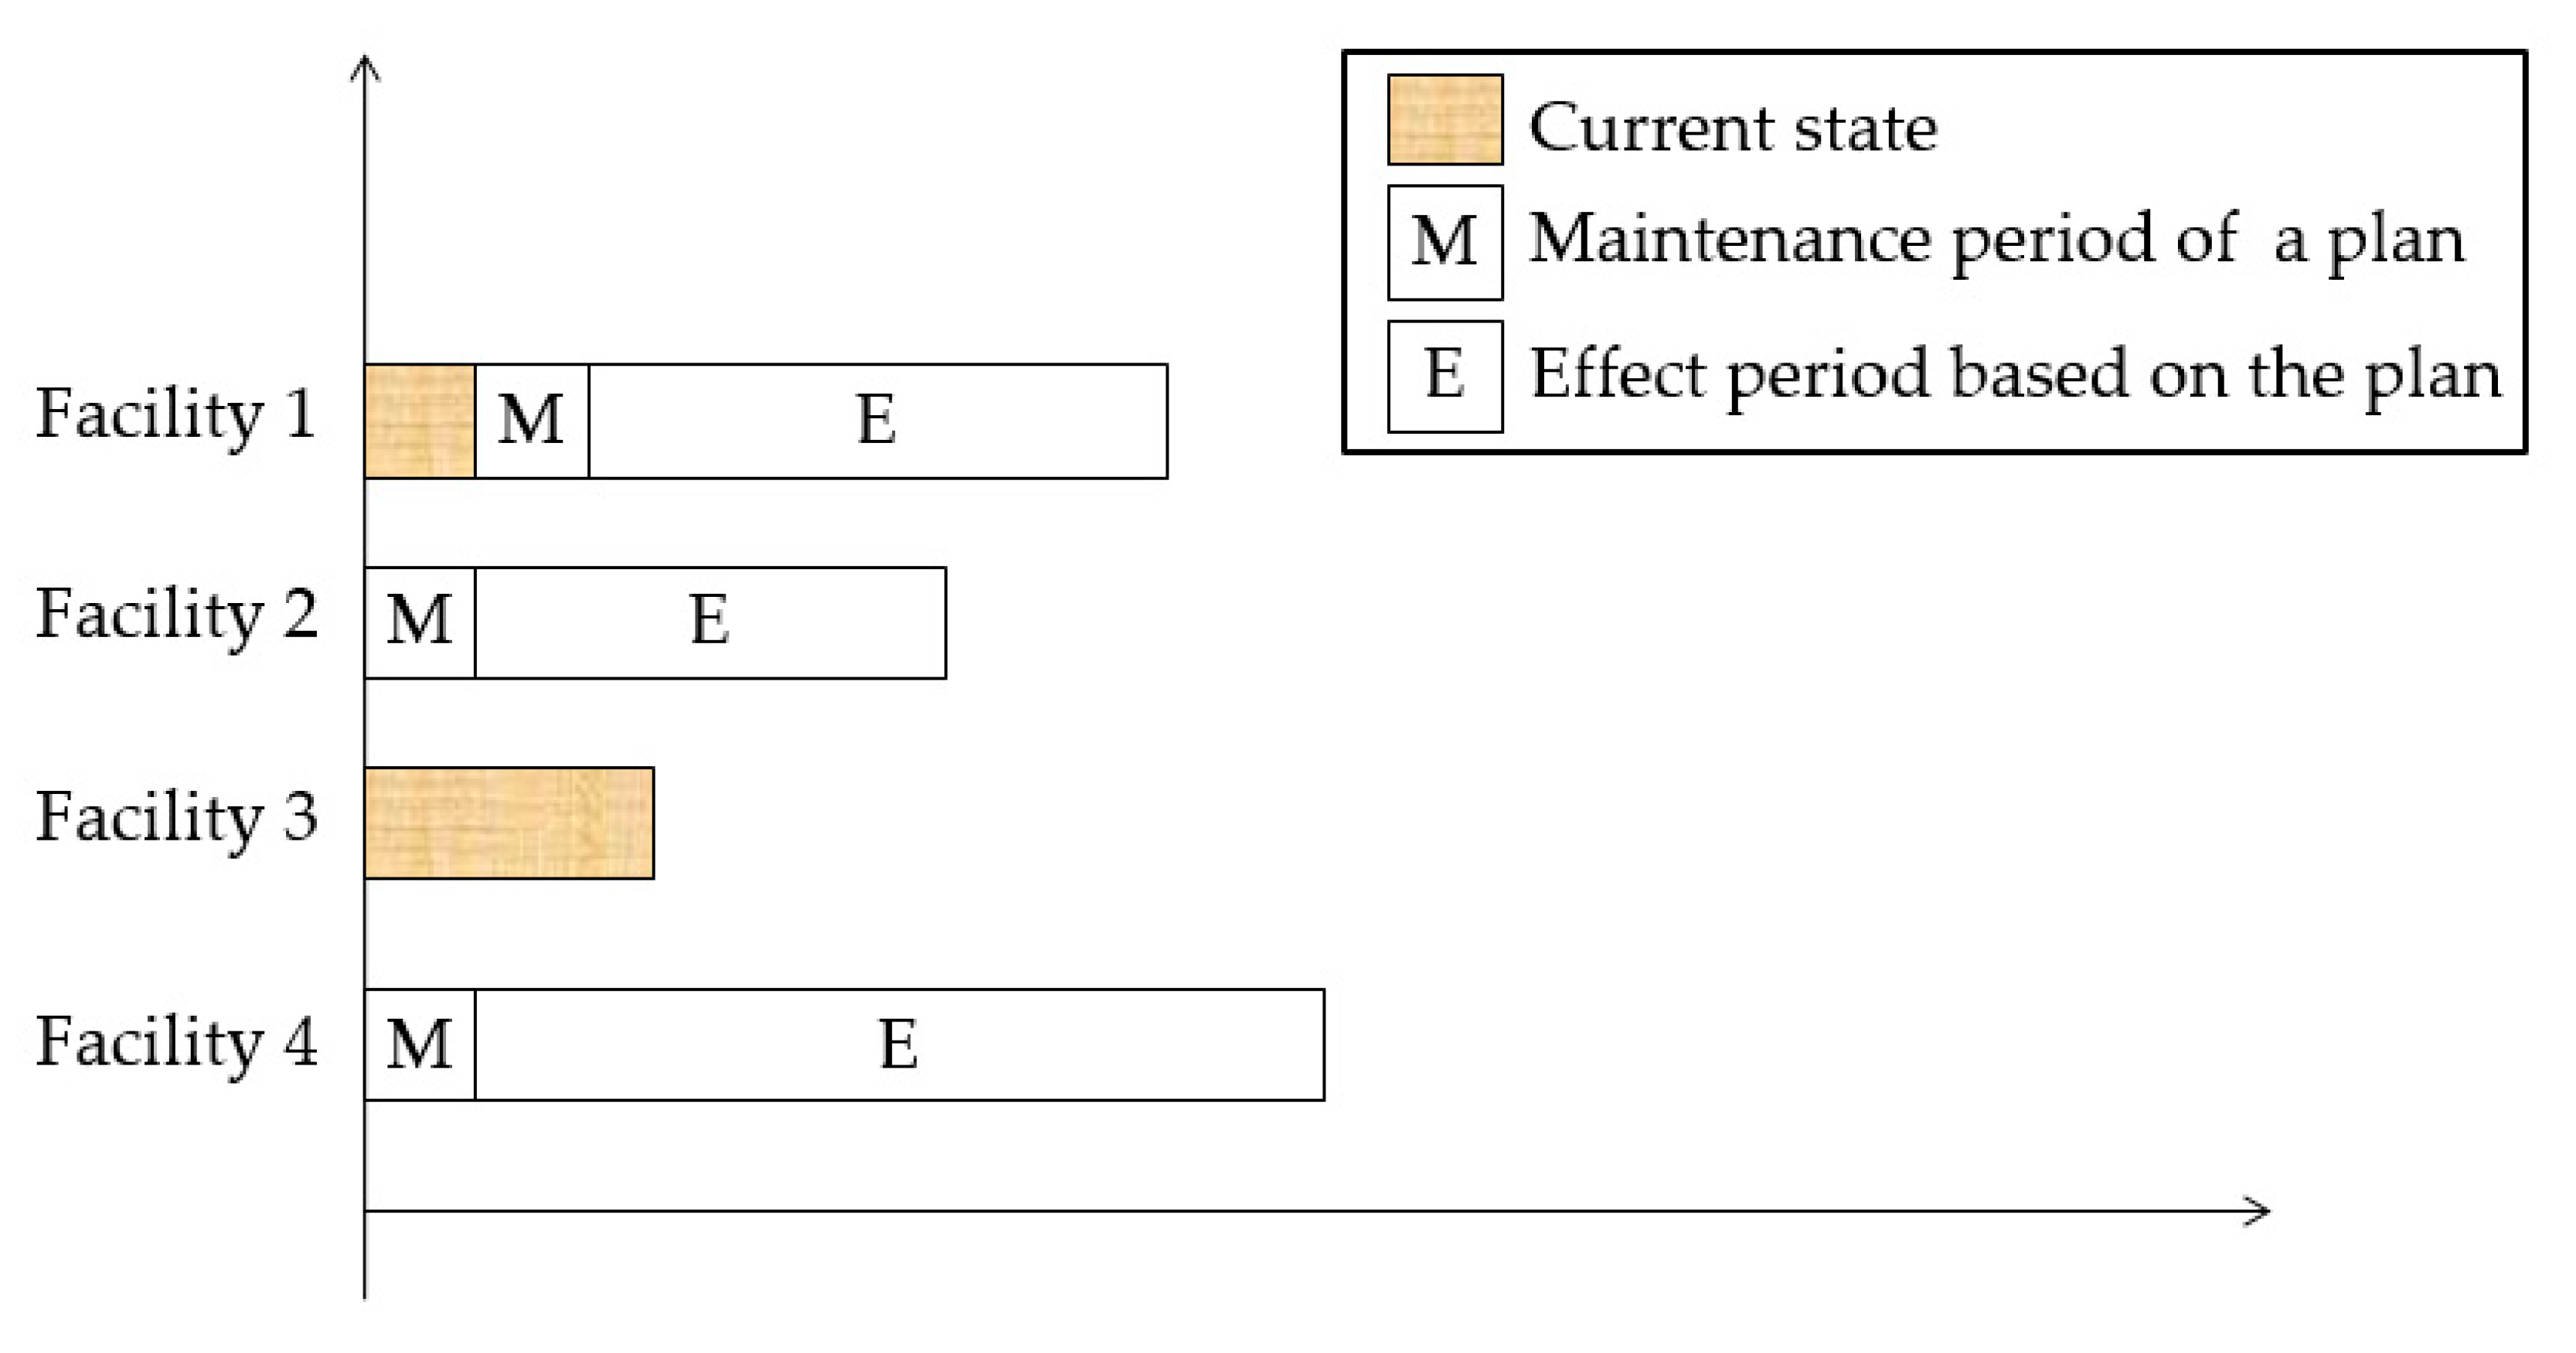
Figure 6 shows a possible result computed by Model-I. Supposing there are 4 facilities and 3 plans, Model-I conducts the arrangement of maintenance plans for each facility from the life cycle perspective under a given planning time. After the actual budget is approved and issued for the specified year, the model is re-evaluated, and accordingly, bridge maintenance works are carried out using Model-II. Finally, adjustments are made according to the actual situation, such as modifications to the importance of the remaining bridges to be maintained, and the updated data are entered into the life cycle assessment model to re-evaluate and minimize the impact of the budget gap on the overall life cycle of the bridges.
Figure 7 displays a possible result solved by Model-II. In
Figure 7, facility 1 and 3 have a year remaining of their effect periods and so an early maintenance event may occur within the period. However, facilities at the end of the effect period (i.e., facilities 2 and 4) require maintenance.
4.1. Model-I: Life Cycle Lifespan Evaluation Model
All model parameters and variables are shown in
Table 4. To solve the long-term maintenance budget allocation problem, Model-I maximizes the functional periods of all bridges from the perspective of life cycle under a given planning time. Therefore, through the concept of limited resource scheduling, the related constraints are described as follows:
Formula (1) indicates the starting time at which any plan enters the effect period upon maintenance completion, thus ensuring the above definition that a plan must consist of two periods, i.e., the maintenance and effect periods.
Formula (2) indicates that the starting time of the next plan is equal to the end of the defined service life of the previous plan, thus confirming that the plans need to be continuous and uninterrupted in the time series.
Formula (3) ensures the solution meets the defined considered years.
Formula (4) indicates that the effect period for a bridge is defined after the selection of the current and subsequent operation plans.
DCijpm is the influence parameter and its values are shown in
Table 3.
Formula (5) indicates that when a plan
p is selected, its maintenance period and service life are also defined.
Formula (6) sets the upper limit of resource usage. The resources here, refer to bridges, so that each facility in use (i.e., a facility undergoing a maintenance plan) cannot be used by another plan. This ensures that the plans will not be repeated at the same time.
Formula (7) indicates that the start time for the current maintenance activity must be 0, regardless of whether the plan is implemented in the maintenance period or in the effect period, the current operation must be controlled at the onset of the planning period. If the bridge is being constructed using a maintenance plan, the model will enter the maintenance period of the plan. If the plan has been implemented and is in the effect period, the maintenance duration is 0 and the remaining effect period is entered.
Formula (8) ensures that the end of the maintenance periods of all bridges equals to the beginning of their effect periods.
Formula (9) indicates the end time of the current effect period, which is equal to the start time of the first plan.
Formula (10) indicates that the current maintenance period parameter
pbdij in the model is entered as the input into the current maintenance period variable
PBDij. Its value is more than 0 during maintenance, and 0 after maintenance.
The remaining effect period of the current operation must also be entered as the input parameter into the model. Formula (11) indicates that the remaining time parameter
pmdij in the model is entered as the input into the current remaining effect period variable
PMDij. However, since the remaining effect period may vary due to the selection of subsequent plans,
PMDij is less than or equal to
pmdijAs mentioned above, the current remaining effect period will also vary depending on the choice of subsequent plans. Formula (12) indicates that when the current usage plan and the subsequently selected plan are determined, the current remaining effect period variable PMDij will be deducted according to the value determined by the plan maintenance impact variable DCijpm, to obtain the final current remaining effect period.
The objective function is shown in Formula (13). According to the actual demand, the budget ceiling for the whole plan cycle is not considered. The objective function is “to maximize the operating time under the condition that all facilities must be in their effect period throughout the plan cycle”. In addition, the importance of maintenance for the different facilities is determined by a weight,
wi, that represents the relative importance of each bridge, which can be appropriately set by the managing personnel. The larger the
wi value, the more important the bridge.
4.2. Model-II: Annual Budget Allocation Model
In response to the practical situation in which the maintenance budget has been cut and re-planning is required, this study proposes Model-II, i.e., an annual budget allocation model. The related constraint equation of Model-II is described as follows:
Formula (14) first ensures that the two periods of an operation, i.e., maintenance and effect periods, are continuous.
Formula (15) sets the maintenance period of the operation and its starting time as 0.
Formula (16) indicates that when a facility is maintained, the maintenance time and maintenance budget will be brought into the model calculation.
BURijp = 1 indicates that the facility resources are being used.
Formula (17) also indicates that if a certain part of a bridge has been determined to be maintained according to a certain maintenance plan, then the corresponding maintenance period, cost, and resources required for the maintenance plan to keep the facility in effect are also determined.
Formulas (18) and (19) indicate that if the maintenance plan has not occurred, the cost, maintenance period, and resource usage during the maintenance and effect periods will not occur. The function of these constraint equations is that when the budget is insufficient or if the bridge requiring maintenance cannot be maintained, the corresponding parameter values will not be included into the variables.
According to the resource constraints, the total amount of facility resources for the maintenance operation in formula (20) cannot exceed the upper limit of the original facility resources.
Similarly, Formula (21) indicates that the total amount of facility resources for all operations, to keep the facility in the effect period, cannot exceed the upper limit of the original facility resources.
Formula (22) indicates that the sum of the costs spent in all the maintenance and effect periods cannot exceed the budget ceiling for that year u.
Under the condition that only a single year is considered, the objective function is shown in (23). In response to possible budget shortfall, the objective formula adds the variable
MURijp, which reflects whether facility resources are being used. If maintenance occurs, then its value is 1, otherwise it is 0. The usage time of the facility is added up and maximized.
5. Case Study
The two-stage model proposed in this study is illustrated and verified by the following case study. The data for this case study were provided by the Dounan Maintenance Division of the Fifth District Maintenance Agency of the Directorate General of Highways, Ministry of Transportation and Communications, Taiwan. The actual maintenance information of the maintenance division, such as the number of bridges, cost, and maintenance period, was obtained through expert interviews. However, the maintenance information of some bridges was not completely preserved. Therefore, some parameters, such as the effect period, were based on the data provided by the maintenance unit, and reasonable assumptions were made.
Table 5 shows the current situations of the eight bridges maintained by the unit. As shown in
Table 5, this study considers the superstructure and substructure of each bridge separately. For example, the superstructure of facility one has been maintained according to plan two, and the maintenance has been completed, with a remaining effect period of 4 years.
The maintenance unit is responsible for maintenance plans for a total of eight bridges under its jurisdiction in the next year. In this case, the planning period is set to 50 years. First,
Table 6 illustrates the importance setting of the eight bridges. The larger the number, the more important the bridge.
5.1. Validation of Model-I: Life Cycle Lifespan Evaluation Model
Different maintenance techniques are sued for the eight bridges and they are divided into the categories: superstructures and substructures; therefore, their costs and maintenance periods are not the same.
Table 7 shows the maintenance cost, maintenance period, and cost for keeping the effect period of the three maintenance plans for each bridge.
The influence matrix of plan selection for the bridges is shown in
Table 8, which shows the influence of the selection of the predecessor and successor plans on the reduction in the effect period.
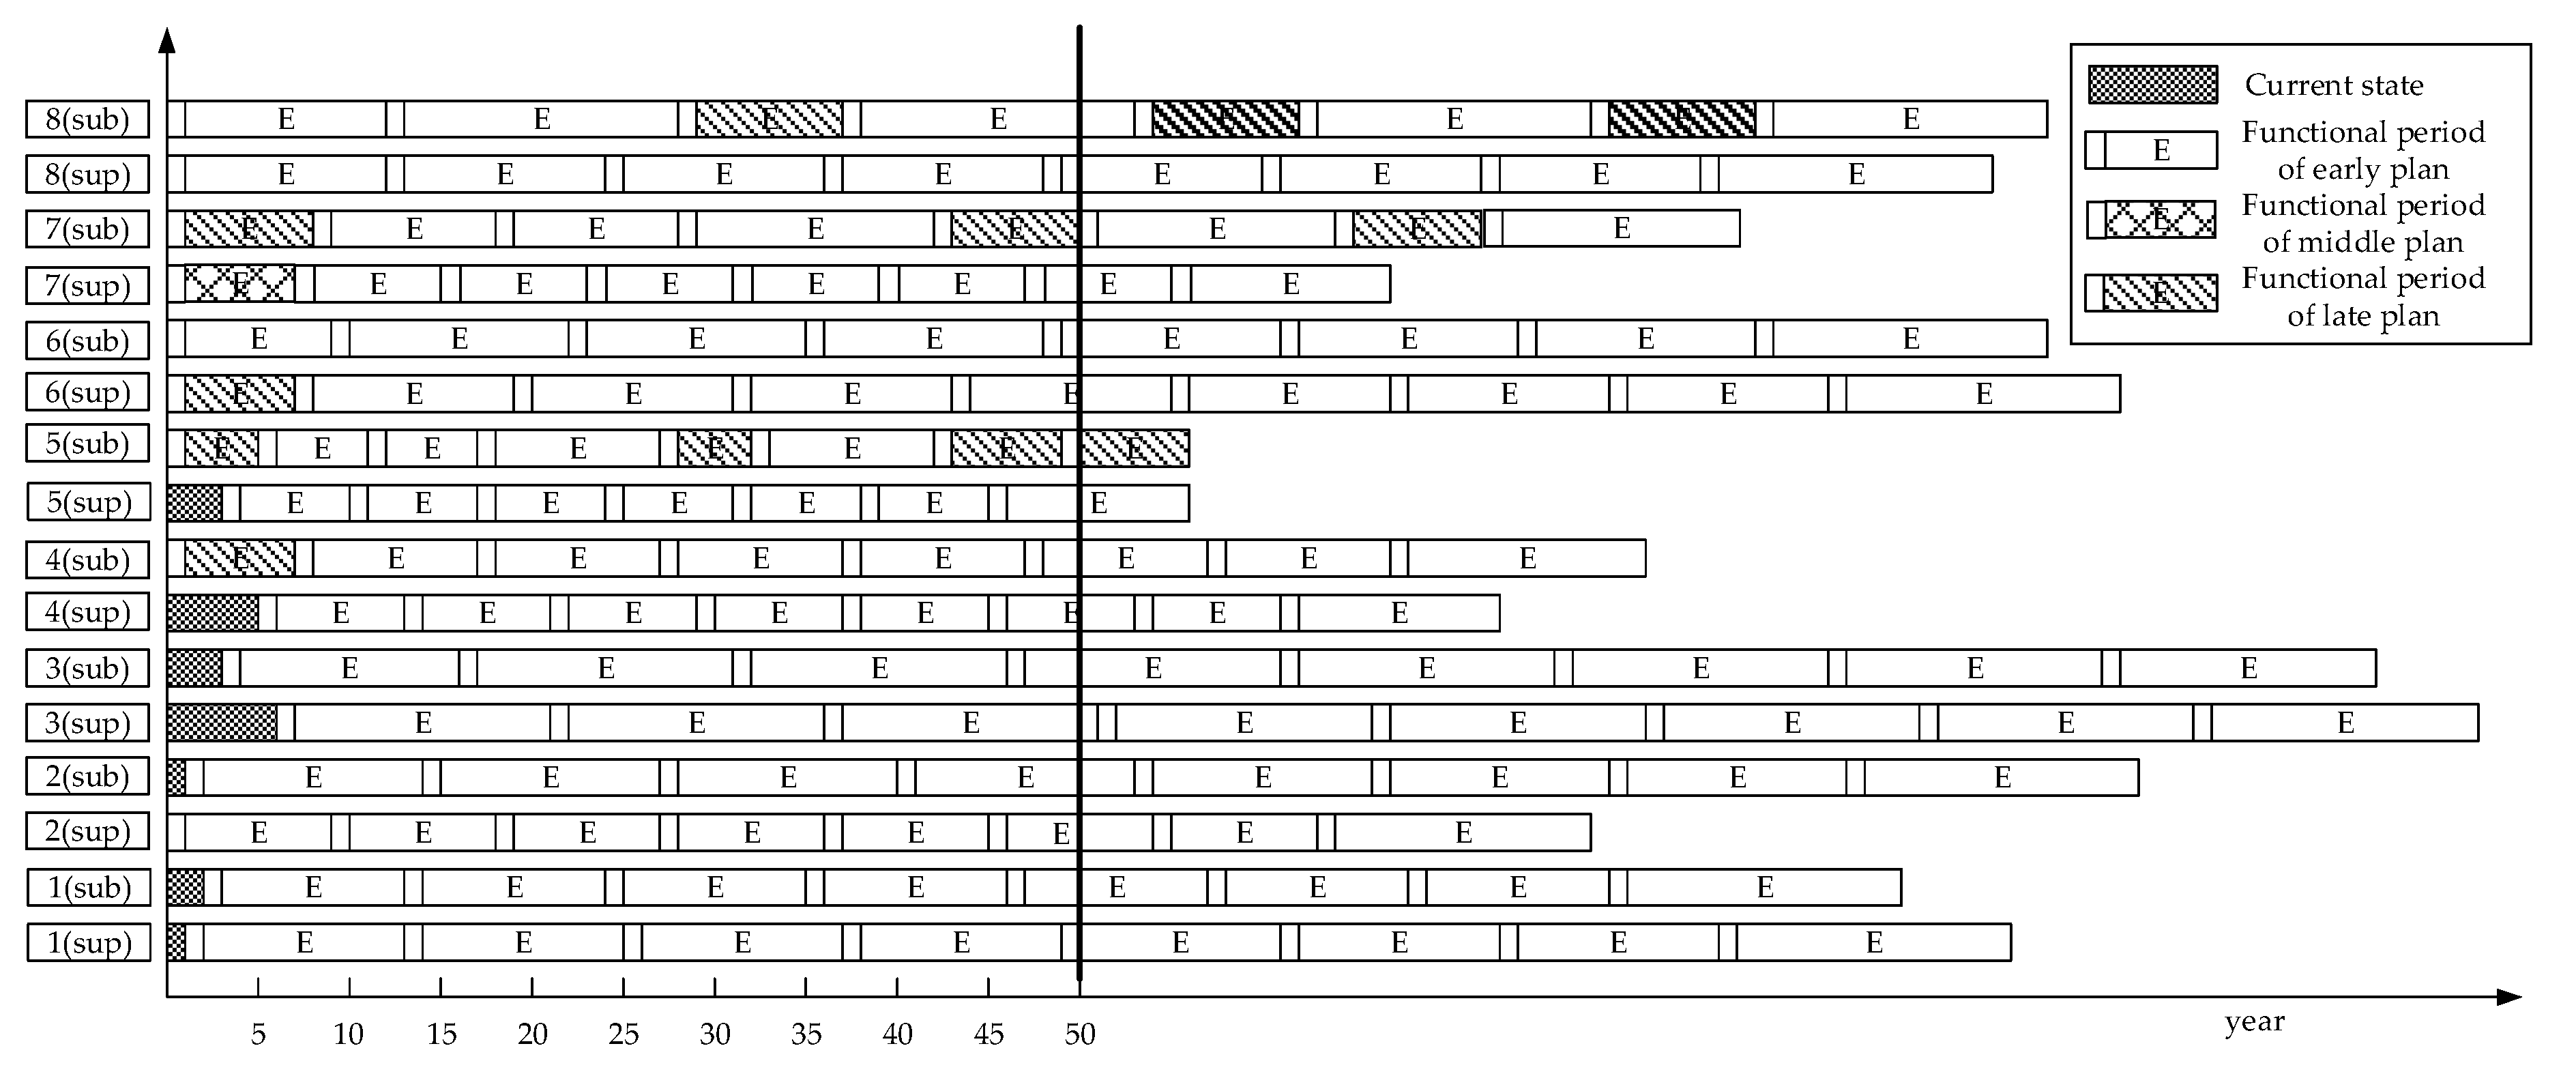
First, according to the requirements for budget planning outlined by subordinate agencies, the results shown in
Table 9 and
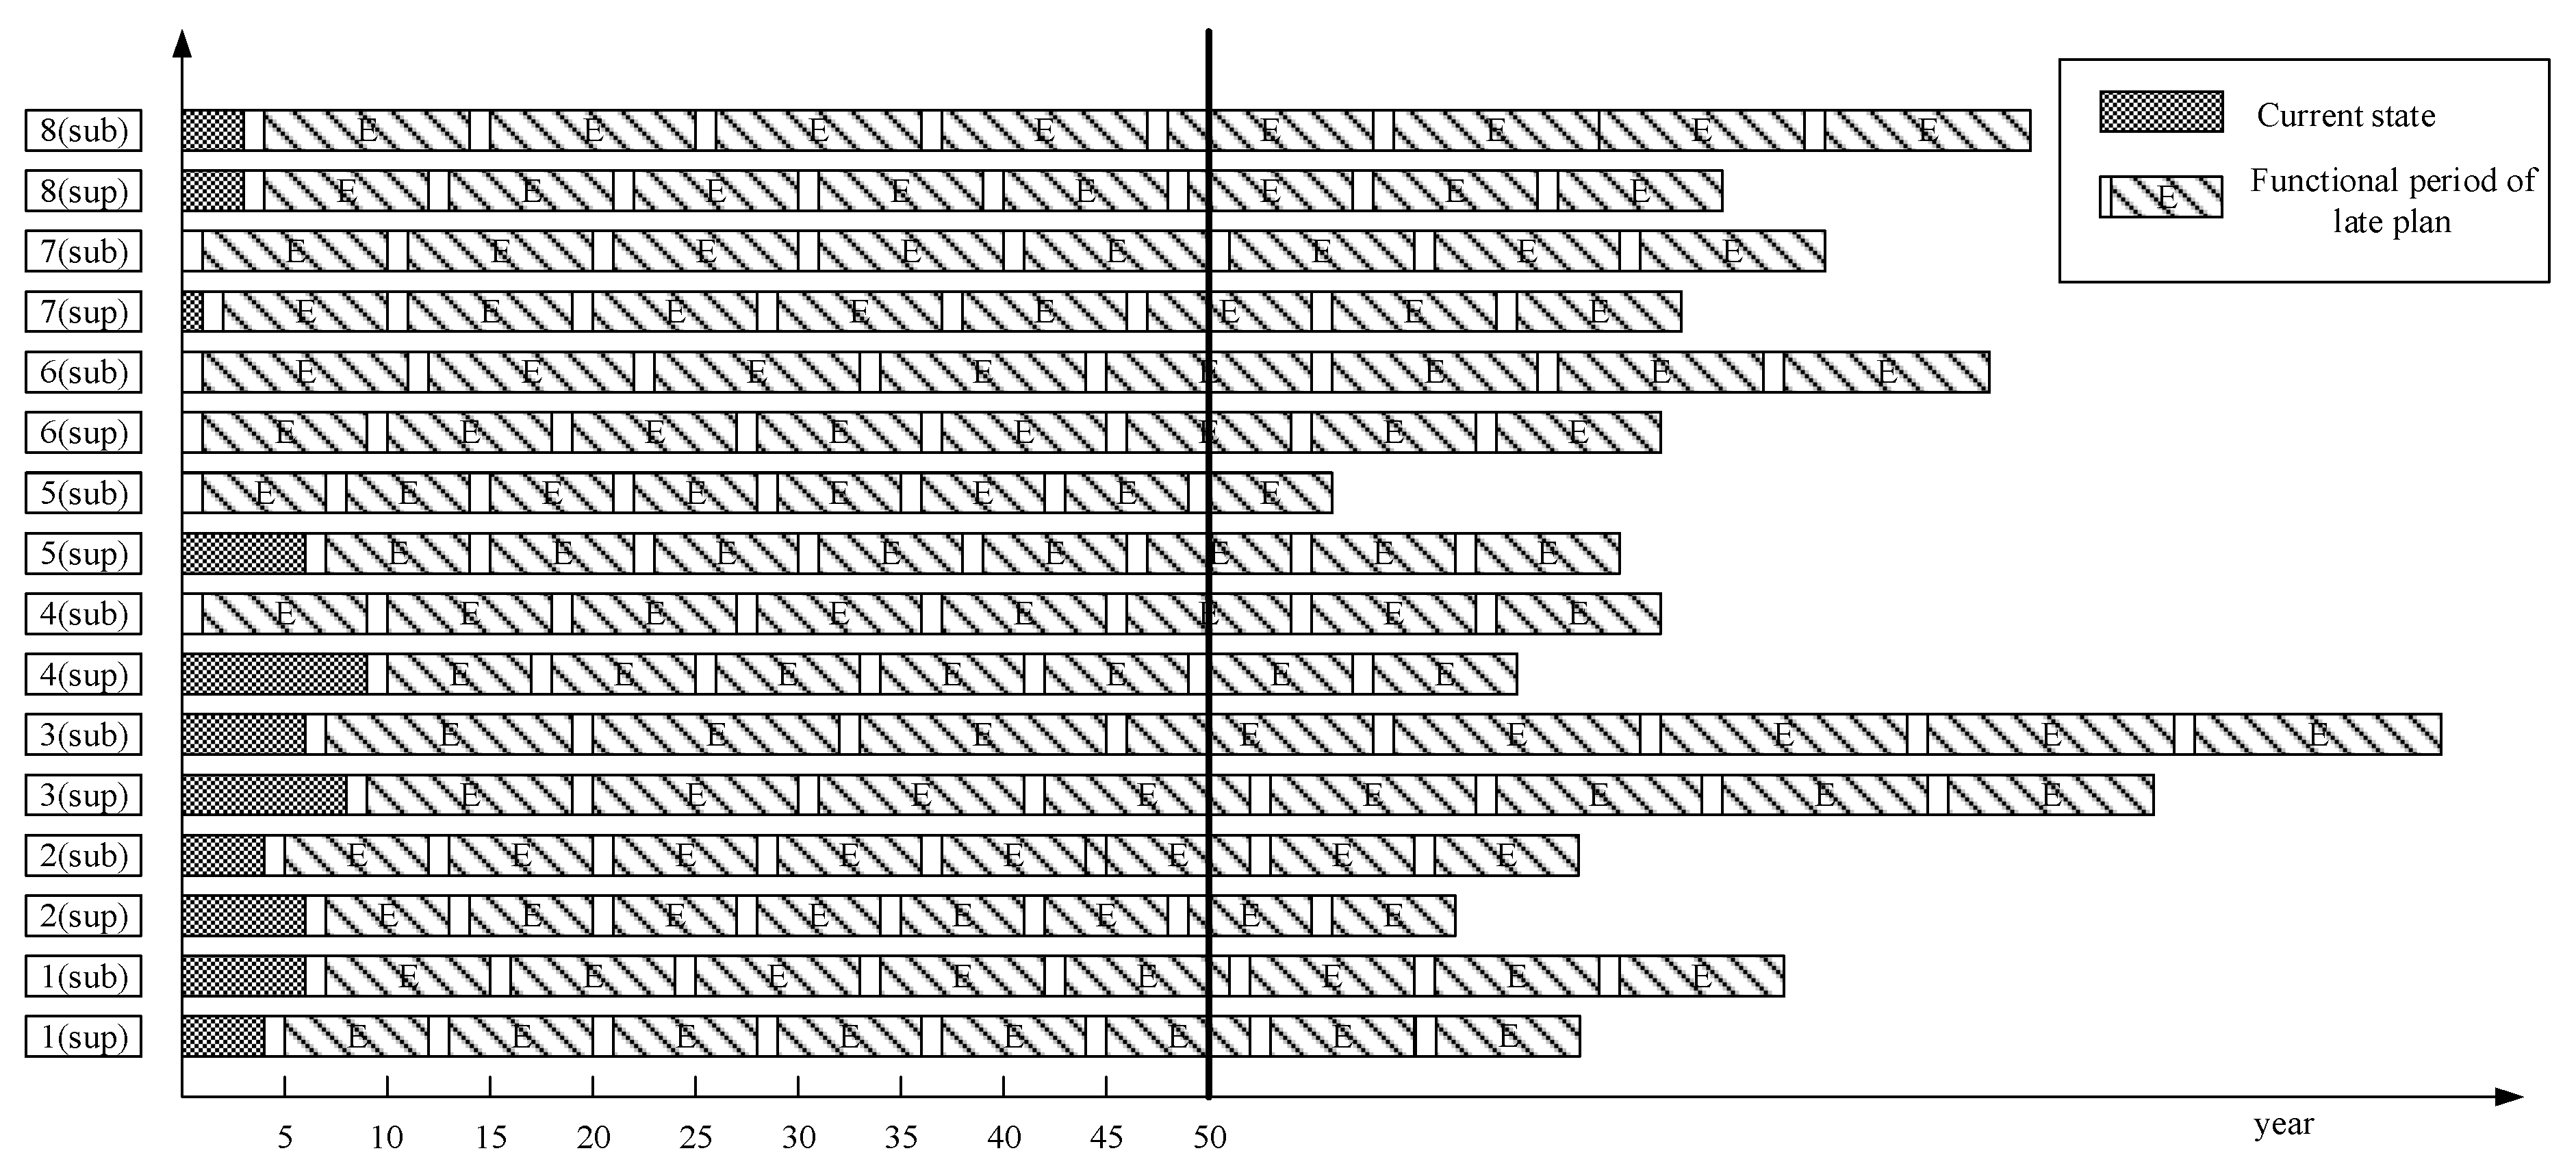
Figure 8 are obtained via calculations using Model-I. The content value is the selected plan. To make all facilities reach the plan cycle of 50 years, at most, eight rounds of maintenance are required. By comparing the optimized result of Model-I (
Figure 8) with the simulation result of the practical maintenance decisions (
Figure 9)—which are defined by the planner’s experience (human-made maintenance decisions usually happen when the facility’s condition is close to the minimal acceptable level)—it can be seen that the number of maintenance plans is more than that stated by the result of Model-I in the planning period. This means that the government is required to provide the funds for the increased maintenance cost. Moreover, there is no solution when the maintenance budget falls short, other than to take the required money out of another budget instead. Therefore, Model-I not only provides an economical solution but also a flexible way to face the real situation.
Therefore, the effect period obtained by the selection of each plan from Model-I can be organized as shown in
Table 10.
When the budget is abundant, the most common choice of maintenance plan for bridges will be plan one (early maintenance), as this has the greatest benefit, i.e., the plan with the highest number of effect years, and will repeat it until the end of the plan cycle. In the results of Model-I, most bridges repeat the same plan until the end of the plan cycle, except for the first cycle. Such results show that, at the beginning of the plan cycle, because of the influence of the current situation data, Model-I will first choose the best plan to suit the current situation to obtain the maximum overall benefit. In addition, by comparing
Table 9 with
Table 10, it can be found that for the last cycle of the majority of bridges in the model, even if the same plan is selected, the maintenance period may be still different because all other cycles—except the last cycle—have subsequent operations. If there are no subsequent operations, then the effect period will not be reduced, owing to the selection of the subsequent plans. From
Table 9, it can be observed that the selection of plans for some facilities is constantly changing, except at the initial stage of the plan cycle. There are several possible reasons for this situation. First, taking the substructure of bridge eight as an example, after selecting maintenance plan one at the initial stage of the plan cycle, although the plans selected in the subsequent maintenance cycles have changed, regularity can be seen, proving that in addition to the maximum benefits obtained by single plan selection, the combination of plans may also create greater benefits. Another possible reason is that, like the substructures of bridge five and bridge seven in their respective life cycles, they seem to change maintenance plans irregularly and continuously, which means that when calculating different plan combinations, Model-I may have some combinations with the same sum, but they can all be selected; therefore, irregular plan combinations may occur.
5.2. Validation of Model-II: Annual Budget Allocation Model
From the results of Model-I, the budget value required for the first year can be calculated, totaling NTD 12.6 million (USD 420 thousand), as shown in
Table 11 below. Letter M stands for maintenance and E for effect period:
Assuming that the actual budget is approved, and the amount of the actual budget is reduced to NTD 10 million, then the calculation results for Model-II will be the same as those shown in
Table 12:
It can be seen from the comparison between
Table 11 and
Table 12, that the lack of an actual budget has caused some facilities to be unable to carry out maintenance work, as calculated using Model-I. Different maintenance plans have been chosen for a total of four facilities, two sup, seven sup, and eight sub, which should undergo maintenance. However, maintenance could not be carried out as scheduled due to an insufficient budget. Taking two sup as an example, the calculation results of Model-II show that the facility will continue to be used for 6 years before maintenance in plan three is carried out, and the effect period will be 6 years.
It is assumed in the study that all bridges are not allowed to be in an unusable state. Thus, when the annual maintenance budget is insufficient for the facilities to be maintained as originally planned, the maintenance will have to be delayed. If the budget for the next year is again insufficient, the calculation using Model-II will be carried out again, and those that cannot be maintained will also be delayed. When the maintenance cannot be delayed any more in a certain year, the model will have no solution. The failure to obtain a solution is not an optimization failure but reflects that the annual budget must be higher than a certain value so that all facilities can be maintained. The next section will analyze such a situation.
5.3. Sensitivity Analysis for Budget Limitation in Model-II
To analyze the influence of the budget ceiling on the scheduling results in the budget evaluation model, this section conducts a sensitivity analysis on the budget ceiling for this case study. First, the budget is fine-tuned from NTD 12.6 million (USD 420 thousand) to NTD 12.59 million (USD 419.67 thousand), with the results shown in
Table 13 and
Table 14.
The slight reduction in the budget can still keep all the facilities in working condition during the plan cycle. However, the superstructure of bridge eight cannot undergo maintenance operation in the first year due to the insufficient annual budget; thus, maintenance will have to be postponed. The new result is to change the plan selection to the middle plan and act during the third year, as shown in
Table 13 and
Table 14.
From
Table 15, when the budget ceiling is gradually adjusted to NTD 11.6 million (USD 386.670), maintenance for the superstructure of bridge eight will have to be postponed due to the gradual reduction in the budget. The plan changes to the middle plan in the first plan period there is a delay of 2 years.
Continuously, when the budget ceiling is down to NTD 10.61 million (USD 353,670), the superstructure of bridge seven must be postponed.
Until the budget ceiling is adjusted to NTD 8.55 million (USD 285,000), there is no solution to the model, indicating that the budget value must be at least more than NTD 8.56 million (USD 285,330) if all facilities are to remain in an effect condition.
6. Conclusions
From the perspective of life cycle, bridges require reasonable maintenance plans, which are submitted to the higher authorities for approval. However, it is usually impossible to obtain the full amount of the requested budget; thus, rearrangement of maintenance plans is often required. Due to the cyclic occurrence of such facts, it is important to have an appropriate adjustment mechanism for maintenance scheduling to ensure the long-term safety of bridges. Therefore, this study adopts the concept of resource-constrained scheduling in terms of RCPSP to develop a two-stage optimization model. Model-I evaluates how to keep all facilities in working condition throughout the plan cycle, and maximize the overall lifespan. After the actual annual budget is approved, Model-II will respond to the maintenance plan adjustment due to the difference between the planned and approved budget. Thereafter, new parameters are re-entered for Model-I according to the actual data of current bridge status. Thus, given the strength of the RCPSP framework, the two-stage model can be used repeatedly and alternately, to generate good solutions to address the life cycle maintenance scheduling problems in terms of bridge infrastructures. In practice, it can also provide good flexibility to respond to changes in the status quo and unexpected situations, such as the tremendous decrease in service level as a consequence of natural disasters.
Considering the benefits of in-advance maintenance actions, this study proposes three plans, namely, early, middle, and late maintenance plans, based on the maintenance time point. From the case study analysis, the earlier the maintenance is carried out, the greater the resulting benefits will be, while the benefits of late maintenance will be less. However, choosing the early maintenance plan indicates that more of the effect period time of the preceding plan will be sacrificed, with the opposite being true for the late maintenance plan. Therefore, different combination effects will be produced depending on the different predecessor and successor plans. Such combination effects will influence the overall plan cycle. Furthermore, this study analyzes and verifies the results through case study. The optimization results show that the proposed two-stage model reflects the existing data and provides management personnel with appropriate maintenance plans. It can be concluded that Model-I will adjust the first period plan according to the current situation of the bridges to achieve the maximum benefits. Moreover, it can be observed from the local regulation perspective, in addition to the maximum benefits obtained from the selection of a single plan, that a combination of plans may also create greater benefits. Through parameter refinement of Model-II, the optimized results obtained from Model-II reasonably adjusts the maintenance plan until there is no solution, further providing management personnel with an understanding of the minimum budget requirement for the current year.
Future work can extend current research results to integrate post-disaster emergency repairs, that are excluded from this study, into the Model-II formulation. Such extension in the RCPSP framework will involve the addition of new emergency activities to the current activity network of life cycle maintenance works, with the input of an additional budget and new assessment on the status of damaged bridges. Moreover, the concept of bridge life cycle management in Taiwan’s public sector is still in the preliminary stage, and the historical data for bridge maintenance issues are difficult to collect in a systematic way. Therefore, some crucial data, such as the effect period and years remaining of the effect period, were collected through interviews with experts. Once all the required bridge data, including related environmental factors, can be stored in a centralized database, the automated assessment of important data regarding bridge maintenance then will be realized through a normalized analysis, and proven by scientific measures.
