Abstract
The modeling of the minimum fluidization velocity (U0mf) and the incipient fluidization pressure drop (ΔPmf) is a valuable research topic in the fluidization field. In this paper, first, a series of experiments are carried out by changing the particle size and material mass to explore their effects on U0mf and ΔPmf. Then, an Ergun equation modifying method and the dimensional analysis method are used to obtain the modeling correlations of U0mf and ΔPmf by fitting the experimental data, and the advantages and disadvantages of the two methods are discussed. The experimental results show that U0mf increases significantly with increasing particle size but has little relationship with the material mass; ΔPmf increases significantly with increasing material mass but has little relationship with the particle size. Experiments with small particles show a significant increase at large superficial gas velocity; we propose a conjecture that the particles’ collision with the fluidization chamber’s top surface causes this phenomenon. The fitting accuracy of the modified Ergun equation is lower than that of the dimensionless model. When using the Ergun equation modifying method, it is deduced that the gas drag force is approximately 0.8995 times the material total weight at the incipient fluidized state.
1. Introduction
In the pharmaceutical industry, conical fluidized beds are more widely used than cylindrical fluidized beds because the former have certain advantages [1,2,3]. First, the particle size distribution can be broad in a granulation/coating process in the pharmaceutical industry. Due to the axial velocity gradient of a conical cylinder, larger particles can be fluidized at the lower layer, while smaller particles can stay at the upper layer without being carried out. Second, the fluidized state of a conical fluidized bed is smoother than that of a cylindrical fluidized bed because the upper layer of the conical cylinder is more extensive and can hold more gas to avoid the slug phenomenon [4]. Except for the unusual shape of the fluidization chamber, most pharmaceutical fluidized beds are negative pressure fluidized beds since the gas-driven equipment (usually a high-pressure fan) is placed at the outlet of the gas path, which is different from the fluidized beds used in other fields. The reason for this design is that if there is leakage, a negative pressure vessel is safer than a positive pressure vessel, and the material does not scatter everywhere, which would cause contamination.
The gas pressure is one of the essential monitored parameters in a fluidized bed [5]. Through analysis of the gas pressure signal, workers can know whether the fluidized bed is in a normal working state. The gas pressure drop (ΔP) between the surface and the bottom of the material is always used to determine the flow regimes. When the superficial gas velocity (U0) is low (the subscript “0” in this paper refers to the bottom section of the conical cylinder), the bed is in a static state, and ΔP increases with an increase in U0; when U0 reaches a certain velocity, ΔP stops increasing and maintains a relatively stable value. This stable value is called the incipient fluidization pressure drop (ΔPmf) [6], and the corresponding U0 at this point is called the minimum fluidization velocity (U0mf). U0mf and ΔPmf are of great importance in fluidized bed operation, and many factors affect these two values, among which particle size and material mass are fundamental and essential factors.
Because the experimental methods to obtain U0mf and ΔPmf under specified operating conditions are time-consuming and laborious, many scholars have tried to obtain modeling correlations suitable for general or specific working conditions [7]. In recent years, the proposed modeling correlations can be divided into two categories [8]: one is based on modifying the Ergun equation, and the other is based on dimensional analysis. The Ergun equation was proposed by Sabri Ergun in 1952 [9] to calculate the pressure drop when a gas flows through a packed material [10], and the specific equation is as follows:
The Ergun equation has high accuracy due to the introduction of parameters such as particle size, particle sphericity, and voidage, so it has been widely accepted and verified. In this equation, C1 is the coefficient of the viscosity term, and C2 is the coefficient of the inertial term. For the original Ergun equation, C1 = 150 and C2 = 1.75. Both C1 and C2 are empirical values, and many factors, such as equipment size/shape, the friction coefficient, and particle size distribution, may lead to inaccurate prediction results [11]. In 1966, Wen and Yu [12] proposed an empirical model based on the Ergun equation and fitting the experimental data, the specific correlation of which was:
In 1982, Grace J.R. [13] argued that replacing the number 33.7 with 27.2 in Equation (2) is most suitable for the gas-solid system. Gibson I.A. [14] et al. also did an in-depth discussion of Wen and Yu’s equation.
For a conical fluidized bed, the original Ergun equation cannot be directly used because of the gas velocity gradient in the axial direction, which makes the pressure drop rate vary in the axial direction. To solve this problem, Peng and Fan [15] developed a model to calculate ΔP of a conical liquid–solid fluidized bed by integrating the pressure drop rates of different layers. Jing et al. [16,17] proposed a correlation based on the Ergun equation to calculate U0mf and ΔPmf of a conical fluidized bed using a mathematical processing method similar to Peng and Fan’s model. Rachadaporn Kaewklum et al. [18] used Peng and Fan’s model to predict U0mf and ΔPmf for air–sand conical beds, and the effects of the sand particle size, cone angle, and static bed height on the flow behavior were discussed. Andrei Koekemoer et al. [19] put forward a method of modifying the coefficients C1/C2 in Equation (1) to increase the prediction accuracy, which is adopted and improved in this paper. In this study, we use regression analysis to try to obtain a better combination of C1 and C2 that is more suitable for the working conditions of this study.
Dimensional analysis is a widely used modeling method that only pays attention to the mathematical relationships between independent variables and dependent variables while ignoring the physical laws between physical parameters. A dimensionless model has a unified and straightforward equation form that is composed of a series of dimensionless groups. The general equation form is as follows:
where π0, π1, …, πn are all dimensionless groups and P1, P2, …, Pn are the exponents of these dimensionless groups. Since the dimension of a dimensionless group is 1, no matter what the exponents are, the equation can satisfy the principle of dimensional harmony. The main difficulty of this method is determining the dimensionless groups, which requires knowing which factors affect the dependent variables. The value of each component can be determined by linear regression or nonlinear regression of the experimental data. Based on selecting appropriate dimensionless groups, a dimensionless model generally achieves higher accuracy under specific working conditions.
Sau et al. [20,21,22] used the dimensional analysis method to develop modeling correlations for U0mf, ΔPmf, and the bed expansion ratio of conical beds for different kinds of fluidization materials. Khani [23] proposed a dimensionless model using the term cos(α) instead of sin(α) compared with Sau’s model [20], considering that sin(α) approaches zero for mini-tapered beds, which may lead to an incorrect prediction result. Mojtaba Rasteh et al. [24] thoroughly considered the effect of PSD (particle size distribution) on U0mf and proposed different correlations for different PSDs (Gaussian/flat/binary). Because the dimensional analysis method has strong applicability, it has been used by many scholars to derive modeling correlations in the field of fluidized bed [25,26,27,28,29,30,31]. Some of the correlations proposed by other scholars are listed in Table 1.

Table 1.
Correlations proposed by other scholars for predicting U0mf and ΔPmf.
However, in the literature related to the modeling of U0mf and ΔPmf, most of the research equipment that was used was positive pressure cylindrical fluidized beds. Due to the differences in the gas path structure and the fluidization chamber shape, the previous research results cannot be directly applied to negative pressure conical fluidized beds. In addition, both the method based on modifying the Ergun equation and the method based on dimensional modeling have characteristics, advantages, and disadvantages, while few studies have compared these two methods. Based on these problems, we have carried out this study. The innovations of this study lie in the following: (a) the flow behaviors of the negative pressure conical fluidized bed are studied, (b) the Ergun equation modifying method and the dimensional analysis method are both used and compared, and (c) this study proposes the inference that the total gas drag force is 0.8995 times the particles’ gravity in the initial stage of fluidization. In this study, first, a series of experiments are carried out, and U0mf and ΔPmf are obtained as experimental empirical data; the effects of material mass and particle size on U0mf and ΔPmf are discussed. Second, we separately use the above two methods to fit the empirical data and derive models of U0mf and ΔPmf; by using these modeling correlations, workers can quickly determine U0mf and ΔPmf based on some variables, and then determine the production parameters. Finally, the prediction ability of the proposed correlations and the characteristics of the two modeling methods are discussed, which can be used as a reference for selecting an appropriate method in practical application.
2. Experimental Section
2.1. Experimental Equipment
As shown in Figure 1, in this study, a pharmaceutical granulation/drying fluidized bed (FBL-10, Xiaolun Pharmaceutical Machinery, Wenzhou, China) was used, which was a negative pressure conical fluidized bed. The conical cylinder was detachable with a bottom diameter of 180 mm and a top diameter of 300 mm, and the cross-sectional area was round; the conical angle α = 8.88°. There was a distribution plate made of stainless steel with a thickness of 3 mm for supporting materials and ventilation. The holes on the distribution plate were arranged in a square array mode, the diameter of each hole was 1.6 mm, and the total number of holes was 1617, so the overall opening ratio was 12.78%. A double-layer fine screen covered the distribution plate to prevent fine materials from falling through the holes and to force the airflow to be uniformly distributed. A high-pressure fan (2RB-730N-7AH26, Gzling Mechanical & Electrical Equipment, Wuxi, China) was placed at the outlet of the gas path, so the pressure in the fluidization chamber was negative with respect to the ambient pressure. The high-pressure fan had a rated power of 3 kW and could generate a maximum negative pressure of −22 kPa. The power of the fan was controlled by a frequency converter (ATV310HU30N4, Schneider Electric SA, Paris, France); thus, the gas velocity could be changed. The control range of the fan power was 1–100%, and the minimum control interval was 1%. The ambient pressure was standard atmospheric pressure, the air humidity was controlled by a humidity controller (MDH-40Y, Senjing Motor Manufacturing, Hangzhou, China) to 50–60%, and the ambient temperature was controlled via air conditioning to 25 °C ± 1 °C.
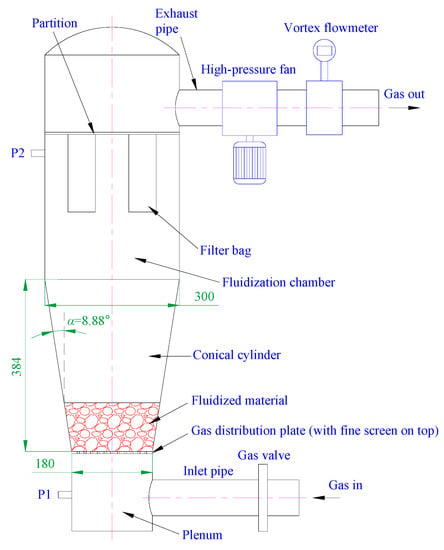
Figure 1.
Schematic diagram of the experimental equipment.
A vortex flowmeter (DN100, Meikong Automation Technology, Hangzhou, China) was connected in series at the exhaust pipe to measure the flowrate with an accuracy of 1%. Two air pressure measurement ports were set in the center of the plenum and the front of the filter bag, named P1 and P2, respectively. Two identical high-precision air pressure sensors were connected to the measurement ports, and the measurement range was −10 kPa–10 kPa with an accuracy of 0.5%. The pressure sensors’ signals were sampled by a high-speed data acquisition card (USB-6009, National Instruments, Austin, TX, USA) with a sampling frequency of 40 Hz. The pressure transfer hose (not shown in Figure 1) had a length of 100 mm and an inner diameter of 4 mm, so the transmission time delay of the pressure fluctuations in the hose could be ignored [32].
Micro glass beads were used as fluidized materials in this study, which are nonporous particles. The true density of these particles was 2409 ± 8.8 kg/m3, measured by the drainage method. Using different screen combinations, we screened out a total of 5 kinds of materials with different particle sizes, which were numbered #1, #2, #3, #4, and #5. The average diameter (randomly measuring the diameters of 50 particles and taking the average) and sphericity (replaced by the circularity of the projection photo) of each kind of particle were determined by a digital microscope (GP-660V, Gaopin Precision Instruments, Shanghai, China), and the natural bulk voidage of each kind of particle was measured by a bulk density meter (XF-16913, LICHEN-BX Instrument Technology, Shanghai, China), as shown in Table 2. Since the screen size range of each kind of particles was relatively narrow, the particle distributions of all kinds of particles were considered a typical narrow distribution. The microscopic photograph of the experimental particles is shown in Figure 2, and the bright spots on the particles in the photograph are caused by the microscope’s illumination light.

Table 2.
Physical properties of materials and Geldart particle type.
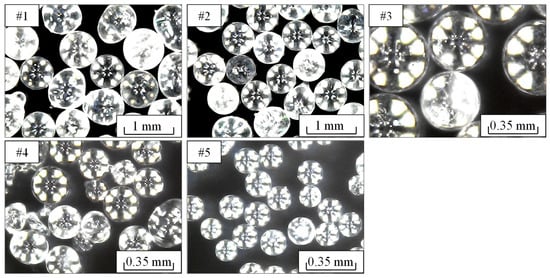
Figure 2.
Microscopic photograph of experimental particles.
According to the Geldart classification method [33], #1 was class D particles, and #2–#5 were class B particles, where #2 was very close to the BD boundary. According to common knowledge in the field of fluidization, the main characteristic of class B and D particles is that there is no obvious expansion before the fluidization occurs. Additionally, the minimum bubbling velocity and the minimum fluidization velocity are the same; in other words, there is almost no particulate fluidization process in the fluidized bed.
2.2. Experimental Design and Procedure
Since port P1 is below the distribution plate, the pressure difference between ports P1 and P2 includes the pressure drop caused by the distribution plate. However, ΔP refers to the pressure drop between the top and bottom sections of the material, so it is necessary to obtain the pressure drop caused by the distributor first. For this reason, we first carried out a separate experiment in which there was no material in the fluidized bed, and the number of this experiment was 00.
In this study, a total of 5 kinds of material masses were set to 2/2.5/3/3.5/4 kg. The five kinds of material masses were cross-combined with the five kinds of particle sizes, and therefore, a total of 25 experiments were developed. The experimental numbers are given in Table 3. For example, in experiment 14, #3 particles with a mass of 3.5 kg were used as the experimental material.

Table 3.
Experimental number correspondence table.
The experimental steps of experiments 01–25 were as follows: starting from a fan power opening (called fan opening hereafter) of 70%, decrease the fan opening by 1% each time. After the fluidized state is stable, record the signals (, , ) for 30 s. Repeat the above operations until the fan power reaches 11%. Each experiment was repeated three times, and the most credible set of data was selected as the final data during data screening. To ensure that all experiments were carried out under the same conditions, before each experiment, the distribution plate, double-layer screen, and filter bag were cleaned, and the equipment was prefluidized at 50% fan power for 15 min to keep the material in a dry and loose state. For experiment 00, the fan power stopped at 0%; the rest of the procedure was the same as that in experiments 01–25.
3. Signal Processing Methods
This paper ignores the influence of gas compression and considers the gas flow rate at any cross section of the conical cylinder to be the same. The superficial gas velocity at any section is calculated using the following equations:
where is the average value of the flow rate time-series signal () and Sh is the sectional area of the conical cylinder at the height of h.
The number of the empty bed experiment is 00, and the relationships among the fan opening, U0, and ΔPp are shown in Figure 3. As shown in Figure 3, with an increase in the fan opening, U0 and ΔPp continue to increase.
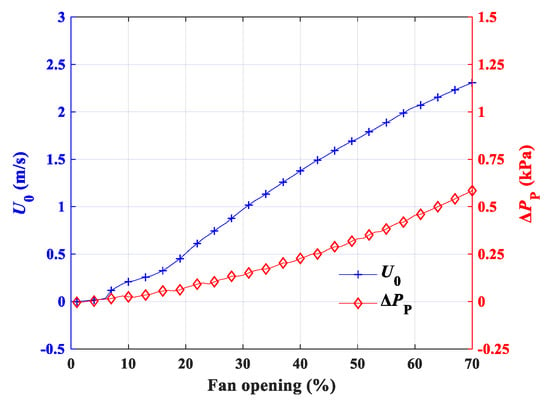
Figure 3.
U0 and ΔPp at different fan openings in the empty bed experiment (number 00).
As shown in Equation (6), by subtracting the average values of and in the empty bed experiment (material mass W = 0), the pressure drop generated by the gas distribution plate (ΔPp) can be calculated. For each fan opening, ΔPp and U0 were recorded so that the mapping relationship between a series of ΔPp and a series of U0 can be established. Therefore, for a given U0, the value of ΔPp can be determined by this mapping relationship. As shown in Equation (7), for experiments 01–25, by subtracting the average values of and and then subtracting ΔPp (under the current U0), ΔP can be obtained.
The intersection method is used to determine U0mf and ΔPmf. The specific determination process is as follows. first determine an inflection point, and from the second point before the inflection point, take as many points as possible near a straight line to fit the first straight line; then, from the second point after the inflection point, take 4–6 continuous points, then plot a horizontal straight line as the second line, whose height is the average of the taken points’ ordinate values; the intersection point of the two straight lines is considered to be the point (U0mf, ΔPmf). Take experiment 06 shown in Figure 4 as an example. The two black lines in Figure 4 are the two straight lines, and U0mf and ΔPmf are the abscissa and ordinate of the intersection point, respectively.
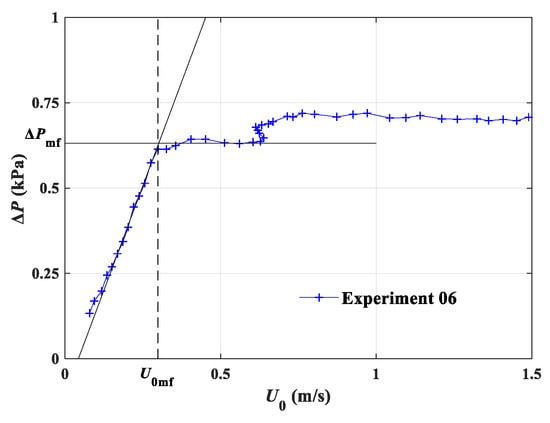
Figure 4.
Schematic diagram of the U0mf and ΔPmf measurement method.
In this paper, the root mean square error (RMSE) and R2 are used to describe the fitting accuracy quantitatively. RMSE means the root mean square error; the smaller the value, the closer the fitting value is to the actual value. R2 is the determination coefficient, and its value is between 0 and 1. The higher the value is, the higher the fitting accuracy.
4. Results and Discussion
4.1. Effects of Material Mass and Particle Size on Flow Behavior
As shown in Figure 5, the 2nd row and 2nd column of the data in Table 3 are taken to display the effect of the material mass and the particle size on the flow behavior, and the experimental numbers are 06/07/08/09/10 and 02/07/12/17/22, respectively. A series of vertical dotted lines on the left side of Figure 5 represent U0mf of each experiment, and their colors and markers are the same as those of the curves of the corresponding experiments.
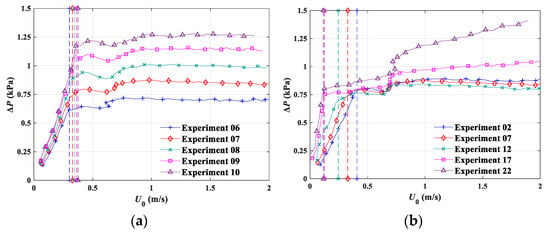
Figure 5.
ΔP at different U0 values of (a) the 2nd row and (b) the 2nd column of experiments in Table 3.
As shown in Figure 5a, when U0 < U0mf, with an increase in U0, ΔP continues to increase linearly; when U0 > U0mf, ΔP stops growing and enters a stable stage. In addition, the higher the material mass, the greater ΔPmf is. The material mass has little effect on U0mf; with an increase in the material mass, U0mf increases slightly. As shown in Figure 5b, when U0 < U0mf, the particles with a larger particle size have a lower growth rate. When U0 > U0mf, the experiments have similar ΔPmf values. When U0 reaches a certain velocity, experiments 17/22 show significant ΔP growth, while the other experiments show little or no increase. We suppose the possible reason is as follows. When the gas velocity is high enough, the fine particles move to the upper part of the fluidized chamber and collide with the top surface. Assuming that all the particles are a whole body, this whole body is now subjected to the downward gravity force and the downward support force exerted by the top surface, so the pressure drop continues to increase because the required gas flow drag force becomes larger. For experiments with larger particle sizes (experiment 02/07/12), the particles cannot be brought high enough to collide with the top surface. Particle size has a significant influence on U0mf; as the particle size increases, U0mf increases significantly.
U0mf and ΔPmf obtained in all experiments are shown in Table 4. 3D views of the particle size and material mass versus U0mf and ΔPmf are plotted to facilitate the observation of the variation regularity in Figure 6.

Table 4.
U0mf and ΔPmf of each experiment.
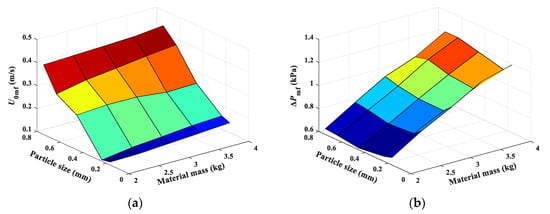
Figure 6.
3D views of the particle size and material mass versus (a) U0mf and (b) ΔPmf.
Table 4 and Figure 6 show that for U0mf, the main influencing factor is the particle size; the larger the particle size, the larger U0mf is. The influence of the material mass is small, and U0mf increases slightly with an increase in the material mass. For ΔPmf, the main influencing factor is the material mass, and ΔPmf is approximately proportional to the material mass. The influence of the particle size is small and complex; for the same material mass, ΔPmf of #1–#4 particles is almost the same, and ΔPmf of #5 particles is 2–13% larger than the former.
4.2. Mathematical Modeling
4.2.1. Ergun Equation Modifying Method
The fluidized state could be observed through the glass window embedded in the sidewall of the conical cylinder, and the expansion of the bed surface could be clearly observed with the help of a thin film ruler that was pasted on the inner wall of the conical cylinder. When U0 < U0mf, the bed was in a fixed state. When U0 approached U0mf, slight expansion could be observed in the bed, and the bed height expansion ratio was approximately 2%. After U0 reached U0mf, bubbling was observed in the central part of the bed surface. As U0 continued to increase, significant bubbling occurred throughout the entire cross section, and the fluidization height also increased as more particles were brought into the freeboard.
To simplify the model, the following assumptions are made for the point at which U0 = U0mf: the material expands uniformly, the bed height expansion ratio in the height direction is 2%, and the surface of the bed is flat.
From Equations (4) and (5), it can be further deduced that Uh is the function value of rh, and the deduced equation is as follows:
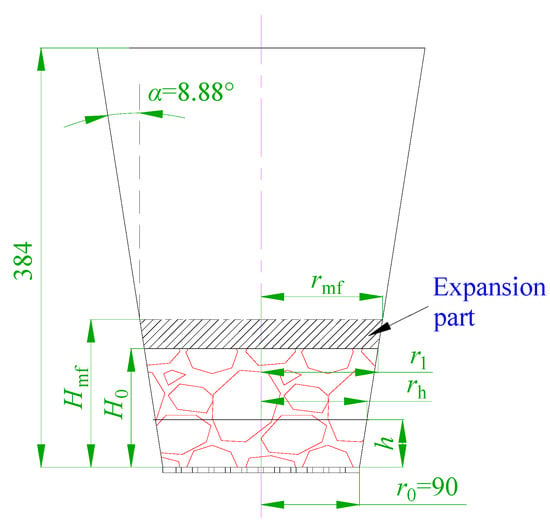
Figure 7.
Schematic diagram of the dimensional parameters of the conical cylinder.
To obtain a precise H0 value for each experiment in Table 3, the following equation is drawn based on the relationship of volume times density is equal to mass:
By solving the combined equations of Equations (12) and (13), the H0 value can be obtained. In this study, an exhaustive method is used, and the programming and calculation are conducted in MATLAB. The specific method is to assign all the values of every 0.0001 in 0–0.1 to H0 (unit: m) and substitute H0 into Equations (12) and (13); then, calculate the equation error of Equation (13); finally, the best-matched H0 value can be obtained by finding the minimum absolute equation error. The calculated H0 values of all experiments are listed in Appendix A.
Since the bed expansion ratio is 2%, Hmf, rmf, and εmf can be determined by the following equations:
Under the condition of U0 = U0mf, the original Ergun equation is as follows:
Set and so that Equation (17) can be simplified to:
The drag force of the gas on the particles is:
Integrate the left and right sides of Equation (19) to h at the same time with an integral interval of 0-Hmf, and simplify it as follows:
Since the inner wall of the conical cylinder is relatively smooth, the friction force of the wall against the particles can be ignored. According to previous studies [15,16], when U0 = U0mf, the drag force exerted on the particles is equal to the gravity force of the particles; that is:
Substitute Equation (20) into Equation (21); that is:
By solving Equation (22), the calculated U0mf can be obtained. (Hmf, rmf, and εmf can be obtained in advance by Equations (14)–(16), respectively)
Integrate the left and right sides of Equation (18) to h at the same time with an integral interval of 0-Hmf, and simplify it as follows:
The calculated ΔPmf can be obtained by substituting the calculated U0mf into Equation (23).
For every experiment in Table 3, conduct the above calculation steps to obtain the calculated U0mf and calculated ΔPmf values. To facilitate observation, the experimentally measured values of U0mf and ΔPmf are taken as the abscissa and the calculated values as the ordinate, as Figure 8 shows.
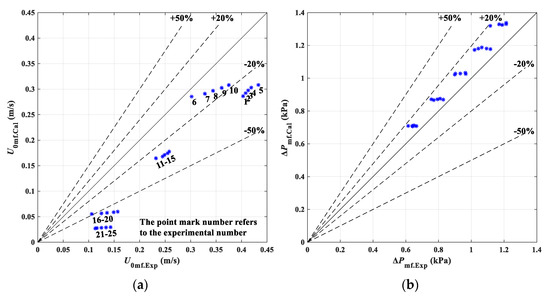
Figure 8.
Comparison of the calculated and experimental values of (a) U0mf and (b) ΔPmf for the original Ergun equation.
Figure 8 shows that the prediction accuracy of U0mf is relatively high (absolute error < 20%) for the data of experiments 06–10 and very poor for experiments 16–25 in which small particles were used, and all the prediction values are smaller than the experimental values. For the prediction of ΔPmf, the prediction accuracy is high, with similar errors between 0–+20%. Substituting all prediction and experimental values into Equations (8) and (9), the overall RMSE and R2 can be obtained, as shown in Table 5. There are many possible reasons for the low prediction accuracy: (a) The measured values of some variables, especially the sphericity, are difficult to accurately determine. (b) There may be differences in some environmental parameters compared with the experiments for deducing the Ergun equation, such as gas humidity, which greatly affects the gas viscosity and the drag force. (c) The conical wall may have an upward support force for the material in the initial fluidization stage.

Table 5.
Coefficients and prediction accuracies of the original and modified Ergun equations.
To increase the prediction accuracy of U0mf and ΔPmf, the original coefficients at two sites are changed. The coefficients C1/C2 in Equation (1) are changed at the first site, whose original values are 150/1.75, respectively. At the second site, considering that the conical wall may support the material, a multiplicative correction coefficient C3 is added to Equation (21) as follows:
Therefore, Equation (22) is modified as follows:
where and . Equation (25) is the equation used in the following fitting operations.
All the calculations are performed by MATLAB software, a method of exhaustive optimization is used, and the optimization goal is to minimize the sum of the RMSE values of U0mf and ΔPmf (RMSEsum).
The specific calculation processes are shown in Figure 9. First, a preset value of 0.8 is given for C3, then C1/C2 are obtained by fitting the experimental data using a linear regression method (“regress” function in MATLAB). Then, this C1/C2/C3 combination is used to calculate the value of RMSEsum, and the C1/C2/C3 combination and RMSEsum are recorded. Then, add 0.0001 to the previous C3 preset value, and perform the same calculation and recording for each C3 preset value. When the C3 preset value reaches 1.2, the exhaustive optimization calculation is ended. Finally, the C1/C2/C3 combination corresponding to the minimum value of RMSEsum is found. The final results are C1 = 46.61, C2 = 3.25, and C3 = 0.8995. The coefficients and modeling accuracies of the original and modified Ergun equations are listed in Table 5, and the modeling results of the modified Ergun equation are shown in Figure 10.
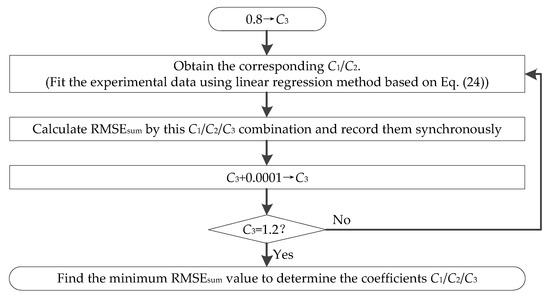
Figure 9.
Specific calculation processes to determine the coefficients C1/C2/C3.
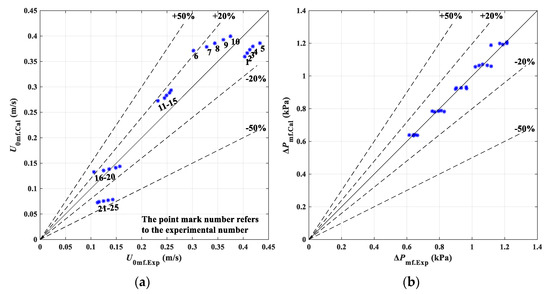
Figure 10.
Comparison of the calculated and experimental values of (a) U0mf and (b) ΔPmf for the modified Ergun equation.
Substitute C3 = 0.8995 into Equation (24), i.e.,
We speculate that the reason for Equation (26) is that when fluidization occurs, the conical wall still has support for the particles, which can decompose into an upward component force; therefore, when the drag force of the gas is less than the gravity force of particles (0.8995 < 1), the particles can still be fluidized, and the coefficient C3 should be related to the cone angle. Some literature has proposed separation models of conical fluidized beds, which may help analyze this problem [34,35]. In future research, we will try to measure the possible supporting force and study the value trend of the coefficient C3.
To sum up, the specific calculation process of the Ergun equation modifying method is that U0mf can be calculated by solving the following equation:
where and (Hmf, rmf, and εmf can be obtained by Equations (14)–(16), respectively). After U0mf is calculated, ΔPmf can be calculated by substituting the calculated U0mf into Equation (23).
4.2.2. Dimensional Analysis
To obtain a dimensionless correlation, we first determine the factors that influence the hydrodynamic behavior of the fluidized bed, which are the particle size (dp), initial bed height (H0), bottom diameter (D0), initial bed voidage (ε0), particle sphericity (φ), particle true density (ρs), gas density (ρg), gas viscosity (μ), angle of repose (θ), Hausner ratio (R). These factors are recast into several dimensionless groups containing the Reynolds number (), Archimedes number (), , , , , , and the correlations among these above dimensionless groups with undetermined coefficients are as follows:
To obtain the undetermined coefficients of Equations (28) and (29), both linear regression and nonlinear regression methods can be used. For the linear regression method, first, take the logarithm of both sides of Equation (28) as follows:
Then, the “regress” function in MATLAB can be used to fit the undetermined coefficients, i.e., a1, b1, c1, d1, e1, and f1
For the nonlinear regression method, the “nlinfit” function in MATLAB is used to fit the undetermined coefficients of Equations (28) and (29) directly, and the results of the linear regression are set as the initial values of iteration. The results of the linear and nonlinear regression methods are shown in Table 6 and Table 7 and Figure 11. Based on the values of R2 and RMSE, there is little difference between the fitting accuracy of the linear and nonlinear regression methods, especially for ΔPmf, where the models are almost the same.

Table 6.
Results of the linear and nonlinear regression methods of U0mf for the dimensionless model.

Table 7.
Results of the linear and nonlinear regression methods of ΔPmf for the dimensionless model.
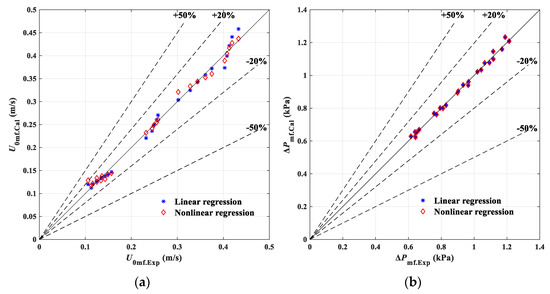
Figure 11.
Comparison of the calculated and experimental values of (a) U0mf and (b) ΔPmf for the dimensionless model.
Since the linear regression has better convergence ability than the nonlinear regression and does not need to assign initial values, it is more practical. Therefore, we choose the results of the linear regression method, and the final dimensionless correlation to predict U0mf and ΔPmf is as follows:
4.2.3. Discussion of the Two Modeling Methods
Based on the values of R2 and RMSE of the two modeling methods (Table 5, Table 6 and Table 7), the dimensional analysis method is better than the Ergun equation modifying method. This result mainly occurs because the dimensionless correlation contains six undetermined coefficients, which is more than the three undetermined coefficients in the modified Ergun equation. More undetermined coefficients can effectively improve the fitting accuracy but also increase the complexity of the fitting calculation.
The physical laws between physical quantities are considered in the Ergun equation modifying method, so its correlation has relatively strong logicality. When using this method, by analyzing and deducing the formulas, the current fluidized state can be analyzed more deeply, and even some other inferences or conclusions can be obtained. For example, the inference of Fmf = 0.8995G is obtained in this study, which offers some new information on analyzing the fluidized state. The dimensional analysis only fits the relationship between physical quantities from the numerical point of view. Under the condition of the same equipment and operation parameters, it has high fitting accuracy. However, the adaptability of this method is inadequate. For example, Equations (30) and (31) have higher prediction accuracy for the negative pressure conical fluidized bed with a glass bead material, but they may not be able to predict accurately for other types of fluidized beds or materials. These two methods have their advantages and disadvantages, and the appropriate method can be chosen according to the needs of actual production.
5. Conclusions
The research equipment in this paper is a pharmaceutical conical fluidized bed with negative pressure. First, the relationship between particle size/material mass and U0mf/ΔPmf is explored. Then, an Ergun equation modifying method and the dimensional analysis method are used to establish prediction models for U0mf/ΔPmf, and linear and nonlinear regression analysis methods are both used to determine the coefficients in the models. Finally, the advantages and disadvantages and applicable scope of the two modeling methods are compared and evaluated.
The conclusions of this study can be summarized as follows:
For U0mf, the main influencing factor is the particle size, and the larger the particle size, the larger the U0mf is; the influence of the material mass is small. For ΔPmf, the main influencing factor is the material mass, and ΔPmf is approximately proportional to the material mass; the influence of the particle size is relatively small. Experiments with small particles show a significant increase at large superficial gas velocity; we propose a conjecture that the particles’ collision with the fluidization chamber’s top surface causes this phenomenon.
The Ergun equation modifying method takes into account the physical laws between physical quantities. The original Ergun equation has low prediction accuracy for U0mf and ΔPmf for this study. Modifying the coefficients of the Ergun equation can significantly increase the prediction accuracy. By analyzing the data, we draw the inference of Fmf = 0.8995G, which may be due to the upward supporting effect of the conical cylinder wall on the material and needs to be further explored and verified.
The dimensional analysis method considers only the mathematical relationships between independent variables and dependent variables. Compared with the Ergun equation modifying method, the dimensional analysis method has a higher fitting accuracy. There is little difference in the fitting accuracy between the linear regression method and the nonlinear regression method.
Author Contributions
Conceptualization, S.F.; Data curation, S.F.; Formal analysis, S.F.; Investigation, S.F.; Methodology, S.F., L.F., and G.T.; Project administration, Y.W. and H.Q.; Software, L.F. and G.T.; Supervision, Y.W. and H.Q.; Validation, L.F. and G.T.; Writing—original draft, S.F. All authors have read and agreed to the published version of the manuscript.
Funding
This research was funded by National Standardization Project of TCM, grant number ZYBZH-C-TJ-55; National Science and Technology Major Project, grant number 2018ZX09201011-002.
Conflicts of Interest
The authors declare no conflict of interest.
Nomenclature
| A, B | alphabetic symbols used to simplify equations, (-) |
| Ar | Archimedes number (), (-) |
| C1 | coefficient of the viscosity term in the Ergun equation, (-) |
| C2 | coefficient of the inertial term in the Ergun equation, (-) |
| C3 | multiplicative correction coefficient in Equation (24), (-) |
| dp | particle size, (m) |
| Fmf | drag force of the incipient fluidized state, (N) |
| Fr | Froude number (), (-) |
| G | gravity force of particles, (N) |
| g | acceleration of gravity, (9.8 m/s2) |
| h | height of the specified section of the conical cylinder, (m) |
| H | total height of particles, (m) |
| N | total number of points in a time-series signal, (-) |
| P | pressure drop, (kPa) |
| Pn | exponents of the dimensionless groups, (-) |
| r0 | radius of the bottom of the conical cylinder, (m) |
| rh | sectional radius of the conical cylinder at the height of h, (m) |
| r1 | sectional radius of the conical cylinder at the height of H, (m) |
| R | Hausner ratio, (-) |
| Remf | Reynolds number when U0 = U0mf, (), (-) |
| RMSEsum | sum of the RMSE values of U0mf and ΔPmf, (-) |
| S0 | sectional area of the conical cylinder at the bottom, (m2) |
| Sh | sectional area of the conical cylinder at the height of h, (m2) |
| Uh | superficial gas velocity at the h height section of the conical cylinder, (m/s) |
| U0 | superficial gas velocity at the bottom section of the conical cylinder, (m/s) |
| U0mf | minimum fluidization velocity at the bottom section of the conical cylinder, (m/s) |
| W | material mass, (kg) |
| x | discrete time-series signal, (-) |
| the ith value of x, (-) | |
| average value of x, (-) | |
| the ith calculated value of x, (-) | |
| , | pressure time-series signal at ports P1 and P2, (Pa) |
| , | average value of and (Pa) |
| flow rate time-series signal, (L/min) | |
| average value of , (L/min) | |
| Greek letters | |
| α | conical angle of the conical cylinder, (°) |
| φ | particle sphericity, (-) |
| θ | angle of repose, (°) |
| ε | voidage of particles, (-) |
| ε0 | static voidage of particles, (-) |
| εmf | voidage of the incipient fluidized state, (-) |
| μ | gas viscosity, (Pa·s) |
| ρg | density of gas, (kg/m3) |
| ρs | true density of particles, (kg/m3) |
| πn | dimensionless groups, (-) |
| ΔP | pressure drop between the top and bottom sections of the material, (Pa) |
| ΔPmf | ΔP of the incipient fluidized state, (Pa) |
| ΔPp | pressure drop at the gas distribution plate, (Pa) |
Appendix A

Table A1.
Calculated H0 values of all experiments.
Table A1.
Calculated H0 values of all experiments.
| Material Number | H0 (m) | ||||
|---|---|---|---|---|---|
| Material Mass 2 kg | Material Mass 2.5 kg | Material Mass 3 kg | Material Mass 3.5 kg | Material Mass 4 kg | |
| #1 | 0.0460 | 0.0565 | 0.0667 | 0.0765 | 0.0861 |
| #2 | 0.0483 | 0.0593 | 0.0699 | 0.0802 | 0.0902 |
| #3 | 0.0483 | 0.0592 | 0.0698 | 0.0801 | 0.0900 |
| #4 | 0.0507 | 0.0622 | 0.0733 | 0.0840 | 0.0944 |
| #5 | 0.0491 | 0.0603 | 0.0710 | 0.0815 | 0.0916 |
References
- Shi, Y.F.; Yu, Y.S.; Fan, L.T. Incipient fluidization condition for a tapered fluidized bed. Ind. Eng. Chem. Fundam. 1984, 23, 484–489. [Google Scholar] [CrossRef]
- Wormsbecker, M.; van Ommen, R.; Nijenhuis, J.; Tanfara, H.; Pugsley, T. The influence of vessel geometry on fluidized bed dryer hydrodynamics. Powder Technol. 2009, 194, 115–125. [Google Scholar] [CrossRef]
- Biswal, K.C.; Sahu, S.; Roy, G.K. Prediction of the fluctuation ratio for gas-solid fluidization of regular particles in a conical vessel. Chem. Eng. J. 1982, 23, 97–99. [Google Scholar] [CrossRef]
- Yang, W.C. Handbook of fluidization and fluid-particle systems. China Particuol. 2003, 1, 137. [Google Scholar] [CrossRef]
- Bi, H.T. A critical review of the complex pressure fluctuation phenomenon in gas-solids fluidized beds. Chem. Eng. Sci. 2007, 62, 3473–3493. [Google Scholar] [CrossRef]
- Biswal, K.C.; Bhowmik, T.; Roy, G.K. Prediction of minimum fluidization velocity for gas-solid fluidization of regular particles in conical vessels. Chem. Eng. J. 1985, 30, 57–62. [Google Scholar] [CrossRef]
- Win, K.K.; Nowak, W.; Matsuda, H.; Hasatani, M.; Bis, Z.; Krzywanski, J.; Gajewski, W. Transport Velocity of Coarse Particles in Multi-Solid Fluidized Bed. J. Chem. Eng. Jpn. 2005, 28, 535–540. [Google Scholar] [CrossRef]
- Rasteh, M.; Farhadi, F.; Bahramian, A. Hydrodynamic characteristics of gas-solid tapered fluidized beds: Experimental studies and empirical models. Powder Technol. 2015, 283, 355–367. [Google Scholar] [CrossRef]
- Ergun, S. Fluid flow through packed columns. Chem. Eng. Prog. 1952, 48, 89–94. [Google Scholar]
- Amiri, L.; Ghoreishi-Madiseh, S.A.; Hassani, F.P.; Sasmito, A.P. Estimating pressure drop and Ergun/Forchheimer parameters of flow through packed bed of spheres with large particle diameters. Powder Technol. 2019, 356, 310–324. [Google Scholar] [CrossRef]
- Allen, K.G.; von Backström, T.W.; Kröger, D.G. Packed bed pressure drop dependence on particle shape, size distribution, packing arrangement and roughness. Powder Technol. 2013, 246, 590–600. [Google Scholar] [CrossRef]
- Wen, C.Y.; Yu, Y.H. A generalized method for predicting the minimum fluidization velocity. Aiche J. 1966, 12, 610–612. [Google Scholar] [CrossRef]
- Grace, J.R. Handbook of Multiphase Systems; 1982; Chapter 8. [Google Scholar]
- Gibson, I.A.; Slim, C.J.; Zheng, Y.; Scott, S.A.; Davidson, J.F.; Hayhurst, A.N. An examination of Wen and Yu’s formula for predicting the onset of fluidisation. Chem. Eng. Res. Des. 2018, 135, 103–111. [Google Scholar] [CrossRef]
- Peng, Y.; Fan, L.T. Hydrodynamic characteristics of fluidization in liquid-solid tapered beds. Chem. Eng. Sci. 1997, 52, 2277–2290. [Google Scholar] [CrossRef]
- Jing, S.; Hu, Q.Y.; Wang, J.F.; Jin, Y. Fluidization of coarse particles in gas-solid conical beds. Chem. Eng. Process. 2000, 39, 379–387. [Google Scholar] [CrossRef]
- Jing, S.; Cai, G.B.; Mei, F.; Bian, Y.; Wang, J.F.; Jin, Y. Fluidization of fine particles in conical beds. Powder Technol. 2001, 118, 271–274. [Google Scholar] [CrossRef]
- Kaewklum, R.; Kuprianov, V.I. Theoretical and experimental study on hydrodynamic characteristics of fluidization in air-sand conical beds. Chem. Eng. Sci. 2008, 63, 1471–1479. [Google Scholar] [CrossRef]
- Koekemoer, A.; Luckos, A. Effect of material type and particle size distribution on pressure drop in packed beds of large particles: Extending the Ergun equation. Fuel 2015, 158, 232–238. [Google Scholar] [CrossRef]
- Sau, D.C.; Mohanty, S.; Biswal, K.C. Minimum fluidization velocities and maximum bed pressure drops for gas-solid tapered fluidized beds. Chem. Eng. J. 2007, 132, 151–157. [Google Scholar] [CrossRef]
- Sau, D.C.; Mohanty, S.; Biswal, K.C. Experimental studies and empirical models for the prediction of bed expansion in gas-solid tapered fluidized beds. Chem. Eng. Process. Process. Intensif. 2010, 49, 418–424. [Google Scholar] [CrossRef]
- Sau, D.C.; Mohanty, S.; Biswal, K.C. Critical fluidization velocities and maximum bed pressure drops of homogeneous binary mixture of irregular particles in gas-solid tapered fluidized beds. Powder Technol. 2008, 186, 241–246. [Google Scholar] [CrossRef]
- Khani, M.H. Models for prediction of hydrodynamic characteristics of gas-solid tapered and mini-tapered fluidized beds. Powder Technol. 2011, 205, 224–230. [Google Scholar] [CrossRef]
- Rasteh, M.; Farhadi, F.; Ahmadi, G. Empirical models for minimum fluidization velocity of particles with different size distribution in tapered fluidized beds. Powder Technol. 2018, 338, 563–575. [Google Scholar] [CrossRef]
- Singh, R.K.; Roy, G.K. Prediction of minimum bubbling velocity, fluidization index and range of particulate fluidization for gas-solid fluidization in cylindrical and non-cylindrical beds. Powder Technol. 2005, 159, 168–172. [Google Scholar] [CrossRef]
- Hosseini, S.H.; Rezaei, M.J.; Bag-Mohammadi, M.; Karami, M.; Moradkhani, M.A.; Panahi, M.; Olazar, M. Estimation of the minimum spouting velocity in shallow spouted beds by intelligent approaches: Study of fine and coarse particles. Powder Technol. 2019, 354, 456–465. [Google Scholar] [CrossRef]
- Hosseini, S.H.; Karami, M.; Olazar, M.; Safabakhsh, R.; Rahmati, M. Prediction of the Minimum Spouting Velocity by Genetic Programming Approach. Ind. Eng. Chem. Res. 2014, 53, 12639–12643. [Google Scholar] [CrossRef]
- Gan, L.; Lu, X.; Wang, Q. Experimental and theoretical study on hydrodynamic characteristics of tapered fluidized beds. Adv. Powder Technol. 2014, 25, 824–831. [Google Scholar] [CrossRef]
- Golshan, S.; Yaman, O.; Koksal, M.; Kulah, G.; Zarghami, R.; Mostoufi, N. A new correlation for minimum spouting velocity for conical spouted beds operating with high density particles. Exp. Therm. Fluid Sci. 2018, 96, 358–370. [Google Scholar] [CrossRef]
- Hosseini, S.H.; Rezaei, M.J.; Bag-Mohammadi, M.; Altzibar, H.; Olazar, M. Smart models to predict the minimum spouting velocity of conical spouted beds with non-porous draft tub. Chem. Eng. Res. Des. 2018, 138, 331–340. [Google Scholar] [CrossRef]
- Murthy, J.S.N.; Reddy, V.S.; Tasleem, S.; Kumar, D.V.; Krishna, C.S.; Sankarshana, T. Hydrodynamics of gas-solid fluidization in tapered beds. Can. J. Chem. Eng. 2009, 87, 359–374. [Google Scholar] [CrossRef]
- Van Ommen, J.R.; Schouten, J.C.; Vander Stappen, M.L.M.; Bleek, C.M.V.D. Response characteristics of probe-transducer systems for pressure measurements in gas-solid fluidized beds: How to prevent pitfalls in dynamic pressure measurements. Powder Technol. 1999, 106, 199–218. [Google Scholar] [CrossRef]
- Geldart, D. Types of gas fluidization. Powder Technol. 1973, 7, 285–292. [Google Scholar] [CrossRef]
- Schaafsma, S.H.; Marx, T.; Hoffmann, A.C. Investigation of the particle flowpattern and segregation in tapered fluidized bed granulators. Chem. Eng. Sci. 2006, 61, 4467–4475. [Google Scholar] [CrossRef]
- Gernon, T.M.; Gilbertson, M.A. Segregation of particles in a tapered fluidized bed. Powder Technol. 2012, 231, 88–101. [Google Scholar] [CrossRef]
Publisher’s Note: MDPI stays neutral with regard to jurisdictional claims in published maps and institutional affiliations. |
© 2020 by the authors. Licensee MDPI, Basel, Switzerland. This article is an open access article distributed under the terms and conditions of the Creative Commons Attribution (CC BY) license (http://creativecommons.org/licenses/by/4.0/).