Dynamic Performance of a New-Type PSC I-girder for Railway Bridge Application


Abstract
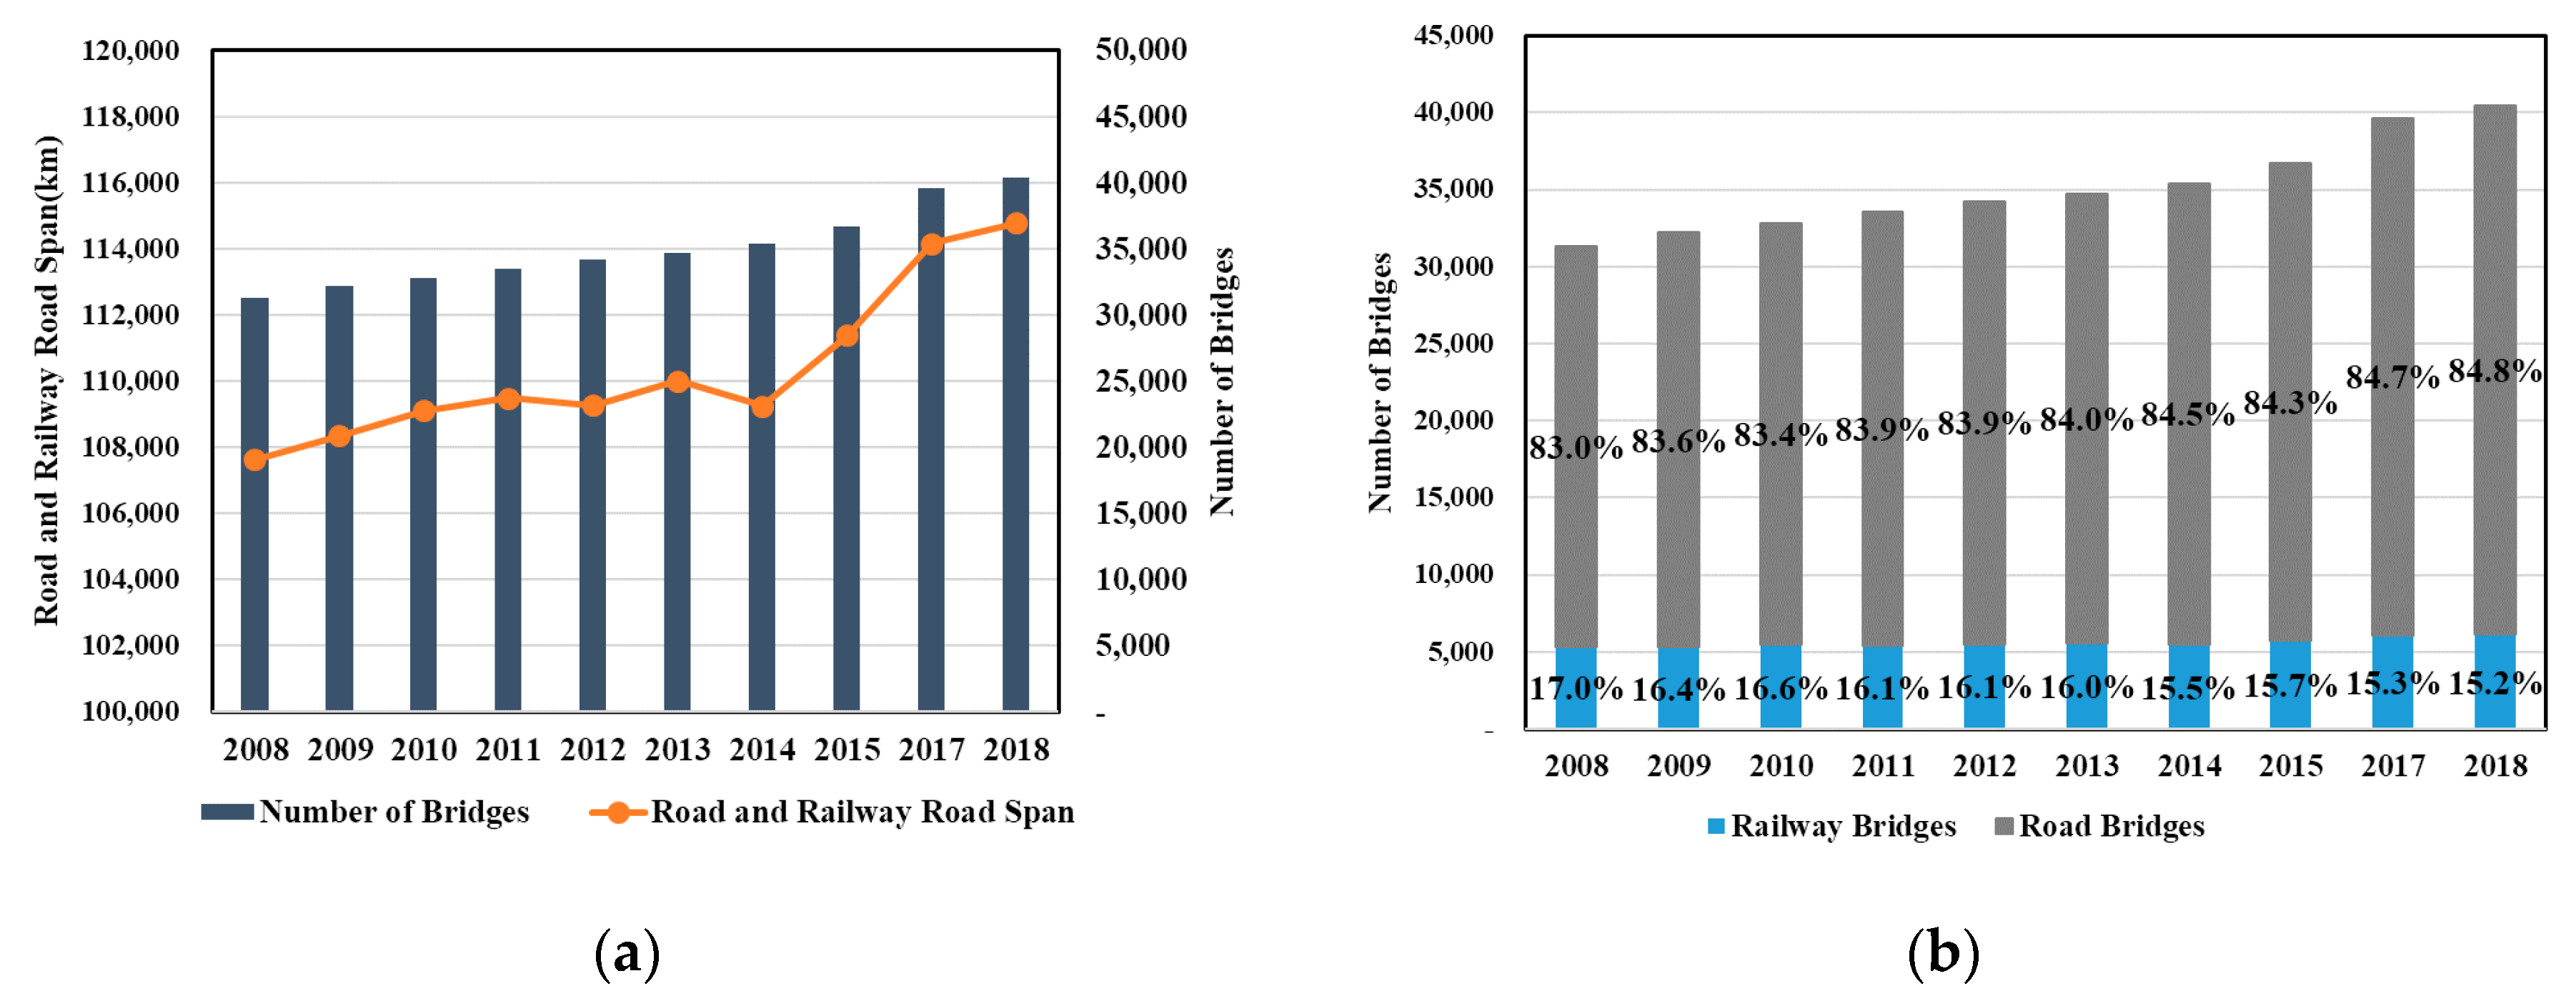
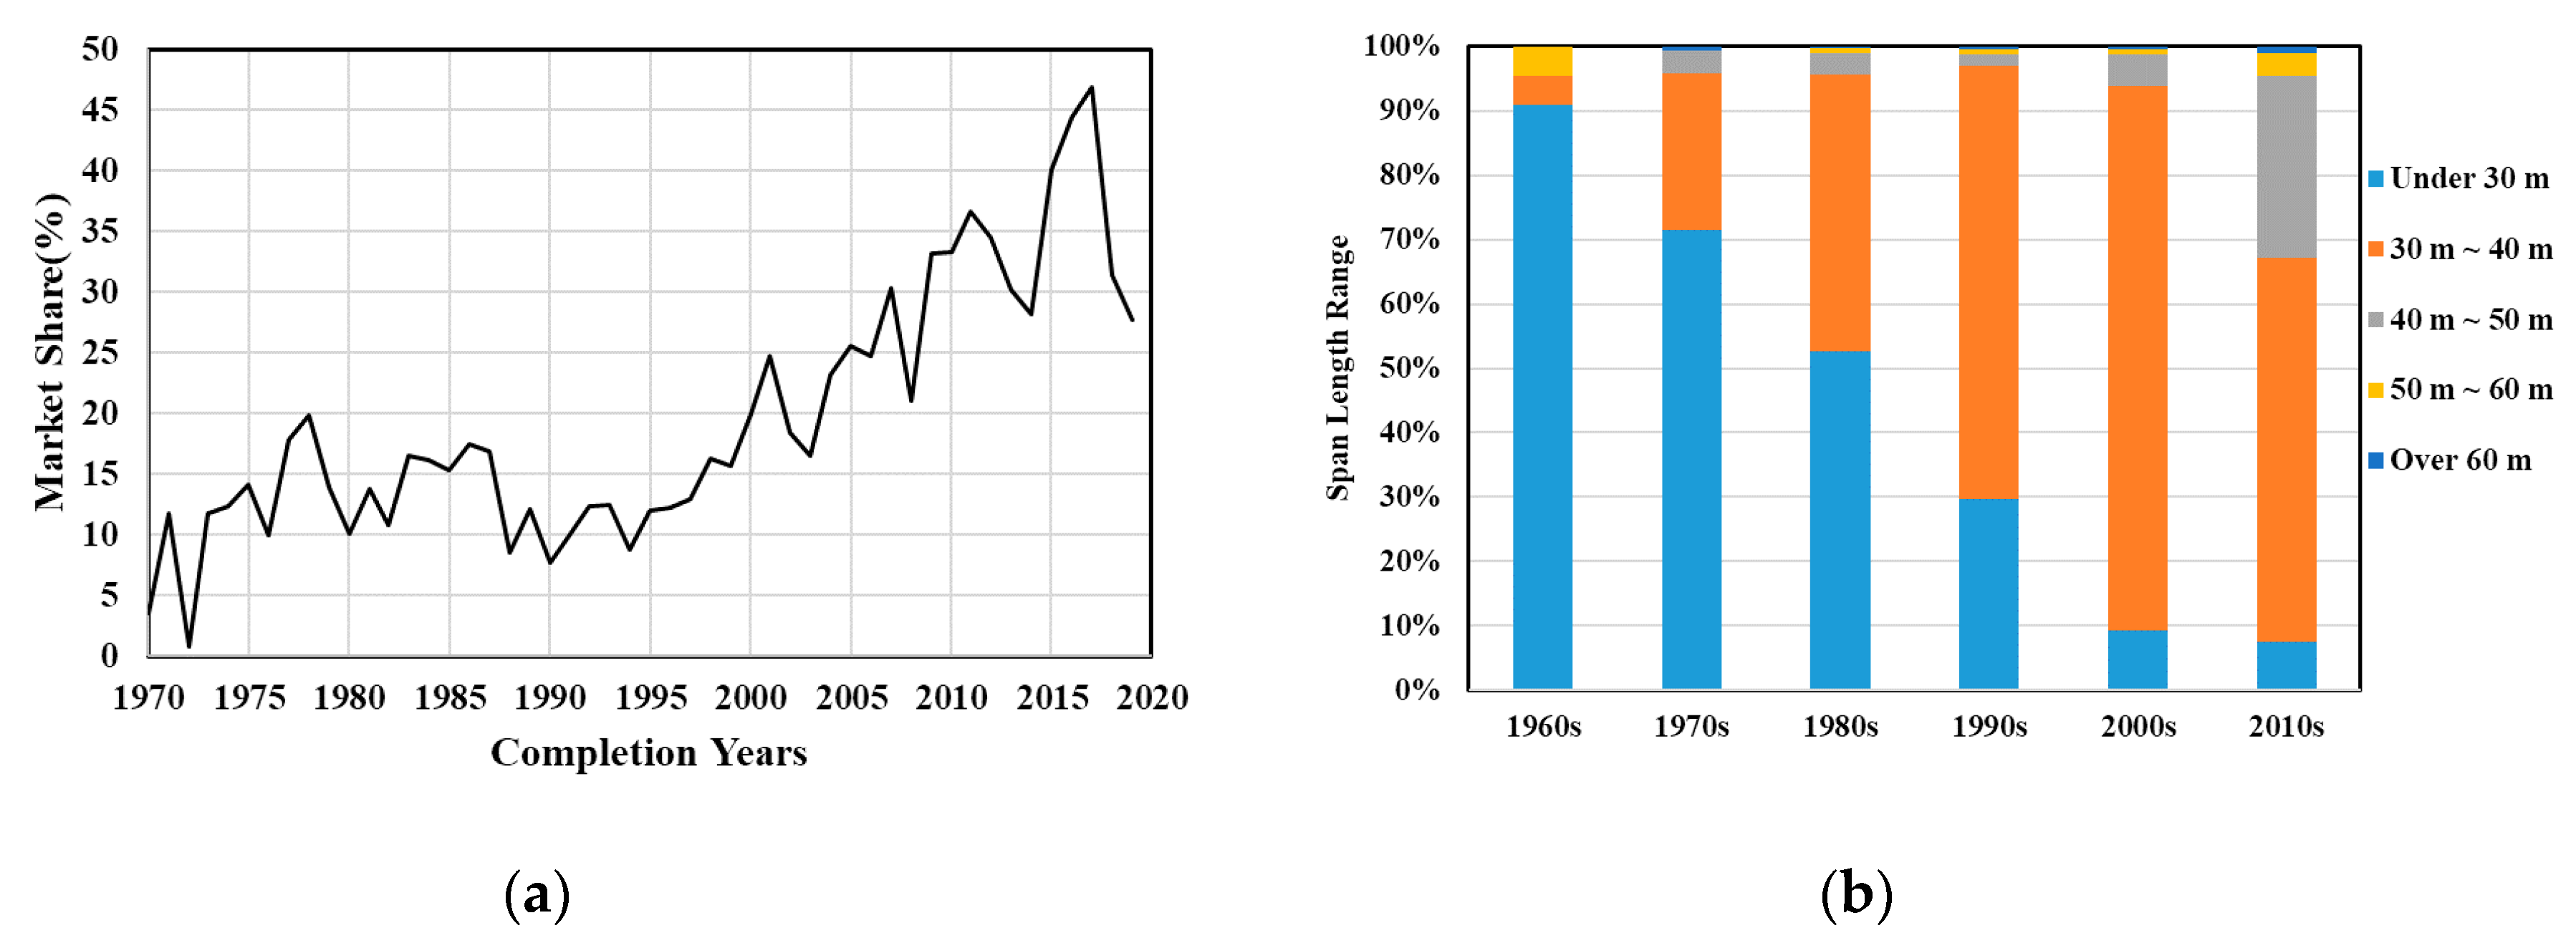
1. Introduction
2. Dynamic Performance Evaluation of New Type of PSC I-girder Bridge
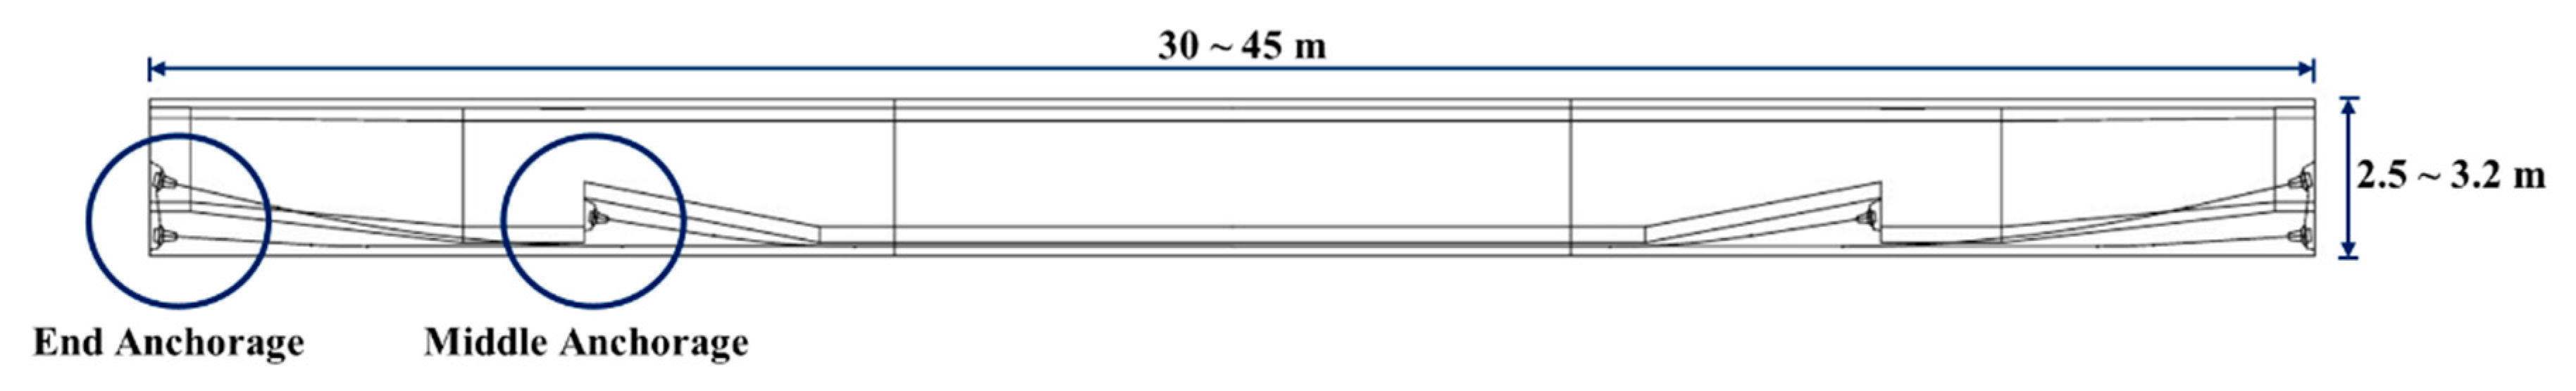
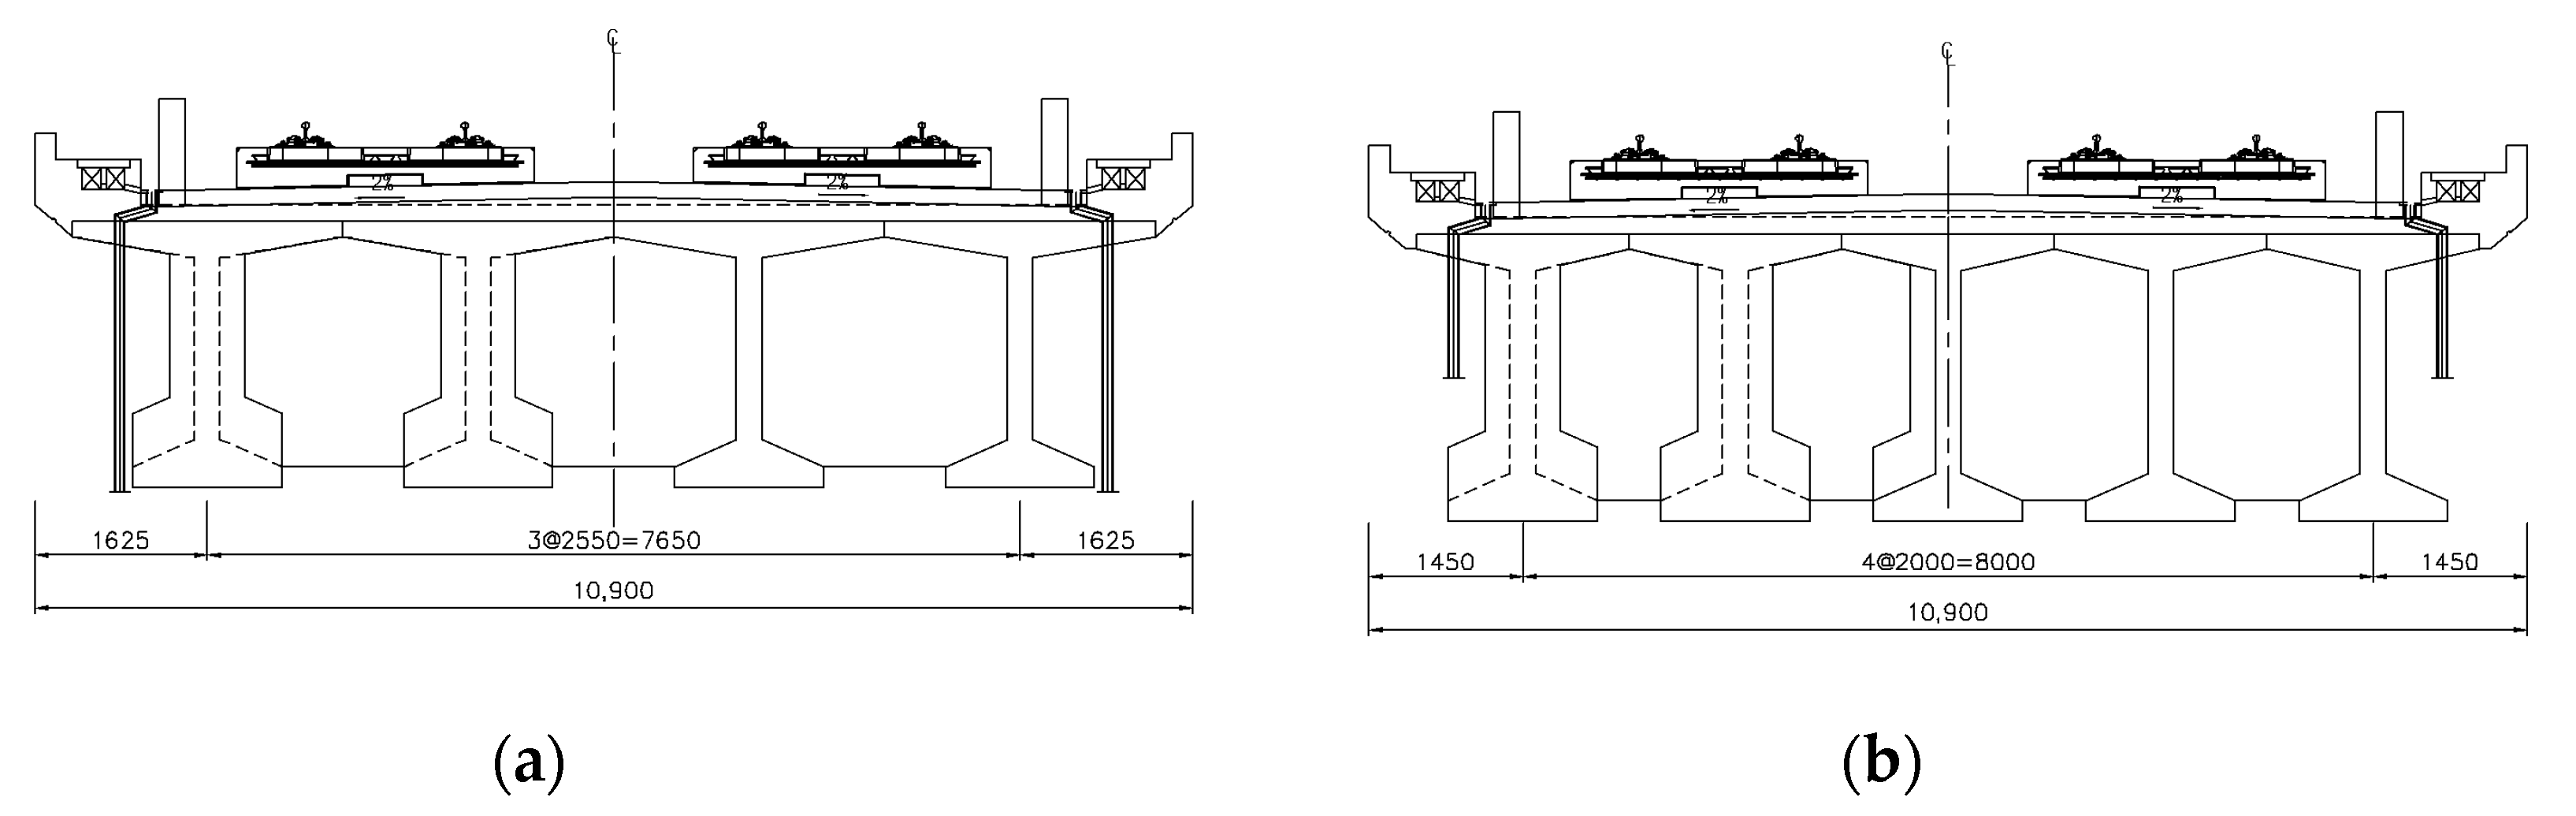
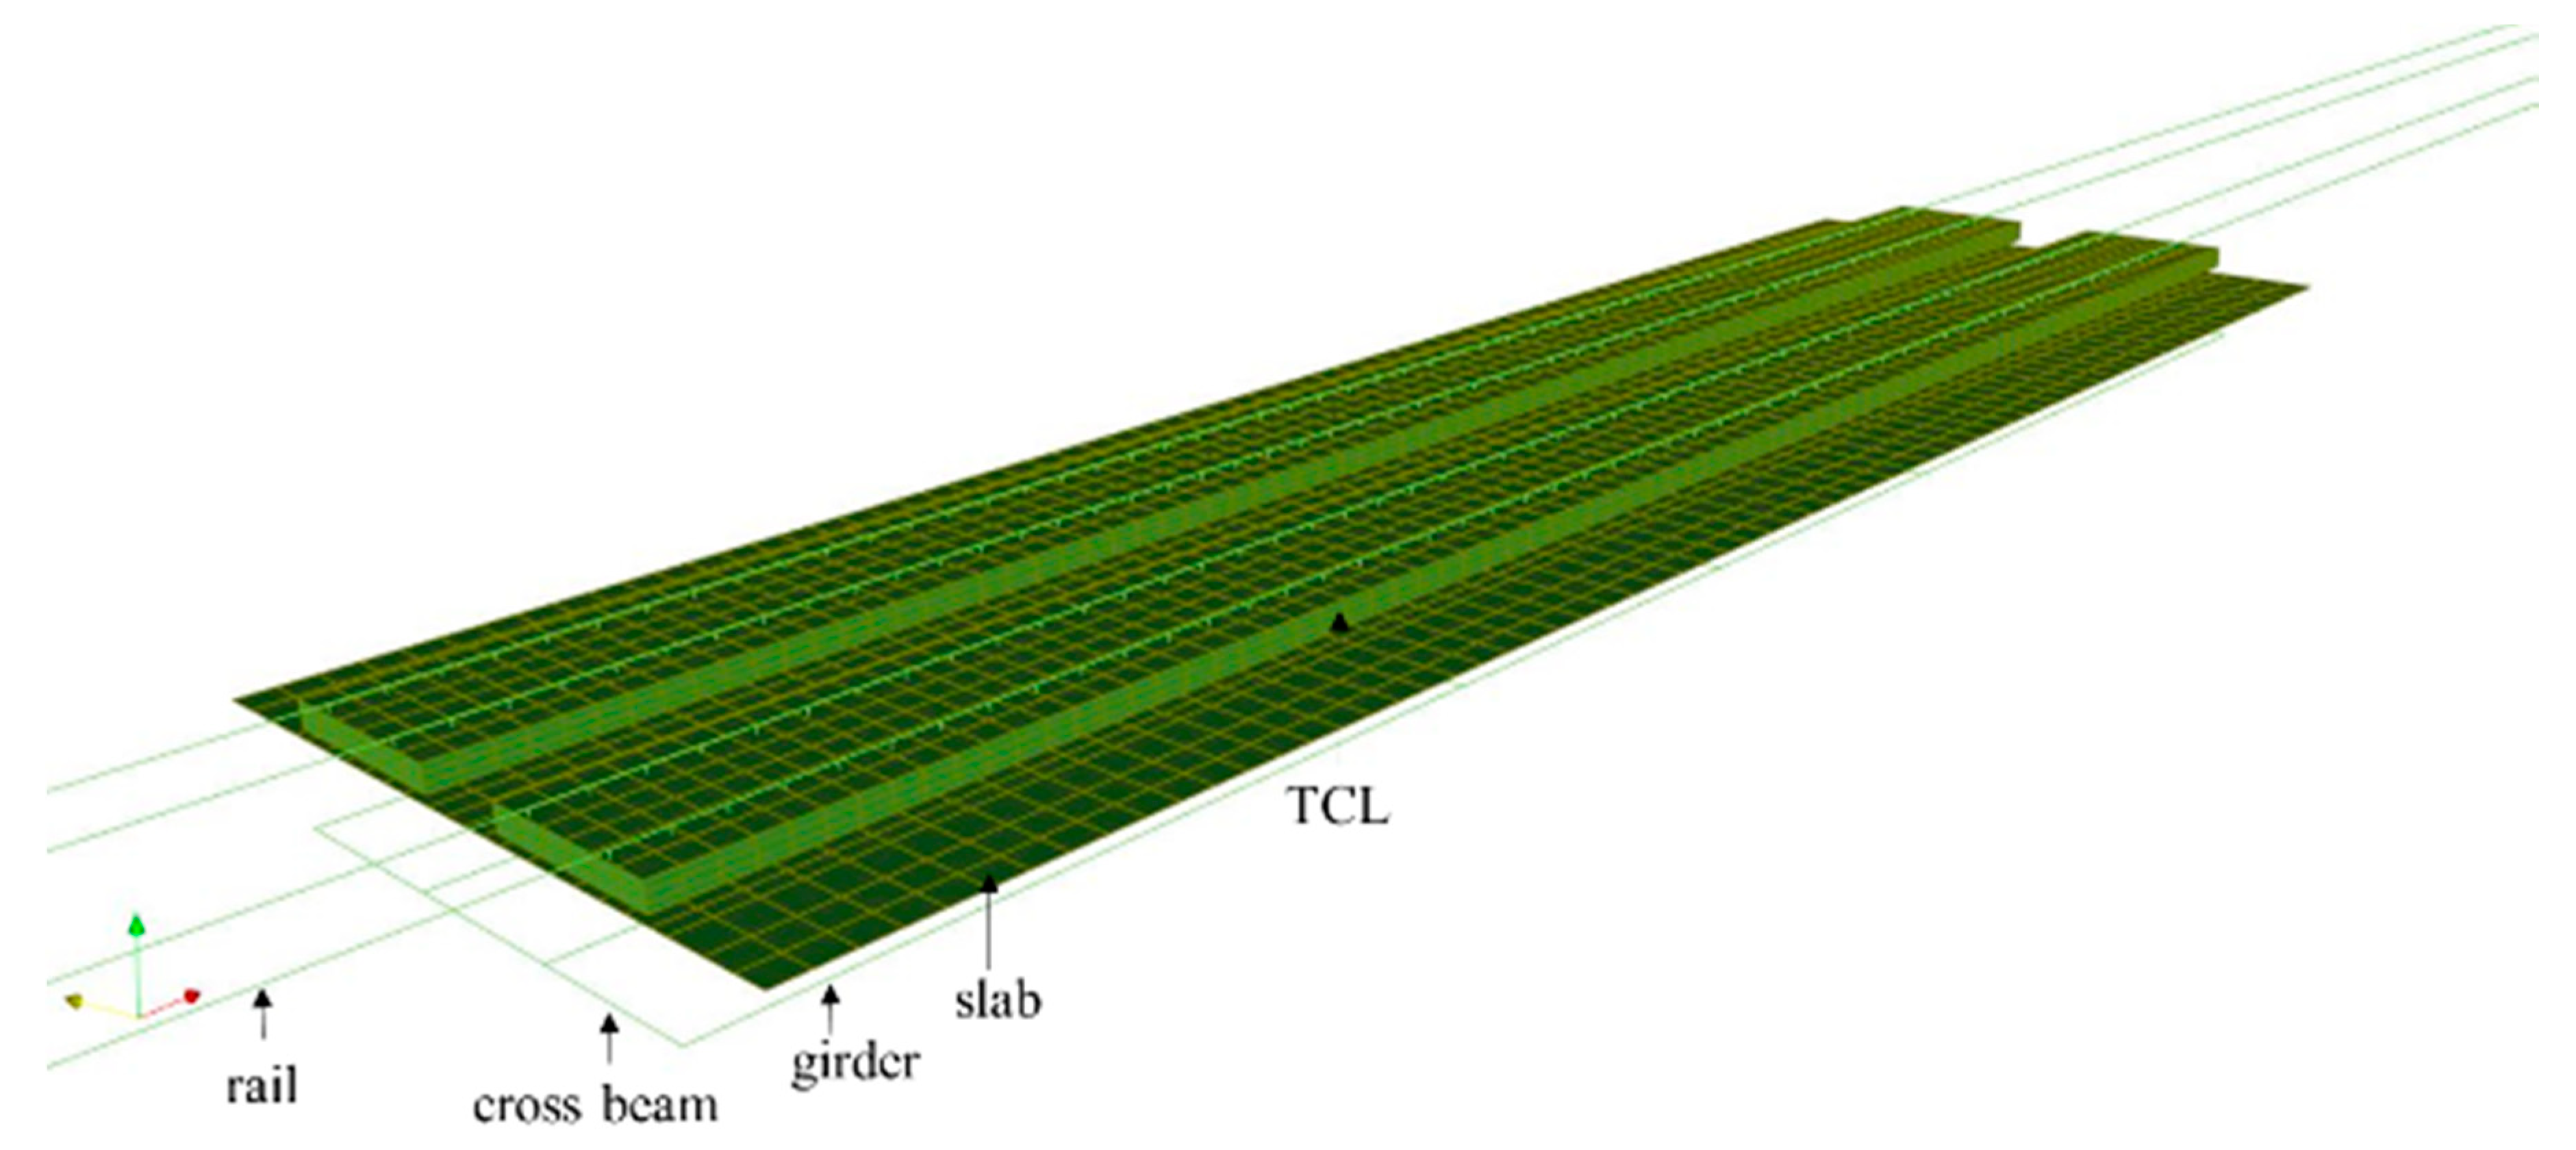
2.1. Structure Considered in Analysis
2.2. Performance Evaluation by Moving Load Analysis
2.2.1. Performance Evaluation Criteria
2.2.2. Analysis Method
2.3. Dynamic Performance Evaluation of New PSC I-girder Bridge
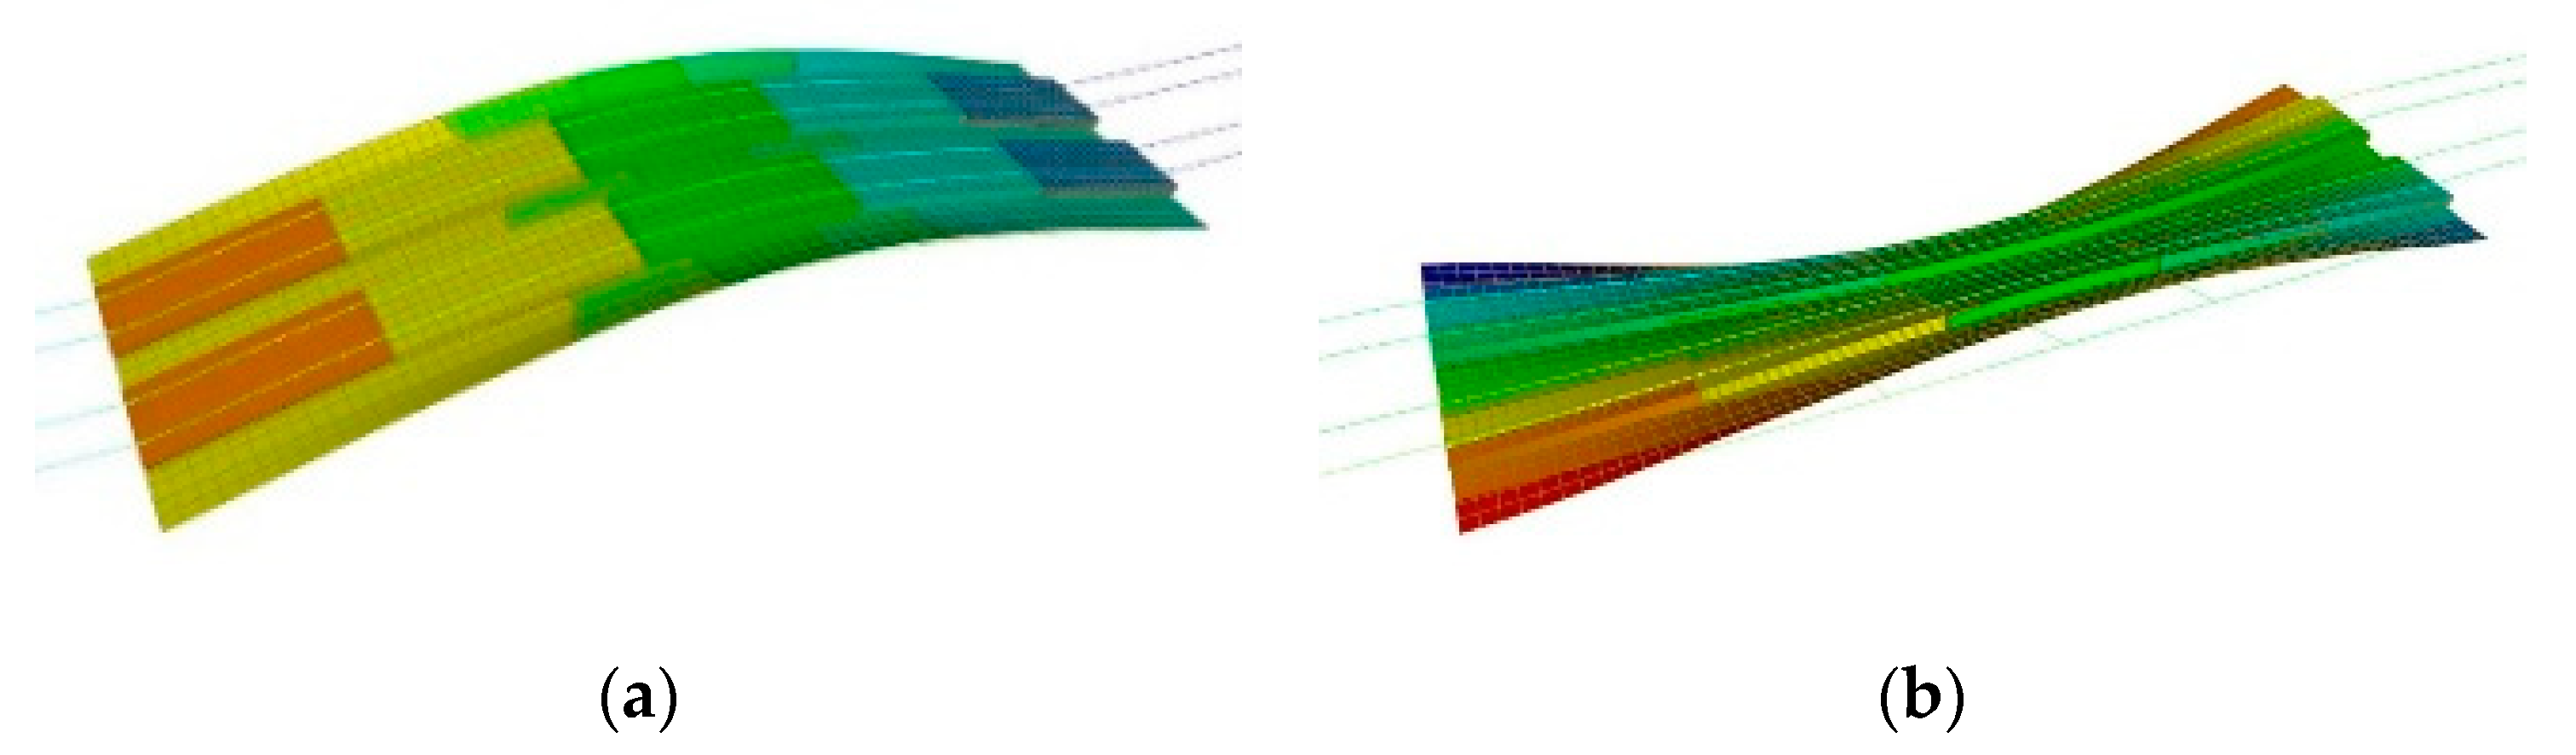
2.3.1. Natural Frequencies
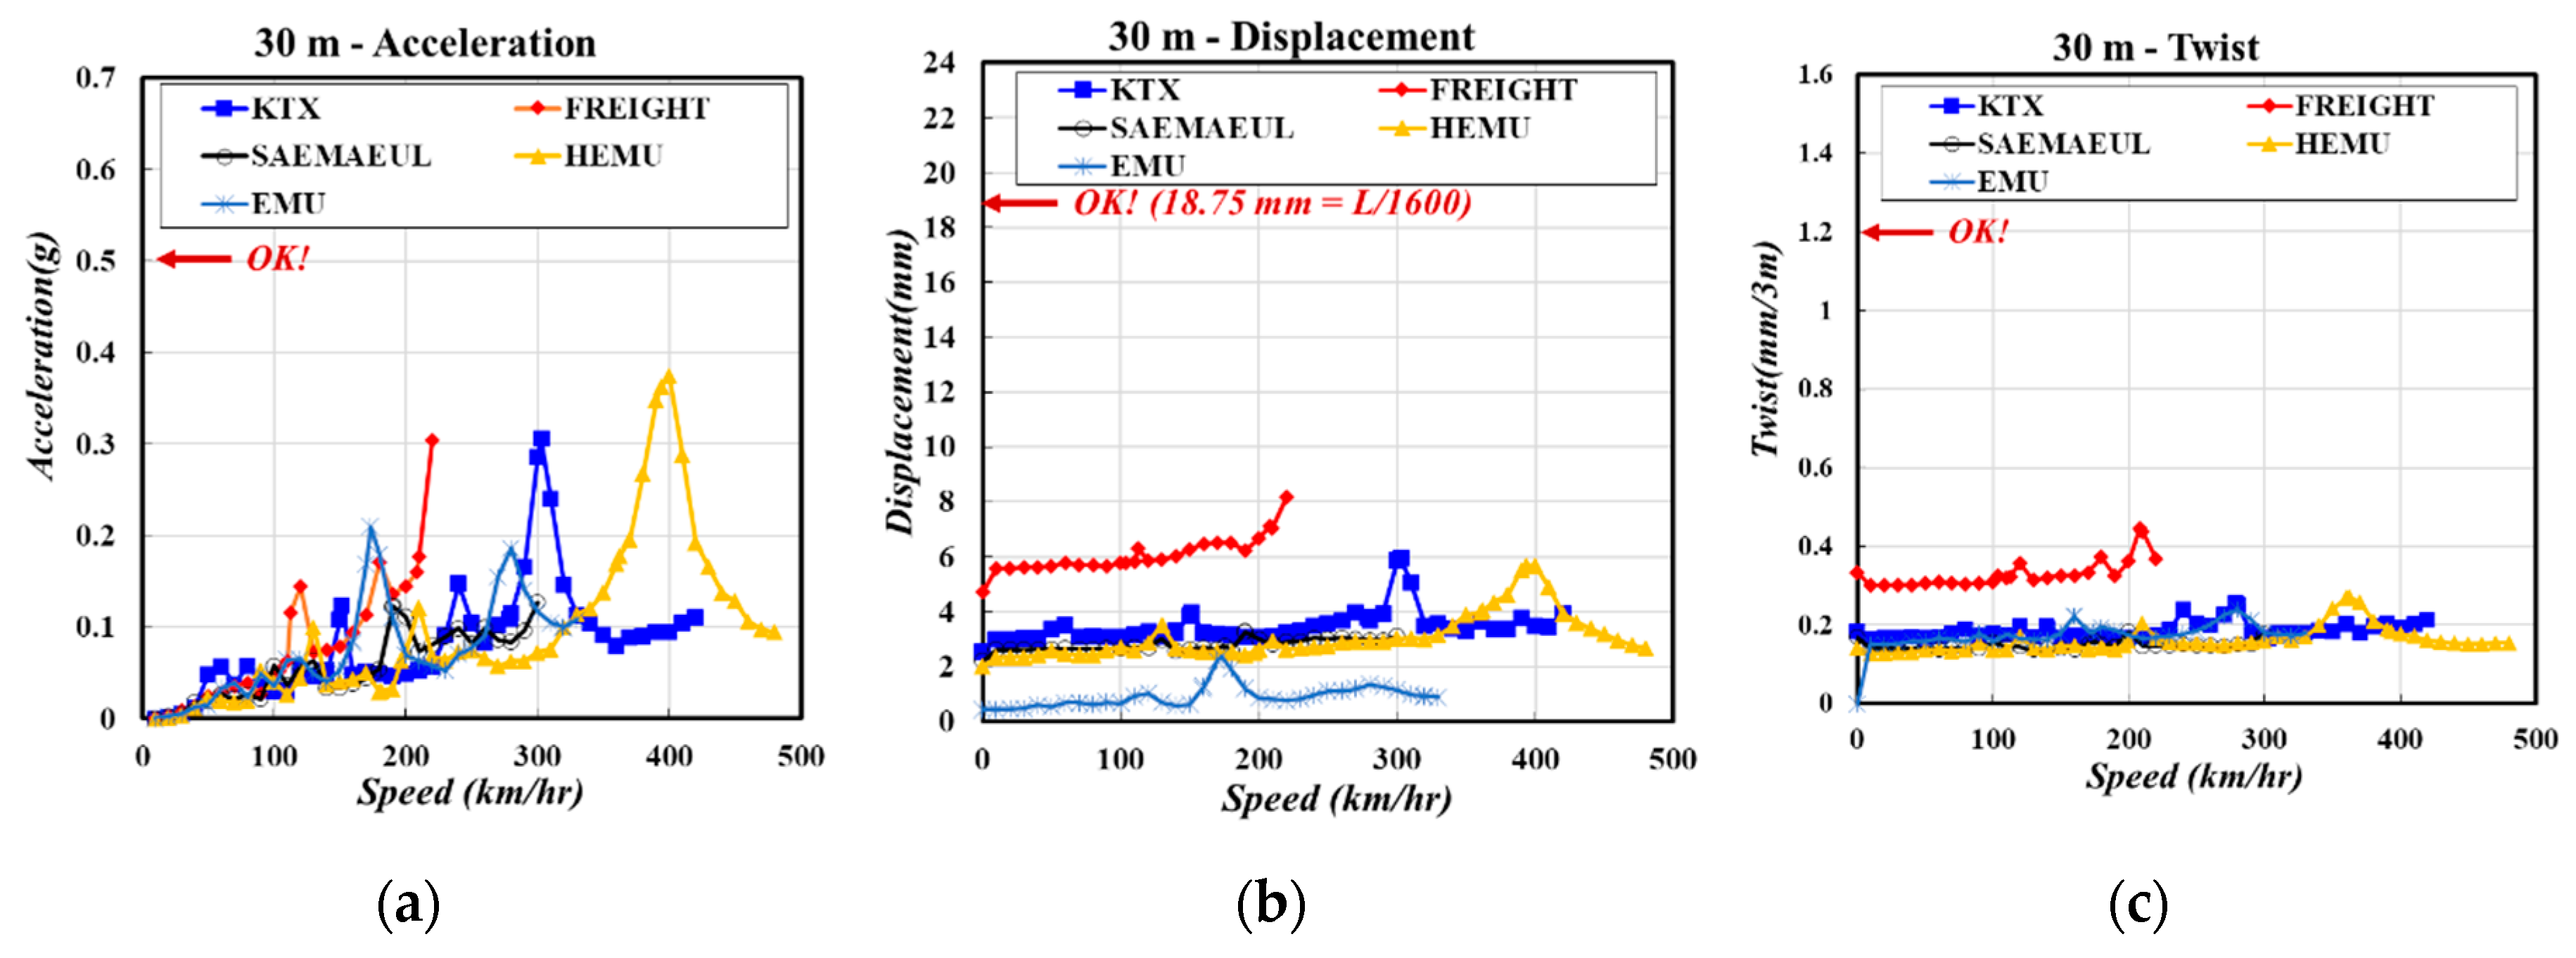
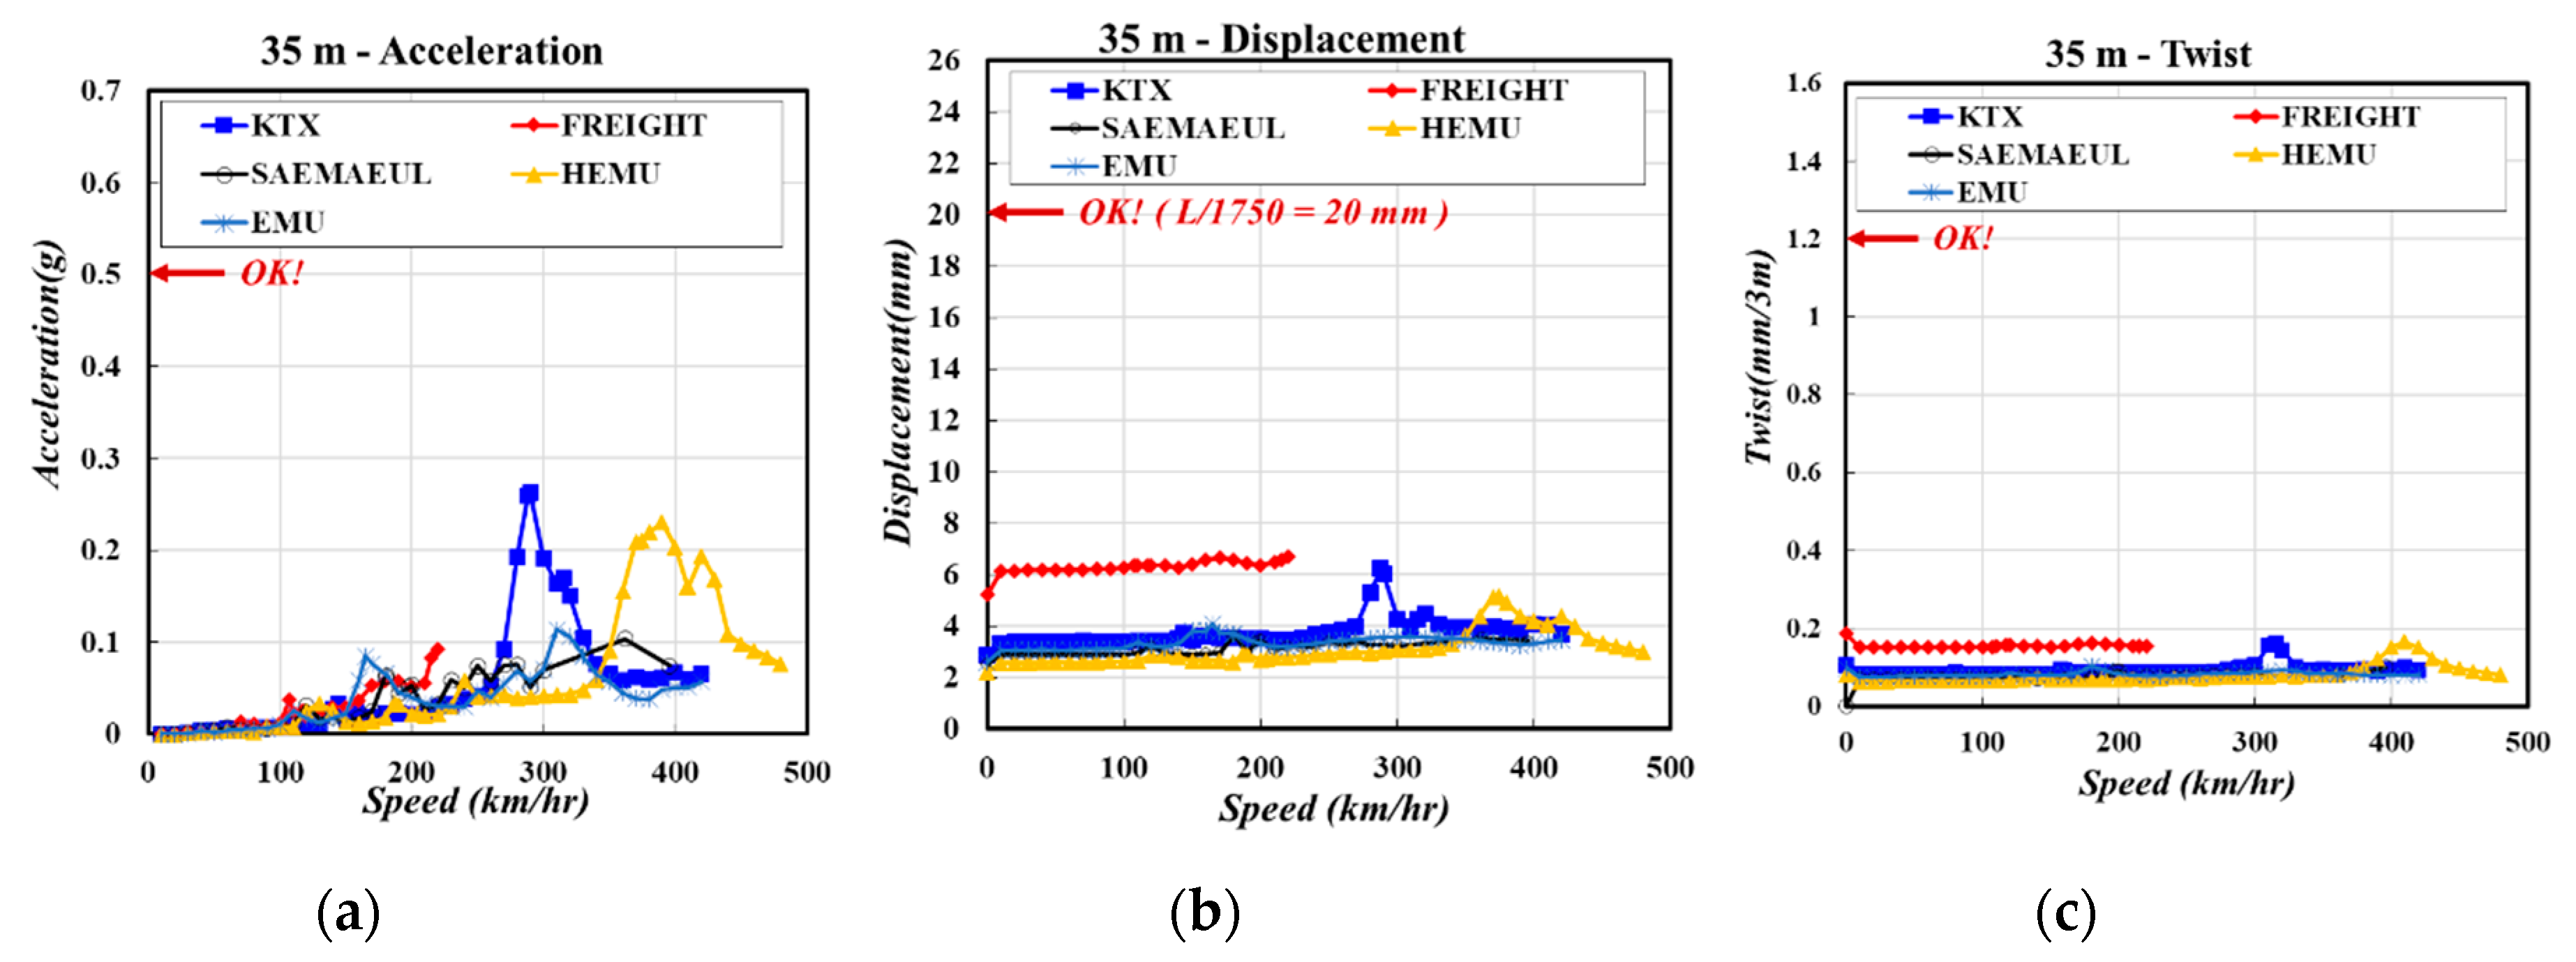
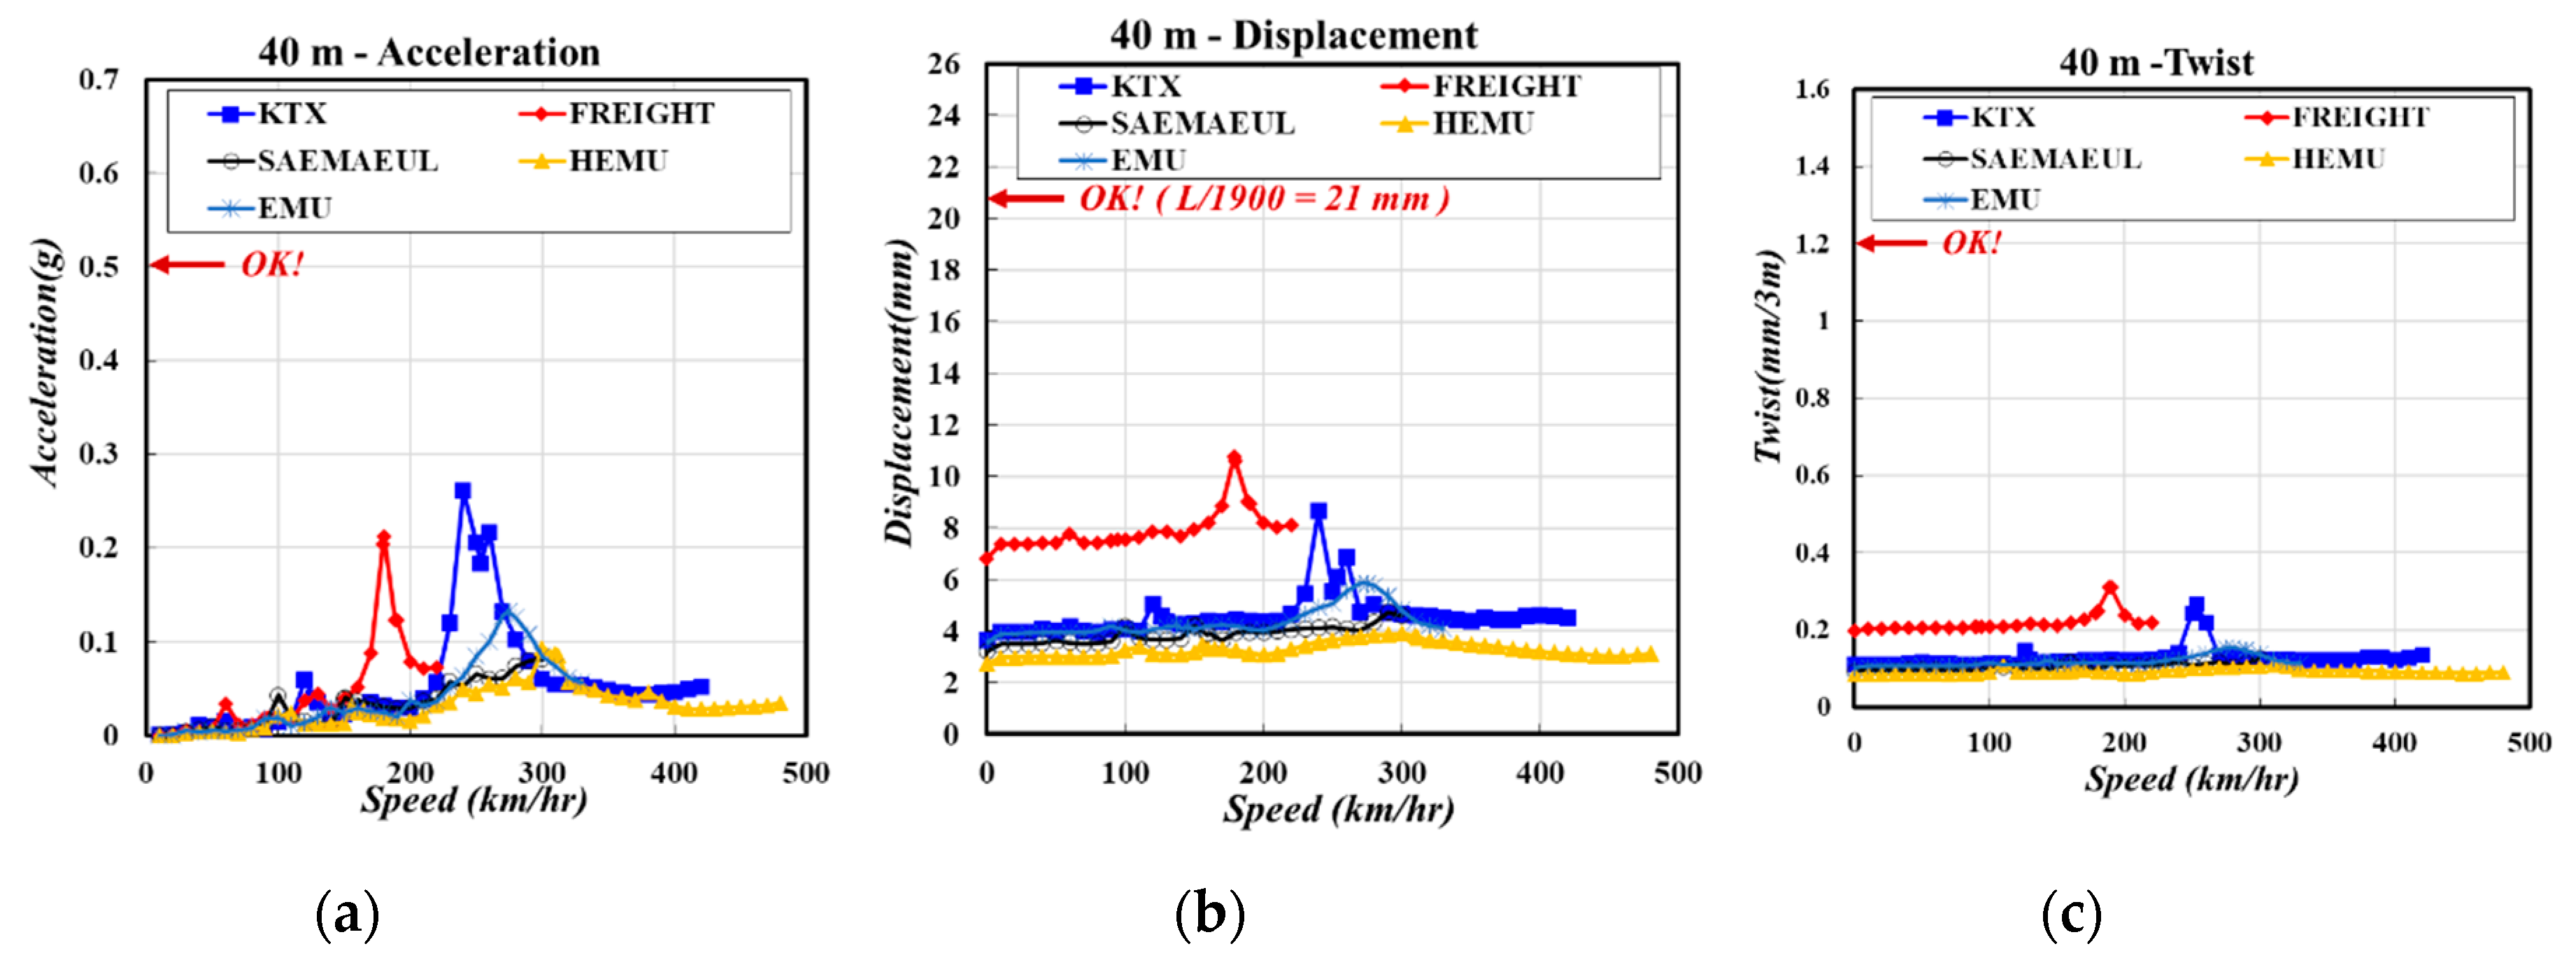
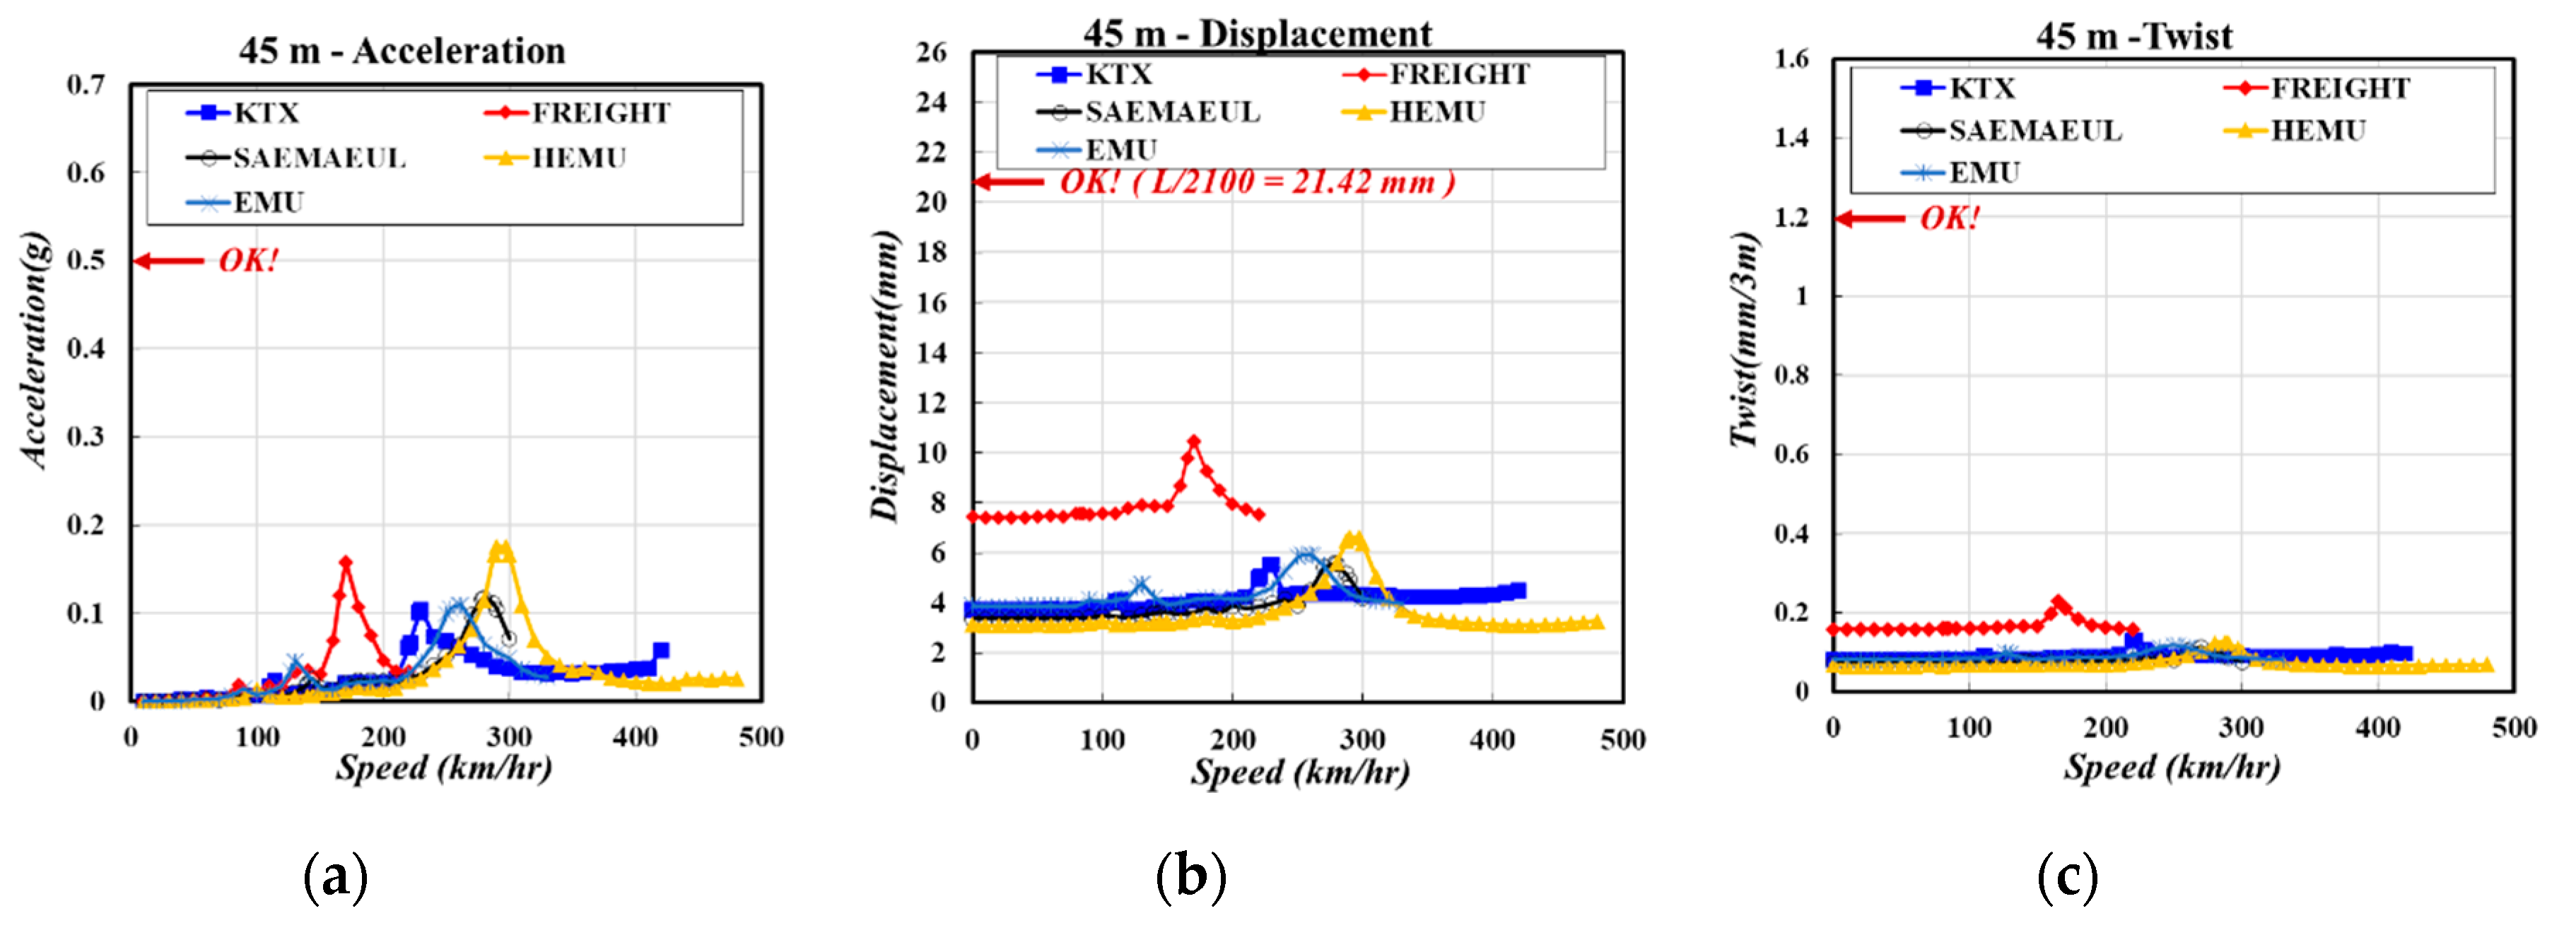
2.3.2. Dynamic Stability Check
3. Performance Evaluation on Full-Scale PSC I-girder Specimen
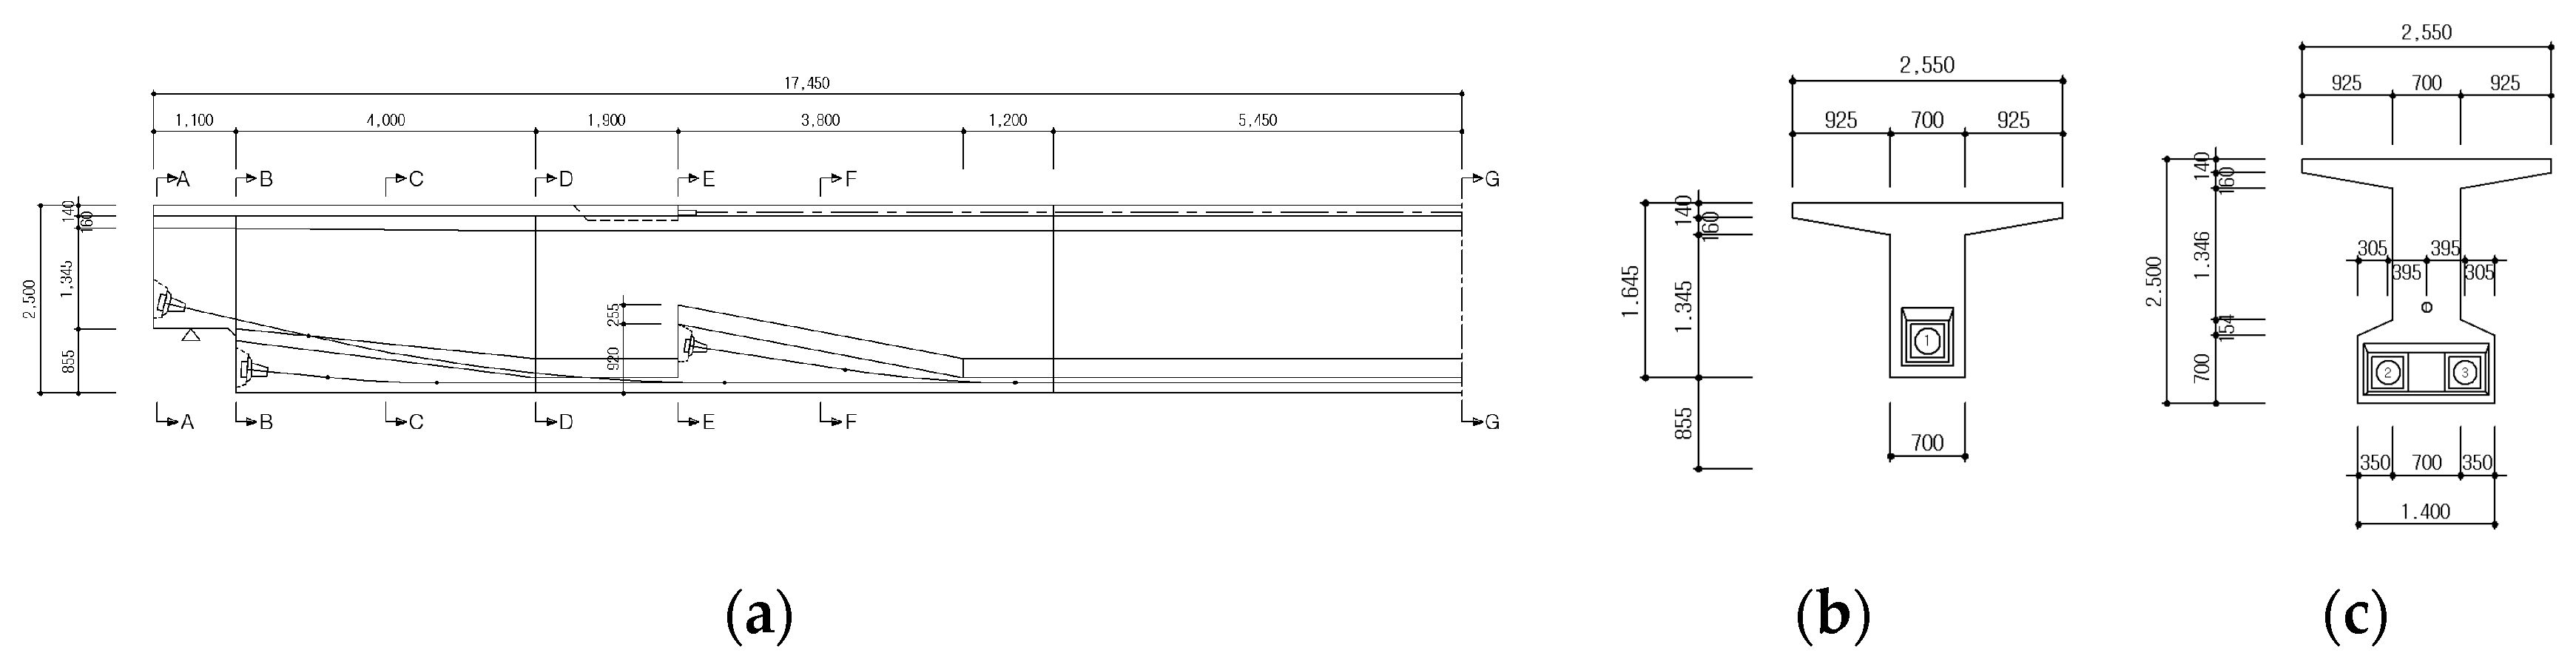
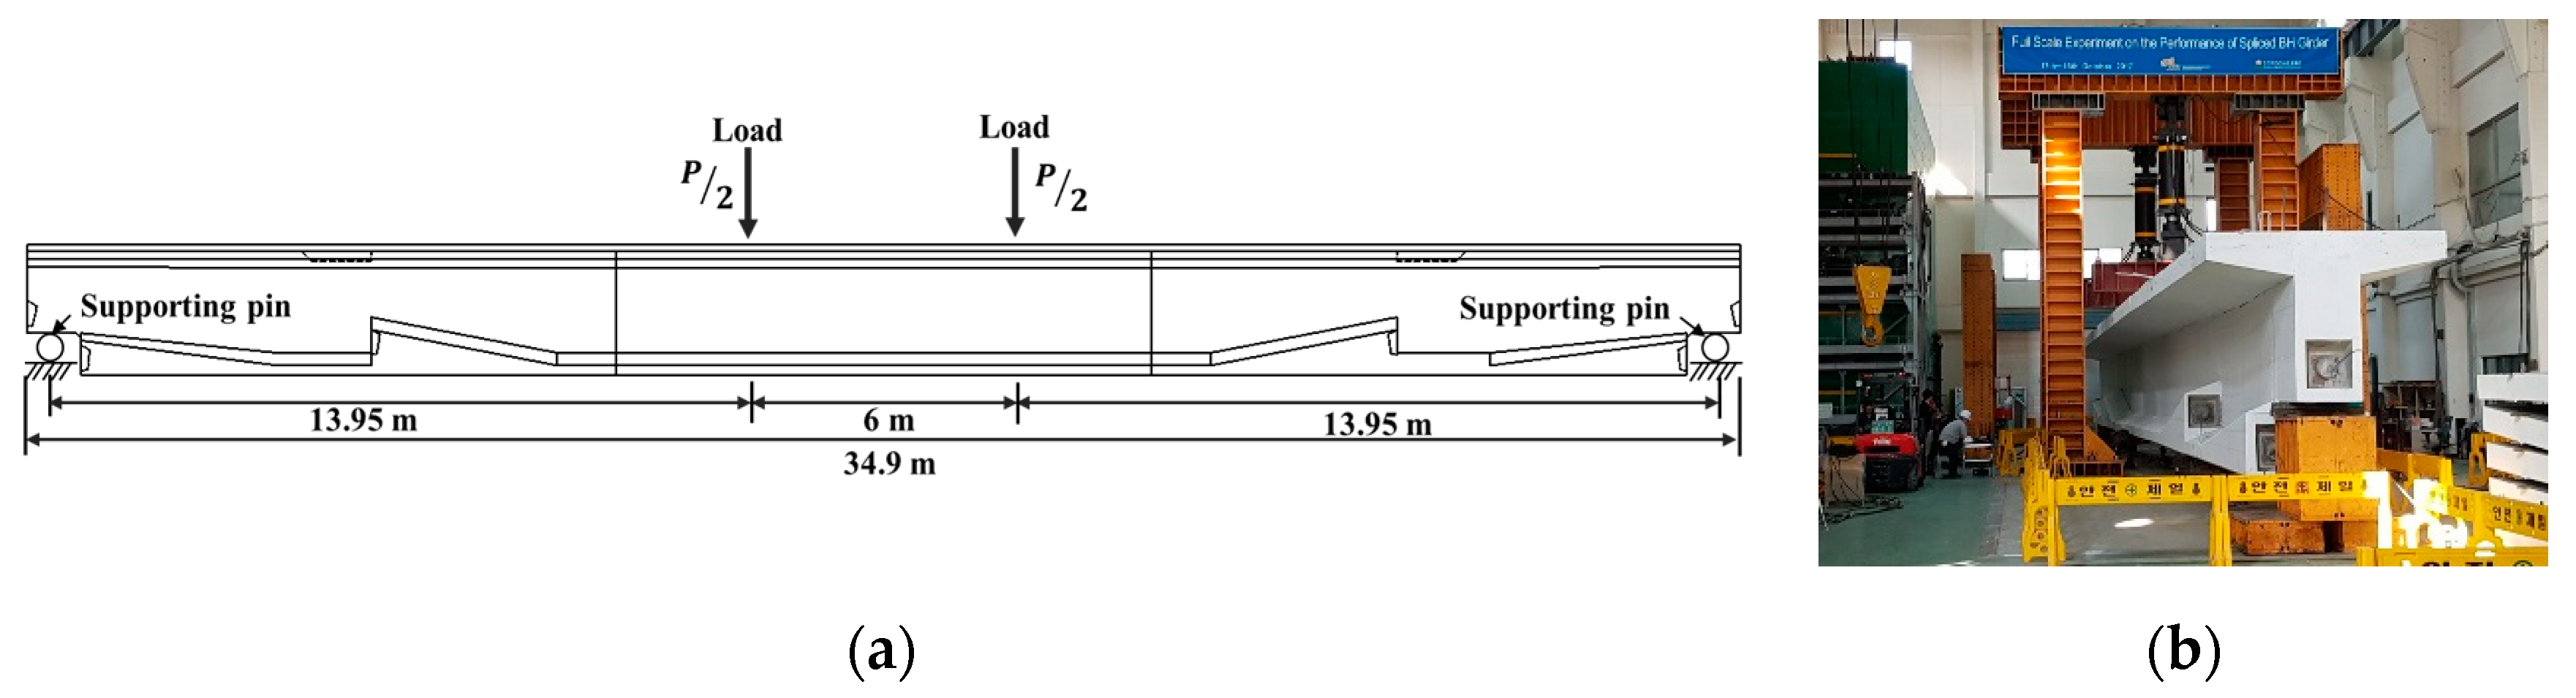
3.1. Full-Scale PSC I-girder Specimen
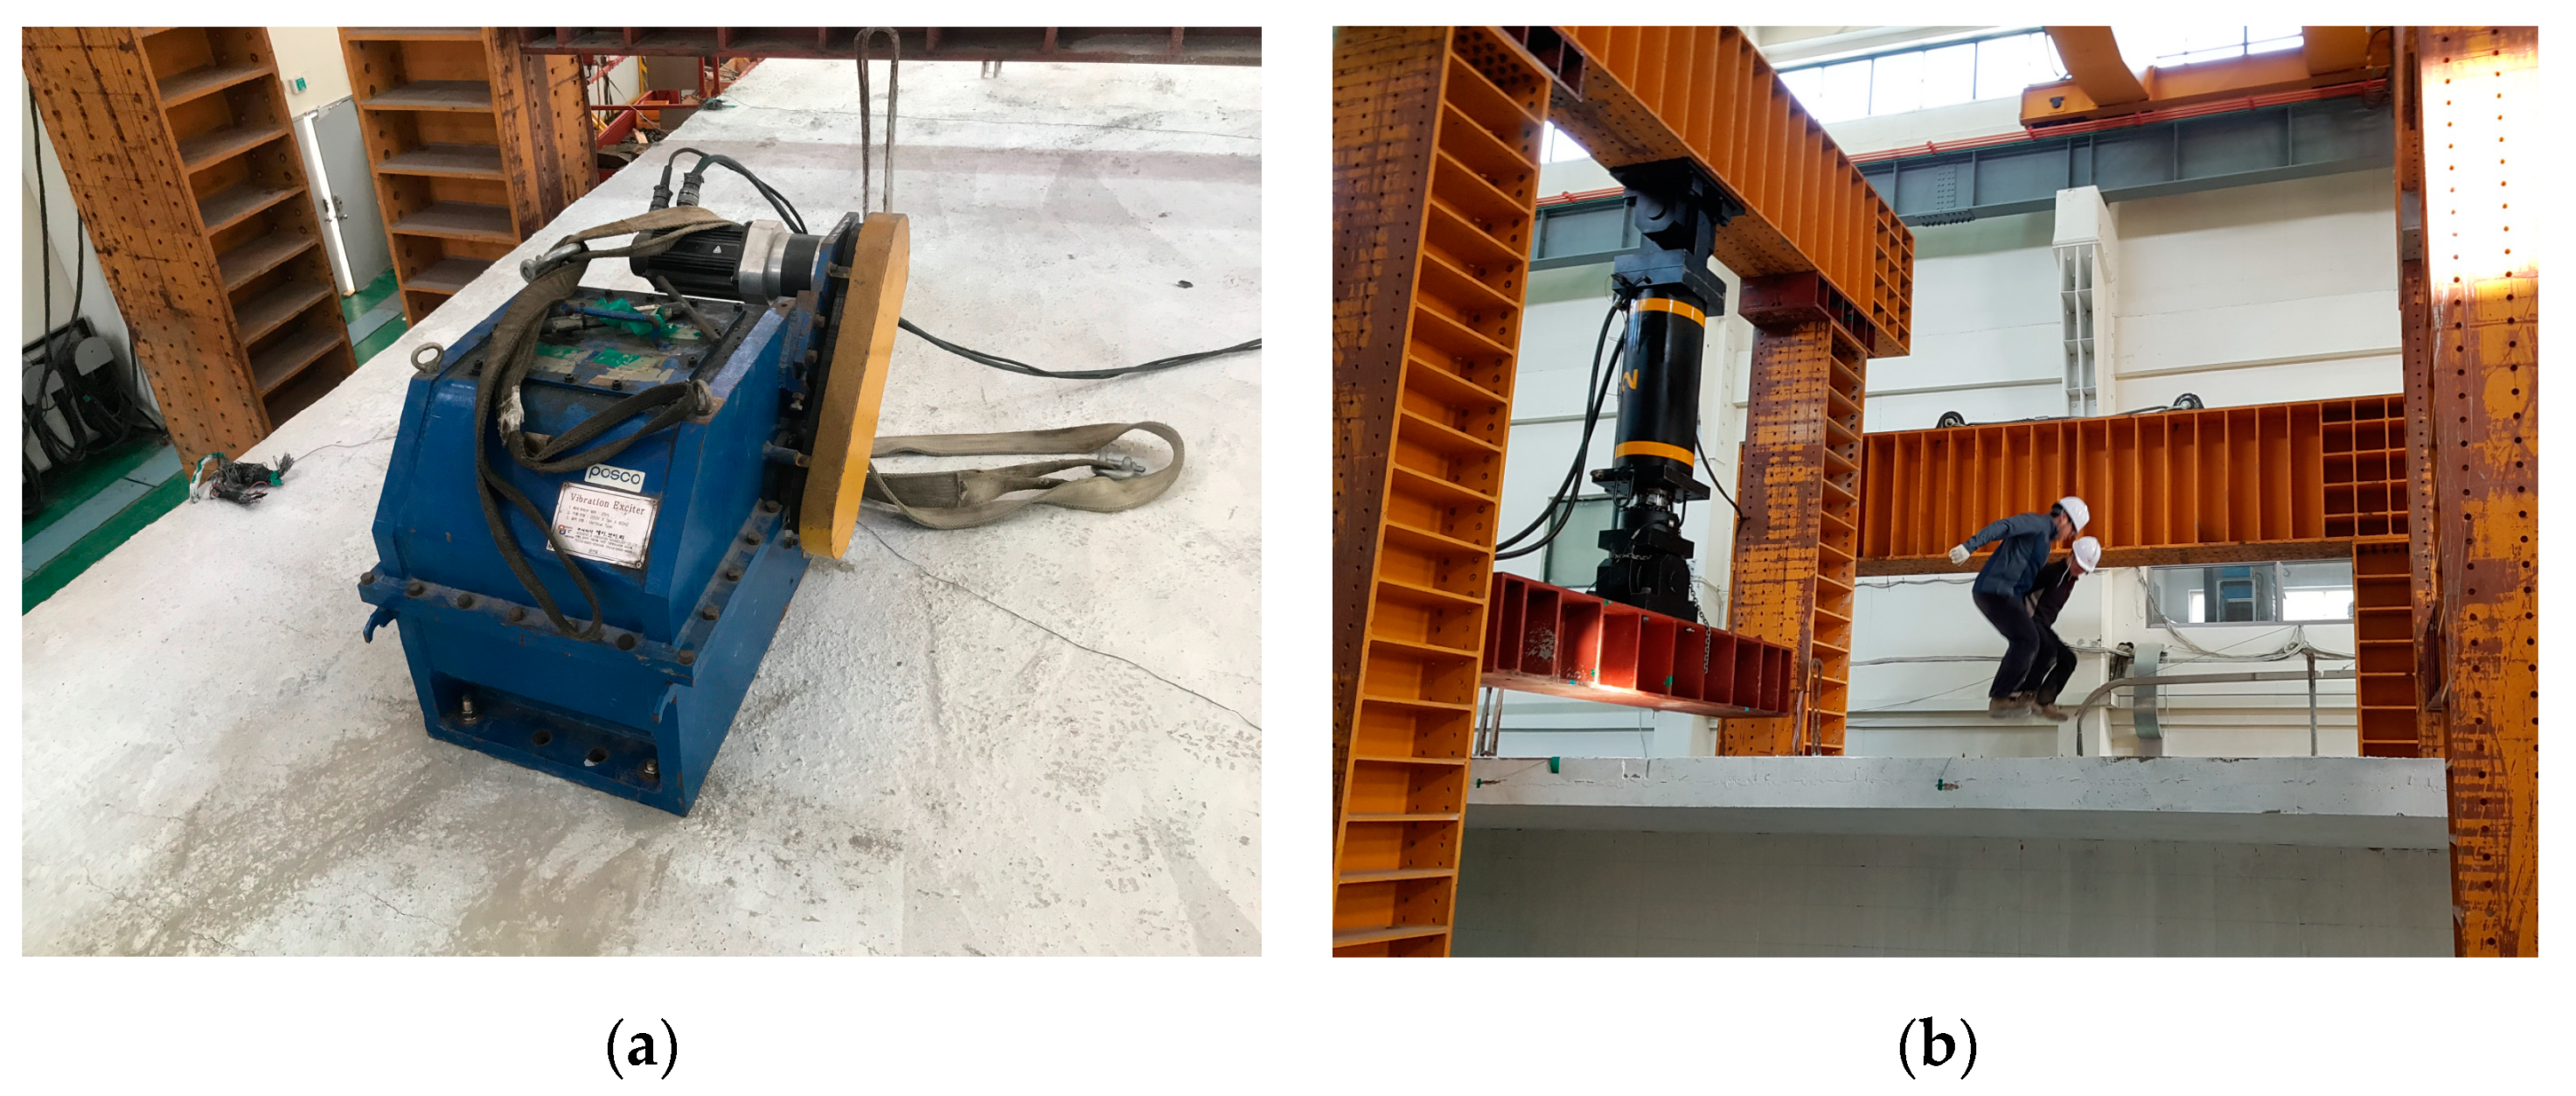
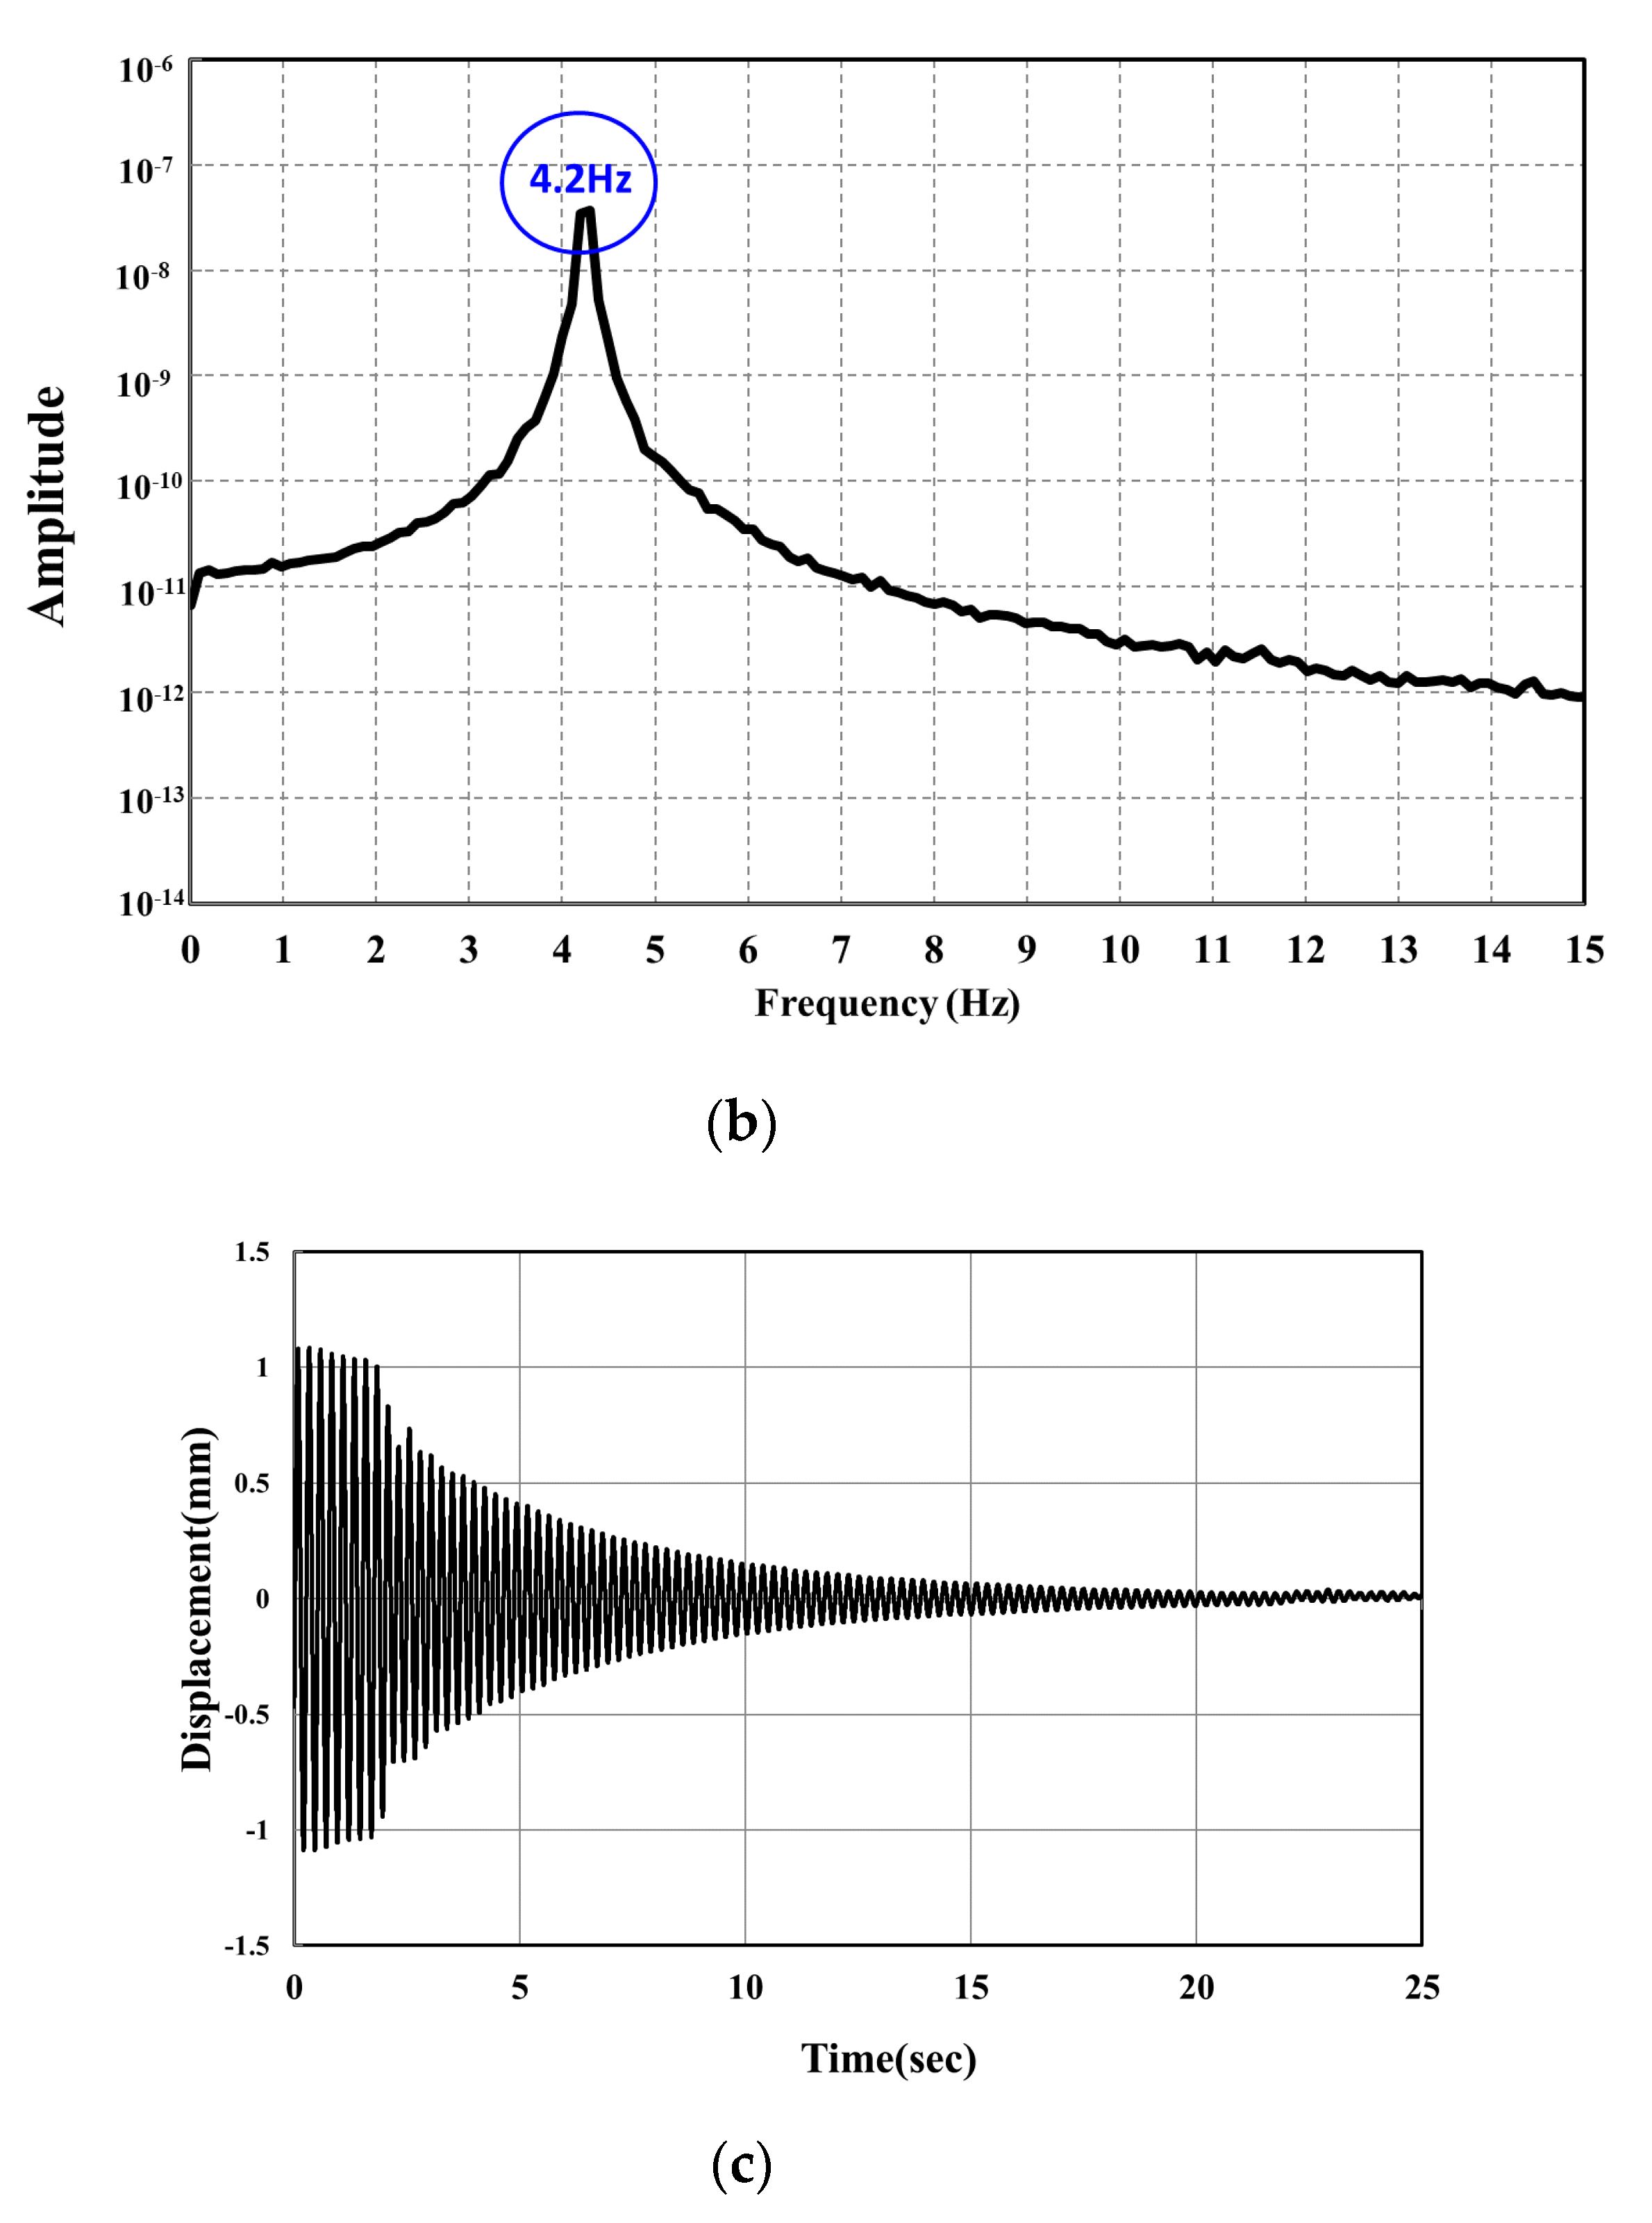
3.2. Evaluation of Dynamic Characteristics
3.3. Evaluation of Ultimate Load Bearing Capacity
3.3.1. Test Method
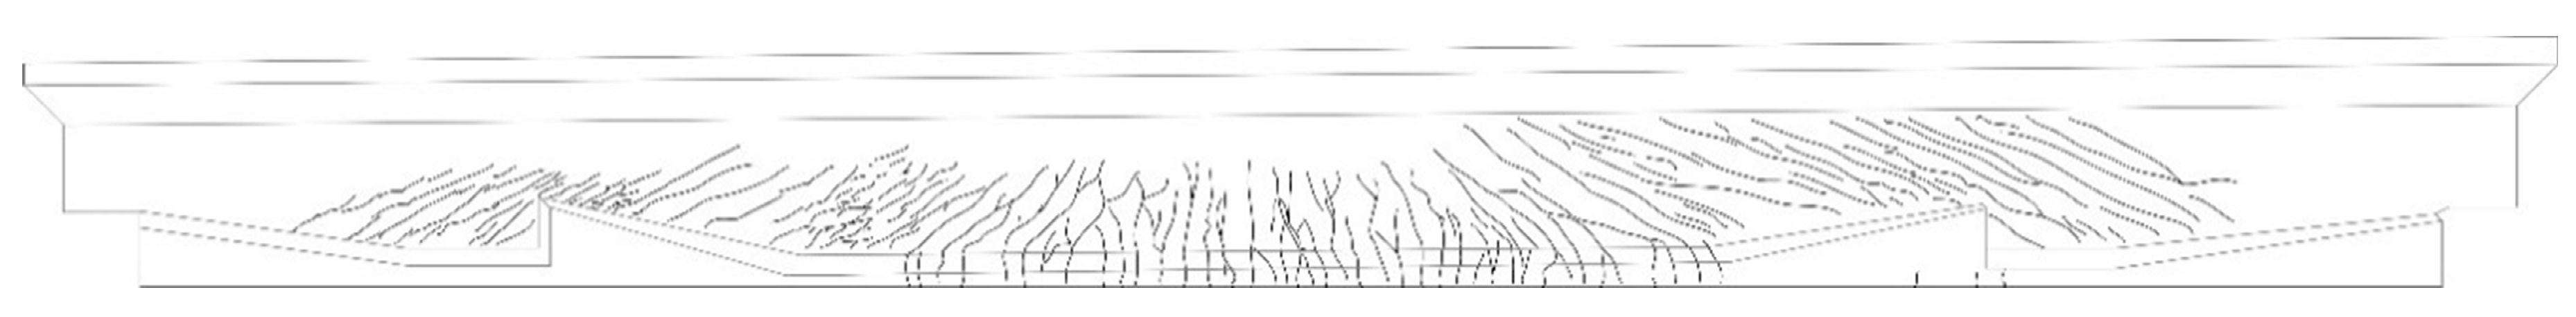
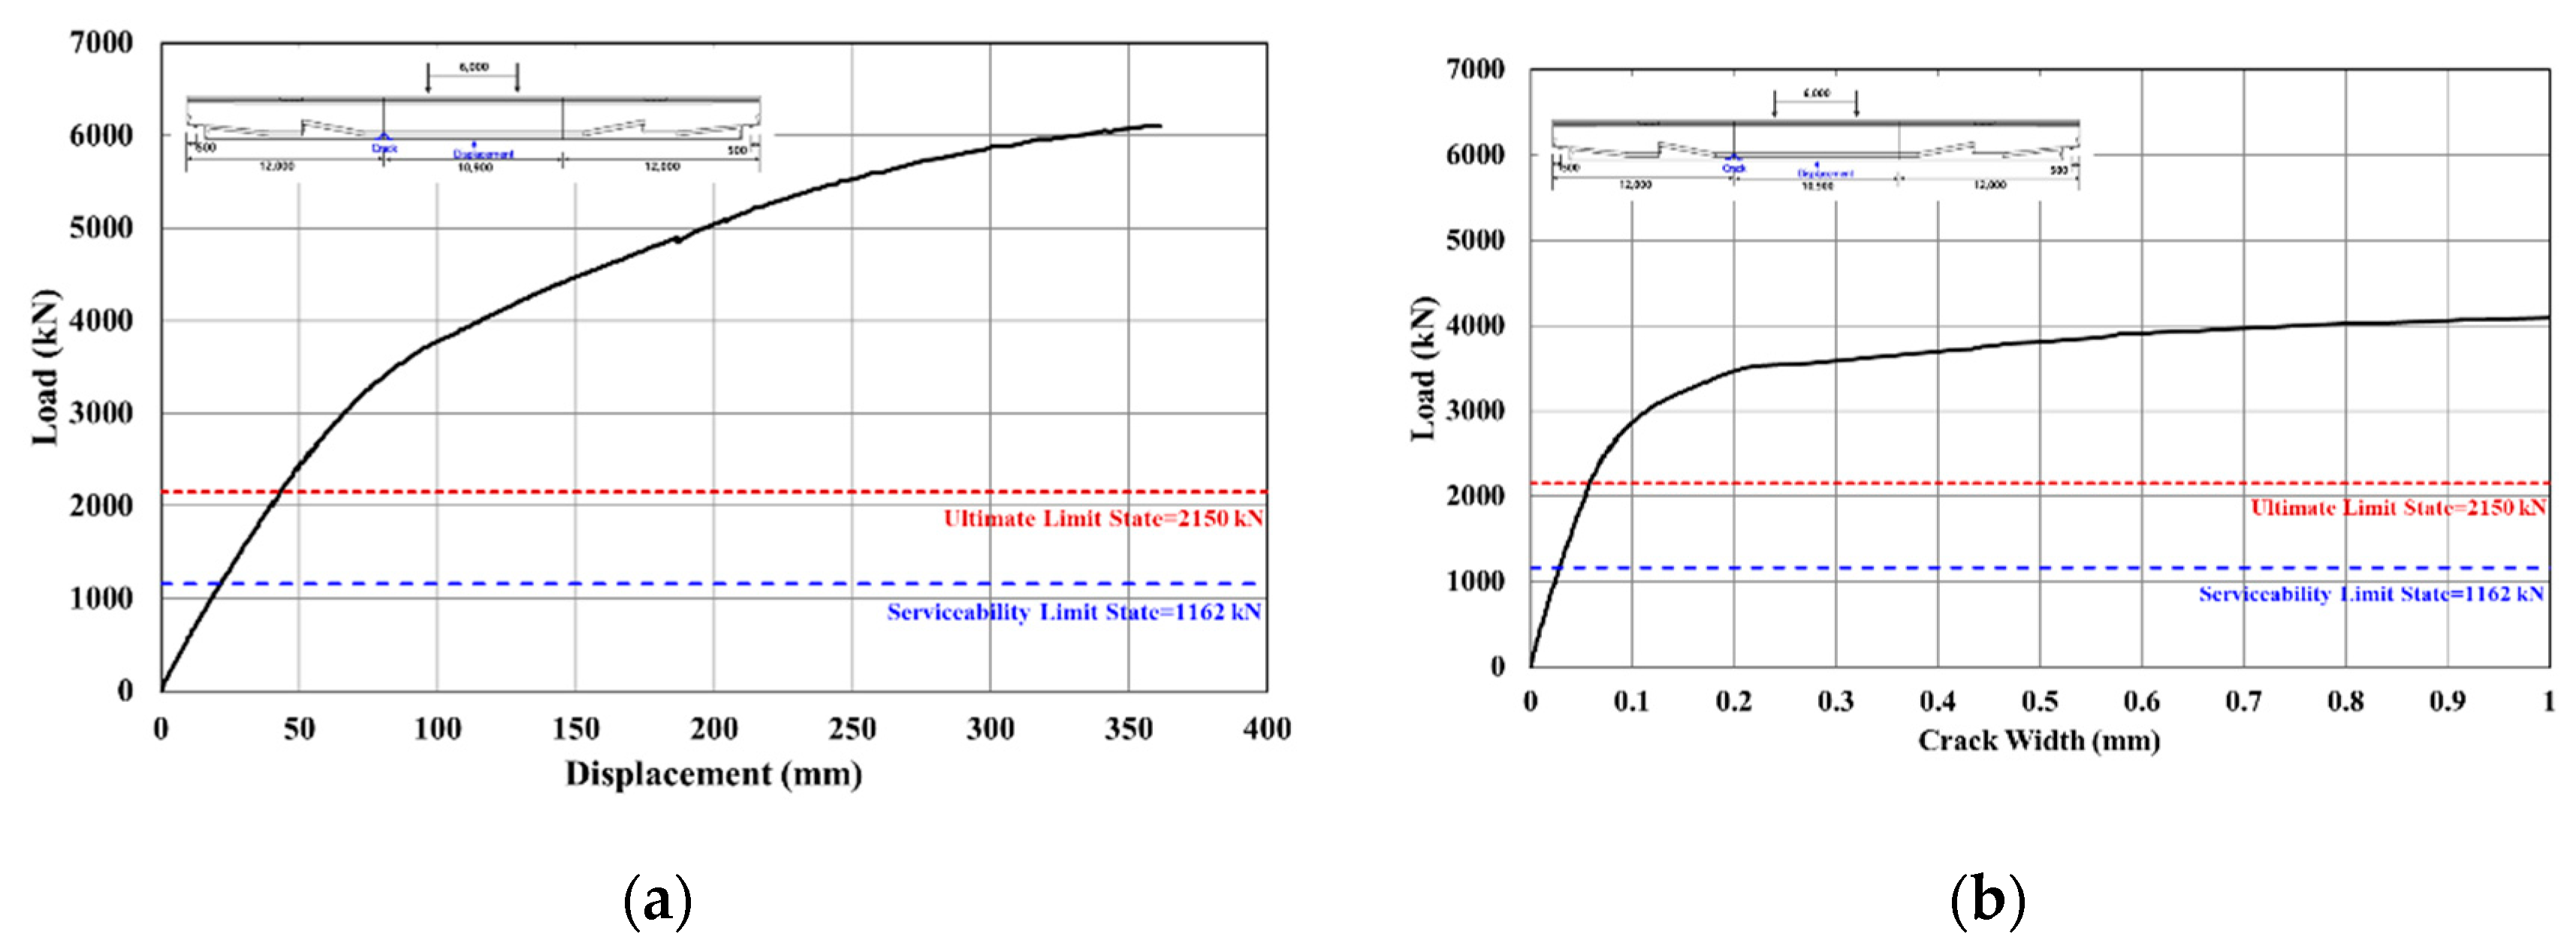
3.3.2. Test Results
4. Conclusions
- (1)
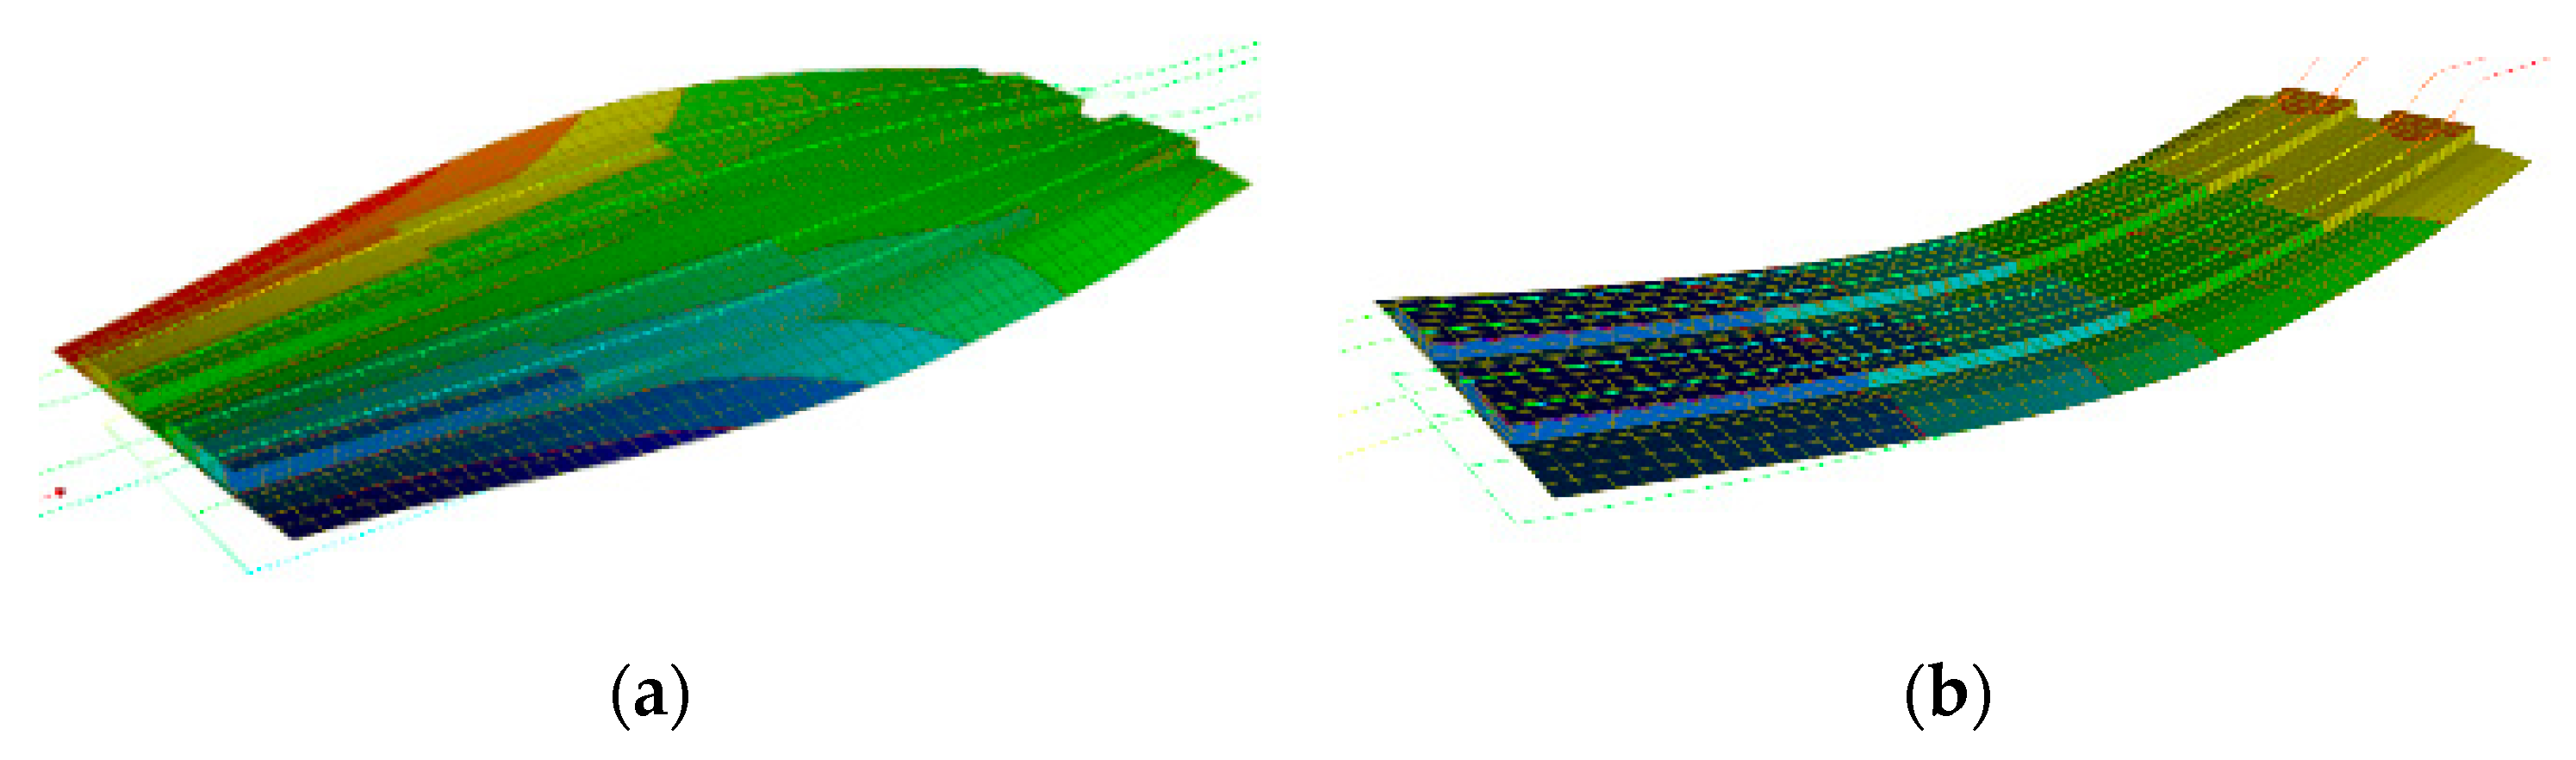
- Natural frequency analysis for the new PSC I-girder range from a span of 30 to 45 m revealed that their first and second mode occur very close, either in bending or torsion mode alternately.
- (2)
- Subsequent moving load analysis was conducted considering 5 types of trains in Korea. The new type of PSC I girder is likely to amplify the dynamic response due to the proximity of the first two modes, but it was found that it satisfied sufficiently all the design limits related to the acceleration, deflection and twist.
- (3)
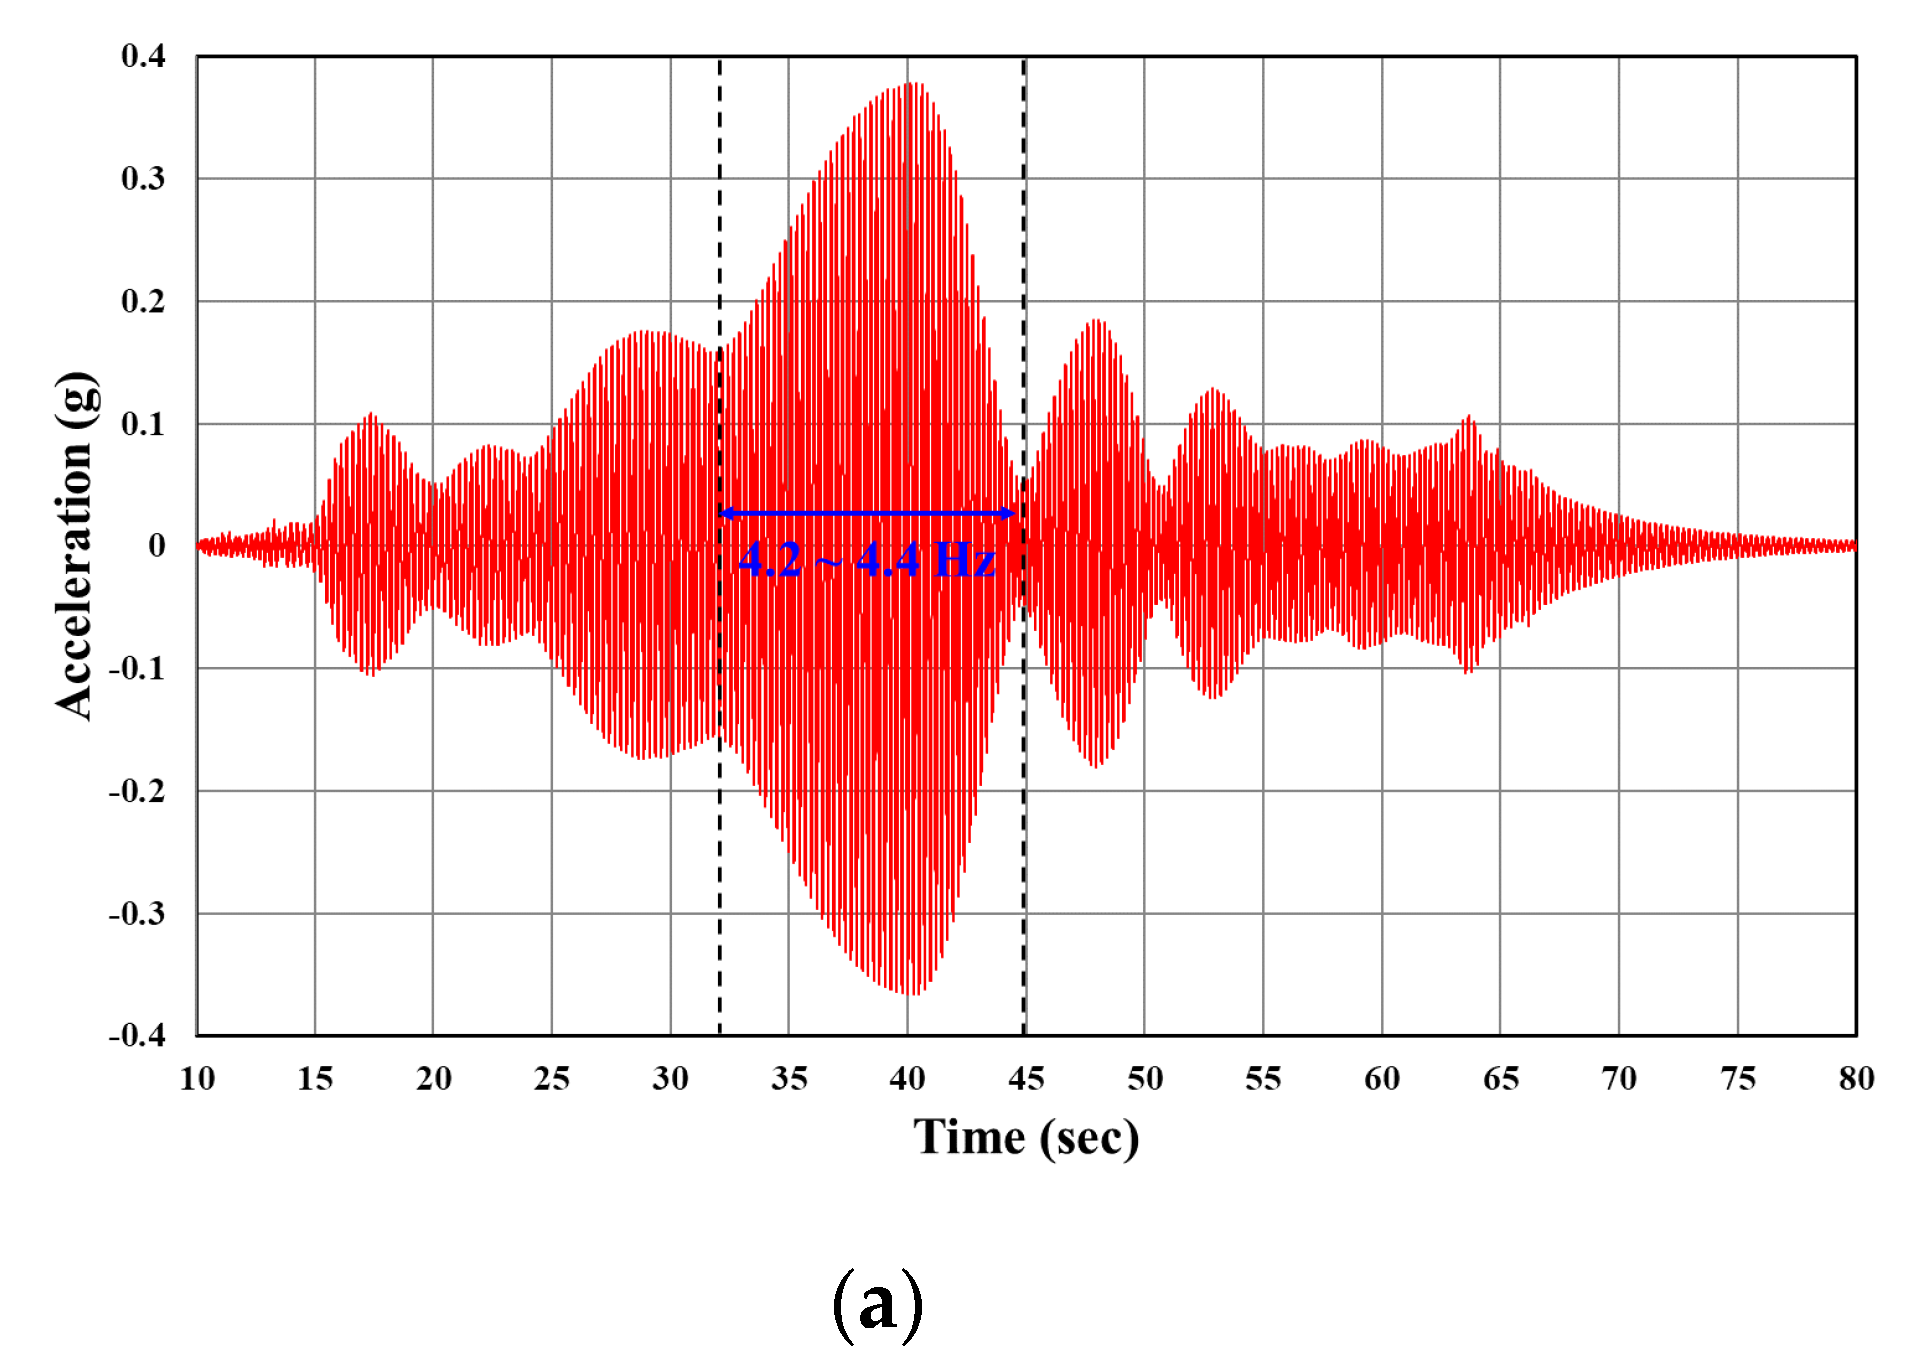
- Experimental verification of natural frequency was carried out on a full-scale specimen with span length of 35 m. The natural frequency (4.2 Hz) of the specimen extracted from the dynamic test results was in good agreement with the value (4.27 Hz) obtained analytically and validated the dynamic analysis model established in this study.
- (4)
- The performance of the specimen observed in the static test secured sufficient safety through the comparison of the load and deflection corresponding to the service and ultimate limit states of the design code. Accordingly, the new PSC I-girder presented in this study develops the dynamic performance and load bearing capacity required for its application in railway bridges and can be applied in new constructions under plan in Korea.
Author Contributions
Funding
Conflicts of Interest
References
- Ministry of Land, Infrastructure and Transport. Yearbook of Road Bridge and Tunnel Statistics; Ministry of Land, Infrastructure and Transport: Sejong, Korea, 2019. [Google Scholar]
- Railway Industry Information Center. Available online: http://www.kric.go.kr/jsp/industry/rss/installlineList.jsp?q_fdate=2018 (accessed on 11 November 2020).
- Jung, W.T.; Kim, Y.J.; Kang, J.Y.; Park, J.S. State-of-the-practice of constructed bridges in Korea. Proc. Inst. Civil Eng.-Struc. Build. 2018, 171, 705–718. [Google Scholar] [CrossRef]
- Bae, K.-M.; Min, K.-H.; Lee, C.-O.; Lim, N.-H. Analysis and improvement of long-term deflection of PSC I girder for railway bridges. J. Korean Soc. Hazard Mitig. 2017, 17, 9–15. [Google Scholar] [CrossRef]
- Lee, J.; Kim, S.; Kwark, J.; Lee, P.; Yoon, T. Dynamic characteristics of high-speed railway steel bridges. Trans. Korean Soc. Noise Vib. Eng. 2007, 17, 632–637. (In Korean) [Google Scholar]
- Hajializadeh, D.; Žnidarič, A.; Kalin, J.; O’Brien, E.J. Development and testing of a railway bridge weigh-in-motion system. Appl. Sci. 2020, 10, 4708. [Google Scholar] [CrossRef]
- Jiang, H.; Gao, L. Analysis of the vibration characteristics of ballastless track on bridges using an energy method. Appl. Sci. 2020, 10, 2289. [Google Scholar] [CrossRef]
- Kaloop, M.R.; Hu, J.W.; Elbeltagi, E. Evaluation of high-speed railway bridges based on a nondestructive monitoring system. Appl. Sci. 2016, 6, 24. [Google Scholar] [CrossRef]
- Cho, J.-R.; Kim, D.; Kim, Y.J.; Kwark, J.-W.; Jang, S.Y. Three dimensional model for dynamic moving load analysis of a PSC-I girder railway bridge. J. Korean Soc. Railw. 2013, 16, 286–297. [Google Scholar] [CrossRef]
- Ministry of Land, Infrastructure and Transport. Bridge Design Loads-General Design Method (KDS 24 12 20:2018); Ministry of Land, Infrastructure and Transport: Sejong, Korea, 2018. (In Korean) [Google Scholar]
- Ministry of Land, Infrastructure and Transport. Bridge Design-General Design Method (KDS 24 10 10:2018); Ministry of Land, Infrastructure and Transport: Sejong, Korea, 2018. (In Korean) [Google Scholar]
- Wakui, H.; Matsumoto, N.; Watanabe, T. Design impact factor for concrete railway bridges. Q. Rep. 1989, 30, 89–96. [Google Scholar]
- Yang, Y.B.; Yau, J.D.; Hsu, L.C. Vibration of simple beams due to trains moving at high speeds. Eng. Struct. 1997, 19, 936–944. [Google Scholar] [CrossRef]
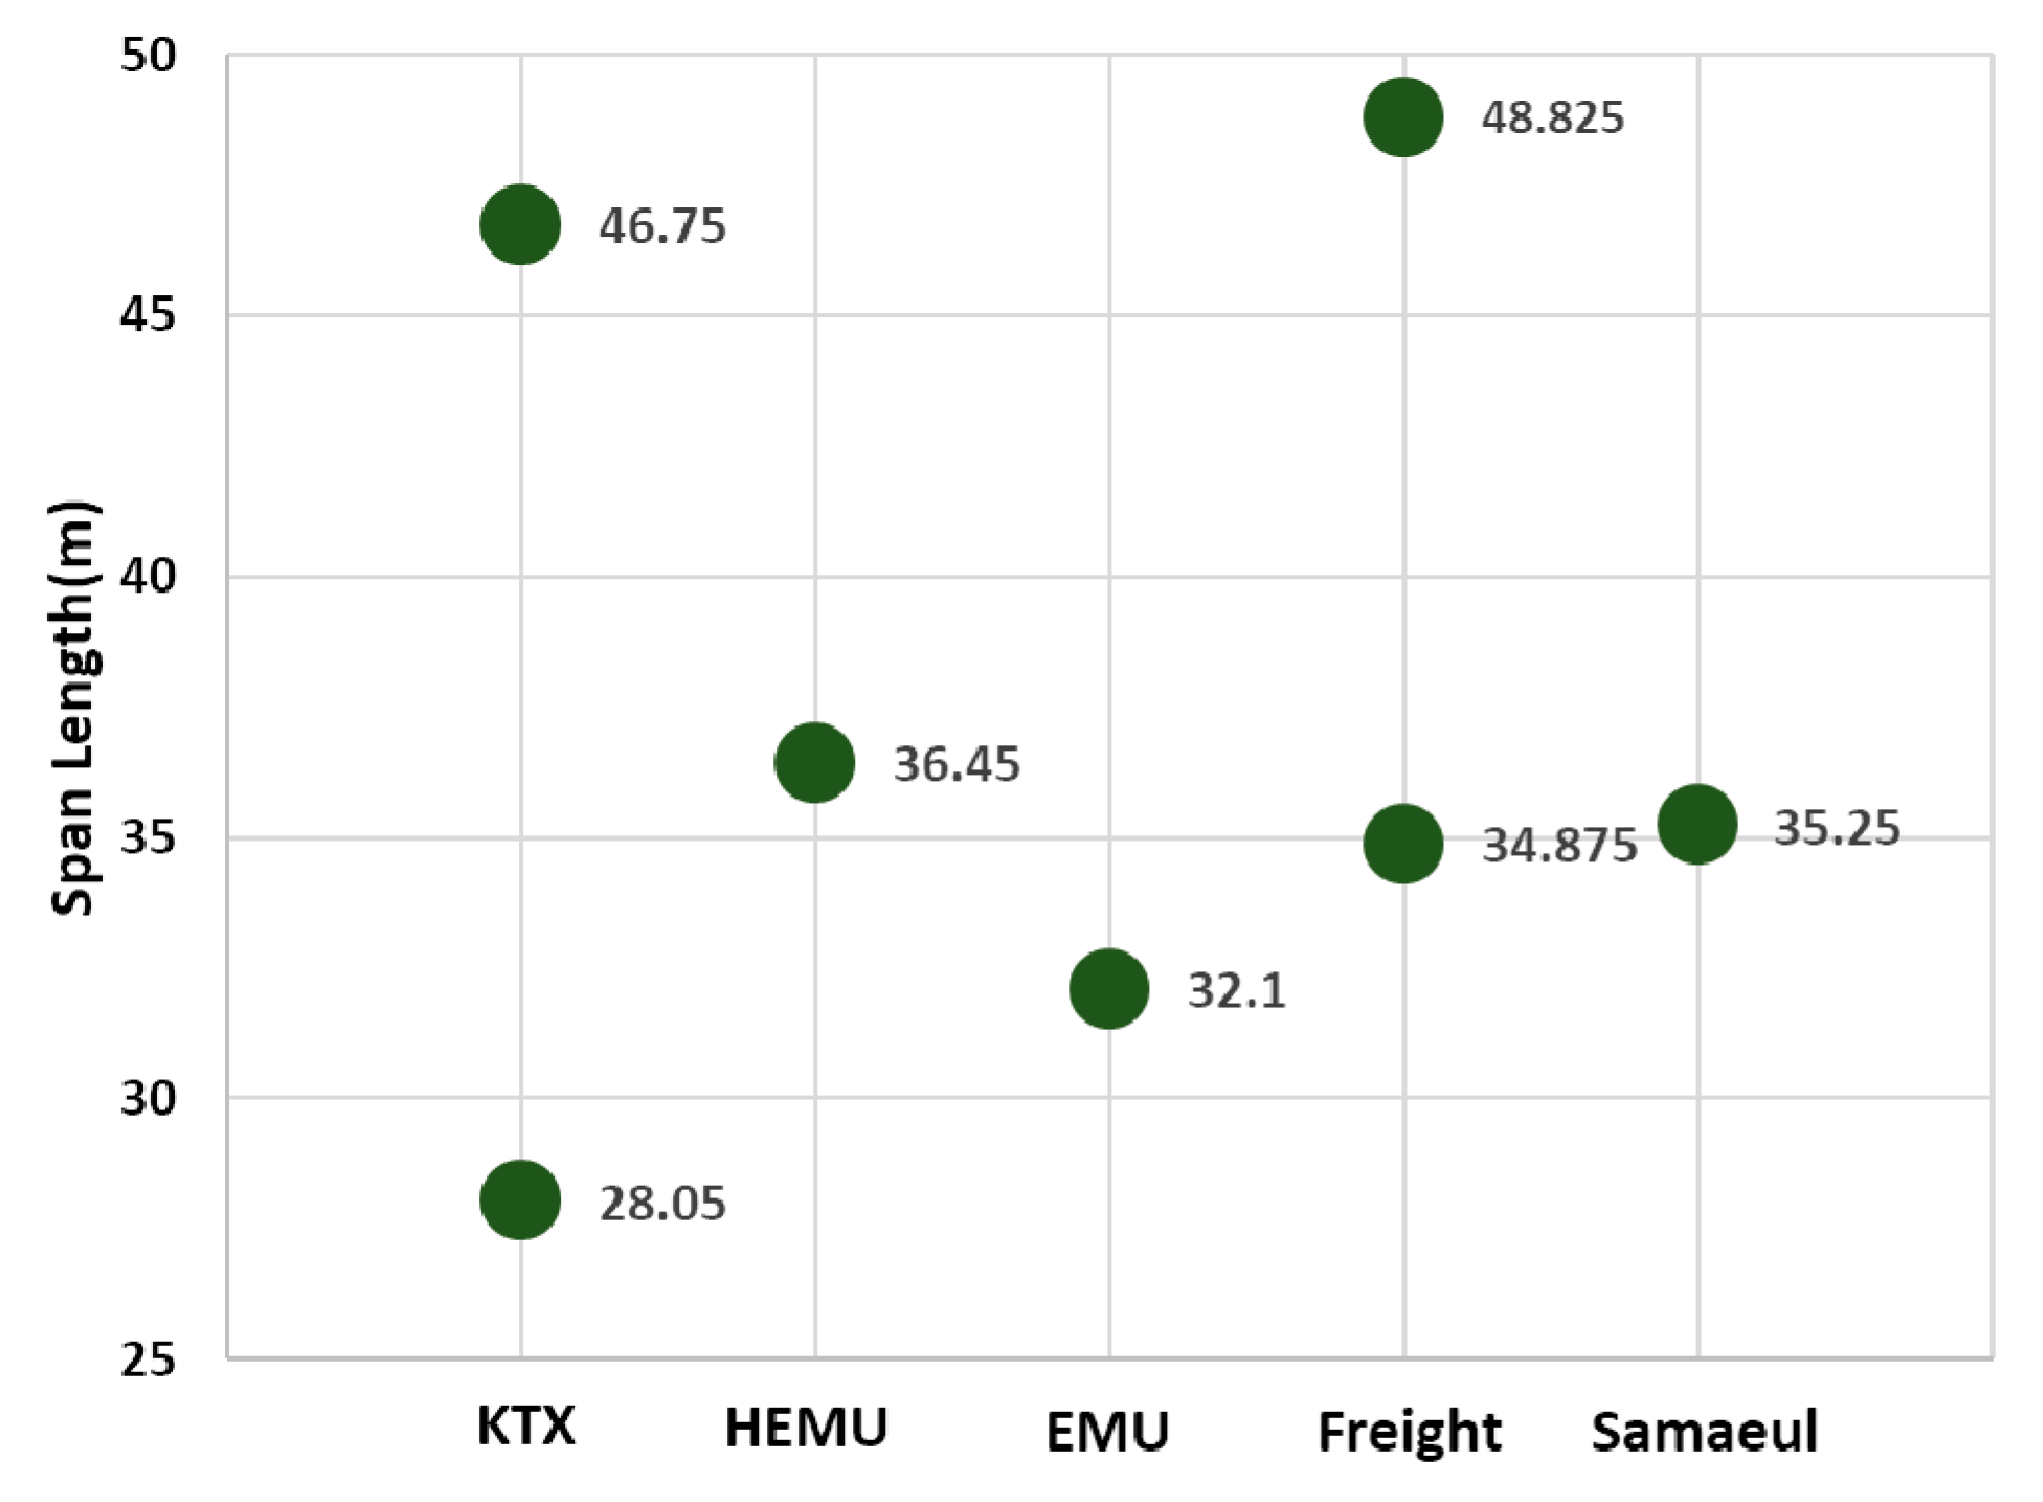
- Kim, S.; Chung, W.; Choi, E. A study on the optimal span length selection of conventional railway bridges considering resonance suppression. J. Korean Soc. Railw. 2005, 8, 137–144. [Google Scholar]


| Bridge Type | Number of Bridges | Total Span (km) | Superstructure Type | Number of Bridges | Total Span (km) |
|---|---|---|---|---|---|
| Suspension | 9 | 21.3 | RC slab | 8271 | 348.1 |
| Cable-stayed | 69 | 74.3 | RC hollow slab | 238 | 22.1 |
| Extradosed | 22 | 14.1 | RC box girder | 211 | 9.4 |
| Truss | 17 | 8.9 | RC T-girder | 751 | 36.0 |
| Internal | 8092 | 173.6 | PSC slab | 491 | 41.1 |
| Arch | 226 | 40.7 | PSC hollow slab | 40 | 7.8 |
| Steel plate girder | 307 | 61.2 | PSC box girder | 625 | 336.8 |
| Steel box girder | 4705 | 1051.7 | PSC I-girder | 7768 | 1009.3 |
| Steel I-girder | 201 | 23.1 | Preflex girder | 1362 | 88.4 |
| Others | 892 | 83.6 | Total | 34,297 | 3451.5 |
| Compressive Strength (MPa) | Young’s Modulus (MPa) | Density (kN/m3) | ||
|---|---|---|---|---|
| Girder | Slab | Girder | Slab | |
| 50 | 30 | 32.902 | 28.577 | 24.5 |
| Item | Application | Limit | |
|---|---|---|---|
| Vertical acceleration | Gravel ballast track | 0.35 g | |
| Concrete ballast track | 0.5 g | ||
| Twist | Standard train load | km/h | 3.0 mm/3 m |
| km/h | 1.5 mm/3 m | ||
| Dynamic analysis with real train | 1.2 mm/3 m | ||
| Vertical deflection | Span length | 30 m | () () () |
| 35 m | () () () | ||
| 40 m | () () () | ||
| 45 m | () () () | ||
| Characteristics | Train in Operation | Train under Plan | |||
|---|---|---|---|---|---|
| KTX | Saemaeul | Freight | HEMU | EMU | |
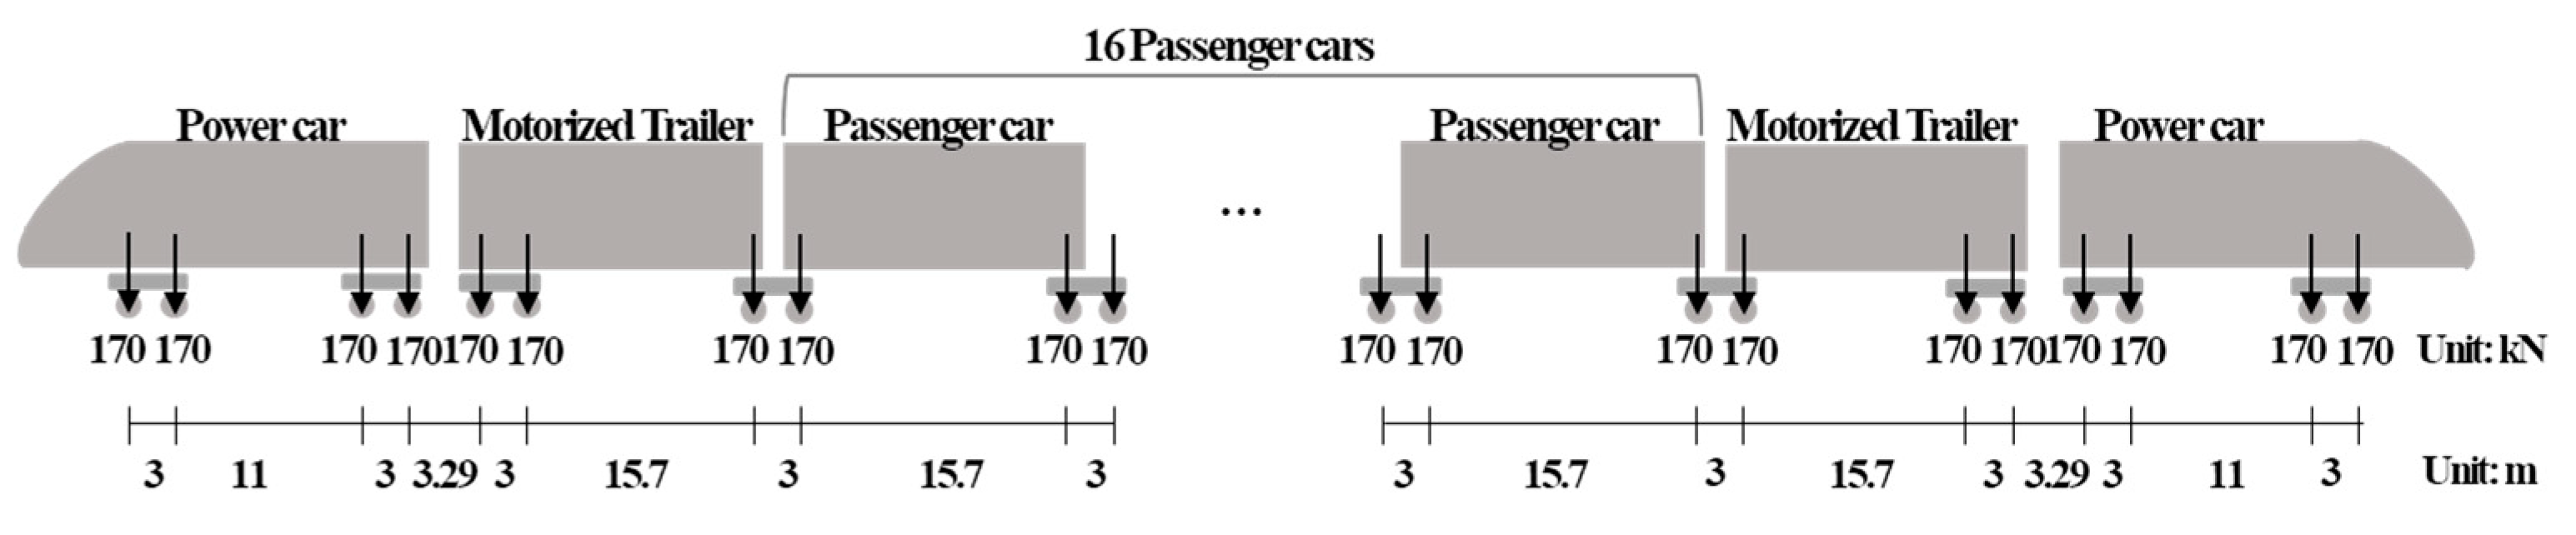
| Composition | 20 coaches | 8 coaches | 20 coaches | 12 coaches | 8 coaches |
| Axle load (kN) | 170~190 | 107.91~215.82 | 196.2 | 130 | 156.8 |
| Effective beating interval (m) | 18.7 | 23.5 | 13.95 | 24.3 | 21.4 |
| Max. speed for analysis (km/h) | 420 | 300 | 220 | 430 | 330 |
| Span Length | Mode | Natural Freq. (Hz) | Critical Speeds (km/h) | ||||
|---|---|---|---|---|---|---|---|
| KTX | HEMU | EMU | Freight | Saemaeul | |||
| 30 m | 1(Torsion) | 4.14 | 278.81 | 362.31 | 319.07 | 207.99 | 350.38 |
| 2(Flexure) | 4.50 | 302.73 | 393.39 | 346.44 | 225.83 | 380.44 | |
| 3(Torsion) | 7.16 | 482.26 | 626.68 | 551.89 | 359.76 | 606.05 | |
| 4(Torsion) | 12.74 | 857.66 | 1114.50 | 981.49 | 639.80 | 1077.80 | |
| 35 m | 1(Flexure) | 4.27 | 288.02 | 374.27 | 329.60 | 214.86 | 361.95 |
| 2(Torsion) | 4.67 | 314.87 | 409.16 | 360.33 | 234.89 | 395.69 | |
| 3(Torsion) | 8.21 | 552.79 | 718.33 | 632.60 | 412.38 | 694.68 | |
| 4(Torsion) | 13.14 | 885.10 | 1150.16 | 1012.90 | 660.28 | 1112.30 | |
| 40 m | 1(Flexure) | 3.56 | 239.92 | 311.77 | 274.56 | 178.98 | 301.51 |
| 2(Torsion) | 3.76 | 253.23 | 329.06 | 289.79 | 188.91 | 318.23 | |
| 3(Torsion) | 7.70 | 518.63 | 673.95 | 593.52 | 386.89 | 651.76 | |
| 4(Torsion) | 11.35 | 763.81 | 992.55 | 874.10 | 569.80 | 959.87 | |
| 45 m | 1(Torsion) | 3.29 | 221.51 | 287.84 | 253.49 | 165.24 | 278.37 |
| 2(Flexure) | 3.39 | 228.47 | 296.89 | 261.46 | 170.44 | 287.11 | |
| 3(Torsion) | 7.66 | 515.39 | 669.73 | 589.80 | 384.47 | 647.68 | |
| 4(Torsion) | 10.12 | 681.48 | 885.56 | 779.88 | 508.38 | 856.41 | |
| Maximum Load at Experiment (kN) | Service Limit State | Ultimate Limit State | ||||
|---|---|---|---|---|---|---|
| Flexural Strength (kN-m) | Load (kN) | Deflection (mm) | Flexural Strength (kN-m) | Load (kN) | Deflection (mm) | |
| 6097 | 8105 | 1162 | 21.9 | 14,995 | 2150 | 43 |
Publisher’s Note: MDPI stays neutral with regard to jurisdictional claims in published maps and institutional affiliations. |
© 2020 by the authors. Licensee MDPI, Basel, Switzerland. This article is an open access article distributed under the terms and conditions of the Creative Commons Attribution (CC BY) license (http://creativecommons.org/licenses/by/4.0/).
Share and Cite
Yoon, H.; Kim, S.T.; Chin, W.J.; Kim, Y.J.; Cho, J.-R. Dynamic Performance of a New-Type PSC I-girder for Railway Bridge Application. Appl. Sci. 2020, 10, 8728. https://doi.org/10.3390/app10238728
Yoon H, Kim ST, Chin WJ, Kim YJ, Cho J-R. Dynamic Performance of a New-Type PSC I-girder for Railway Bridge Application. Applied Sciences. 2020; 10(23):8728. https://doi.org/10.3390/app10238728
Chicago/Turabian StyleYoon, Hyejin, Sung Tae Kim, Won Jong Chin, Young Jin Kim, and Jeong-Rae Cho. 2020. "Dynamic Performance of a New-Type PSC I-girder for Railway Bridge Application" Applied Sciences 10, no. 23: 8728. https://doi.org/10.3390/app10238728
APA StyleYoon, H., Kim, S. T., Chin, W. J., Kim, Y. J., & Cho, J.-R. (2020). Dynamic Performance of a New-Type PSC I-girder for Railway Bridge Application. Applied Sciences, 10(23), 8728. https://doi.org/10.3390/app10238728