Article

Characterisation of Biological Materials at THz Frequencies by Attenuated Total Reflection: Lard

1
Australian Centre for Electromagnetic Bioeffects Research, Swinburne University of Technology, Hawthorn, VIC 3122, Australia
2
Australian Synchrotron, THz Far Infrared Beamline, Clayton, VIC 3168, Australia
3
Optical Sciences Centre and ARC Training Centre in Surface Engineering for Advanced Materials (SEAM), School of Science, Swinburne University of Technology, Hawthorn, VIC 3122, Australia
4
World Research Hub Initiative (WRHI), School of Materials and Chemical Technology, Tokyo Institute of Technology, 2-12-1, Ookayama, Meguro-ku, Tokyo 152-8550, Japan
*
Author to whom correspondence should be addressed.
Appl. Sci. 2020, 10(23), 8692; https://doi.org/10.3390/app10238692
Submission received: 13 November 2020 / Revised: 29 November 2020 / Accepted: 30 November 2020 / Published: 4 December 2020
(This article belongs to the Special Issue Advances of THz Spectroscopy)

Abstract

:
The penetration depth of an evanescent wave in Attenuated Total Reflection (ATR) is dependent on the wavelength of the radiation utilised. At THz frequencies, the penetration depth into biological tissues is in the order of 0.1 to 0.5 mm; rendered pig lard was used as a model sample in this study. A method for the direct measurement of the evanescent wave penetration depth is presented which allows for the estimation of the dispersion of the complex refractive index by using the reflection of the evanescent wave from varying sample depths. The method employs frustrated total internal reflection, and has been demonstrated by using the THz/Far-IR beamline at the Australian synchrotron, and modelled using finite difference time domain (FDTD) simulations.

1. Introduction

There are many established techniques used for clinical assessment of skin pathology of skin tissues, such as photo-acoustic imaging [1], optical coherence tomography [2], confocal reflectance microscopy [3], and high frequency ultrasound [4]. However, no imaging modality has been established for studying skin tissue depths beyond 1.5 mm from the surface. For inherently 3D imaging techniques, the assessment of skin lesions has proved to be difficult with conventional Magnetic Resonance Imaging (MRI), computerized tomography (CT) and positron emission tomography (PET) scanning [5].
Melanoma is the 3rd most commonly diagnosed cancer in Australia, with an annual incidence of 64.4 per 100,000 [6]. The current death rate is about 10% if treated and nearly 100% if left untreated [6,7]. Out of an abundance of caution in ensuring compete removal, ∼60% of cases have more tissue than is necessary excised. Larger excisions, however produce greater morbidity leading to a 20% increase in non-melanoma post-surgical mortality [8]. The precise depth of lesions is clinically important to assess the prognosis and also to plan surgical treatment [8]. The current staging of melanomas includes estimation of thickness, with stage T 1 is < 1.0 mm, T 2 is 1.0–2.0 mm, and T 3 2.0–4.0 mm with melanomas greater than 4.0 mm thickness classified as stage T 4 [8,9,10]. An accurate thickness measurement would reduce the chances of residual melanoma remaining and would help to avoid unnecessarily large surgical resection. The more extensive the resection, the greater the morbidity [8], thus, the problem is not merely the curing of melanoma, but also minimal post-surgical morbidity and deformity. Characterisation and imaging of up to several millimeters of skin is of paramount importance and can be only achieved by combination of different optical techniques over the UV-vis-IR-THz spectral ranges. The permittivity (complex refractive index) at this wide spectral range should be known for different materials encountered at the surface (0–4 mm) of skin.

1.1. Penetration Depth of THz: Bio-Medical Applications

Terahertz (THz) radiation is highly absorbed by liquid water, as such, this presents the possibility to image skin using the difference in water content between normal skin and pathological skin lesions. However, the potential depth is presently limited to 0.2–0.3 mm. A unique feature of water is that in the 0.1–2.0 THz radiation window, ice has an absorption coefficient around 1.0–5.0 cm 1 while 150–200 cm 1 in the liquid phase [11,12,13,14,15,16]. Consequently, 90% of the incident 0.45 THz signal reaches a 1 mm depth in ice, whereas only < 0.0001 % does in liquid. Except for the uppermost skin layer, the stratum corneum, human skin contains 70–72% free water [17], whilst many cancers, including melanomas, contain on the order of 82–85% free water [18]. The “dry” skin elements do not show the same absorption coefficient change on freezing as water does. Thus, when skin is frozen, the water content changes from being the principal absorber, to becoming a minor contributor of THz radiation absorption. The resulting greater contrast is potentially useful for local assessment of skin pathology to a depth of 5.0 mm in frozen skin. The in vivo therapeutic freezing of skin is an established and common medical procedure for treatment of skin diseases such as solar keratoses, warts, and some basal cell cancers. THz imaging techniques using frozen skin would be built upon established clinical cryotherapy methods. In this regard, the high brilliance synchrotron radiation is of especial interest for the proof of the concept experiments for large penetration depth; the brilliance B is defined as the number of photons N λ of energy h ν (J) and direction within the solid angle Ω (mrad 2 ) per unit of time t (s), area A (mm 2 ), and 0.1% of the bandwidth, B W (J), as B = N λ h ν / ( t A Ω 0.1 % B W ) . High brilliance of synchrotron radiation is essential for a more than one order of magnitude better signal-to-noise ratio of absorbance quantification as compared with conventional thermal sources used in standard desktop Fourier transform IR (FTIR) spectrometers at comparable data acquisition conditions. It is foreseeable that THz-IR diagnostics facilities can be established at the synchrotrons which are operational 24/7. High intensity THz beams can be generated on-demand using tightly focused ultra-short laser pulses irradiating micro-jets of water or other liquids [19,20]. Sub-wavelength < 1 mm localisation of THz emission from the waist of the focal region can be a useful feature for engineering of practical THz emitters. Interestingly, hard X-rays are simultaneously emitted at the similar focusing conditions and might be used for a sub-surface characterisation [21].
It is imperative that accurate dielectric properties of frozen and non-frozen skin (and its appendages such as hair and sweat ducts) be better understood over the 0.1 to 2.0 THz band. While normal melanocytes export the melanin to surrounding cells, the melanin tends to accumulate in the cancerous cell with melanin levels reaching up to 80 mg/cm 3 [22]. The dielectric properties of frozen melanin also need to be measured as well as the dielectric properties of frozen skin at various hydration levels. The likely method for the deployment of the “THz-skin freeze” technique for measuring melanoma depth would be performed just before the actual surgery. This would require robust, predictable, and fast THz imaging technology. The current capacity of THz systems to image surfaces in sufficient detail and with adequate speed is restricted by both expense and technical limitations. The impetus for the deployment of faster and more sensitive THz systems will only come if there is a practical application that demands such development. The THz-skin freeze method of skin imaging and other applications based on the disparity between the THz dielectric properties of liquid and frozen water can provide the motivation for development of better THz technology. Noteworthy, a realistic numerical model which takes into account material properties and geometry of structures and their composition could immensely help in prediction of light (vis-to-THz) penetration to different depths under the skin for conditions at surgery under freeze conditions. For the THz spectral range, such efforts have been started [23]. In this study, we used rendered pork lard as an analog for the “dry” portion of skin. It was experimentally determined that THz absorption of different fats and oils is very similar [24]. More complicated and realistic skin models will evolve and will be useful for definition of numerical phantoms of the actual skin.

1.2. Attenuated Total Reflection

The technique of attenuated total reflection (ATR) spectroscopy has become a popular method to measure dielectric properties of materials as well as for sensors that use small changes in the refractive index at the interface as a detection mechanism. It relies on the reduction of the reflected signal intensity at the the total reflection angle, i.e., there is no transmitted wave into the sample (placed on top of the ATR prism, see Figure 1). The technique relies on the incident energy being absorbed via an evanescent wave generated in the interface between sample and prism. The advantage of the method lies in the fact that solid and liquid samples can be studied with minimal preparation. This is exceptionally useful for the THz spectral window since free space propagation of THz radiation under normal conditions is strongly attenuated due to absorption by water vapor. The observed ATR spectrum is noted to be nearly equivalent to that of the transmission type, which suggests that the technique is sampling the absorption coefficient of the sample at the given frequency. If the absorption of the evanescent wave is negligible, the penetration depth, d p , of the evanescent wave is given by [25]:
d p = n 2 λ 2 π n 1 sin 2 θ ( n 2 / n 1 ) 2 ,
where λ is the wavelength, n 1 and n 2 are the real parts of the refractive index of the ATR crystal and sample (from medium 1 to 2), respectively, and θ is the angle of incidence of the incoming radiation. Since sin 2 θ ( n 2 / n 1 ) 2 has to be a real number, sin θ > ( n 2 / n 1 ) , this sets the limit on the refractive index of the sample for a given ATR crystal. ATR has found its use at infrared frequencies from 30 to 400 THz, where the d p is in the order of 1 μ m for biological tissue with the refractive index n 2 1.5 . At these distances, the total absorption of the evanescent wave is, indeed, negligible. At low terahertz frequencies (0.3 to 3 THz) the wavelength λ is on the order of 1.0–0.1 mm, which yields a d p changing from 308 μ m to 31 μ m for the n 2 = 1.52 and ATR prism n 1 = 2.42 . The absorption of the evanescent wave becomes not be negligible at such depths in the biological tissues. A more elaborate equation for the reflected wave intensity, using the complex refractive index n * = n + i k , where k is the imaginary part of the complex refractive index n * is required when polarisation becomes important. The reflection coefficients for s- and p-polarisations can be expressed following ref. [26], i.e., the R s (a transverse electrical TE-mode):
R s = ξ η ξ + η
where ξ = α 2 + x 2 + y 2 , η = 2 α x 2 + y 2 x , x = β + n 2 k 2 , y = 2 n 2 k , α = cos θ , β = sin 2 θ n 2 and the relative refractive index n = n 2 / n 1 ; the absorption coefficient for intensity is linked to the imaginary part of refractive index k as α a b s 4 π k / λ and is usually measured in transmission from the Beer–Lambert law I o u t = I i n e α a b s d for thickness d; noteworthy, optical losses fitted by the Beer–Lambert law can also be due to scattering that also takes place in biological materials.
The R p (a transverse magnetic TM-mode) is given by [26]:
R p = u v u + v
where u = α 2 ( ( sin 2 θ x ) 2 + x 2 + y 2 ) , v = 2 α [ ( n 2 n 2 k 2 ) [ x 2 + y 2 x ] / 2 ] + y [ x 2 + y 2 x ] / 2 . For a given λ and n 1 (diamond), this formulae delivers the complex refractive index of the sample ( n + i k ) for given angle of incidence θ . Equations (2) and (3) are used to determine n and k from the reflectivities R s and R p . Knowing either n or k independently, it is possible to calculate the other parameter. It is noteworthy that this formalism is applicable for weakly absorbing materials [26] and is discussed in the more details below.
Here, we demonstrate the ATR technique for determination of refractive index ( n + i k ) of biological sample (rendered pork lard) at the Australian Synchrotron THz beamline. Experimental results follow qualitative predictions of numerical simulations made by the finite difference time domain (FDTD) solution of Maxwell’s equations.

2. Experimental: Setups and Samples

2.1. Synchrotron Radiaton and ATR

THz/Far-IR beamline at the Australian Synchrotron was used in this study. Polarisation of synchroton radiation has a combination of a linear (along the extraction mirror slit; y-orientation in Figure 1) and circular polarisations [27]. The origin of those two components is due to the bending magnet caused emission (inside the magnet) and the edge-emission (at the entrance/exit magnet edge). The THz and IR microscopy beamlines share the synchrotron radiation extracted from the magnet. Polarisation is defined in the plane of incidence as E s and E p , which are ⊥ and ‖ to the plane (or TE and TM modes), respectively. For anisotropic samples, those two components will be absorbed differently, i.e., alignment of the absorbing dipoles. This opens up the possibility for determining anisotropy of absorbace in the sample. The s-pol. (TE or E y in Figure 1b) is probing orientation of dipoles in the plane of ATR crystal. The reflected light at typical 45° incidence usually does not experience phase change upon reflection at the sample–prism interface (see Appendix A for phase change upon reflection) for low refractive index n 1 < 1.6 samples, which is typical for bio-materials. However, the p-pol. (TM; E z in Figure 1b), which probes the absorbance in the direction perpendicular to the prism-sample interface has a strong dependence of the reflected phase on n 1 . At θ i = 45 ° incidence, a phase change of π occurs when θ B < θ i < θ c ( θ B and θ c are the Brewster and critical angle, respectively. See Appendix A for definitions) and the reflected E z component becomes E y . The consequence of the phase dependence of the TM mode makes polarisation analysis of ATR signals complicated, and most of the published data does not discriminate polarisation. We followed this approach in the current study and will carry out future experiments with a defined incident polarisation combined with polarisation analysis at the exit.
A Bruker IFS 125/HR Fourier Transform spectrometer (Bremen, Germany), with a Si bolometer, 75 μ m Mylar beamsplitter and a diamond prism stage (refractive index of n 1 = 2.42 ) was used. Data analysis was carried out with OPUS 8.0 software (Bruker Optik GmbH, Ettlingen, Germany). We used modified frustrated internal reflection (FTIR) technique. The evanescent wave reflection by a gold plated mirror with a varied separation from the ATR diamond crystal surface was installed. In this way, the wave is redirected back to the detector. The experiments were conducted over the frequency range of 0.91 to 1.01 THz due to high brightness of synchrotron radiation at this frequency window. It is noteworthy, that Australian Synchotroton has the capability to generate coherent synchrotron radiation (CSR) at the spectral window of 15–25 cm 1 (0.45–0.75 THz in frequency or 0.667–0.4 mm wavelength) which is available at the THz beamline. In the case of CSR, the radiated power is proportional to the P N 2 rather P N for the incoherent radiation, where N is number of electrons in the bunch. The presented methodology of measurements of lard sample is directly applicable for the CSR mode.

2.2. Modeling

Simulations were conducted using Finite Difference Time Domain (FDTD) solver, XFdtd Bio-Pro, (v.7.6.0.5.r48456, Remcom, State College, PA, USA). The simulations were analysed with point sensors acting as detectors 0.015 mm outside the diamond prism (Figure 2).
The model sample used was rendered pig lard. It has experimentally established dielectric parameters in the 0.9 to 1.0 THz spectral window with the refractive index of n 2 = 1.48 and the absorption coefficient α a b s = 8 cm 1 ; k 2 = α a b s λ / 4 π [24]. The simulations were conducted with the same parameters. The spacing over the ATR crystal was achieved with prefabricated non-reflective polypropylene spacers with 0.05 mm thickness. The diamond ATR crystal had a refractive index of n 1 = 2.42 at the THz wavelengths used.
The ATR reflection coefficients were modeled using Equations (2) and (3) in Section 1. The fraction of reflected radiation at the surface is dependent on the real and imaginary part of the sample and is plotted for s- and p-polarisations (Figure 3). The reflectance drops with increasing absorption coefficient (Figure 3a) and increases with frequency (Figure 3b), hence, the portion of light coupled into evanescent wave is smaller. The evanescent waves are more important at lower frequencies, and the ATR reflection technique will be more sensitive to changes in the absorption coefficient smaller than 15 cm 1 .

3. Results and Discussion

3.1. Polarisation of Synchrotron Radiation

The polarisation of ∼1 THz beam was not controlled as the beam was delivered to the ATR prism from the input port (Figure 1a). This is the condition when maximum intensity is obtained on the sample (lard), which does not have absorption anisotropy in our case. At this particular frequency of ∼1 THz (33 cm 1 in wavenumbers), the THz/Far-IR beamline receives approximately 90% linear polarisation dominated by the edge radiation (emitted at the entrance and exit of the bending magnet). This was established by direct measurement in direct transmission without the ATR compartment [27]. The direct measurement was carried out to analyse polarisation content which is complex. Numerical modeling of the synchrotron emission predicts the dipole emission with linear polarisation is aligned along the magnet slit and across the broad Far-IR band of 3–30 THz. This is at a lower portion as compared to the edge radiation, which is circularly polarised. The experimentally determined polarisation was 90% linear and 10% circular due to sum of the linear and circular polarisations at < 100 cm 1 . This translates to the prevailing s-pol. on the sample placed on the ATR window for the measurements.

3.2. THz Spectra of Lard

Figure 4 shows experimental data of the ATR spectra measured from different lard thicknesses d with a back-reflecting Au-mirror on the top of the rendered lard. Most of the synchrotron radiation was in the spectral window of 20–40 cm 1 (this window includes CSR, which was not used in this particular experiment). This region provides possibility to determine lard absorption with the highest signal-to-noise ratio. This spectral window around 1 THz is shown in Figure 4b; for sake of comparison normalisation to transmission of ATR in air is shown as well. Our method uses a top back-reflecting Au mirror to reflect the scattered synchrotron radiation back in the detection direction, and spacers to set the thickness of lard sample d. It is noteworthy that the spectral window of 0.5–1.5 THz has many strongly absorbing narrow lines in the vibrational-rotational manifold of molecular water spectrum [28]. This would require samples to be measured in vacuum and the ATR modality of transmission measurement is critically important.

3.3. ATR Experimental and Numerical Data

A total of 160 scans at each sample thickness were performed with synchrotron ATR and the results were averaged. The radiation was not polarised and the beam spot size on the sample was 1 mm in diameter, positioned at the center of the 3-mm-top window (Figure 1b). The spacer defining the sample thickness was set at d = 0.05 , 0.1 , 0.15 , 0.2 , and 0.3 mm successively. The Au-mirror was placed over the lard sample at the defined separation d from the surface of ATR prism; the spacers were located so as not to intercept the THz beam in the measurement area. The thickness of lard was considered to correspond to the defined thickness d since the ATR was measured under an considerable applied force using the ATR clipping mechanism. Each measurement was carried with a new identical lard sample and a fresh region of Au-coated slide glass. The experimental results are plotted in Figure 5 in logarithmic-linear presentation of the normalised THz intensity vs. thickness of the lard sample. The linear slope in this presentation corresponds to a single-exponential decay of intensity, hence the absorption coefficient can be determined. The absorption depth was found corresponding to l a b s = 1 / α a b s 0.37 mm (intersection of linear slope defined by the first points and the I / e -level). The spectral region where the normalised transmission is larger that one are not meaningful due to low reflectivity used for normalisation. It is noteworthy that for the gold-coated mirror, a surface plasmon polariton (SPP) can be launched at the dielectric–gold interface, however, it was not investigated here due to the fixed 45° angle of incidence.
For comparison, FDTD simulations were conducted using 0.95 THz single frequency radiation, with the spacer d set at the same values as in the experiment. Separate simulations were conducted for s- and p-polarisations. The FDTD results of power density were normalised for comparison with the experimental data. The maximum intensity of unity corresponds to a gold mirror directly placed over the diamond crystal. The results are shown in Figure 5 and follow qualitatively similar behaviour: intensity is reduced for larger sample thickness. As expected from the above discussion on polarisation in the THz beam at ∼1 THz, the closest match between experiment and theory was obtained for s-pol. The difference between experiment and FDTD simulations can be explained by lard properties used in the model, which might be slightly different mainly due to water presence in THz beam path. Since the FDTD detector, which was measuring reflected power (Figure 2) has a fixed location, the local intensity distribution had an inherent oscillating behaviour due to back-reflected light from the top-mirror. We verified that the mesh was adequate and did not cause spurious changes of the detected power with the sample thickness.
There was an apparent difference in the slope of optical power loss with thickness in FDTD data (Figure 5). For the θ = 45 ° angle of incidence, the ratio of penetration depth for p-(‖) and s-pol. (⊥) is equal d p / d p = 2 [29], which is valid for an isotropic sample such as rendered pork lard. This explains a stepped power loss for the p-pol. that penetrates deeper into the sample for shallow depths d < 0.15 mm.
Interestingly, the calculated reflected power decay as defined by the k 2 and correspondingly α a b s = 8 cm 1 is l a b s = 1 / α a b s = 1.25 mm, was up to three times smaller. This was judged from the initial slope of the calculated FDTD data and experimental results (Figure 5) for the thicknesses larger than d > 0.15 mm. At the position of slope change, the evanescent field (Equation (1)) ceases to be important. This is consistent with the measurement methodology where top Au-mirror reflected the otherwise transmitted light back into the detection direction. Hence the FDTD monitor captures the optical near-field and far-field contributions. An additional factor is that the angle of incidence in ATR is usually θ 45 °, however, parabolic focusing mirrors are used and this changes the s-pol. to p-pol. ratio at the sample–prism interface. Further efforts have to be made to achieve theory-experiment matching for non-normalised data presentation. To achieve this, the phase of the incident and reflected signal has to be determined (see Appendix A for phase changes upon reflection) as well as the change of reflection coefficients R s , p (Figure 3) which are both dependent on the sample properties ( n 2 + i k 2 ) . Polarisation sensitive measurements could allow determination of orientation dependent n and k, and hence the birefringence Δ n and dichroism Δ k as we demonstrated for the transmission [30,31,32] at the IR spectral range.

4. Conclusions and Outlook

The THz-ATR technique with a top-reflecting gold mirror was used to measure absorbance of the bio-material—rendered pork lard sample. At the chosen ∼1 THz synchrotron radiation band, polarisation is mostly linear and corresponds to the s-pol. at the sample–prism interface. The experimentally determined absorption coefficient of lard is 25 cm 1 (or absorption depth of 0.4 mm) for the thinnest samples where the evanescent light fields dominates light-matter interaction at the interface between the lard and the ATR diamond prism.
Future improvement of the THz-ATR technique can benefit from use of band-pass filters [33], which can also be designed to act as polarisers. Geometrical parameters of a cross opening in a metallic mask can control polarisation, spectral bandwidth, central wavelength and transmittance of the filter. We demonstrated bandpass filters based on pinhole-arrays in a gold film layer for the mid-IR spectral range [34]. Due to a mass density alignment (real part of the refractive index), the orientation of absorbers or structural patterns can be recognised even when spatial resolution is not achieved [31]. Polarisation resolved imaging at THz wavelengths is expected to further improve diagnostics of malignant skin formations. Uniquely to the ATR geometry, the E-field component E z oriented perpendicular to the sample–prism interface can be used to detect orientation of patterns and structures along that field due to a stronger absorption. Sub-wavelength patterns can also contribute to the formation of E z field, which cannot be present in the paraxial beam propagating in a free space but can have a strong contribution at the near and evanescent modes [35]. Laser-induced breakdown of liquid targets (e.g., water micro-jet) are a promising THz radiation source which can be localised with sub-wavelength (at THz) precision with intensity scalable by using multi-foci [19]. THz field enhancement at sub-wavelength formations cause an increased absorption and is a promising direction to explore for removal of skin lesions. For the visible spectral range, the enhancement was demonstrated by laser ablation of tens-of-nm wide grooves using λ 800 nm laser light [36]. The most obvious advantage of ATR THz measurements of biological samples is elimination of a strong absorption by atmospheric water during beam delivery to the sample.

Author Contributions

Conceptualization, Z.V. and A.W.W.; methodology, Z.V., D.A.; software, Z.V. and A.L.; validation, Z.V and A.L.; formal analysis, Z.V., A.L. and S.H.N.; investigation, Z.V., A.L., S.H.N. and D.A.; resources, A.W.W.; data curation, Z.V. and S.J.; writing—original draft preparation, Z.V. and S.J.; writing—review and editing, all the authors; visualization, Z.V. and S.J.; supervision, Z.V., D.A. and A.W.W. All authors have read and agreed to the published version of the manuscript.

Funding

This work was supported by the ARC Linkage LP190100505 grant. The project was carried during EU16010, M15121, M15578 beamtimes at the Australian synchrotron, ANSTO.

Conflicts of Interest

The authors declare no conflict of interest.

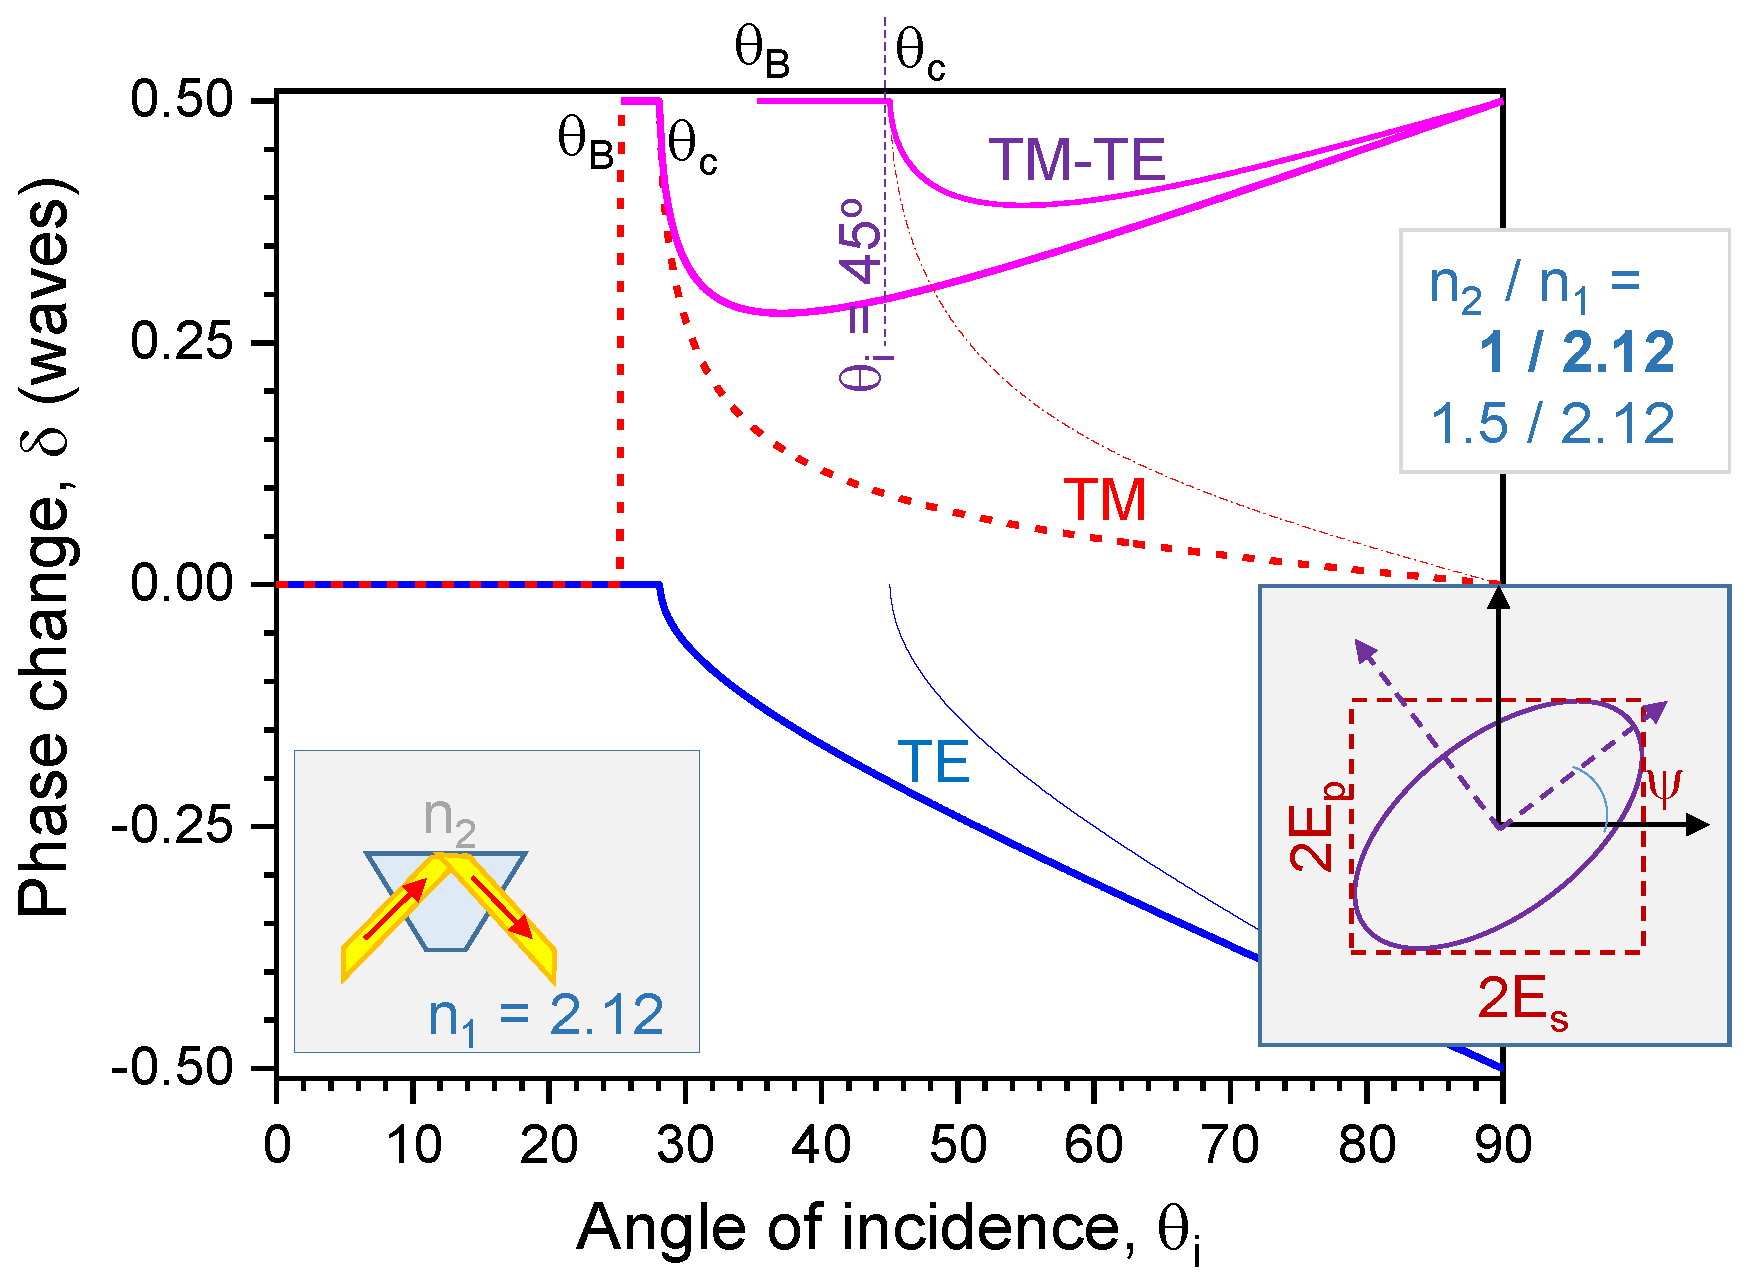
Appendix A. Phase Changes in ATR

The amplitude of reflected ATR signal (for intensity) is defined by the R s , p coefficients (Equations (2) and (3)). The phase of the reflected E-field from the ATR (diamond) prism–sample interface is changed and has to be accounted in the analysis of light using the analyser (Figure 1). The phase is changes depending on the angle according to the Fresnel formulas defined for the relative refractive index n = n 2 / n 1 :
ϕ T E ( θ i , n ) = 2 tan 1 ( sin 2 θ i n 2 cos θ i ) ,
ϕ T M ( θ i , n ) = π 2 tan 1 ( sin 2 θ i n 2 n 2 cos θ i ) ,
for the θ i > θ c where the critical angle θ c = sin 1 ( n ) ; reflection is internal when n < 1 . The evanescent field depth 1 / α is defined by the absorption coefficient α = 2 π k sin 2 θ i n 1 (for n < 1 ); for plotting n 1 = 2.12 is the refractive index of ATR prism (medium 1) and n 2 + i k 2 (medium 2) is the sample (or air n 2 = 1 ) for the THz spectral range.
The Fresnel formulas shown above are plotted in Figure A1. Reflectivity does not change the amplitude of reflected TE and TM modes at angles of incidence larger than the critical angle θ c (Figure A1a). Absorption of THz beam due water humidity can be modeled by increasing the imaginary part of the refractive index k 2 (see solid vs. dashed lines in (a)). The phase change upon reflection of TE and TM modes experiences complex changes at the polarising Brewster and critical angles (Figure A1b). Most importantly, the difference of phases for the TM and TE modes experiences the largest phase change close to the λ / 4 condition for θ i = 35 45 °. Typical ATR setups are designed for θ i π / 4 , hence, a strong phase difference is expected due reflection from the sample–diamond interface, depending to the refractive index contrast n; see thinner lines in Figure A1b which represent phase changes for n = n 2 / n 1 = 1.5 / 2.12 . The large phase change between TE and TM modes is used in Fresnel rhomb polarisers to produce circularly polarised light after two total internal reflections which introduce λ / 4 (or π / 2 ) phase shift between TE and TM modes.
Figure A1. Visualisation of Equations (A1) and (A2). The phase change upon reflection for the TE and TM modes governed by the real part of refractive indices n = n 2 / n 1 ; the angle of incidence θ i and ATR prism has n 1 = 2.12 in the THz spectral range. The polarising Brewster angle is given by θ B = tan 1 ( n ) and the critical angle θ c = sin 1 ( n ) . Thinner lines correspond to the case when the sample has a refractive index of n 2 = 1.5 . The right-inset in shows the polarisation ellipse after the analyser; left-inset shows ATR geometry and conventions.
Applsci 10 08692 g0a1
Upon reflection from the diamond–sample interface, both amplitudes of the E z (TM) and E y (TE) components can be changed because of anisotorpy of absorption. This is affected by the phase change between TM and TE modes, which is solely defined by the refractive index ratio at the interface. The reflected light is elliptically polarised and can be expressed in s-/p-components measurable with an analyser (inset in Figure A1). The ratio of the s- and p-components of the E-field is tan β = E p / E s and the phase difference upon reflection δ . The polarisation ellipsis is expressed by two angular parameters: the orientation angle ψ and the ellipticity angle χ as tan ( 2 ψ ) = tan ( 2 β ) × cos ( δ ) and tan ( 2 χ ) = sin ( 2 β ) × sin ( δ ) . This polarisation change is mainly defined by the phase change δ upon reflection.

References

  1. Xia, J.; Yao, J.; Wang, L. Photoacoustic Tomography: Principles and Advances; Electromagnetic Waves: Cambridge, MA, USA, 2014. [Google Scholar]
  2. Waldstein, S.M.; Faatz, H.; Szimacsek, M.; Glodan, A.M.; Podkowinski, D.; Montuoro, A.; Simader, C.; Gerendas, B.S.; Schmidt-Erfurth, U. Comparison of penetration depth in choroidal imaging using swept source vs. spectral domain optical coherence tomography. Eye 2015, 29, 409–415. [Google Scholar] [CrossRef] [PubMed] [Green Version]
  3. Olsovsky, C.; Shelton, R.; Carrasco-Zevallos, O.; Applegate, B.; Maitland, K. Chromatic confocal microscopy for multi-depth imaging of epithelial tissue. Biomed. Opt. Express 2013, 4, 732–740. [Google Scholar] [CrossRef] [PubMed]
  4. Botar-Jid, C.; Cosgarea, R.; Bolboacǎ, S.; Şenilǎ, S.; Lenghel, L.; Rogojan, L.; Dudea, S. Assessment of Cutaneous Melanoma by Use of Very- High-Frequency Ultrasound and Real-Time Elastography. Am. J. Roentgenol. 2016, 206, 699–704. [Google Scholar] [CrossRef] [PubMed]
  5. Drakaki, E.; Sianoudis, I.; Zois, E.; Makropoulou, M.; Serafetinides, A.; Dessinioti, C.; Stefanaki, E.; Stratigos, A.; Antoniou, C.; Katsambas, A.; et al. Non-invasive spectroscopic techniques in the diagnosis of non-melanoma skin cancer. J. Phys. Conf. Ser. 2017, 931, 012036. [Google Scholar] [CrossRef]
  6. Available online: https://www.canceraustralia.gov.au/affected-cancer/cancer-types/melanoma/statistics (accessed on 10 November 2020).
  7. Erdmann, F.; Lortet Tieulent, J.; Schūz, J.; Zeeb, H.; Greinert, R.; Breitbart, E.W.; Bray, F. International trends in the incidence of malignant melanoma 1953–2008—Are recent generations at higher or lower risk? Int. J. Cancer 2012, 132, 385–400. [Google Scholar] [CrossRef] [PubMed]
  8. Wheatley, K.; Wilson, J.S.; Gaunt, P.; Marsden, J.R. Surgical excision margins in primary cutaneous melanoma: A meta-analysis and Bayesian probability evaluation. Cancer Treat. Rev. 2016, 42, 73–81. [Google Scholar] [CrossRef]
  9. Keung, E.; Gershenwald, J. The eighth edition American Joint Committee on Cancer (AJCC) melanoma staging system: Implications for melanoma treatment and care. Expert Rev. Anticancer Ther. 2018, 18, 775–784. [Google Scholar] [CrossRef]
  10. Landow, S.; Gjelsvik, A.; Weinstock, M. Mortality burden and prognosis of thin melanomas overall and by subcategory of thickness, SEER registry data, 1992–2013. J. Am. Acad. Derm. 2017, 76, 258–263. [Google Scholar] [CrossRef]
  11. Hasted, J.; Husain, S.; Frescura, F.A.M.; Birch, J.R. The temperature variation of the near millimetre wavelength optical constants of water. Infrared Phys. 1987, 27, 11–15. [Google Scholar] [CrossRef]
  12. Liebe, H.; Hufford, G.; Manabe, T. A model for the complex permittivity of water at frequencies below 1 THz. Int. J. Infrared Millim. Waves 1991, 12, 659–675. [Google Scholar] [CrossRef]
  13. Zhang, C.; Lee, K.; Zhang, X.; Wei, X.; Shen, Y. THz spectroscopy of ice. Lasers Electro-Opt. Soc. IEEE 2002, 2, 646–647. [Google Scholar]
  14. Woodward, R.M.; Cole, B.E.; Wallace, V.P.; Pye, R.J.; Arnone, D.D.; Linfield, E.H.; Pepper, M. Terahertz pulse imaging in reflection geometry of human skin cancer and skin tissue. Phys. Med. Biol. 2002, 47, 3853–3863. [Google Scholar] [CrossRef] [PubMed]
  15. Ashworth, P.; Zeitler, J.; Pepper, M.; Wallace, V. Terahertz spectroscopy of biologically relevant liquids at low temperatures. In Proceedings of the Infrared Millimeter Waves and 14th International Conference on Teraherz Electronics, Shanghai, China, 18–22 September 2006; p. 184. [Google Scholar]
  16. Nakajima, S.; Hoshina, H.; Yamashita, M.; Otani, C. Terahertz imaging diagnostics of cancer tissues with a chemometrics technique. Appl. Phys. Lett. 2007, 90, 041102. [Google Scholar] [CrossRef]
  17. Warner, R.; Myers, M.; Taylor, D. Electron probe analysis of human skin: Determination of the water concentration profile. J. Investig. Derm. 1988, 190, 218–224. [Google Scholar] [CrossRef] [Green Version]
  18. Rofstad, E.; Steinsland, E.; Kaalhus, O.; Chang, Y.; Høvik, B.; Lyng, H. Magnetic Resonance Imaging of Human Melanoma Xenografts in Vivo: Proton Spin–lattice and Spin–spin Relaxation Times Versus Fractional Tumour Water Content and Fraction of Necrotic Tumour Tissue. Int. J. Radiat. Biol. 1994, 165, 387–401. [Google Scholar] [CrossRef]
  19. Huang, H.H.; Nagashima, T.; Yonezawa, T.; Matsuo, Y.; Ng, S.H.; Juodkazis, S.; Hatanaka, K. Giant Enhancement of THz Wave Emission under Double-Pulse Excitation of Thin Water Flow. Appl. Sci. 2020, 10, 2031. [Google Scholar] [CrossRef] [Green Version]
  20. Fülöp, J.; Tzortzakis, S.; Kampfrath, T. Laser-Driven Strong-Field Terahertz Sources. Adv. Opt. Mat. 2020, 8, 1900681. [Google Scholar] [CrossRef] [Green Version]
  21. Huang, H.H.; Nagashima, T.; Hsu, W.H.; Juodkazis, S.; Hatanaka, K. Dual THz Wave and X-ray Generation from a Water Film under Femtosecond Laser Excitation. Nanomaterials 2018, 8, 523. [Google Scholar] [CrossRef] [Green Version]
  22. Watts, K.; Fairchild, R.; Slatkin, D.; Greenberg, D.; Packer, S.; Atkins, H.; Hannon, S. Melanin content of hamster tissues, human tissues, and various melanomas. Cancer Res. 1981, 41, 467–472. [Google Scholar]
  23. Vilagosh, Z.; Lajevardipour, A.; Wood, A.W. Computational absorption and reflection studies of normal human skin at 0.45 THz. Biomed. Opt. Express 2020, 11, 417–431. [Google Scholar] [CrossRef]
  24. Reid, C.; Pickwell-MacPherson, E.; Laufer, J.; Gibson, A.; Hebden, J.; Wallace, V. Accuracy and resolution of THz reflection spectroscopy for medical imaging. Phys. Med. Biol. 2010, 55, 4825–4838. [Google Scholar] [CrossRef] [PubMed] [Green Version]
  25. Ramer, G.; Lendl, B. Attenuated Total Reflection Fourier Transform Infrared Spectroscopy. In Encyclopedia of Analytical Chemistry: Online; John Wiley and Sons, Ltd.: Berlin, Germany, 2013. [Google Scholar]
  26. Hansen, W.N. Expanded formulas for attenuated total reflection and the derivation of absorption rules for single and multiple ATR spectrometer cells. Spectrochim. Acta 1965, 21, 815–833. [Google Scholar] [CrossRef]
  27. Ryu, M.; Linklater, D.; Hart, W.; Balcytis, A.; Skliutas, E.; Malinauskas, M.; Appadoo, D.; Tan, Y.; Ivanova, E.P.; Morikawa, J.; et al. 3D printed polarizing grids for IR-THz synchrotron radiation. J. Opt. 2018, 20, 035101. [Google Scholar] [CrossRef]
  28. Heyden, M.; Sun, J.; Funkner, S.; Mathias, G.; Forbert, H.; Havenith, M.; Marx, D. Dissecting the THz spectrum of liquid water from first principles via correlations in time and space. Proc. Natl. Acad. Sci. USA 2010, 107, 12068–12073. [Google Scholar] [CrossRef] [Green Version]
  29. Goormaghtigh, E.; Raussens, V.; Ruysschaert, J.M. Attenuated total reflection infrared spectroscopy of proteins and lipids in biological membranes. Biochim. Biophys. Acta 1999, 1422, 105–185. [Google Scholar] [CrossRef]
  30. Honda, R.; Ryu, M.; Moritake, M.; Balcytis, A.; Mizeikis, V.; Vongsvivut, J.; Tobin, M.J.; Appadoo, D.; Li, J.L.; Ng, S.H.; et al. Hyperspectral mapping of anisotropy. Nanoscale Horiz. 2019, 4, 1443–1449. [Google Scholar]
  31. Honda, R.; Ryu, M.; Moritake, M.; Balcytis, A.; Mizeikis, V.; Vongsvivut, J.; Tobin, M.J.; Appadoo, D.; Li, J.L.; Ng, S.H.; et al. Infrared Polariscopy Imaging of Linear Polymeric Patterns with a Focal Plane Array. Nanomaterials 2019, 9, 732. [Google Scholar] [CrossRef] [Green Version]
  32. Honda, R.; Ryu, M.; Balcytis, A.; Vongsvivut, J.; Tobin, M.J.; Juodkazis, S.; Morikawa, J. Paracetamol micro-structure analysis by optical mapping. Appl. Surf. Sci. 2019, 473, 127–132. [Google Scholar] [CrossRef] [Green Version]
  33. Porterfield, D.; Hesler, J.; Densing, R.; Mueller, E.; Crowe, T.; Weikle, R. Resonant metal-mesh bandpass filters for the far infrared. Appl. Opt. 1994, 33, 6046–6052. [Google Scholar] [CrossRef]
  34. Balčytis, A.; Ryu, M.; Seniutinas, G.; Nishijima, Y.; Hikima, Y.; Zamengo, M. Si-based infrared optical filters. Opt. Eng. 2015, 54, 127103. [Google Scholar] [CrossRef]
  35. Mizeikis, V.; Kowalska, E.; Ohtani, B.; Juodkazis, S. Light-field enhancement for the photo-catalytic applications. Phys. Status Solidi Rapid Res. Lett. 2010, 4, 268–270. [Google Scholar] [CrossRef]
  36. Li, Z.Z.; Wang, L.; Fan, H.; Yu, Y.H.; Chen, Q.D.; Juodkazis, S.; Sun, H.B. O-FIB: Far-field-induced near-field breakdown for direct nanowriting in an atmospheric environment. Light Sci. Appl. 2020, 9, 41. [Google Scholar] [CrossRef] [PubMed] [Green Version]
Figure 1. (a) Photo of the THz/Far-IR radiation injection port and distribution chamber between two beamlines at the Australian synchrotron; the chamber is in vacuum. Trajectory of electrons (and slit of bending magnet) are in xy-plane (see the inset on top where dipole and edge radiation extraction from synchrotron is shown schematically). The beam extraction mirror had an intermediate focus before entering beam-splitting chamber and is shown schematically. This caused the left-right and top-bottom flip of the impinging radiation (dipole on the right hand side and edge on the left hand side). (b) The attenuated total reflection (ATR) geometry based on a prism (diamond) with a typical 3 mm cross section of the area of measurements (diameter of the THz beam). Sample is pressed against the window during measurements. This setup allows THz experiments in out-of-vacuum conditions normally required to cancel strong water absorbance in air.
Applsci 10 08692 g001
Figure 2. The computational FDTD model. A gold mirror was set up to model varying thickness d of the sample (a pig lard). The diamond ATR crystal is encased in a metal envelope (protective shield) to prevent extraneous signals reaching the detector. The evanescent wave generated at the interface of the ATR crystal and the sample. It can travel through the sample (transmitted), back-reflected by top Au-mirror as a frustrated traveling wave, or reflected to the detector. Changes in thickness of the sample alters the intensity of the evanescent wave in reflection (FDTD detector).
Applsci 10 08692 g002
Figure 3. Simulation of ATR reflectance (a) R s and R p vs. absorbance coefficient and (b) reflectance vs. frequency THz according to Equations (2) and (3). The refractive indices are modeled by n 1 = 2.38 (diamond) and lard by n 2 = 1.48 at the sampling frequency of 0.9 THz (a). The angle of incidence 45 °.
Applsci 10 08692 g003
Figure 4. (a) Raw data: THz spectra measured through the ATR setup with lard of different thickness d on top of the ATR prism (color coded). Each spectral line was plotted from four scans; several scans show uncertainty range. (b) The same spectra presented in frequency after normalisation of the transmitted light to the ATR prism transmission in air (dashed lines) and with top Au-mirror (solid lines). There is a strong water absorption band at 0.6 THz [19] and reflection normalisation (to mirror attached to ATR prism) is affected at the vicinity of the absorption band.
Applsci 10 08692 g004
Figure 5. FDTD simulations and experimental results of the reflected signal (polarisation was not discriminated for incidence nor for the reflected power) from the rendered porcine lard sample. Normalisation was carried out for FDTD data while the experimental data were normalised to the Au mirror reflectivity, which is taken as R = 100 % . Lines are drawn as eye-guides.
Applsci 10 08692 g005
Publisher’s Note: MDPI stays neutral with regard to jurisdictional claims in published maps and institutional affiliations.

