Article

Textile Wastewater Treatment on a Spinning Disc Reactor: Characteristics, Performances, and Empirical Modeling

by
Eugenia Teodora Iacob Tudose
1 and
Carmen Zaharia
2,*
1
Department of Chemical Engineering, “Cristofor Simionescu” Faculty of Chemical Engineering and Environmental Protection, “Gheorghe Asachi” Technical University of Iasi, 73 D.Mangeron Blvd, 700050 Iasi, Romania
2
Department of Environmental Engineering and Management, “Cristofor Simionescu” Faculty of Chemical Engineering and Environmental Protection, “Gheorghe Asachi” Technical University of Iasi, 73 D.Mangeron Blvd, 700050 Iasi, Romania
*
Author to whom correspondence should be addressed.
Appl. Sci. 2020, 10(23), 8687; https://doi.org/10.3390/app10238687
Submission received: 13 November 2020 / Revised: 27 November 2020 / Accepted: 2 December 2020 / Published: 4 December 2020
(This article belongs to the Special Issue Pollution Control Chemistry)

Abstract

:

Featured Application

Textile effluent treatment step for solids and color removal using the spinning disc technology.

Abstract

Spinning disc (SD) technology has been successfully applied, for the first time, in real textile wastewater treatment with no other additional processing. The SD efficiency was investigated using real textile effluents to study the color and suspended solids removals at different effluent-supplying flowrates (10–30 L/h) and different disc rotational speeds (100–1500 rpm) with good experimental results; thus, it can minimize the polluting loads within a short time period. Furthermore, within this study, process modeling and its classical optimization were applied to SD technology for wastewater treatment. The experiments were organized according to an active central composite rotatable 23 order design, considering as independent variables the wastewater flowrate, rotational speed, and operating time and, as optimization criteria, the suspended solids removal and discoloration degree. Overall, this novel study proved that the SD technology applied in textile effluent treatment is a suitable alternative to a primary mechanical step.

1. Introduction

The role of new techniques applied in environmental treatments and the necessity of environmental system analysis have been outlined in recent years [1,2].
Spinning disc (SD) technology is one of the recognized technologies for process intensification [3,4,5], with applications in different physical and chemical processes.
The working principle of the SD relies on centrifugal force acting on the liquid fed at the center of a spinning disc [6], resulting in a rippled thin liquid film characterized by an advanced turbulence and a high mixing intensity, which enables increased transport phenomena such as heat and mass transfers.
Spinning disc technology has been used successfully for polymer production [7,8], in the food and pharmaceutical industries [9,10], for nanoparticle manufacturing [11], in enzymatic reactions [12], and in biodiesel synthesis [13]. In wastewater treatment technologies, the spinning disc with a nanostructured thin film of ZnO and TiO2 photocatalysts has been used for the degradation of some pollutants, such as methyl orange and rhodamine B dye or 4-chlorobenzoic acid [14,15,16].
Given the enhanced spinning disc reactor (SDR) flow characteristics, the current study has as its primary objective the investigation of the SD technology’s efficiency in the treatment of a textile effluent without the initiation of any other mechanical-physical, chemical, or biochemical process, mainly regarding the suspended solids, turbidity, and color removal. To our best knowledge, no other investigation regarding wastewater treatment using spinning disc technology, as is described below, has been performed before. Moreover, loaded industrial wastewater treatment has become mandatory for each responsible industrial company’s environmental management, which will select the most adequate wastewater treatment system for its effluents [17,18,19,20,21,22,23,24,25,26].
In addition, in the second part of this paper process modeling with classical optimization was proposed in order to find the optimal operating variables in terms of flowrate, rotational speed, and operating time for the highest color and suspended solids removals from the treated textile wastewater. Thus, after each studied variable variation field was established, an experimental design respecting the active central composite rotatable 23 design was applied in the laboratory spinning disc setup for textile wastewater treatment. Rigorous empirical modeling and monitoring methods are becoming very important in each industrial wastewater treatment system, as reported in several studies [27,28,29,30,31].

2. Experimental

2.1. Materials and Analysis Methods

2.1.1. Materials

Chemical reagents of a high analytical purity were used and all aqueous solutions were prepared with distilled water on the day of their use, with concentrations of 0.1 n NaOH and 0.1 n H2SO4 (for pH adjustment), among others. Local indigene bentonite powder (Iasi, Romania) as a coagulation adjuvant and discoloration agent was added to the wastewater.
In the studied experimental SD setup, real textile wastewater from cotton fabric manufacturing (a textile effluent obtained after the 2nd and 3rd rinsing steps of the finishing manufacturing process) was treated.

2.1.2. Analysis Methods

All the analytical methods were performed according to recognized standard methods, which were internationally approved.
PH determination. All the pH measurements were performed directly with the Hanna high-precision KL-009(I) pH-meter (Hanna Instruments, Cluj Napoca, Romania).
Color determination. According to the corresponding standard (SR ISO 7887/97), the color is expressed by absorbance measurements under the blank (distilled water) at three different characteristic wavelengths—i.e., 436, 525, and 620 nm, especially at 436 nm for industrial wastewaters (apparent color in supernatant). Moreover, the color can be expressed by the Hazen color index (i.e., an absorbance value of 0.069 at 456 nm corresponds to 50 Hazen units (HU)) [24,26].
Suspended solids and turbidity determination. These measurements were performed directly using the DR/2000 Direct Reading spectrophotometer at 630 nm (in mg/L) for the suspended solids content and at 450 nm (in FTU) for turbidity under a blank with distilled water.
Other characteristics of the studied textile wastewater were analyzed using specific standard analysis methodology [32]—e.g., CODCr determination (SR EN 1484/2001, or SR ISO 6060/1996), CBO5(SR EN 1899/2002), fixed residues (STAS 6963-81), total synthetic tensioactive substances (detergents) (SR ISO 7875-1, 2/96), total phosphorus (SR EN 1189/2000), extractible substances (SR 7587/1996), nitrites (STAS 3048/1-96), nitrates (STAS 8900/1,2-96), ammonia (STAS 6328/85), total nitrogen (sum of nitrates, nitrites, ammonia, and organic nitrogen), sulfates (STAS 38601-70), chlorides (SR ISO 9297/98), phenols and their derivates (SR ISO 6439/2001), and total heavy metal ions (SR ISO 8288: 2001), among others.

2.2. Experimental Laboratory Setup

All the experiments were performed in the experimental setup presented in Figure 1 [6]. A rotating disc 1 with a diameter of 20 cm and thickness of 4 mm, connected to an electric motor 2, with a variable adjustable speed, was encapsulated in an acrylic housing 3. On the rotating disc, textile wastewater treated previously with bentonite at a concentration of 2 g/L (this concentration was selected from the results onto different loaded wastewaters, studied in previous research reports [24]), was fed through a 3.5 mm nozzle at a location 10 mm from the disc center from a tank 4, using a centrifugal pump 5. The wastewater flowrate was maintained constant by adjusting tap 6 and measured with the flowmeter 7. The rotational disc speed was determined using a laser tachometer with an accuracy of ±0.1 rpm. The outlet effluent used for the wastewater quality measurements was collected from tap 8.
During the test runs, the temperature was verified using a calibrated thermometer and was found to be practically constant, with an initial value of approximately 20 °C ± 1 °C.
After collection from the effluent outlet, the wastewater samples were analyzed using a DR/2000 Direct Reading spectrophotometer in order to establish their quality indicators, and, finally, the SD’s performance in textile effluent treatment.
The efficiency of the SD technology applied in the case of the studied textile wastewaters was established based on the calculation of the removal efficiency (%), R, using the following equation:
R [%] = [(CiCf)/Ci)] × 100,
where Ci is the initial value of the studied quality indicator (mg/L, or FTU, or HU) and Cf is the final (or after specific t time) value of the studied quality indicator (mg/L, or FTU, or HU).

2.3. Modeling Methodology

The main factors which influence the textile effluent treatment in the experimental SD setup were considered to be flowrate (z1), rotational speed (z2), and operating time (z3). As response functions or optimization criteria, the removal degree (Y, [%]) in terms of suspended solids (Y1) and color (Y2) were selected. The modeling was organized according with the experimental planning used in an “n” variable active central composite rotatable design where the mathematical model is expressed by Equation (2), with no excessive experiments in comparison with the number of coefficients to be determined (i.e., n = 20, consisting of 23 factorial experiments (each corner of cube), 2 × 3 axial experiments (on axes, distance of ±α from center of rotation, α = ±1.682), k = 6 (experiments in the center of variation field, for the independent estimation of “pure” experimental error variance, data reproducibility) [30,31,32,33].
Y = b0 + ∑ni=1 biXi + ∑ni,j=1 bjiXiXj,
where Y is the response function (removal degree, [%]); Xi or Xj is the coded selected variable in the SD treatment system (n = 20); i, j = 1 or 2; b0, bi, bj, bij are the model coefficients. The model coefficients are estimated using statistics for the processing of the experimental results obtained in the central points of the central composite rotatable design, according to the equations presented in previous reports [30,31].
In the active central composite rotatable (23) design, a basic value zi0 and a variation step Δzi0 of each independent variable zi (flowrate, rotational speed, or operating time) were established. The coded value of zi, denoted as Xi, was determined with Equation (3) [30,31,33]:
Xi = (zi − zi0)/Δzi0.
The upper level is coded with 1, the lower level with −1, and the basic level with 0. There are other possible values of the variable level (αi = ±1.682) [27,28,29].
The model validation was carried out by an appropriate analysis of variance, consisting of: (i) the calculation of the F constant and its comparison with the statistical value; (ii) the calculation of the multiple correlation coefficient in order to establish the correlation between the dependent variable (Y) and the three independent variables (Xi) as a whole; (iii) the determination of the coefficient’s significance using the Student test, for a certain significance level (p = 0.05) and degrees of freedom (ν1 = n − 1 and ν2 = k − 1) [30,31,33]; (iv) the application of the Fisher test to calculate the Fc value and to compare it with the statistical value; and (v) the calculation of deviation (A) between the calculated values with the proposed model and the experimental data, which must be between +10% and −10% for a good data agreement. The optimal values of independent variables are determined using the classical optimization by the analysis of first- and second-order derivatives systems [30].

3. Results

The studied textile wastewaters were produced in a NE Romanian textile company that manufactures cotton fabrics colored from yellow to red during the period time of this study. The main textile wastewater (WW) characteristics treated in the SD system and their maximum admissible values are presented in Table 1.
As shown in Table 1, some physical-chemical quality indicators of the tested WW are exceeding the maximum admissible limits, especially color (more than 17–89 timefolds), suspended solids (more than 11–26 timefolds), turbidity (more than 36–80 times considering a reference value of 5–10 FTU), total organics content (more than 3–5 timefolds for COD, or 12 timefolds for BOD), and fixed residues (more than 3–4 timesfolds), therefore the WW treatment is obviously necessary. In any wastewater treatment process, one first step is the separation of settable and course or even fine particulated solids to obtain a WW load reduction and to provide the easy operation of the following steps used for dissolved contaminants’ removal/elimination. Thus, the main WW quality indicators evaluated to underline the SD technology performance are the color and solids content (as suspended solids and colloids), without any chemicals used for the chemical treatments or activated sludge used for biological treatment.
All our series of experiments were performed at the laboratory room temperature (20 ± 1 °C), working with no pH adjustment at the collected textile wastewater pH (7.12–7.89).

3.1. Textile WW Treatment Performance Using SD Technology Laboratory Setup

To investigate the efficiency of the SD technology in WW treatment, the textile effluent quality indicators were measured at different feeding WW flowrates—namely, 10, 15, 20, 25, and 30 L/h—and different disc rotational speeds—specifically 100, 250, 400, 550, 850, 1200, and 1500 rpm.
Some values of the measured textile WW quality indicators—i.e., color (A456); suspended solids (SS); absorbance at 525 nm (A525) and 620 nm (A620)- at three different disc rotational speed values of 100, 300, and 500 rpm, all at the same WW flowrate of 10 L/h—are represented in Figure 2a–c. All the graphs indicate decreasing trends, larger or smaller, depending on the rotational speed of the disc that demonstrates the spinning disc technology’s effectiveness.
Additionally, the same variation in the time of quality indicators at a WW flowrate of 30 L/h at three different disc rotational speeds of 100, 300, and 500 rpm presented in Figure 3a–c indicates similar decreasing trends.
Based on the variation in time of the WW quality indicators, the removal efficiency, calculated using Equation (1), has been determined and graphically represented to establish, on the one hand, the most advantageous working parameters—namely, the WW flowrate and the disc rotational speed—for which the maximum removal values are performed and, on the other hand, to prove the efficiency of the SD technology. Following the influence of the WW flowrate at constant disc rotational speeds and also the influence of the disc rotational speed at constant WW flowrates on the color and suspended solids removal, these quality indicators are discussed in the following subsections.
It is worth mentioning that, after the application of the SD technology to the studied textile wastewater, only very low changes in pH (no more than ±0.5 units) and temperature (no more than ±4 °C) took place; thus, one can conclude that no significant changes in the treated WW pH and temperature by SD technology at room temperature and the usual collected textile WW pH are obtained.

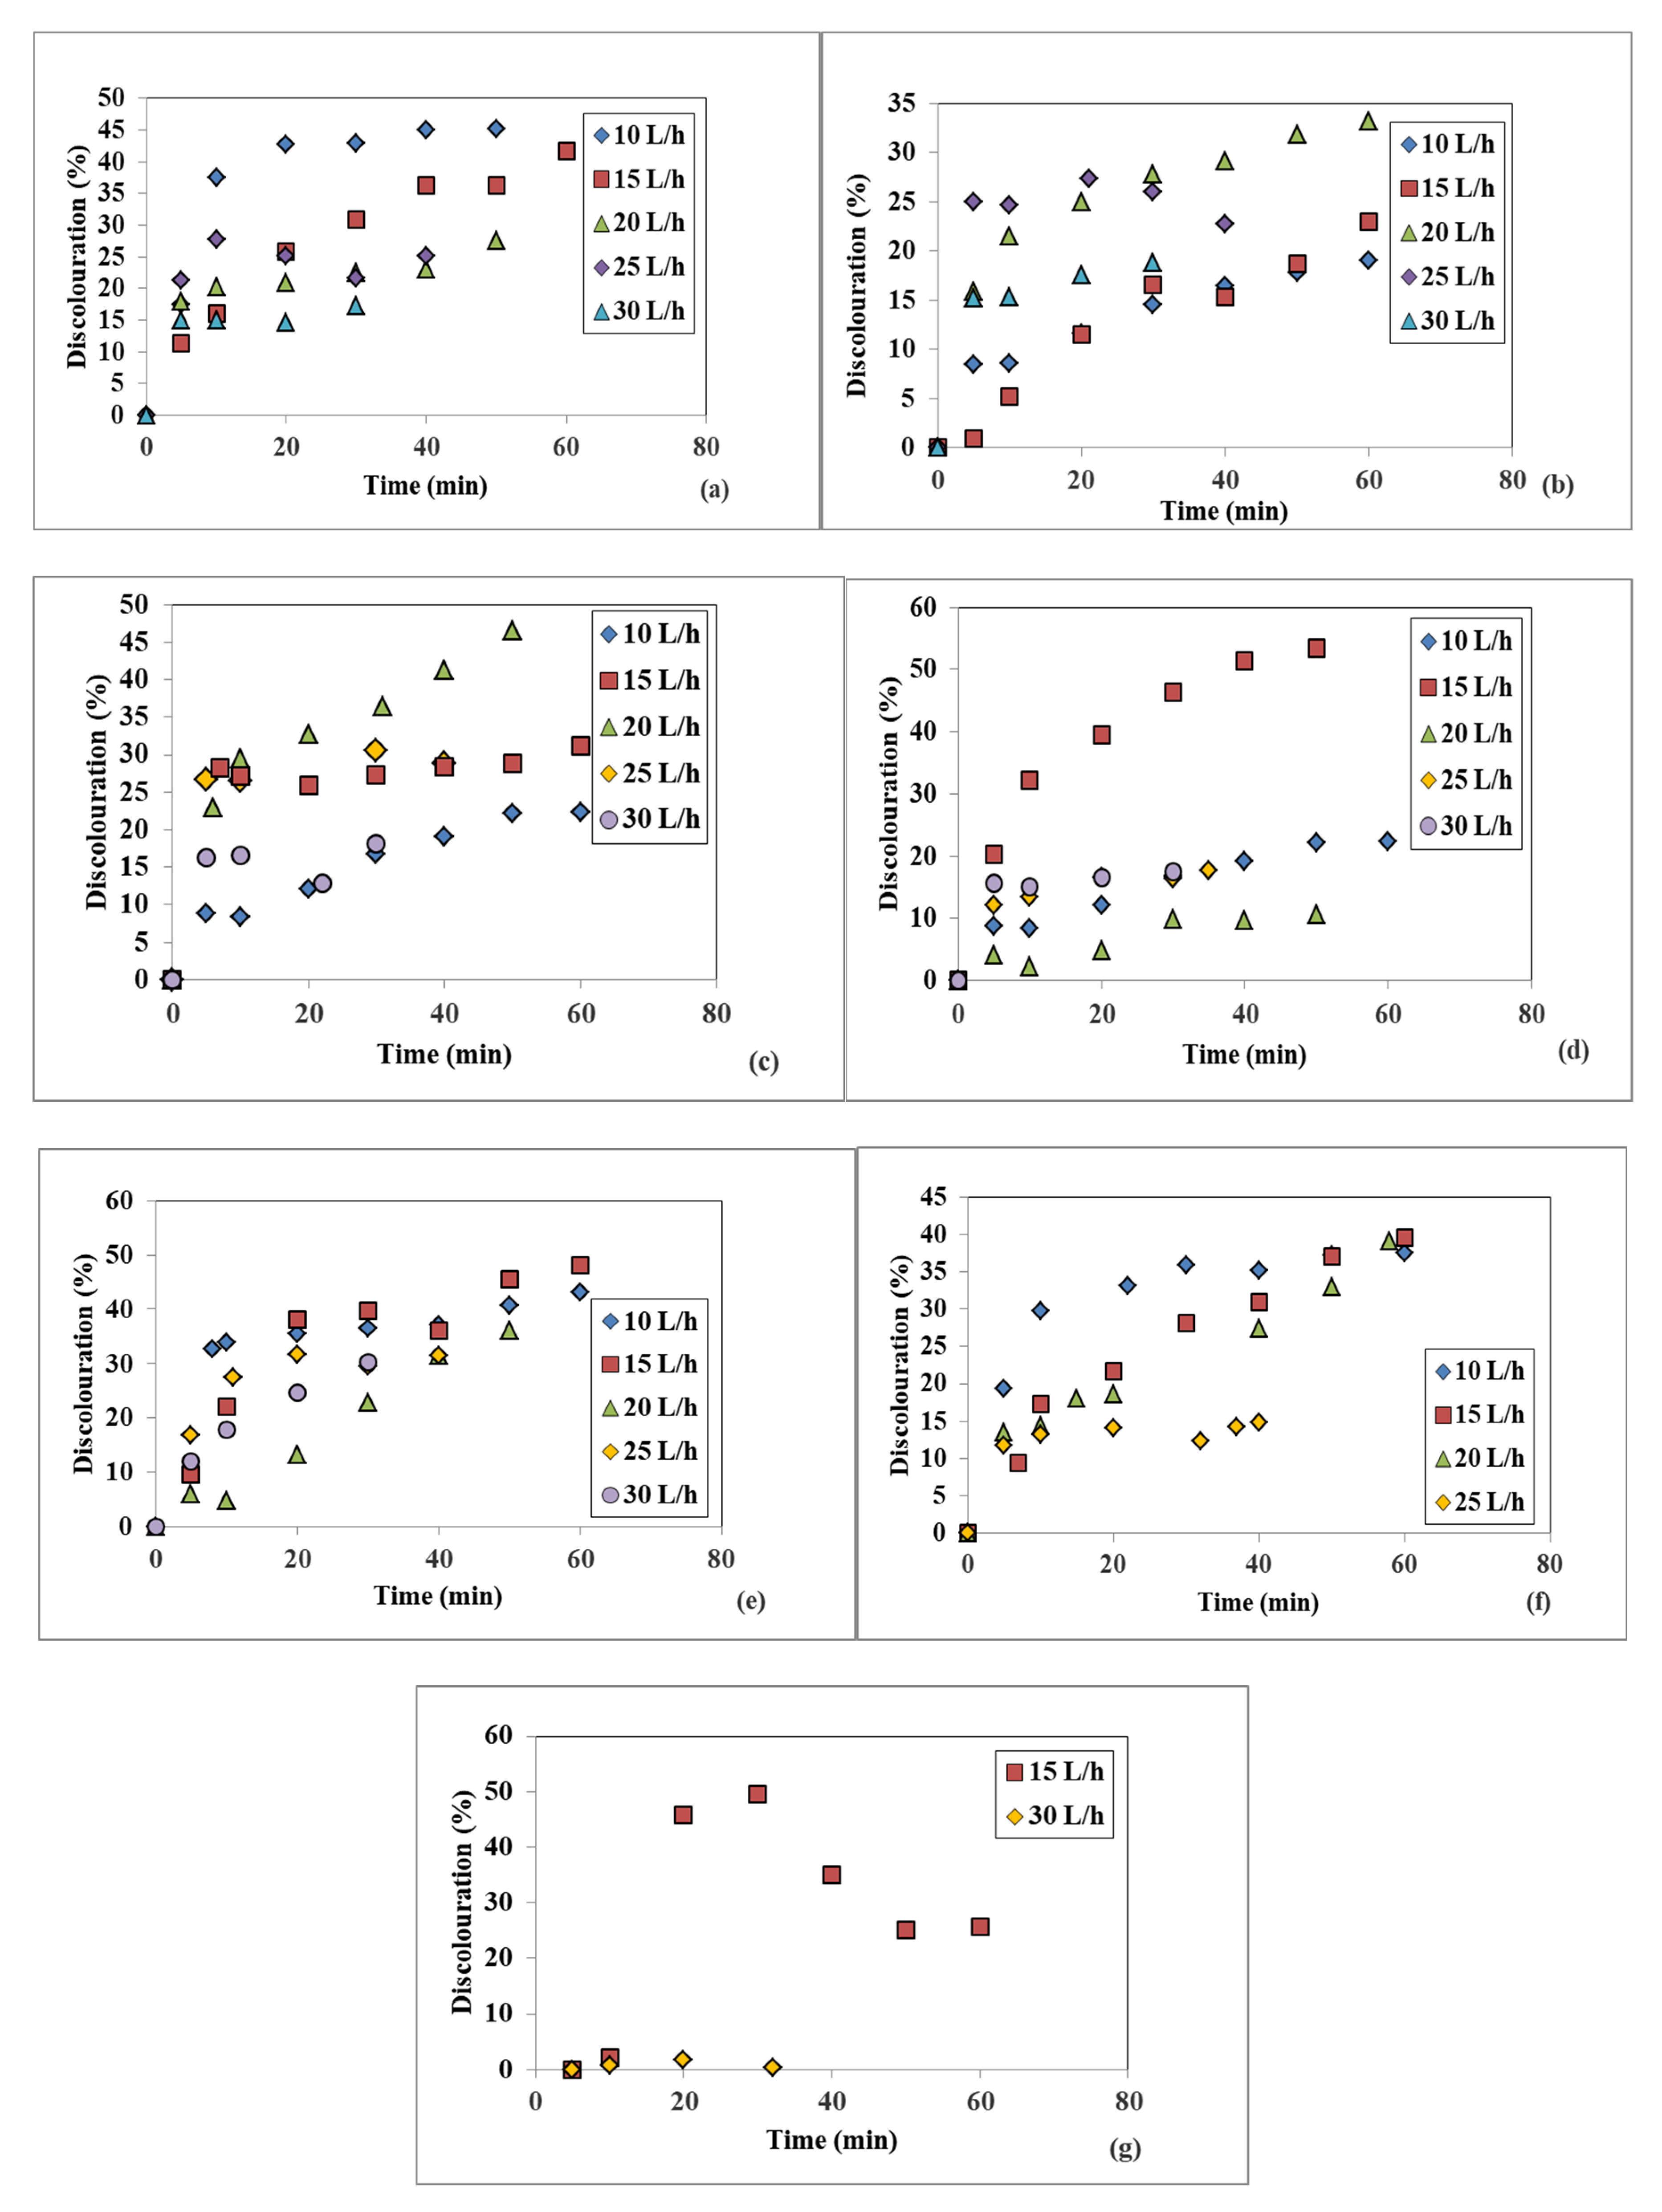
3.1.1. Flowrate Influence on the Effluent Treatment Efficiency Using SD Setup

The color removal for five different WW flowrates fed on the spinning disc at constant disc rotational speeds is represented in Figure 4a–g. As one can observe in Figure 4a, the highest removals of color at 100 rpm were 45.21% at 10 L/h after 50 min and 41.67% at 15 L/h after 60 min; as the WW flowrate increased, the maximum attained discoloration efficiency decreased. At 250 rpm, the maximum color removal was 33.16% for 20 L/h after 60 min, as seen in Figure 4b, while at 400 rpm the maximum registered value was 46.48% at 20 L/h after 50 min (Figure 4c). The best color removal among these runs was 53.50%, registered at 15 L/h and 550 rpm, after a 50 min operating time interval of the SD setup (Figure 4d). At the 850 rpm disc rotational speed, the maximum discoloration was 48.03% at 15 L/h after 60 min, as shown in Figure 4e, while at 1200 rpm the largest values of color removal was 39.56% at 15 L/h after 60 min (Figure 4f). No relevant data were obtained at 1200 rpm and 30 L/h, thus this flowrate is not represented. One can notice that at the largest investigated rotational speed of 1500 rpm for the 15 L/h flowrate, the discoloration efficiency increased, reaching 49.64%, after 30 min, and then decreased, while the other measured flowrates did not render any improvements regarding the color removal, thus they are not represented in Figure 4g.
The influence of five different WW flowrates on the suspended solids (SS) removal at seven different disc rotational speeds stayed constant, and are shown in Figure 5a–g. Similar to discoloration, the SS removal increases over time, attaining maximum values for certain disc rotational speeds and WW flowrates. However, the experimental conditions for the highest SS removal are not identical to the ones used when the maximum discoloration was obtained. Thus, at a 100 rpm disc rotational speed, the largest suspended solids removals were 57.32% for a 15 L/h feeding WW flowrate and 45.98% at 20 L/h, both after a 60 min measured SD operating time interval (Figure 5a). When the rotational speed was 250 rpm, the suspended solids removal had a maximum of 54.29% at 10 L/h, and reasonably good values of 45.98% and 42.05% at 20 and 15 L/h, respectively, all after 60 min, as shown in Figure 5b. At 400 rpm and 10 L/h, another maximum value of 50% was obtained after 60 min (Figure 5c), while at 550 rpm this value was the highest one recorded for the suspended solids removal—namely, 61.13% at 15 L/h after 50 min, as indicated by Figure 5d. The following working parameters of 850 rpm, at 25, 20, and 15 L/h, respectively, rendered reasonably high values for the suspended solids removal of 54.51%, 51.88%, and 45.53%, respectively, after 40, 50, and 55 min measuring time intervals, as presented in Figure 5e. At 1200 rpm, the best removal was obtained for 15 L/h and had a value of 52.14% after 60 min. The 1500 rpm rotational speed and the 15 L/h WW flowrate rendered a maximum removal value of 54.98%, followed by a sharp decrease with the operating time (Figure 5g). The other investigated flowrates did not provide promising data, thus they were not included graphically.
Concluding the influence of the WW flowrate fed on the disc, one can state that the 15 L/h WW flowrate value was the most indicated to perform the highest removal in terms of two investigated quality indicators, for most of the rotational speeds of 100, 550, 850, 1200, and 1500 rpm. This flowrate of 15 L/h, correlated with a disc rotational speed of 550 rpm, rendered the highest removals for all studied quality indicators—i.e., color (53.50%) and suspended solids (61.13%)—within the flowrate and rotational speed investigated interval. Furthermore, these maximum values pertain to increasing trends which indicates that even higher values may be obtained, given a longer working time period of the spinning disc. The experimental investigation time periods within this study were limited by the amount of available textile wastewater and laboratory reservoir capacity.

3.1.2. Disc Rotational Speed Influence on the Treatment Efficiency Using SD Laboratory Setup

To establish the disc rotational speed influence on the SD technology efficiency, each variation in time of the two investigated WW quality indicators were represented at constant WW flowrates. In Figure 6a–e, the discoloration was plotted at seven different disc rotational speeds and a constant flowrate of 10, 15, 20, 25, and 30 L/h, respectively. A rotational speed of 100 rpm rendered a maximum color removal of 45.21% for 10 L/h, after 50 min, as seen in Figure 6a. At 850 rpm, the maximum color removal was of 43.07% for 10 L/h, after 60 min (Figure 6a); 31.58% for 25 L/h, after 40 min (Figure 6d); and, finally, 30.18% at 30 L/h, after 30 min (Figure 6e). At 550 rpm and 15 L/h, the highest discoloration was of 53.50% (Figure 6b), which is the highest obtained value out of all acquired data within this study, while at 400 rpm and 20 L/h the largest color removal was 46.48%. As an additional observation, if a set of indicators, for a certain WW flowrate and rotational speed have not been graphically represented, it means they did not indicate satisfactory results.
In Figure 7a–e, the suspended solids removals are plotted as the variation in time for the above-mentioned seven rotational speeds and five WW flowrate values. At 10 L/h, the 250 rpm rendered a maximum suspended solids removal of 54.29% after 60 min (Figure 7a), while at 15 L/h 550 rpm gave the highest removal of 61.13% after 50 min (Figure 7b). For both 20 L/h and 25 L/h flowrates, at a rotational speed of 850 rpm the maximum suspended solids removals of 51.88% after 50 min (Figure 7c) and 54.51% after 40 min (Figure 7d) were obtained. At the largest WW flowrate of 30 L/h, the 1200 rpm gives a removal of only 14.08% after 25 min, as seen in Figure 7d.
All graphs plotted at 10, 15, and20 L/h presented increasing trends, which suggests that even higher SS removal values might be attained, provided longer working time periods.
All experimental results concerning the maximal efficiency in color and suspended solids are summarized in Table 2.
One can observe that the highest removal for color (53.50%) and suspended solids (61.13%) was obtained at a flowrate of 15 L/h and a rotational speed of 550 rpm after 50 min.
Some of the maximum color and suspended solids removal values correlated to the rotation speed and the WW flowrate can be explained in relation to the disc flowing film characteristics, as follows. Depending on the liquid flowrate and disc rotational speed, several flow regimes are found on the surface of a spinning disc. At low liquid flowrates and rotational speeds, visual observations indicated either a smooth or slightly wavy film surface, suggesting a laminar flow, similar to other literature studies [34]. In such cases, no significant micromixing is taking place, since an injected dye maintains a sharp front within the film or even within the waves formed on the film surface [35]. Additionally, at low constant rotational speed values, an increase in the flowrate is characterized by shorter residence time periods on the disc [6,36,37], which essentially explains the decrease in the color and suspended solids removals at 100 rpm, with the WW flowrate increases (Table 2).
At higher rotational speeds, disordered ripples of finer structure are formed on the liquid film surface, indicating the start of a turbulent flow regime and, thus, an increased micromixing which induces increased color adsorption and SS removal. The density of such irregular waves at increasing rotational speeds of 400, 550, and 850 rpm appears to remain approximately the same, thus similar micromixing intensities were acting within the liquid film and, consequently, the highest removal values were registered in the above-mentioned rotation speed interval. However, the largest flowrates of 20, 25, and 30 L/h, in the same rotational speed interval rendered a decrease in the maximum discoloration and SS removal, possibly due to the shorter residence time periods despite the increased degree of micromixing.
At larger rotational speeds, of 1200 and 1500 rpm, the liquid residence time decreases further and the intense micromixing is not efficient.
Bentonite used in this study is known as a natural clay material with good adsorption capabilities for different types of pollutants, organic or inorganic compounds, including heavy metals. A WW treatment with bentonite in a spinning disc setup was expected to have increased adsorption capabilities given the intensive micromixing and the much smaller micromixing times compared to the larger disc residence times [36]. Thus, a significant decrease in color was expected and finally observed in the laboratory SD setup. Additionally, bentonite is known to promote agglomeration (as coagulation adjuvant), which typically contains two stages, the first one characterized by rapid mixing for a better dispersion of the destabilization agent (coagulation adjuvant) and the second characterized by a gentler mixing to allow for flocs formation and separation by settling. However, it is known that by varying such factors as mixing speed (an increase during the second stage of coagulation), mixing intensity, and mixing time, improvements in the suspended solids and turbidity removal can be obtained [38,39]. That is why it is possible that certain values of the WW flowrate and disc rotational speed within the SD setup have rendered improved values for suspended solids and turbidity within relatively short time periods.
The wastewater treatment efficiency by SD technology in the presented laboratory setup is reasonably good, considering that no other chemical, mechanical-physical or biological treatment processes or operations were applied. Thus, one can use this technology to minimize the color and suspended solids loads within relatively short periods of time (ranging from 25 up to 60 min, depending on the working conditions, as seen in Table 2).

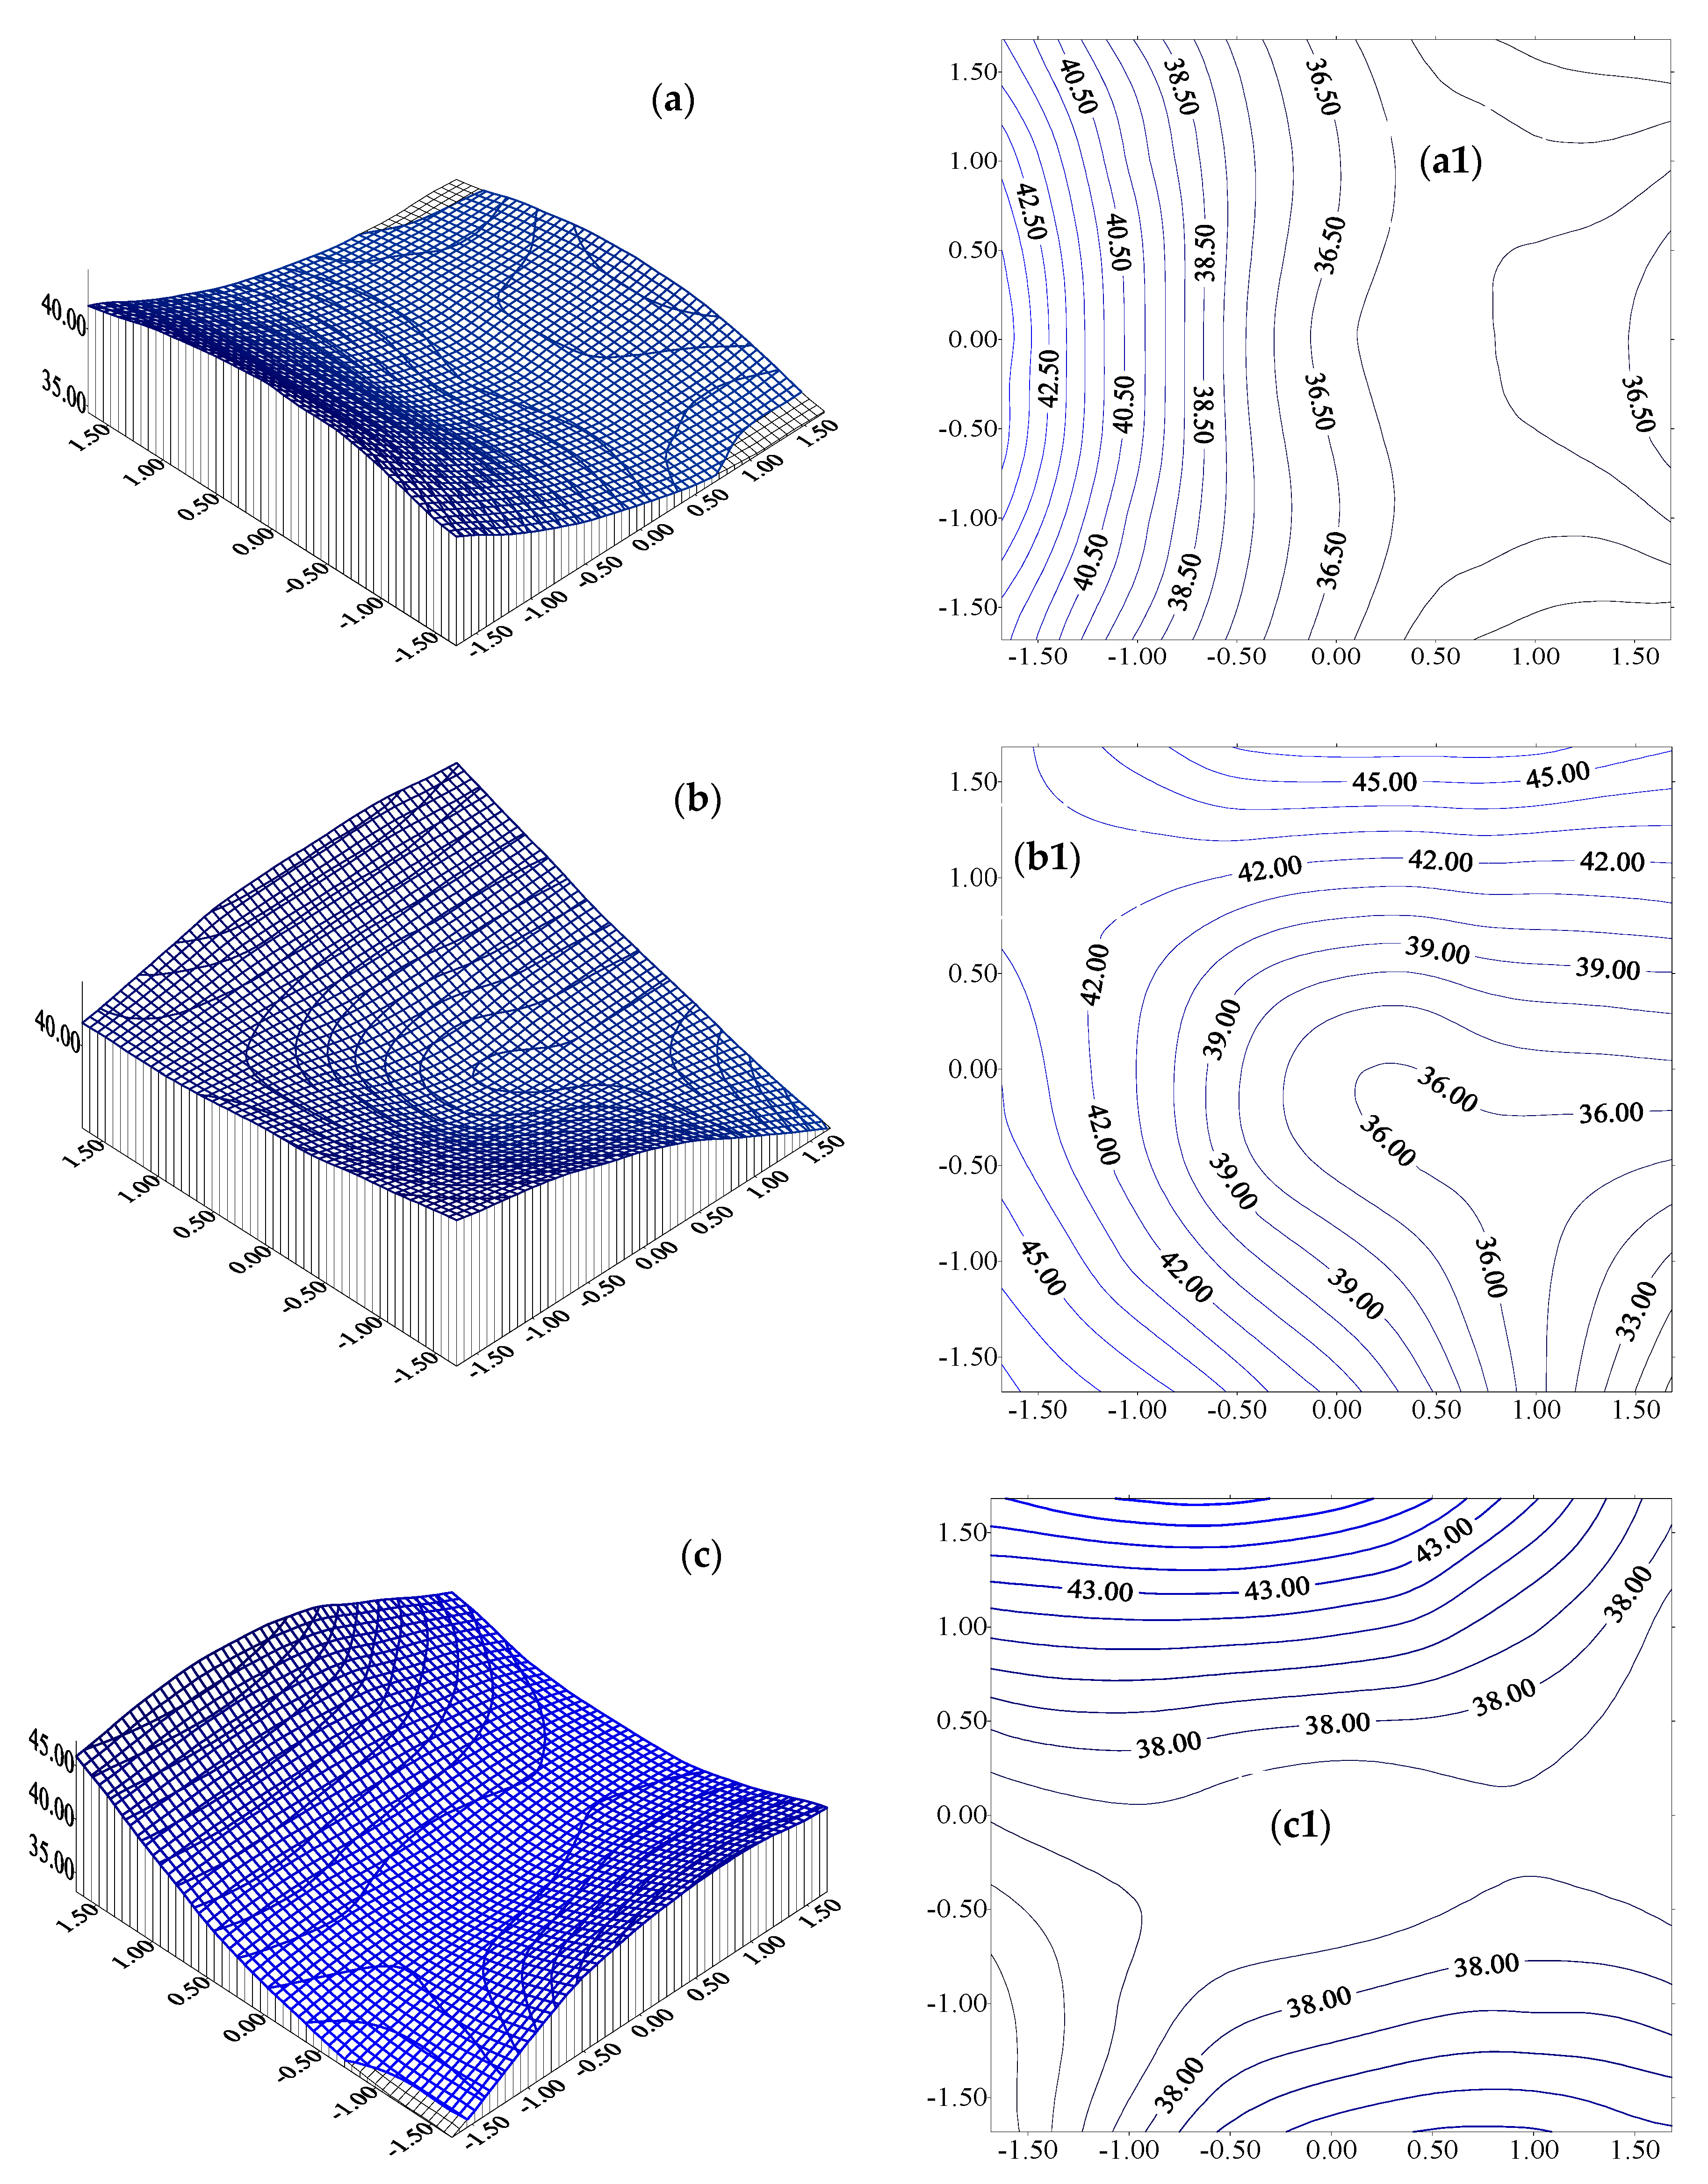
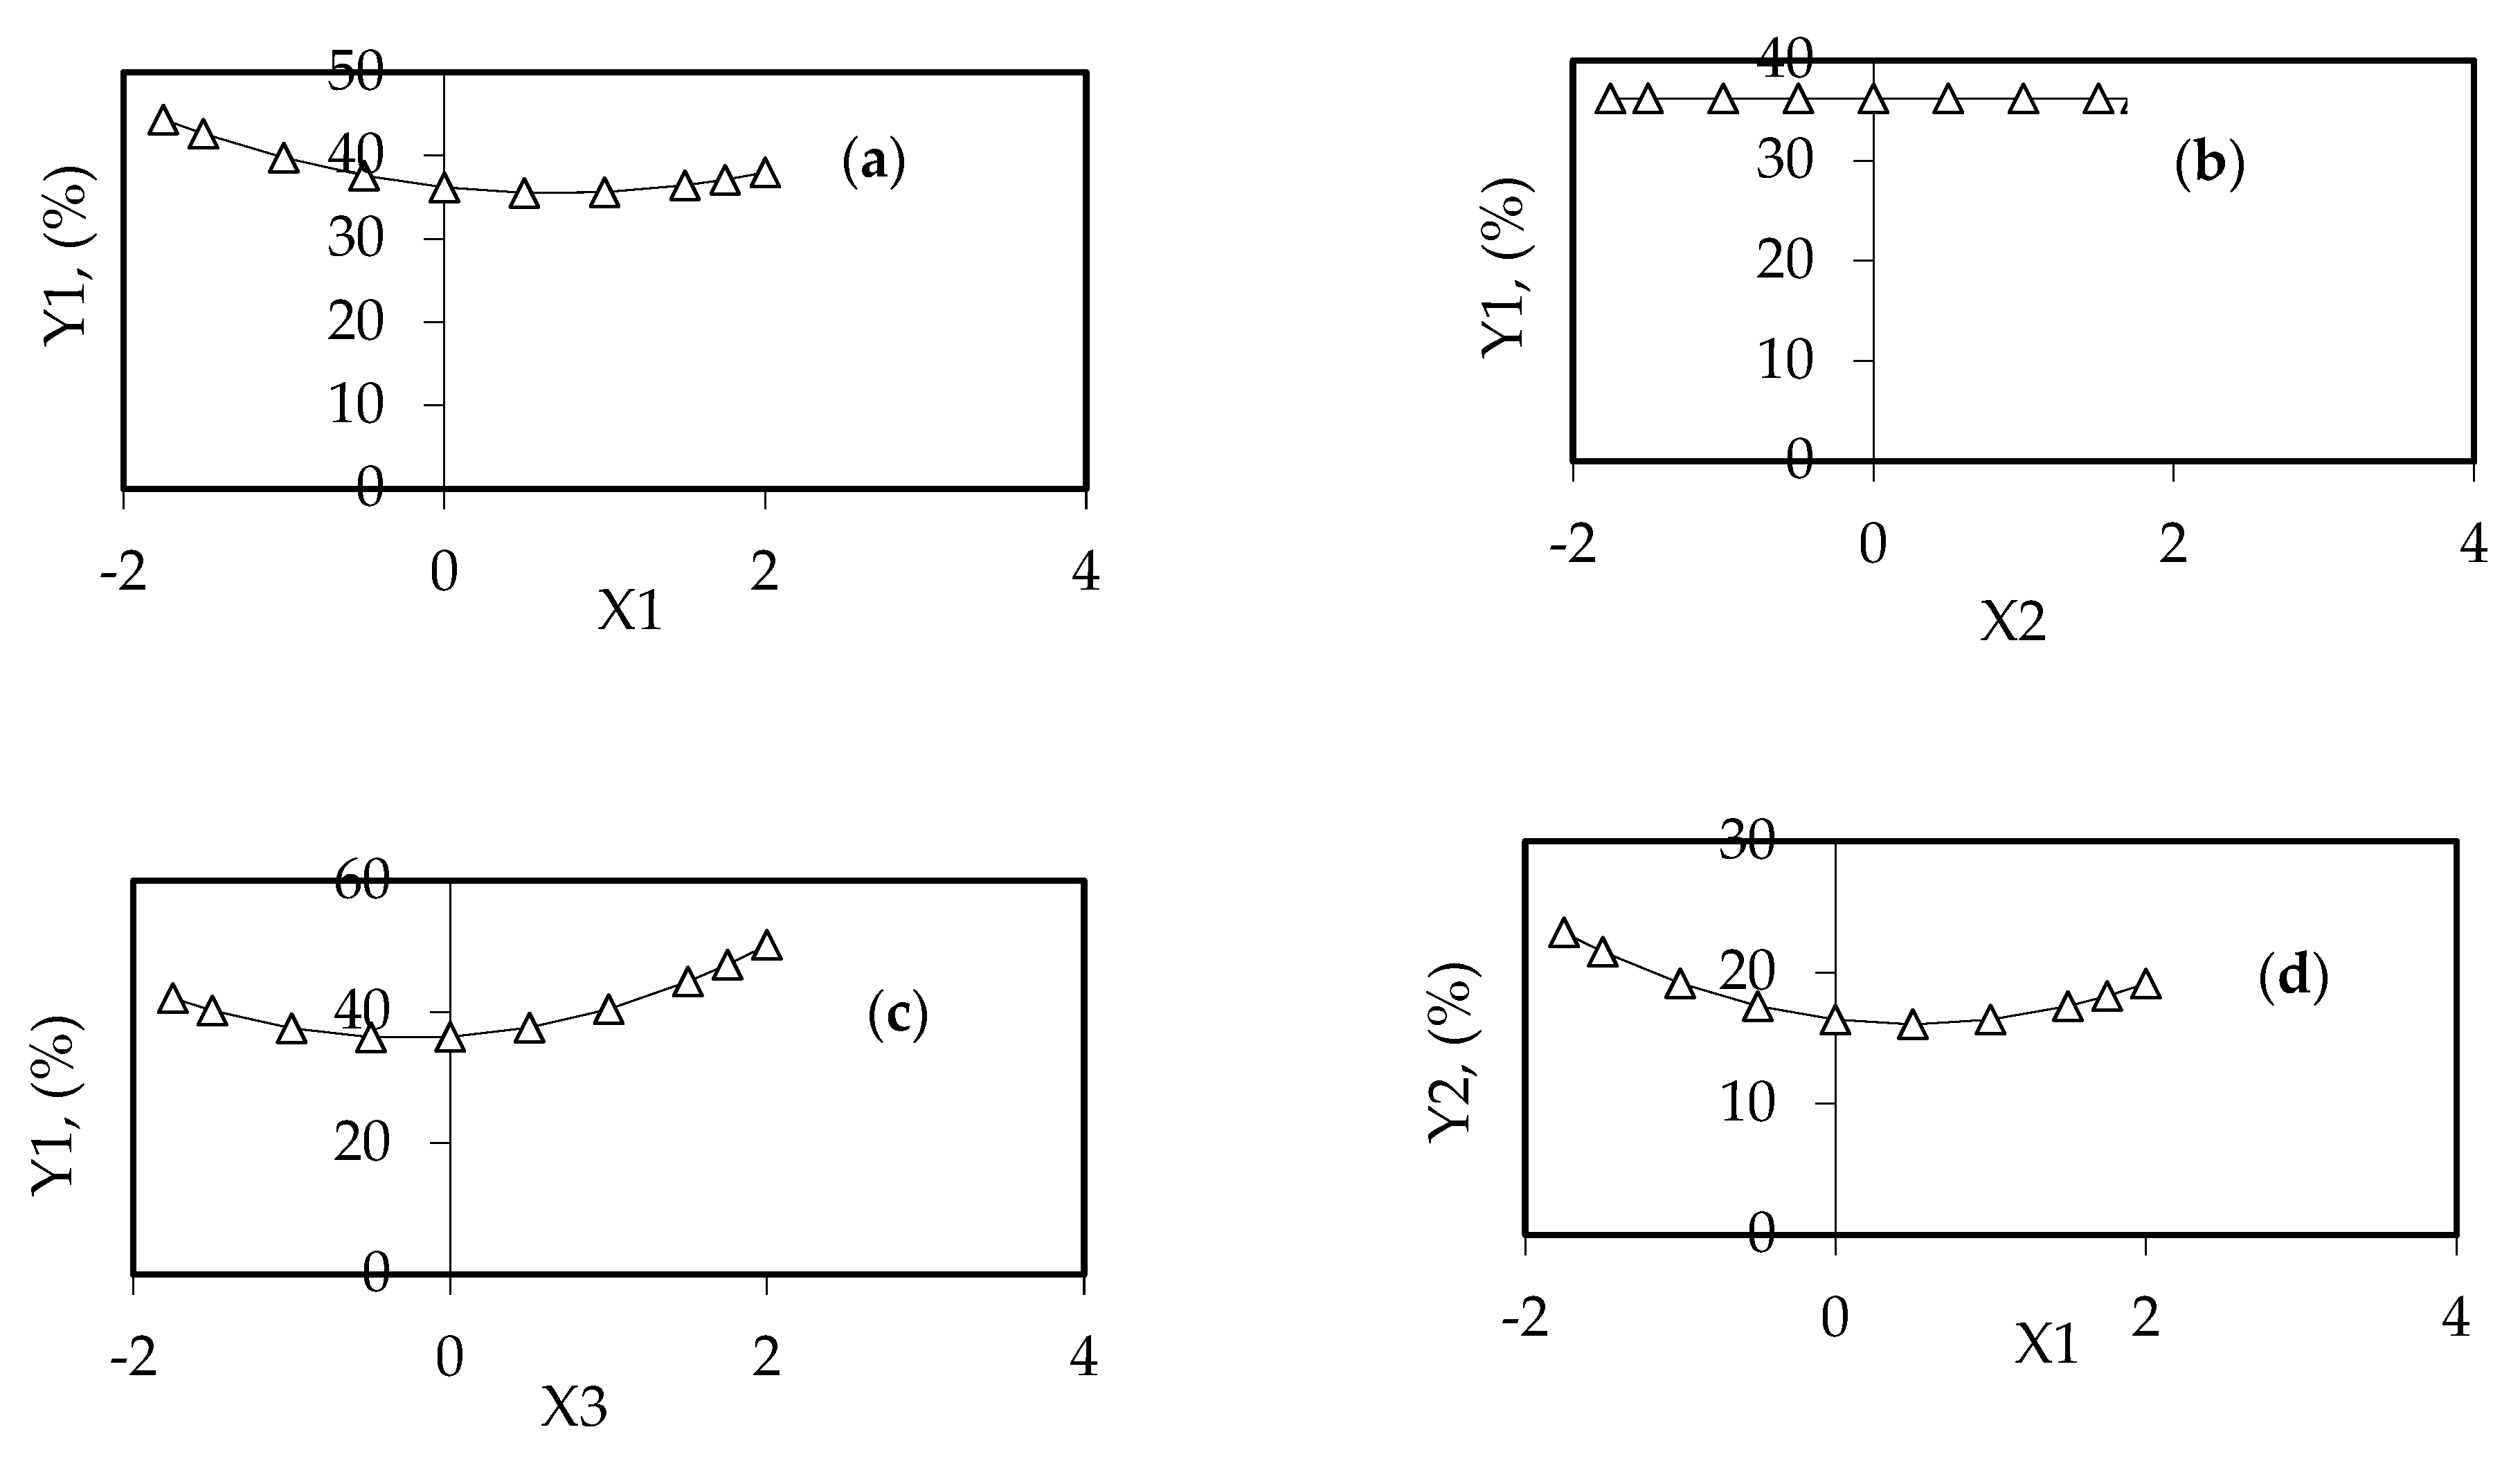
3.2. Modeling of Textile WW Treatment in the Laboratory SD Setup

Efficient modeling and monitoring methods are becoming very important in each rigorous industrial WW treatment system organized in any processing/manufacturing industry. Therefore, improving the WW treatment performance requires an accumulation of accurate knowledge of existing or newly designed WW treatment systems, and also demands mathematical modeling and optimization. The issue of modeling associated with optimization is very problematic due to model complexity (i.e., several variables, kinetic and stoichiometric parameters, etc.). Therefore, the key operating parameters (namely, the three independent variables) influencing the removal efficiency were selected, and the prediction model efficiency and sensitivity analysis by known statistics methodology was performed, because it is difficult to simultaneously consider all selected variables while predicting the results. The designing and modeling of the WW treatment process in the SD setup was performed by using an empirical experimental planning with an active central composite rotatable 23 order design, considering three independent variables (z1, z2, z3) and two response functions or optimization criteria—i.e., suspended solids removal (Y1) and discoloration (Y2).
The real (zi0) and coded basic (Xi0) values of the three studied independent variables are shown in Table 3, together with their variation steps (Δzi0). The experimental variation field for the operating time (X3) was short (no more than 25–30 min) due to two main reasons: (i) energy cost minimization and (ii) if additional chemical oxidative processes are applied (e.g., Fenton oxidation, especially for organics removal); these operate efficiently and attain high removals after a short period of time (frequently no more than 20–30 min).
The experimental planning design is presented in Table 4 and Table 5, with the experimental design matrixes for Y1 and Y2 associated with their experimental values (Yie) and calculated with the proposed model values (Yi).
The experimental results from Table 4 and Table 5 enabled the proposal of the mathematical models after the significance evaluation of the model coefficients, using the Student’s test:
Y1 = 36.1903 − 2.0696X1 + 1.4709X3 + 1.4819X12 + 2.7659X32 + 1.5946X1X3 − 1.2919X2X3,
Y2 = 16.4018 − 1.3847X1 + 1.377X12.
The average deviation value of the experimental data from the calculated data with the proposed model was −0.390% for Y1 and +3.379% for Y2, which was within the acceptable limits (±10%). The validation of the models was carried out by an appropriate analysis of variance by Fisher constant (F), correlation coefficients (RYx1x2x3), and Fisher test (Fc). The calculated values of F constant were F(Y1) = 45.383 for Y1 and F(Y2) = 28.371 for Y2, higher than Ftab,critical = 4.6, underlining the possible influence of the independent variables on the response functions Y1 and Y2. Moreover, the calculated correlation coefficients for both response functions were high enough—namely, RY1,x1x2x3 = 0.8839 for Y1 and RY2,x1x2x3 = 0.530 for Y2—indicating a relative good correlation between the experimental and the modeled data. Thus, the important influence of the independent variables on each response function (especially Y1 and only of one independent variable (X1) in the case of Y2) was sustained. The calculated values of the Fisher test were Fc (Y1) = 40.560 for Y1 and Fc (Y2) = 2.086 for Y2, and related to Fstatistic_table = 6.59, from which one can conclude that all three tested independent variables (X1, X2, X3) had a significant importance with respect to the suspended solids removal (Y1) from the textile WW, and two independent variables (X2 and X3) had no importance regarding the WW discoloration.
Figure 8(a,a1)–(c,c1) and Figure 9a–c illustrate the dependence of the WW suspended solids removal (Y1) vs. two independent variables (one variable was kept at the basic value) (i.e.,Y1 = Y1(X1,X2,0); Y1 = Y1(X1,0,X3), and Y1 = Y1(0,X2,X3) with their isolines) and one independent variable (two variables were maintained at their basic values).
Figure 9d illustrates the dependence of textile WW discoloration (Y2) on one significant independent variable (X1) (X2 and X3 are constant, at their basic value and not influencing theY2 value).
The variation in the suspended solids removal (Y1) with the increase inthe WW flowrate (X1) is obvious in Figure 9a. One can observe a minimum of suspended solids removal (Y1 = 35.467%) for X1* = 0.6984 and a local maximum (Y1 = 44.351%) for a WW flowrate of 24.19 L/h, a rotational speed of 300 rpm, and a working time interval of 15 min. The dependence of the suspended solids removal (Y1) on the rotational speed (X2) indicates a constant value (Y1 = 36.190%) for all X2* values (Figure 9b). The variation inY1 with an increase in the working time (X3) indicates a minimum removal (Y1 = 36.777%) for X3* = +0.2659 (a local minimum for a flowrate of 20 L/h, a rotational speed of 300 rpm, and an operating time of 16.33 min (Figure 9c).
One can observe the existence of a minimum discoloration degree (Y2 = 16.054%) for X1* = 0.5025 and also of a local maximum (Y2 = 23.046%) for X1* = −1.75 in the investigated experimental field.
Overall, the application of classical optimization methodology leads to the conclusion that the Y1 function (suspended solids removal) has a distinct minimum (Y1 = 35.4677%), corresponding to X1* = −0.6983, X2* = 2.0005, and X3* = 0. Transposed to real variables, these values correspond to a WW flowrate of 24.19 L/h, a rotational speed of 600 rpm, and a working time period of 15 min. Moreover, for the proposed empirical Y1 model, a local maximum exists in the investigated experimental field (Y1 = 45.624%), corresponding to X1* = 0, X2* = 0, and X3* = +1.682, meaning a WW flowrate of 20 L/h, a rotation speed of 300 rpm, and a working time of 15 min.
In the case of the discoloration degree (Y2), a distinct minimum (Y2 = 20.046%) and a local maximum (Y2 = 23.046%) exist in the investigated experimental field, for a WW flowrate of 9.50 (≈10) L/h, a rotational speed of 300 rpm, and a working time of 15 min.

4. Conclusions

An experimental study was initiated to assess the SD technology efficiency in textile wastewater treatment with bentonite added in it by investigating the colour and the suspended solids removals and to establish the influence of effluent flowrate and disc rotational speed on the process. For the investigated disc rotational speed and flowrate values, the highest suspended solids removal values ranged from 50% up to 61.13% and, for the discoloration, from 33.16% up to 49.64%, which indicates a satisfactory efficiency of the SD technology within the laboratory setup. Furthermore, these maximum values pertain to increasing trends, which indicates that even higher values may be obtained, given longer working time periods.
After applying an active central composite rotatable 23 design, the mathematical models with three independent variables (WW flowrate, rotational speed, working time) for suspended solids removal (Y1) and discoloration degree (Y2) were proposed, associated with their optimal values. For short period of SD setup working, meaning no more than 24 min, the values of removal were relatively good in the case of suspended solids (33.706–45.344%) and low for discoloration (13.819–25.644%), considering that no other treatment process (physical, chemical, or biological ones) was applied. This modeling and optimization study represents a pertinent application of the SD technology in the textile wastewater treatment for suspended solids and color removal.
This research is prone to other improvements by additional chemical processes (e.g., advanced oxidation by Fenton oxidation), especially for organics removal from textile wastewaters.

Author Contributions

The contribution of both authors is equal. Both authors have read and agreed to the published version of the manuscript.

Funding

This research received no external funding.

Conflicts of Interest

The authors declare no conflict of interest.

References

  1. Huang, G.H.; Chang, N.-B. The Perspectives of Environmental Informatics and Systems Analysis. J. Environ. Inform. 2003, 1, 1–6. [Google Scholar] [CrossRef]
  2. Yu, R.F.; Chen, H.W.; Cheng, W.P.; Huang, H.D. Applying Online Image Analysis to Simultaneously Evaluate the Removals of Suspended Solids and Color from Textile Wastewater in Chemical Flocculated Sedimentation. J. Environ. Inform. 2017, 29, 29–38. [Google Scholar]
  3. Boiarkina, I.; Norri, S.E.; Patterson, D.A. Investigation into the effect of flow structure on the photocatalytic degradation of methylene blue and dehydroabietic acid in a spinning disc reactor. Chem. Eng. J. 2013, 222, 159–171. [Google Scholar] [CrossRef] [Green Version]
  4. Stankiewicz, A.I.; Moulijn, J.A. Process intensification: Transforming chemical engineering. Chem. Eng. Prog. 2000, 96, 22–34. [Google Scholar]
  5. Aoune, A.; Ramshaw, C. Process intensification: Heat and mass transfer characteristics of liquid films on rotating discs. Int. J. Heat Mass Transf. 1999, 42, 2543–2556. [Google Scholar] [CrossRef]
  6. Iacob-Tudose, E.T.; Zaharia, C. Spinning Disc Technology—Residence Time Distribution and Efficiency in Textile Wastewater Treatment Application. IOP Conf. Ser. Mater. Sci. Eng. 2018, 374, 012037. [Google Scholar] [CrossRef]
  7. Boodhoo, K.V.K.; Jachuck, R.J. Process intensification: Spinning disk reactor for styrene polymerisation. Appl. Therm. Eng. 2000, 20, 1127–1146. [Google Scholar] [CrossRef]
  8. Boodhoo, K.V.K.; Jachuck, R.J. Process intensification: Spinning disc reactor for condensation polymerization. Green Chem. 2002, 2, 235–244. [Google Scholar] [CrossRef]
  9. Sana, S.; Boodhoo, K.V.K.; Zivkovic, V. Production of starch nanoparticles through solvent-antisolvent precipitation in a spinning disc reactor. Green Proc. Synth. 2019, 8, 507–515. [Google Scholar] [CrossRef]
  10. Khan, W.H.; Rathod, V.K. Process intensification approach for preparation of curcumin nanoparticles via solvent–nonsolvent nanoprecipitation using spinning disc reactor. Chem. Eng. Proc. 2014, 80, 1–10. [Google Scholar] [CrossRef]
  11. Raveendran, P.; Fu, J.; Wallen, S.L. Completely ‘green’ synthesis and stabilization of metal nanoparticles. J. Am. Chem. Soc. 2003, 125, 940–953. [Google Scholar] [CrossRef] [PubMed]
  12. Feng, X.; Patterson, D.A.; Balaban, M.; Fauconnier, G.; Emanuelsson, E.A.C. The spinning clothdisc reactor for immobilized enzymes: A new process intensification technology forenzymatic reactions. Chem. Eng. J. 2013, 221, 407–417. [Google Scholar] [CrossRef] [Green Version]
  13. Qiu, Z.; Petera, J.; Weatherle, L.R. Biodiesel synthesis in an intensified spinning disk reactor. Chem. Eng. J. 2012, 210, 597–609. [Google Scholar] [CrossRef]
  14. Dyonisos, D.D.; Balasubramanian, G.; Suidan, M.T.; Khodadoust, A.P.; Baudin, I.; Laine, J.M. Rotating disk photocatalytic reactor: Development, characterization and evaluation for the destruction of organic pollutants in water. Water Res. 2000, 349, 2927–2940. [Google Scholar]
  15. Chang, C.Y.; Wu, N.L. Process analysis on photocatalyzed dye decomposition for water treatment with TiO2-coated rotating disk reactor. Ind. Eng. Chem. Res. 2010, 49, 12173–12179. [Google Scholar] [CrossRef]
  16. Zhang, A.Y.; Zhou, M.H.; Han, L.; Zhou, Q.X. The combination of rotating disk photocatalytic reactor and TiO2 nanotube arrays for environmental pollutants removal. J. Hazard. Mater. 2011, 186, 1374–1383. [Google Scholar] [CrossRef]
  17. Ahn, D.H.; Chang, W.S.; Yoon, T.I. Dyestuff wastewater treatment using chemical oxidation, physical adsorption and fixed bed biofilm process. Proc. Biochem. 1999, 34, 429–439. [Google Scholar] [CrossRef]
  18. Hamouda, M.A.; Anderson, W.B.; Huck, P.M. Decision support systems in water and wastewater treatment process selection and design: A review. Water Sci. Technol. 2009, 60, 1757–1770. [Google Scholar] [CrossRef]
  19. Lin, S.H.; Chen, M.L. Treatment of textile wastewater by chemical methods for reuse. Water Res. 1997, 31, 868–876. [Google Scholar] [CrossRef]
  20. Lin, S.H.; Peng, C.F. Continuous treatment of textile wastewater by combined coagulation, electrochemical oxidation and activated sludge. Water Res. 1996, 30, 587–592. [Google Scholar] [CrossRef]
  21. Muga, H.E.; Mihelcic, J.R. Sustainability of wastewater treatment technologies. J. Environ. Manag. 2008, 88, 437–447. [Google Scholar] [CrossRef] [PubMed]
  22. Sonune, A.; Ghate, R. Developments in wastewater treatment methods. Desalination 2004, 167, 55–63. [Google Scholar] [CrossRef]
  23. Wang, J.P.; Chen, Y.Z.; Ge, X.W.; Yu, H.Q. Optimization of coagulation–flocculation process for a paper-recycling wastewater treatment using response surface methodology. Colloids Surf. A Physicochem. Eng. Asp. 2007, 302, 204–210. [Google Scholar] [CrossRef]
  24. Zaharia, C.; Suteu, D.; Muresan, A. Options and solutions for textile effluent decolourization using some specific physico-chemical treatment steps. Environ. Eng. Manag. J. 2012, 11, 493–509. [Google Scholar] [CrossRef]
  25. Zaharia, C. Decentralized wastewater treatment systems: Efficiency and its estimated impact against onsite natural water pollution status. A Romanian case study. Proc. Safety Environ. Res. 2017, 108, 74–88. [Google Scholar] [CrossRef]
  26. Zaharia, C. Discoloration of industrial effluents by adsorption-based treatment onto coal fly ash activated with lime. Desalin. Water Treat. 2018, 127, 364–376. [Google Scholar] [CrossRef]
  27. Secula, M.S.; Suditu, G.D.; Poulios, I.; Cojocaru, C.; Cretescu, I. Response surface optimization of the photocatalytic decolorization of a simulated dyestuff effluent. Chem. Eng. J. 2008, 141, 18–26. [Google Scholar] [CrossRef]
  28. Wang, J.P.; Chen, Y.Z.; Wang, Y.; Yuan, S.J.; Yu, H.Q. Optimization of the coagulation-flocculation process for pulp mill wastewater treatment using a combination of uniform design and response surface methodology. Water Res. 2011, 45, 5633–5640. [Google Scholar] [CrossRef]
  29. Poroch-Seritan, M.; Gutt, S.; Gutt, G.; Cretescu, I.; Cojocaru, C.; Severin, T. Design of experiments for statistical modeling and multi-response optimization of nickel electroplating process. Chem. Eng. Res. Design 2011, 89, 136–147. [Google Scholar] [CrossRef]
  30. Zaharia, C.; Diaconescu, R.; Surpăţeanu, M. Optimization study of a wastewater chemical treatment with PONILIT GT-2 anionic polyelectrolyte. Environ. Eng. Manag. J. 2006, 5, 1141–1152. [Google Scholar] [CrossRef]
  31. Zaharia, C.; Diaconescu, R.; Surpăţeanu, M. Study of flocculation with Ponilit GT-2 anionic polyelectrolyte applied into a chemical wastewater treatment. Open Chem. 2007, 5, 239–256. [Google Scholar] [CrossRef]
  32. ***Catalog of Standards; International Standardization Institute Press: Bucuresti, Romania, 2010.
  33. Rodrigues, M.I.; Iemma, A.F. Experimental Design and Process Optimization, 1st ed.; CRC Press: Boca Raton, FL, USA, 2014; ISBN 9781482299557. [Google Scholar]
  34. Woods, W. The Hydrodynamics of Thin Liquid Films Flowing over a Rotating Disc. Ph.D. Thesis, University of Newcastle upon Tyne, Newcastle upon Tyne, UK, 1995. [Google Scholar]
  35. Boiarkina, I.; Norris, S.; Patterson, D. The case for the photocatalytic spinning disc reactor as a process intensification technology: Comparison to an annular reactor for the degradation of methylene blue. Chem. Eng. J. 2013, 225, 752–765. [Google Scholar] [CrossRef] [Green Version]
  36. Iacob Tudose, E. Hydrodynamics on a spinning disc reactor. In Proceedings of the 4th International Conference on Chemical Engineering—Innovative Materials and Processes—ICCE2018, Iasi, Romania, 31 October–2 November 2018. [Google Scholar]
  37. Mohammadi, S.; Boodhoo, K.V.K. Online conductivity measurements of residence time distribution of thin film flow in the spinning disc reactor. Chem. Eng. J. 2012, 207, 885–894. [Google Scholar] [CrossRef] [Green Version]
  38. Letterman, R.D.; Quon, J.E.; Gemell, R.S. Influence of rapid-mix parameters on flocculation. J. Am. Water Works Assoc. 1973, 65, 716–722. [Google Scholar] [CrossRef]
  39. Sánchez-Martín, J.; Beltrán-Heredia, J.; Peres, J.A. Improvement of the flocculation process in water treatment by using Moringa Oleifera seeds extract. Braz. J. Chem. Eng. 2012, 29, 495–501. [Google Scholar] [CrossRef] [Green Version]
Figure 1. Experimental setup for the wastewater quality measurements. 1—rotating disc; 2—electric motor; 3—housing; 4—tank; 5—centrifugal pump; 6—adjusting tap; 7—flowmeter; 8—tap.
Applsci 10 08687 g001
Figure 2. Variation in the time of the textile WW suspended solids (MS) and colour at 10 L/h flowrate and three different rotational speeds: (a) 100 rpm, (b) 300 rpm, (c) 500 rpm.
Applsci 10 08687 g002
Figure 3. Variation in the time of the textile WW suspended solids (MS) and colour at a 30 L/h flowrate and three different rotational speeds: (a) 100 rpm, (b) 300 rpm, (c) 500 rpm.
Applsci 10 08687 g003
Figure 4. Influence of the WW flowrate on the discoloration at different disc rotational speeds: (a) 100 rpm, (b) 250 rpm, (c) 400 rpm, (d) 550 rpm, (e) 850 rpm, (f) 1200 rpm, (g) 1500 rpm.
Applsci 10 08687 g004
Figure 5. Influence of the WW flowrate on the suspended solids removal at different disc rotational speeds: (a) 100 rpm, (b) 250 rpm, (c) 400 rpm, (d) 550 rpm, (e) 850 rpm, (f) 1200 rpm, (g) 1500 rpm.
Applsci 10 08687 g005
Figure 6. Influence of the disc rotational speed on discoloration at different WW flowrates: (a) 10 L/h, (b) 15 L/h, (c) 20 L/h, (d) 25 L/h, (e) 30 L/h.
Applsci 10 08687 g006
Figure 7. Influence of the disc rotational speed on the suspended solids removal at different liquid flowrates: (a) 10 L/h, (b) 15 L/h, (c) 20 L/h, (d) 25 L/h, (e) 30 L/h.
Applsci 10 08687 g007
Figure 8. Variation in the WW suspended solids removal (Y1) vs. two independent variables (one variable was maintained at the basic value) associated with its isoline: (a) Y1 = Y(X1,X2,0); (a1) isolines −Y1(X1,X2,0); (b) Y1 = Y(X1,0,X3); (b1) isolines −Y1(X1,0,X3); (c) Y1 = Y(0,X2,X3); (c1) isolines −Y1(0,X2,X3).
Applsci 10 08687 g008
Figure 9. Variation in the WW suspended solids removal (Y1) vs. one independent variable (Xi) (two variables were constant at the basic value): (a) Y1 = Y(X1,0,0); (b) Y1 = Y(0,X2,0); (c) Y1 = Y(0,0,X3); and (d) variation of WW discoloration (Y2) vs. one independent variable (X1).
Applsci 10 08687 g009
Table 1. The principal characteristics of the studied textile wastewater.
Quality IndicatorsMeasured Value [mg/L]M.A.C. * [mg/L]Quality IndicatorsMeasured Value, [mg/L]M.A.C. * [mg/L]
pH7.12–7.896.50–8.50Total p5.70–6.451
Colour, [HU]865–445050Extractible25.50–31.8020
(A436)(1.200–2.620)substances
Suspended solids382–93035 (60)Total n8.30–10.0010
Turbidity, [FTU]180–815-Ammonia2.0–2.752
Fixed residues3580–40201000Sulfates780–850600
COD, [mg O2/L]560–655125Chlorides95–15070
CBO5, [mg O2/L]32025Phenol index2.60–3.500.30
Synthetic detergents1.70–2.500.50Total heavy metal ions<4<2 (max 5)
* M.A.C.—maximum admissible concentration, according to the Romanian Government Decision No. 352/2005: Technical Norms for Treated Wastewater Discharged in Natural Water Resources (NTPA 001).
Table 2. Maximum values of the color and suspended solids removals.
Rotation SpeedFlow RateColor Removal 1SS Removal 2Time Period 1,2
[rpm][L/h][%][%][min]
1001045.2112.8250; 45
1541.6757.3260; 60
2027.6145.9850; 60
2525.1711.1140; 30
3017.3211.1830; 30
2501018.9554.2960; 60
1522.9542.0560; 60
2033.1645.9860; 60
2527.336.7821; 30
3018.7911.1830; 25
4001022.4150.0060; 60
1531.225.1960; 50
2046.9849.7850; 50
2527.3530.6130; 35
3018.184.2830;14
5501022.4110.6260; 50
1553.5061.1350; 50
2010.6316.0150; 40
2517.7230.6035; 35
3017.519.7130; 25
8501043.079.3360; 52
1548.0345.5360; 55
2036.0851.8850; 50
2531.5854.5140; 40
3030.18-30; -
12001037.4526.3560; 60
1539.5652.1460; 60
2039.0938.9558; 53
2514.764.240; 35
30-14.08-; 25
150010-- -
1549.6454.9830; 25
20-- -
25-- -
301.696.6820; 15
Note: 1 Color removal; 2 SS removal.
Table 3. The codification of independent variables in the active central composite rotatable 23 design.
Variable/ValueReal VariableCoded VariableReal Basic VariableVariation Step
(zi)(Xi)(zi0)zi0)
WW flowrate, [L/h]Z1X1206
Rotation speed, [rpm]Z2X2300150
Operating time, [min]Z3X3155
Table 4. Experimental planning matrix for Y1 (suspended solids removal).
Exp. No.Z1Z2Z3X1X2X3Y1e
[%]
Y1
[%]
Deviation
A = (Y1eY1) × 100/Y1e
[%]
11415010−1−1−143.29641.3404.519
226150101−1−132.03034.011−6.185
31445010−11−142.27343.923−3.904
4264501011−139.29336.5956.865
51415020−1−1141.43443.676−5.411
626150201−1145.34442.7265.774
71445020−11144.04141.0926.696
8264502011138.64140.142−3.885
91030015−1.6820043.48243.864−0.878
103030015+1.6820036.03436.902−2.407
1120102150−1.682034.91636.190−3.650
1220550150+1.682035.75436.190−1.220
1320300700−1.68241.15441.541−0.941
14203002400+1.68245.62446.489−1.897
15203001500036.49936.1900.846
16203001500036.40636.1900.592
17203001500036.31336.1900.338
18203001500033.70636.190−7.371
19203001500034.17136.190−5.909
20203001500040.32036.1909.397
Table 5. Experimental planning matrix for Y2 (discoloration degree).
Exp. No.Z1Z2Z3X1X2X3Y2e
[%]
Y2
[%]
Deviation (A)
A = (Y2eY2) × 100/Y1e
[%]
11415010−1−1−118.24419.165−5.047
226150101−1−120.05816.39518.263
31445010−11−119.80419.1653.228
4264501011−117.95416.3958.684
51415020−1−1119.33319.1650.870
626150201−1120.71116.3950.164
71445020−11119.26019.1650.494
8264502011117.73716.3957.567
91030015−1.6820025.64422.63011.754
103030015+1.6820014.50917.971−23.859
1120102150−1.682018.46216.40211.159
1220550150+1.682015.52416.402−5.654
1320300700−1.68219.04216.40213.865
14203002400+1.68218.49816.40211.332
15203001500018.75216.40212.533
16203001500018.02716.4029.015
17203001500015.27016.402−7.412
18203001500013.81916.402−18.690
19203001500015.59716.402−5.160
20203001500017.04816.4023.790
Publisher’s Note: MDPI stays neutral with regard to jurisdictional claims in published maps and institutional affiliations.

