Article

Performance Analysis of Multi-Spindle Drilling of Al2024 with TiN and TiCN Coated Drills Using Experimental and Artificial Neural Networks Technique

1
School of Engineering, Edith Cowan University, Joondalup, WA 6027, Australia
2
School of Mechanical and Design Engineering, University of Portsmouth, Portsmouth PO1 3DJ, UK
*
Author to whom correspondence should be addressed.
Appl. Sci. 2020, 10(23), 8633; https://doi.org/10.3390/app10238633
Submission received: 16 November 2020 / Revised: 26 November 2020 / Accepted: 30 November 2020 / Published: 2 December 2020
(This article belongs to the Special Issue New Trends in Advanced Manufacturing in the Aeronautical Sector)

Abstract

:
Multi-spindle drilling simultaneously produces multiple holes to save time and increase productivity. The assessment of hole quality is important in any drilling process and is influenced by characteristics of the cutting tool, drilling parameters and machine capacity. This study investigates the drilling performance of uncoated carbide, and coated carbide (TiN and TiCN) drills when machining Al2024 aluminium alloy. Thrust force and characteristics of hole quality, such as the presence of burrs and surface roughness, were evaluated. The results show that the uncoated carbide drills performed better than the TiN and TiCN coated tools at low spindle speeds, while TiCN coated drills produced better hole quality at higher spindle speeds. The TiN coated drills gave the highest thrust force and poorest hole quality when compared with the uncoated carbide and TiCN coated carbide drills. Additionally, a multi-layer perceptron neural network model was developed, which could be useful for industries and manufacturing engineers for predicting the surface roughness in multi-hole simultaneous drilling processes.

1. Introduction

Aluminium and its alloys have gained significant importance through their vast applications in various manufacturing industries [1]. However, with current trends in dry machining, aluminium alloys tend to adhere to the cutting tool, which results in tool wear [2]. The wear mechanisms can affect hole quality by producing rough surfaces, additional burrs around the edges, roundness deviation, cylindricity, and high cutting forces [3,4,5]. According to Nouari et al. [6], carbide tools have been proven to perform better for the dry machining of aluminium alloys than high-speed steel (HSS) tools. However, carbide tools have limited performance at high cutting speeds, which would ultimately affect productivity. Therefore, cutting tools are usually coated using materials with a high hardness to resist wear mechanisms. In this regard, different coatings and machine tools have been widely researched to make the drilling process more effective and to produce high-quality holes [4]. Some of the previous studies on evaluating different types of tool coatings on the machinability of Al2024 alloy are discussed in Table 1.
As it can be seen from Table 1, the research on tool coating in the machining of aluminium in general and Al2024 alloy in particular is limited and most of the studies are focused only on either one-shot drilling or other machining processes. The above studies also show that the use of coating tools for drilling aluminium alloys is sometimes contradictory and still inadequate. Furthermore, no study is available in the open literature for the use of coated drills using the multi-hole simultaneous drilling approach. The multi-hole simultaneous drilling operation is performed using the multi-spindle drilling head to reduce machining time and increase productivity without compromising hole quality, which are the key factors for the machining process [12,13,14,15]. Therefore, further research is required to find suitable cutting tools and coatings for optimum machining of aluminium alloys and evaluate their performance when several coated tools are used simultaneously to create multiple holes in one go.
In a study by Aamir et al. [16], a single drilling process was compared with multi-spindle drilling using HSS drills. It was concluded that with the same drilling parameters, the multi-spindle drilling performed better than the single drilling process by providing a lower thrust force, lower surface, small burrs, short chips, and low built-up edges. In another study [17], apart from the surface, the deviation of hole from the nominal size was investigated. Additionally, the Taguchi method for optimization and the fuzzy logic approach for prediction of surface roughness   ( R a ) and hole size were used. The low spindle speed and feed rate were recommended for high-quality holes in the multi-spindle drilling process. Furthermore, the machinability of Al2024 was found to be better when compared with Al6061 and Al5083 during multi-spindle drilling [18]. Additionally, carbide tools with a high point angle were recommended in multi-spindle drilling of Al2024 as compared to HSS drills [19]. However, there is a need to research further to evaluate the performance of multi-spindle drilling for better hole quality when several coated tools are used simultaneously to create multiple holes in one go. Therefore, this study includes the investigation of coatings of TiN and TiCN on carbide tools in Al2024 using the multi-hole simultaneous drilling approach. In addition, an artificial neural network (ANN) is employed for the prediction of   R a using the multi-layer perceptron (MLP) technique. An ANN is an artificial intelligent technique used for modelling and predicting the response of complex production systems [20]. Additionally, manufacturing industries such as aerospace, automobile etc. have increased demands for products with high surface finishes where the   R a is considered as a high surface quality indicator [21]. For these reasons, modelling of   R a is of significant interest for research [20].

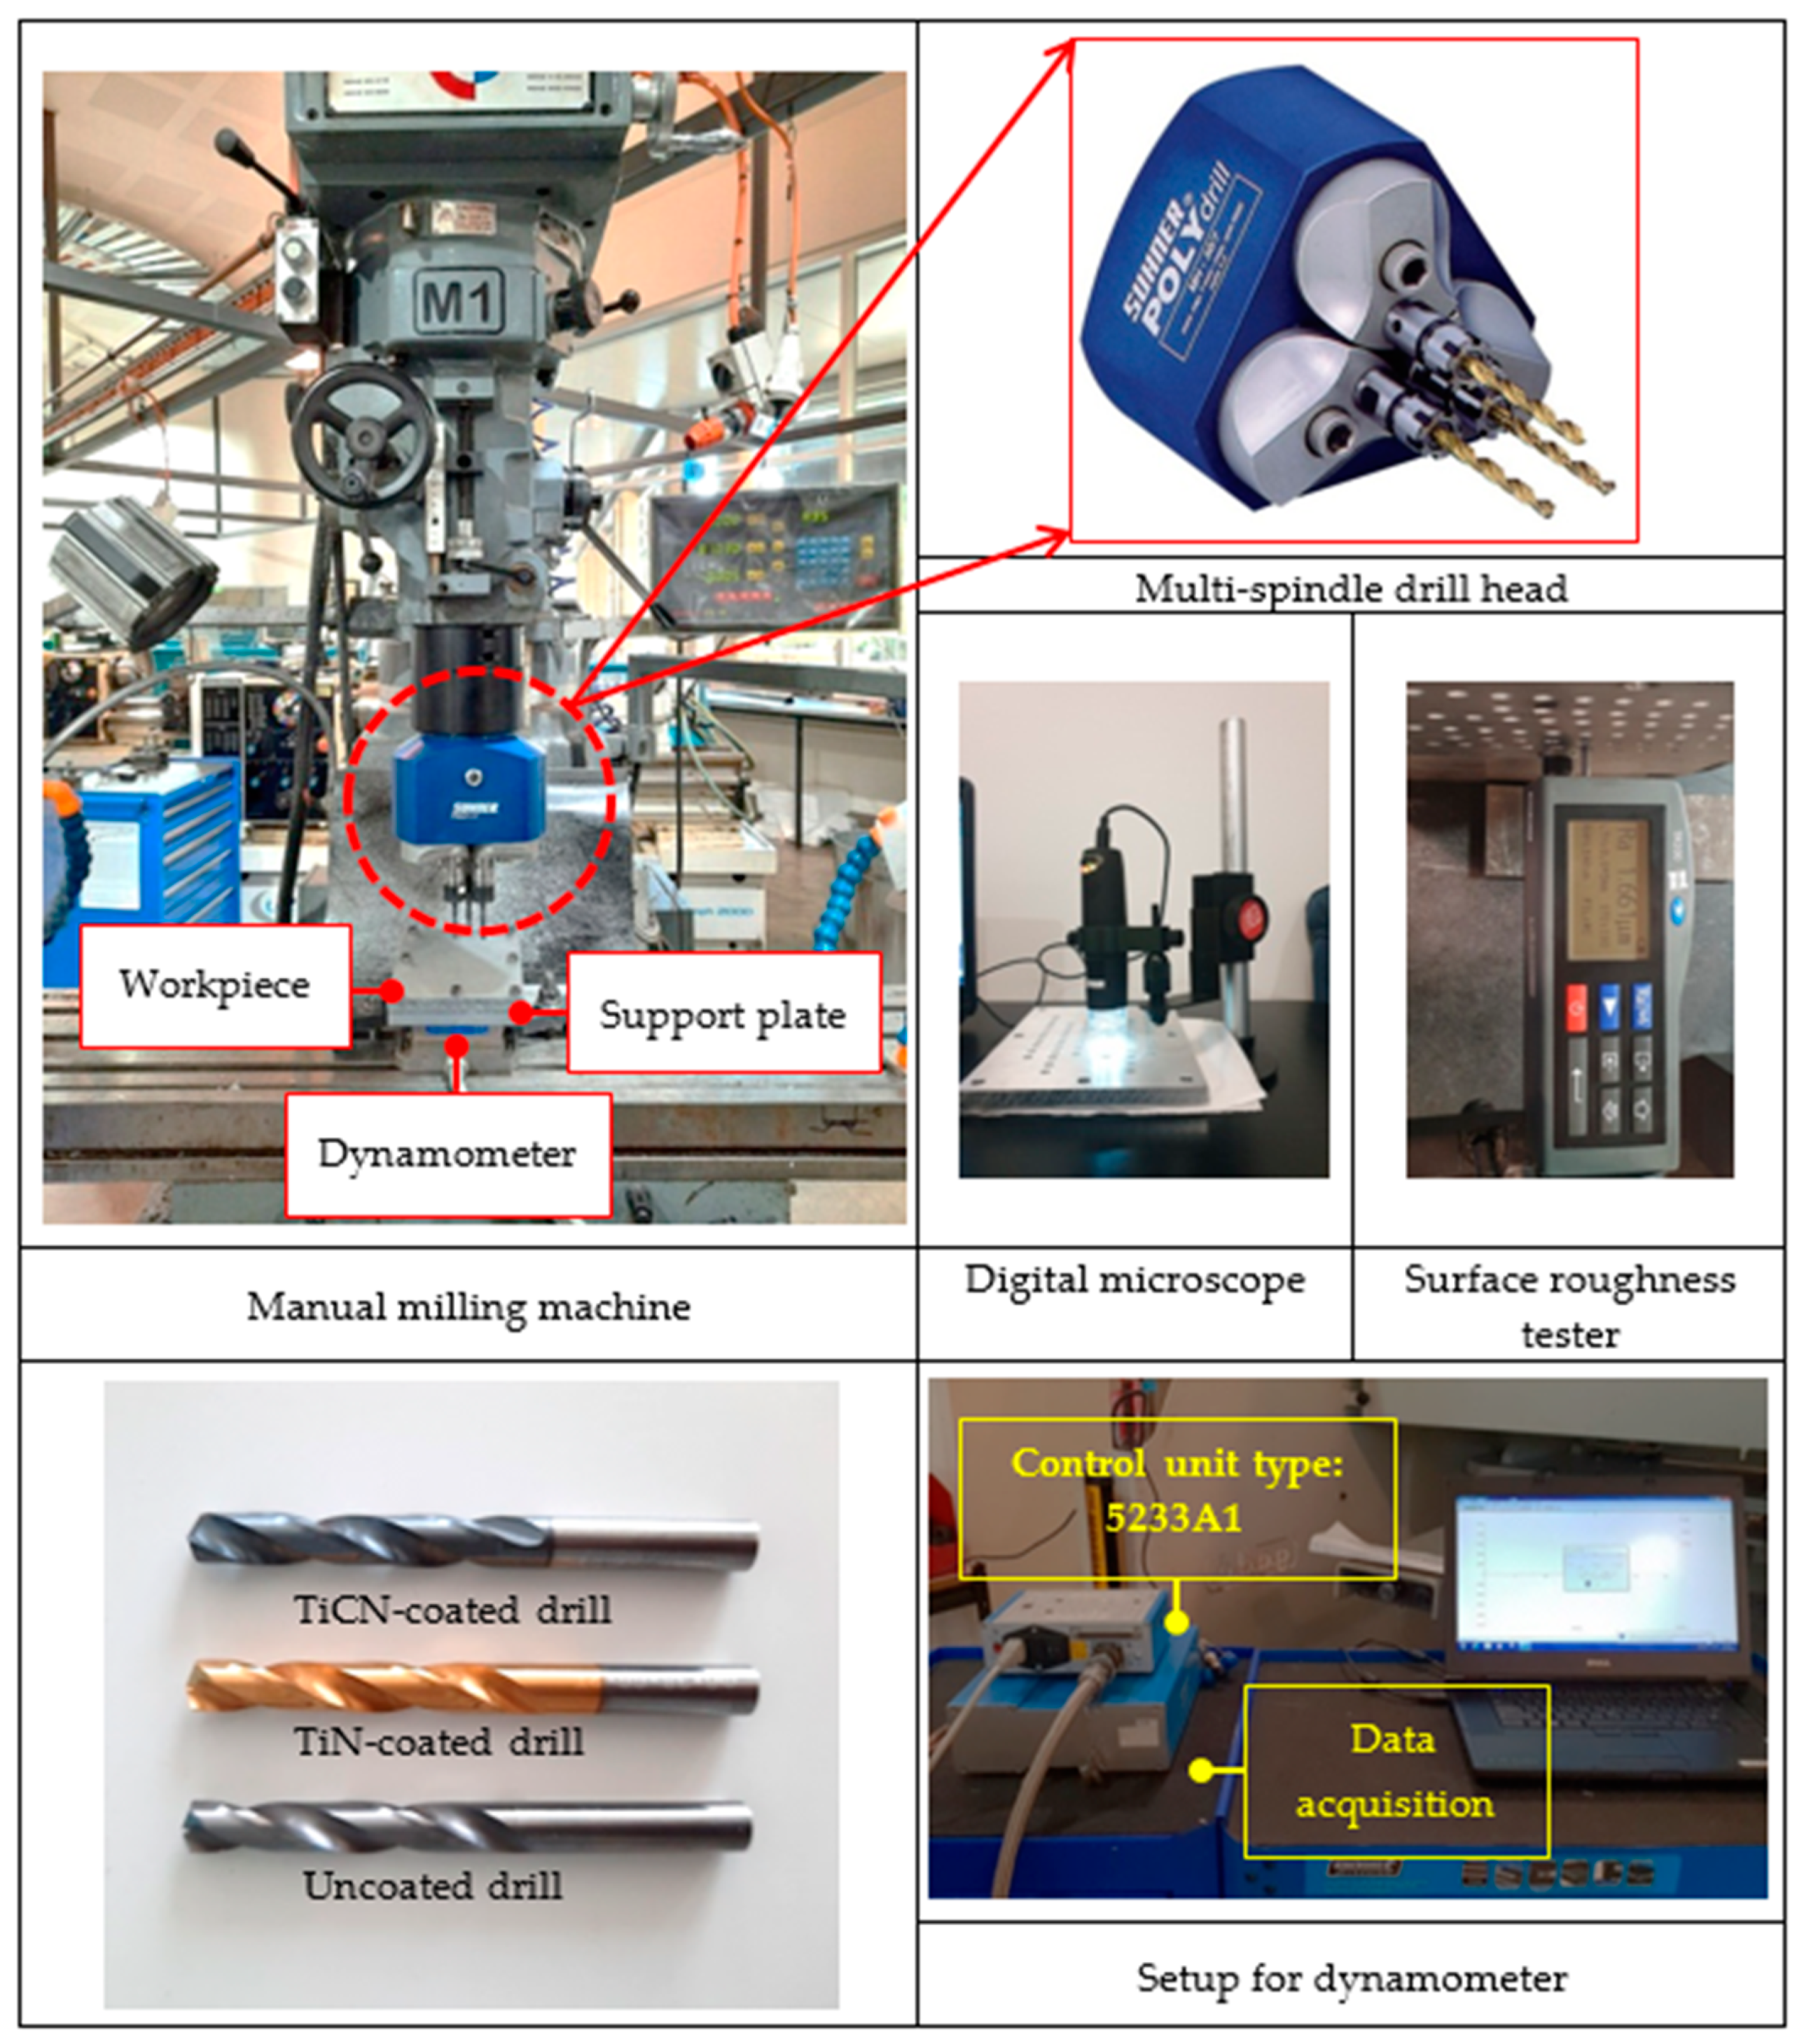
2. Materials and Methods

In this study, drilling experiments were performed using the multi-spindle drill head type MH30/13 to increase productivity and reduce time by producing multi-holes simultaneously. A manual milling machine that has a maximum spindle speed of 3450 rpm with constant feeds was used for drilling operations. Therefore, drilling parameters include the spindle speeds of 1007, 2015, and 3025 rpm whereas the selected feeds were 0.04, 0.08, and 0.14 mm/rev. These drilling parameters were considered similar to the previous study by Aamir et al. [19]. All drilling tests were conducted in a dry condition. The workpiece material used was Al2024, which is used in the aerospace industry due to its good machinability, high fracture toughness, excellent damage tolerance and resistance to fatigue crack [22]. The carbide twist drills with TiN and TiCN coatings were used for the drilling operation. All drills were 6 mm with a helix angle and point angle of 30° and 140°, respectively. The carbide drill was selected due to its combination of high hardness and toughness [23], where the high point and helix angles gave high-quality holes [8]. The 6 mm diameter is a common size for making holes in aerospace structures for creating rivets [3]. The coatings were selected to enhance the wear resistance and tool life, and improve the hole quality [24].
A Kistler 9257BA force dynamometer connected with a control unit and data acquisition was used for measuring and analysing the thrust force. A support plate was used to avoid any damage to the dynamometer. Surface roughness is generally measured as the average roughness ( R a ), which is commonly used in the mentioned industries [25]. Therefore, in this study, Ra was measured using the surface roughness tester and the burrs were inspected using a digital microscope. The details of the equipment are given in Figure 1. Moreover, the analysis of variance (ANOVA) technique was performed to find the percentage contribution of spindle speed, feed and coatings on the thrust force and   R a . ANOVA is a decision-making tool used for determining the impact of input parameters from experimental results [26]. Finally, an artificial neural network (ANN) technique was used for modelling and predicting the   R a using the MATLAB® 2017b environment.

3. Results and Discussion

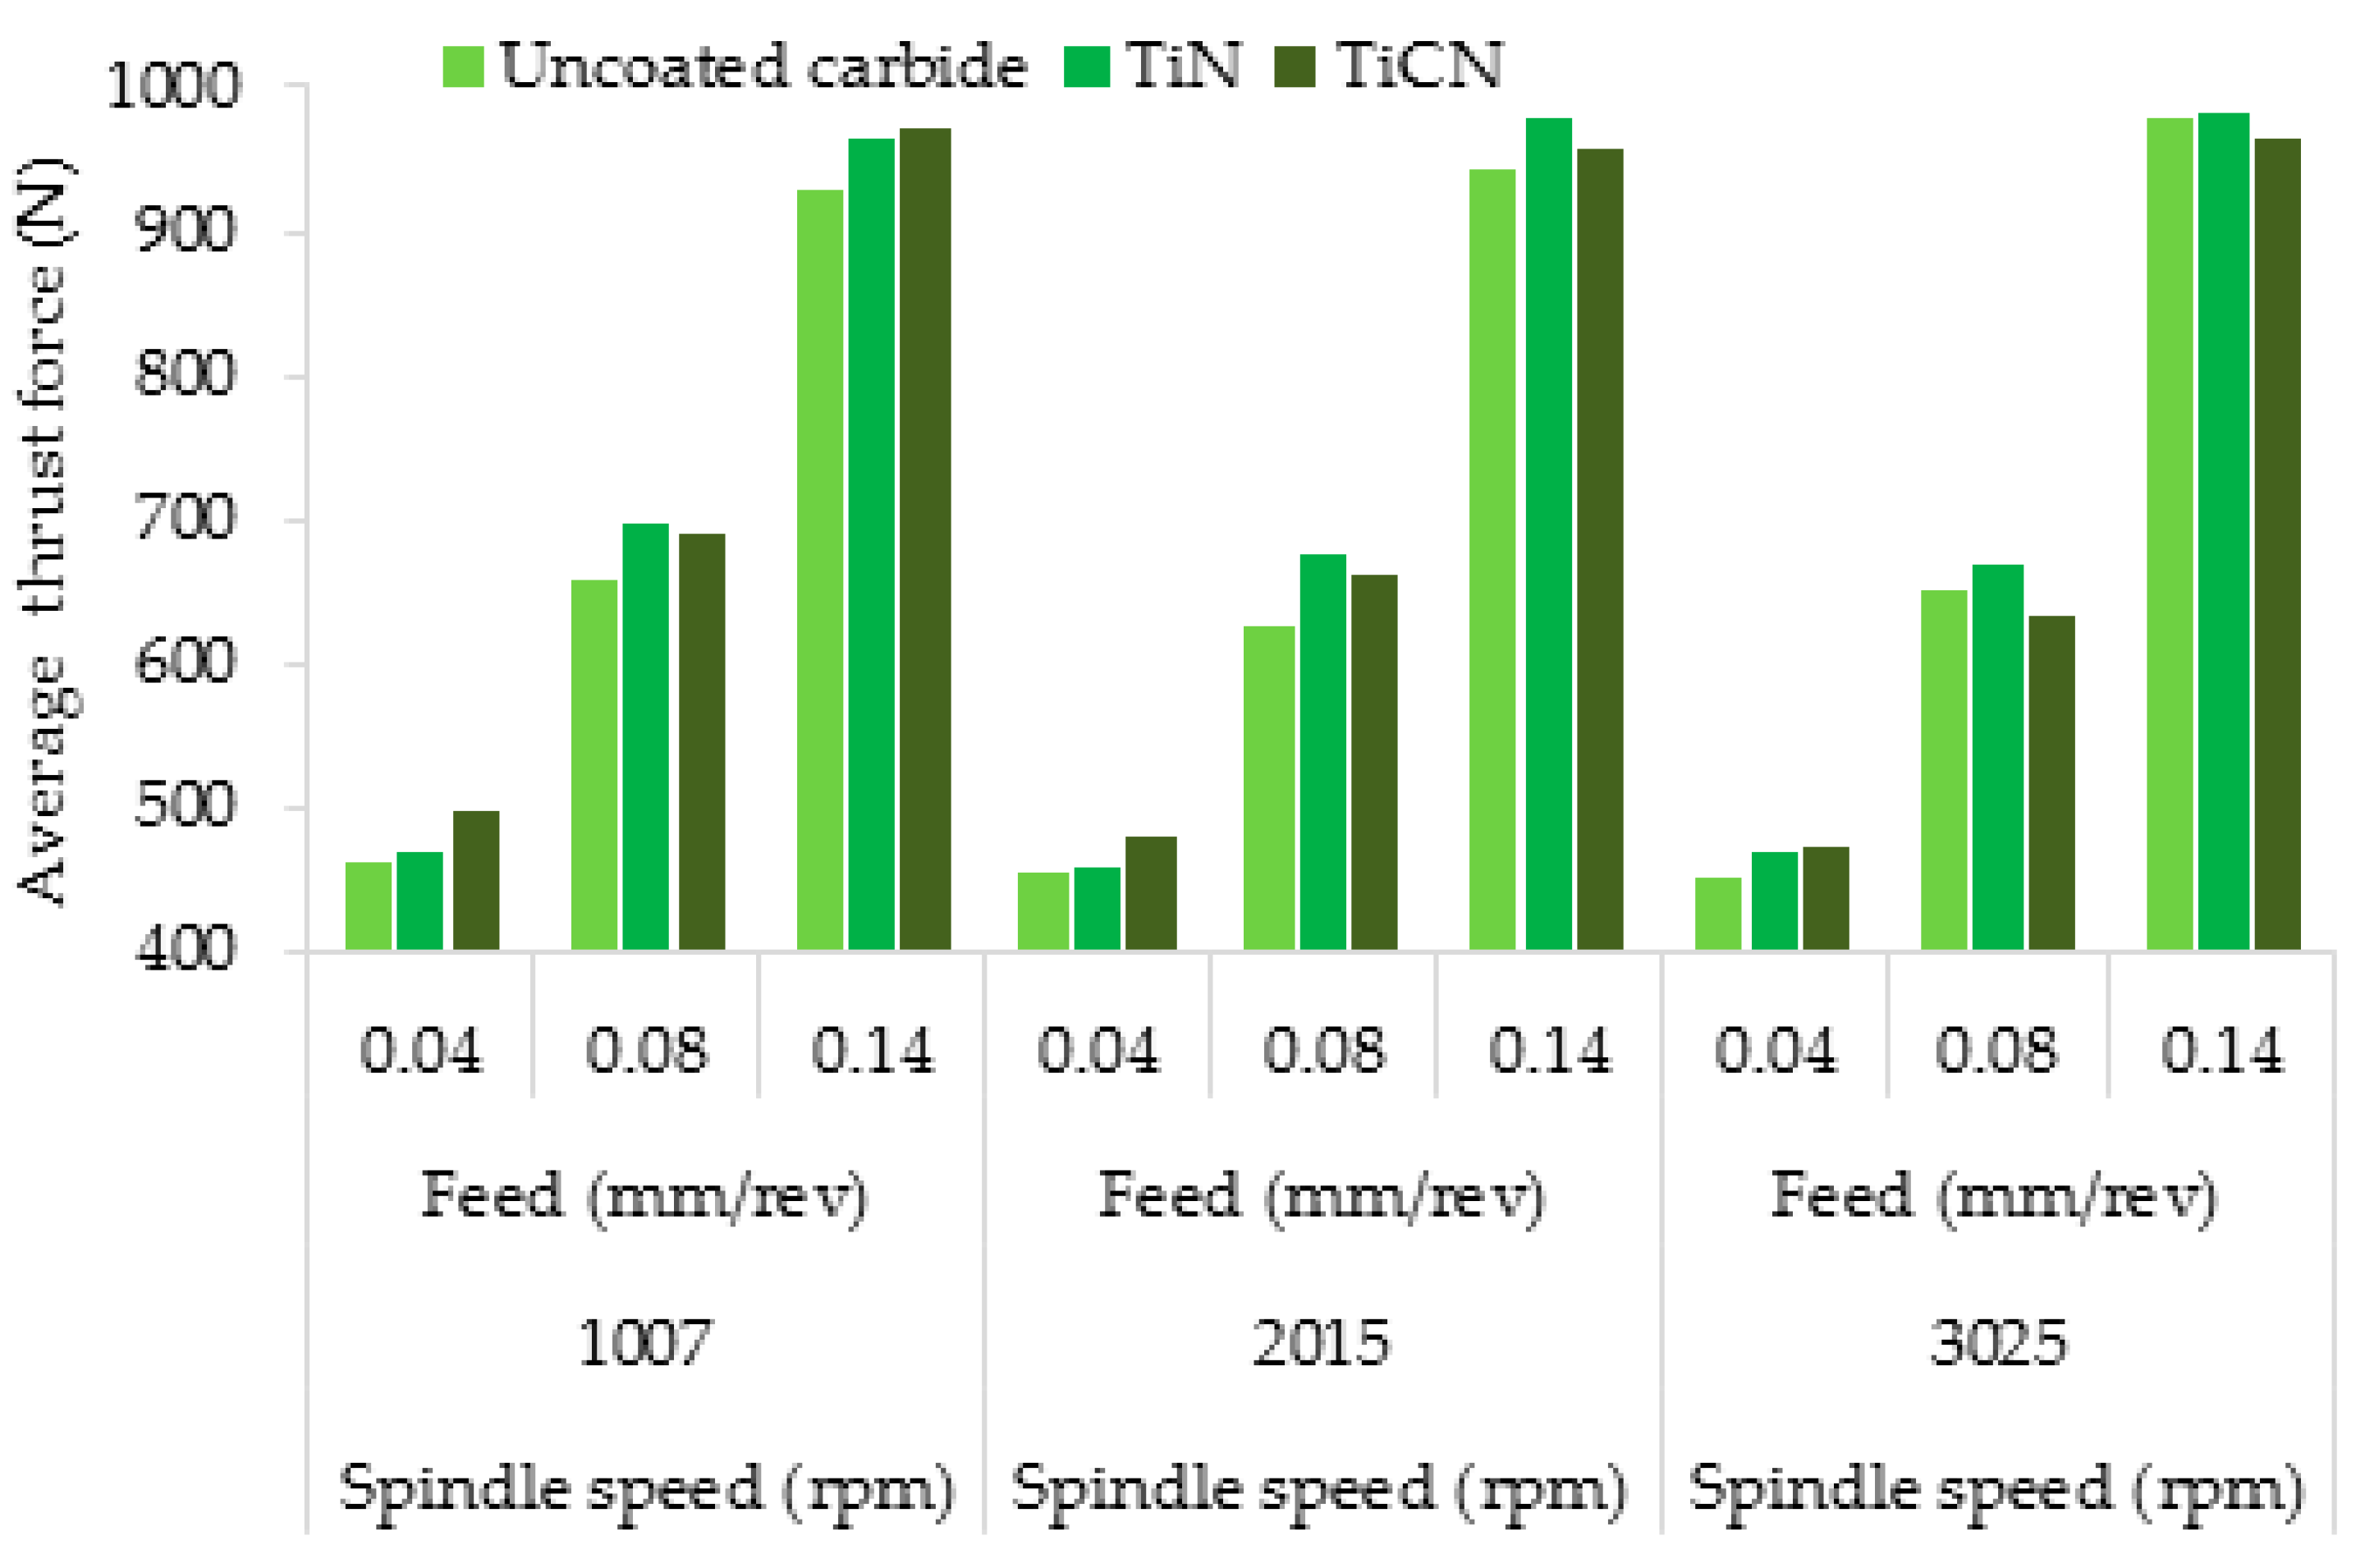
3.1. Analysis of Thrust Force

The thrust force used in drilling processes is one of the main components of force generation affected by the drilling parameters, workpiece mechanical properties, number of drill holes, tool wear, drilling operation and machine tool structure [27]. Previously, the thrust force generated during the one-shot single drilling process has been widely studied [3,28,29,30,31,32,33,34,35,36]. Therefore, this study represents the thrust force generated during multi-hole simultaneous drilling operations. Figure 2 shows the thrust force obtained from the uncoated carbide and TiN and TiCN coated carbide drills. It shows that thrust force was found to increase with the increases in the feed where reasons might be attributed to the increase in uncut chip thickness [37,38,39] and the rapid rubbing action of the tool and workpiece at high feed, which might have increased the heat energy being absorbed by the tool, which caused the tool wear [40]. Figure 2 also shows a decrease in thrust force with an increase in the spindle speed. According to Karabulut [41], the increase in temperature at high spindle speed affects the strength of the workpiece and causes the plastic deformation of the workpiece, which leads to a reduction in thrust force. Further, at the highest spindle speed selected in this study, a slight increase in the thrust force was observed at the high feed, which might be due to the increase in the number of holes, which promotes tool wear due to high friction at the interface of the tool–workpiece and subsequent high-force generation [42]. However, in general, the impact of spindle speed was not significant on the thrust force.
It was also observed that the uncoated carbide drills produce a lower thrust force than the TiN and TiCN coated drills, regardless of the drilling parameters. However, the reduction in the thrust force using uncoated drills was minimal and did not exceed 5% compared to that generated from using the coated tools. The lower thrust force from uncoated drills was mostly noted at the low spindle speeds. At a spindle speed of 3025 rpm and increasing feed, there are negligible differences between the thrust force generated by uncoated and TiN coated drills and somewhat lower thrust force values from TiCN coated drills. This could imply that TiCN coated tools might show a better performance than the other two tools when machining at higher spindle speeds [6]. The highest impact on the thrust force was due to feed following the drill type while no significant impact was found from the spindle speed, or the linear interactions between the studied parameters as shown in ANOVA results given in Table 2.

3.2. Evaluation of the Hole Quality

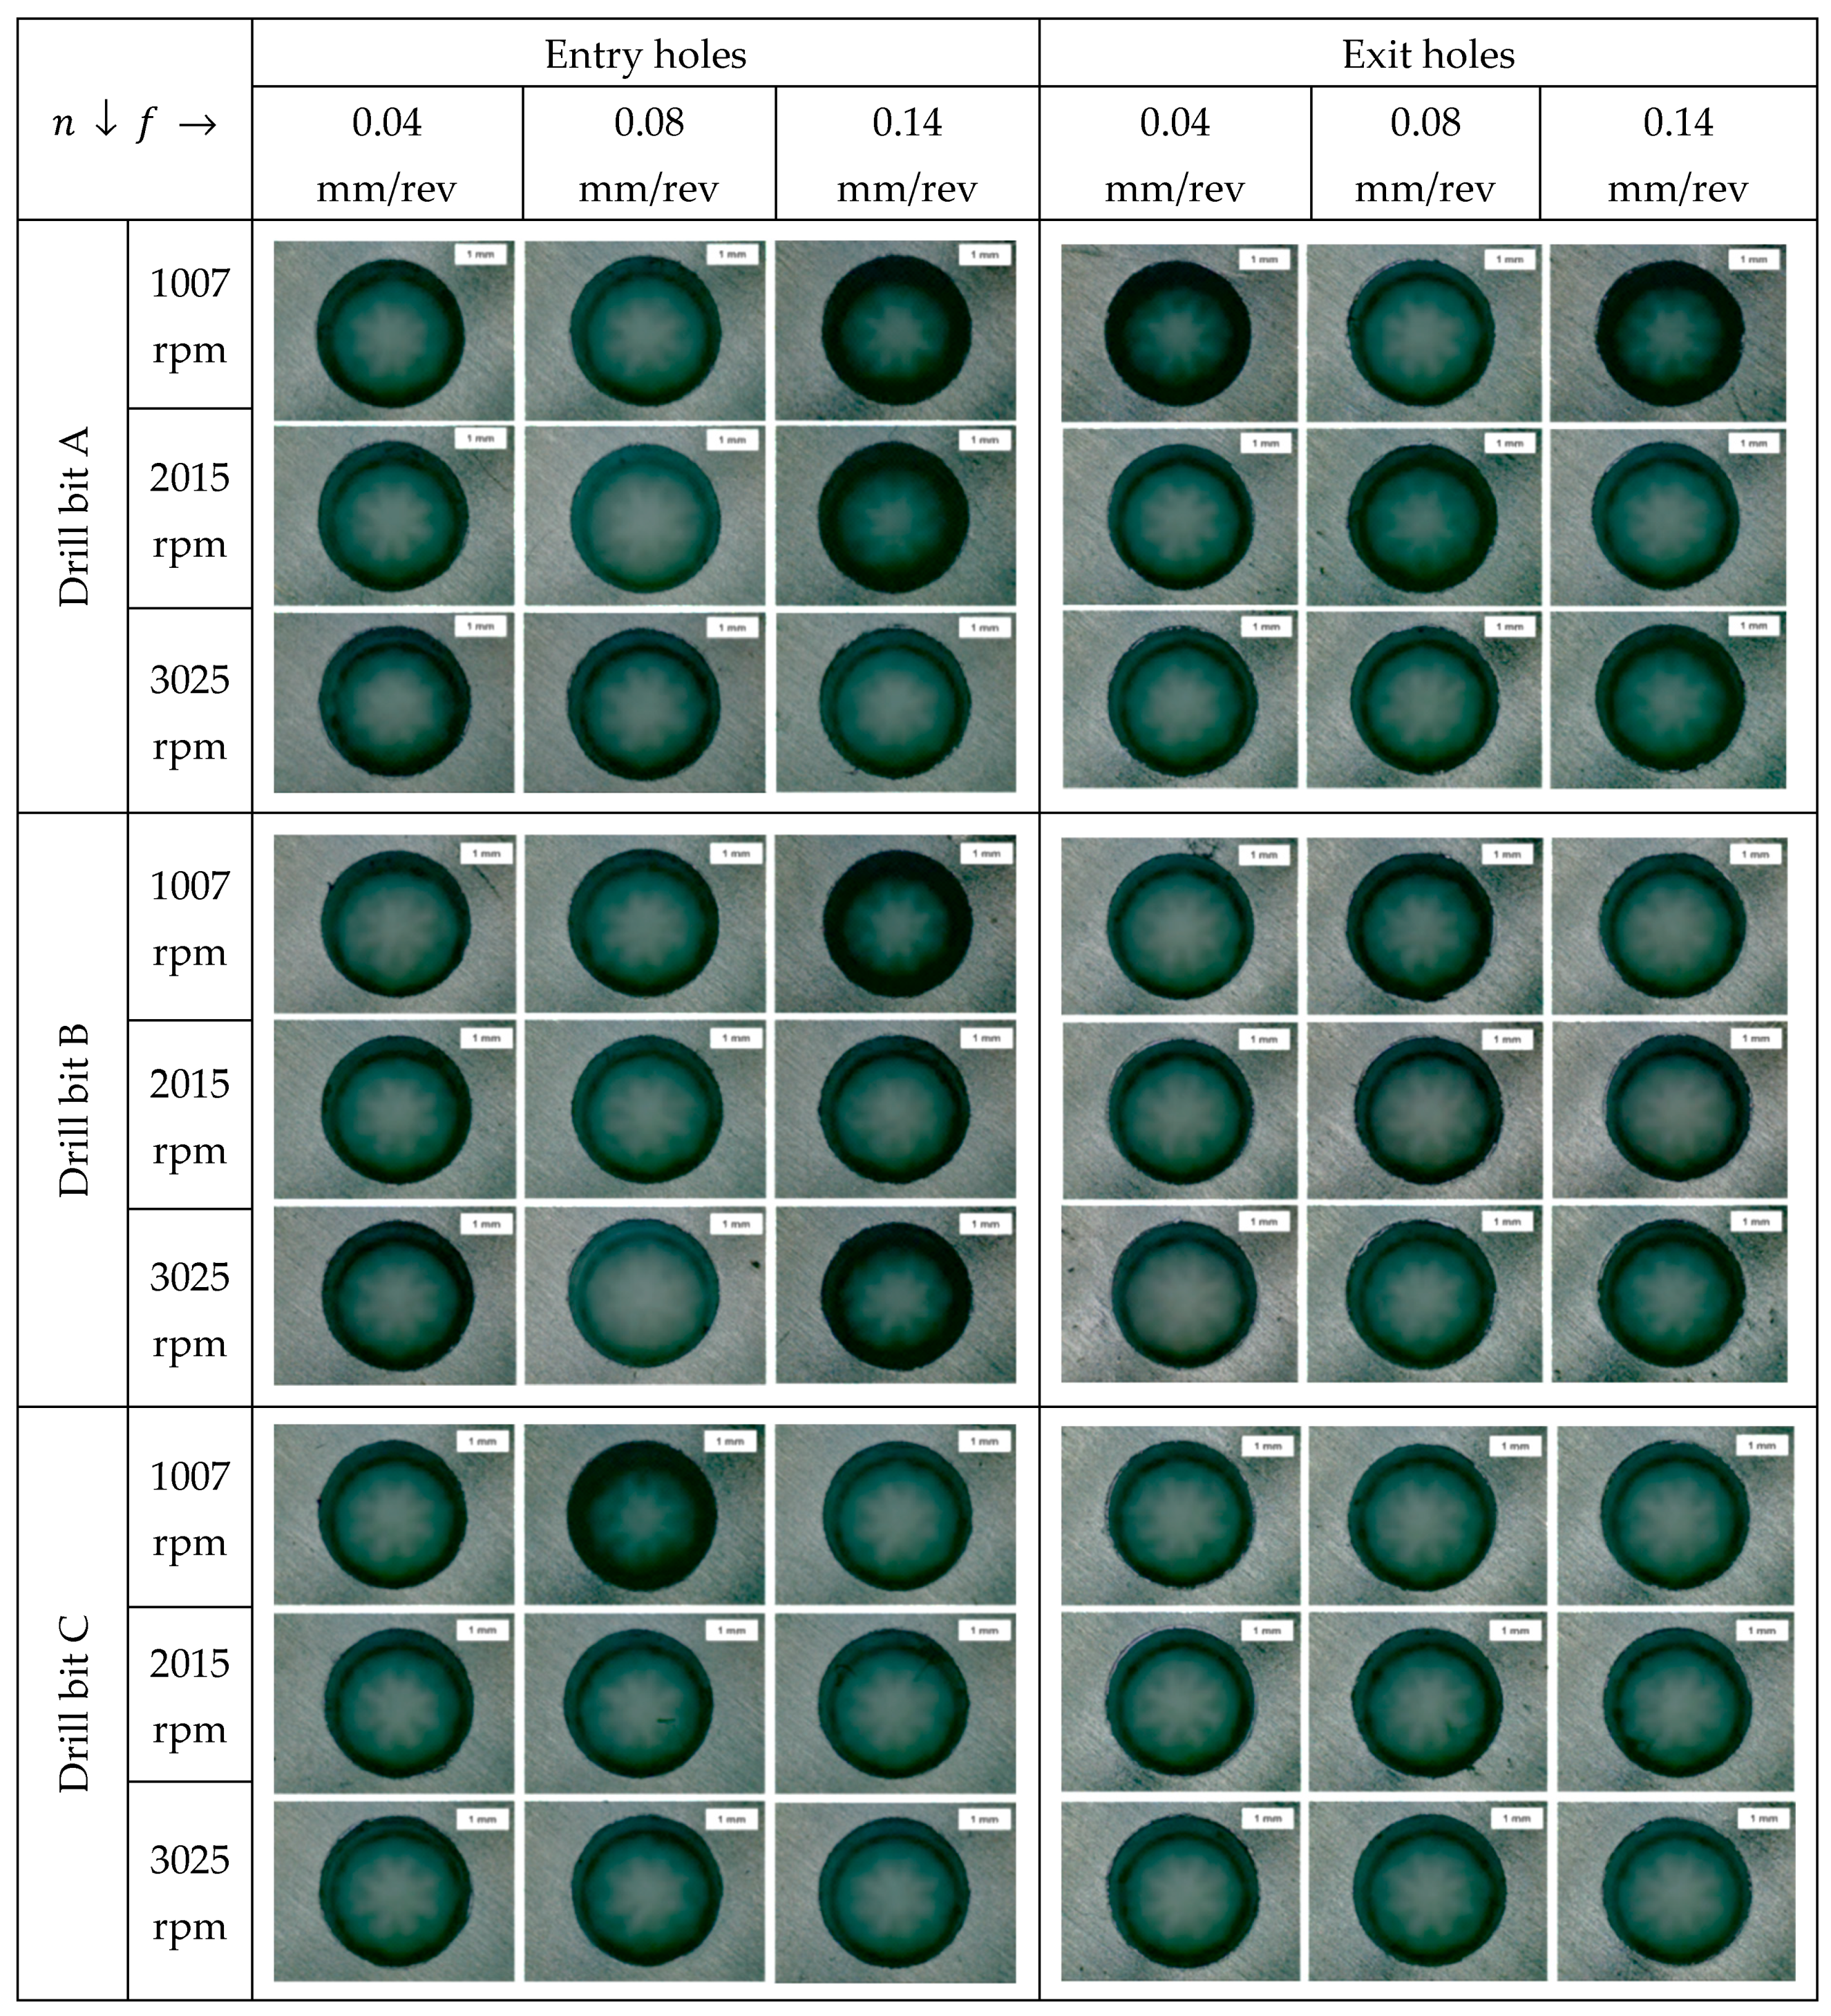
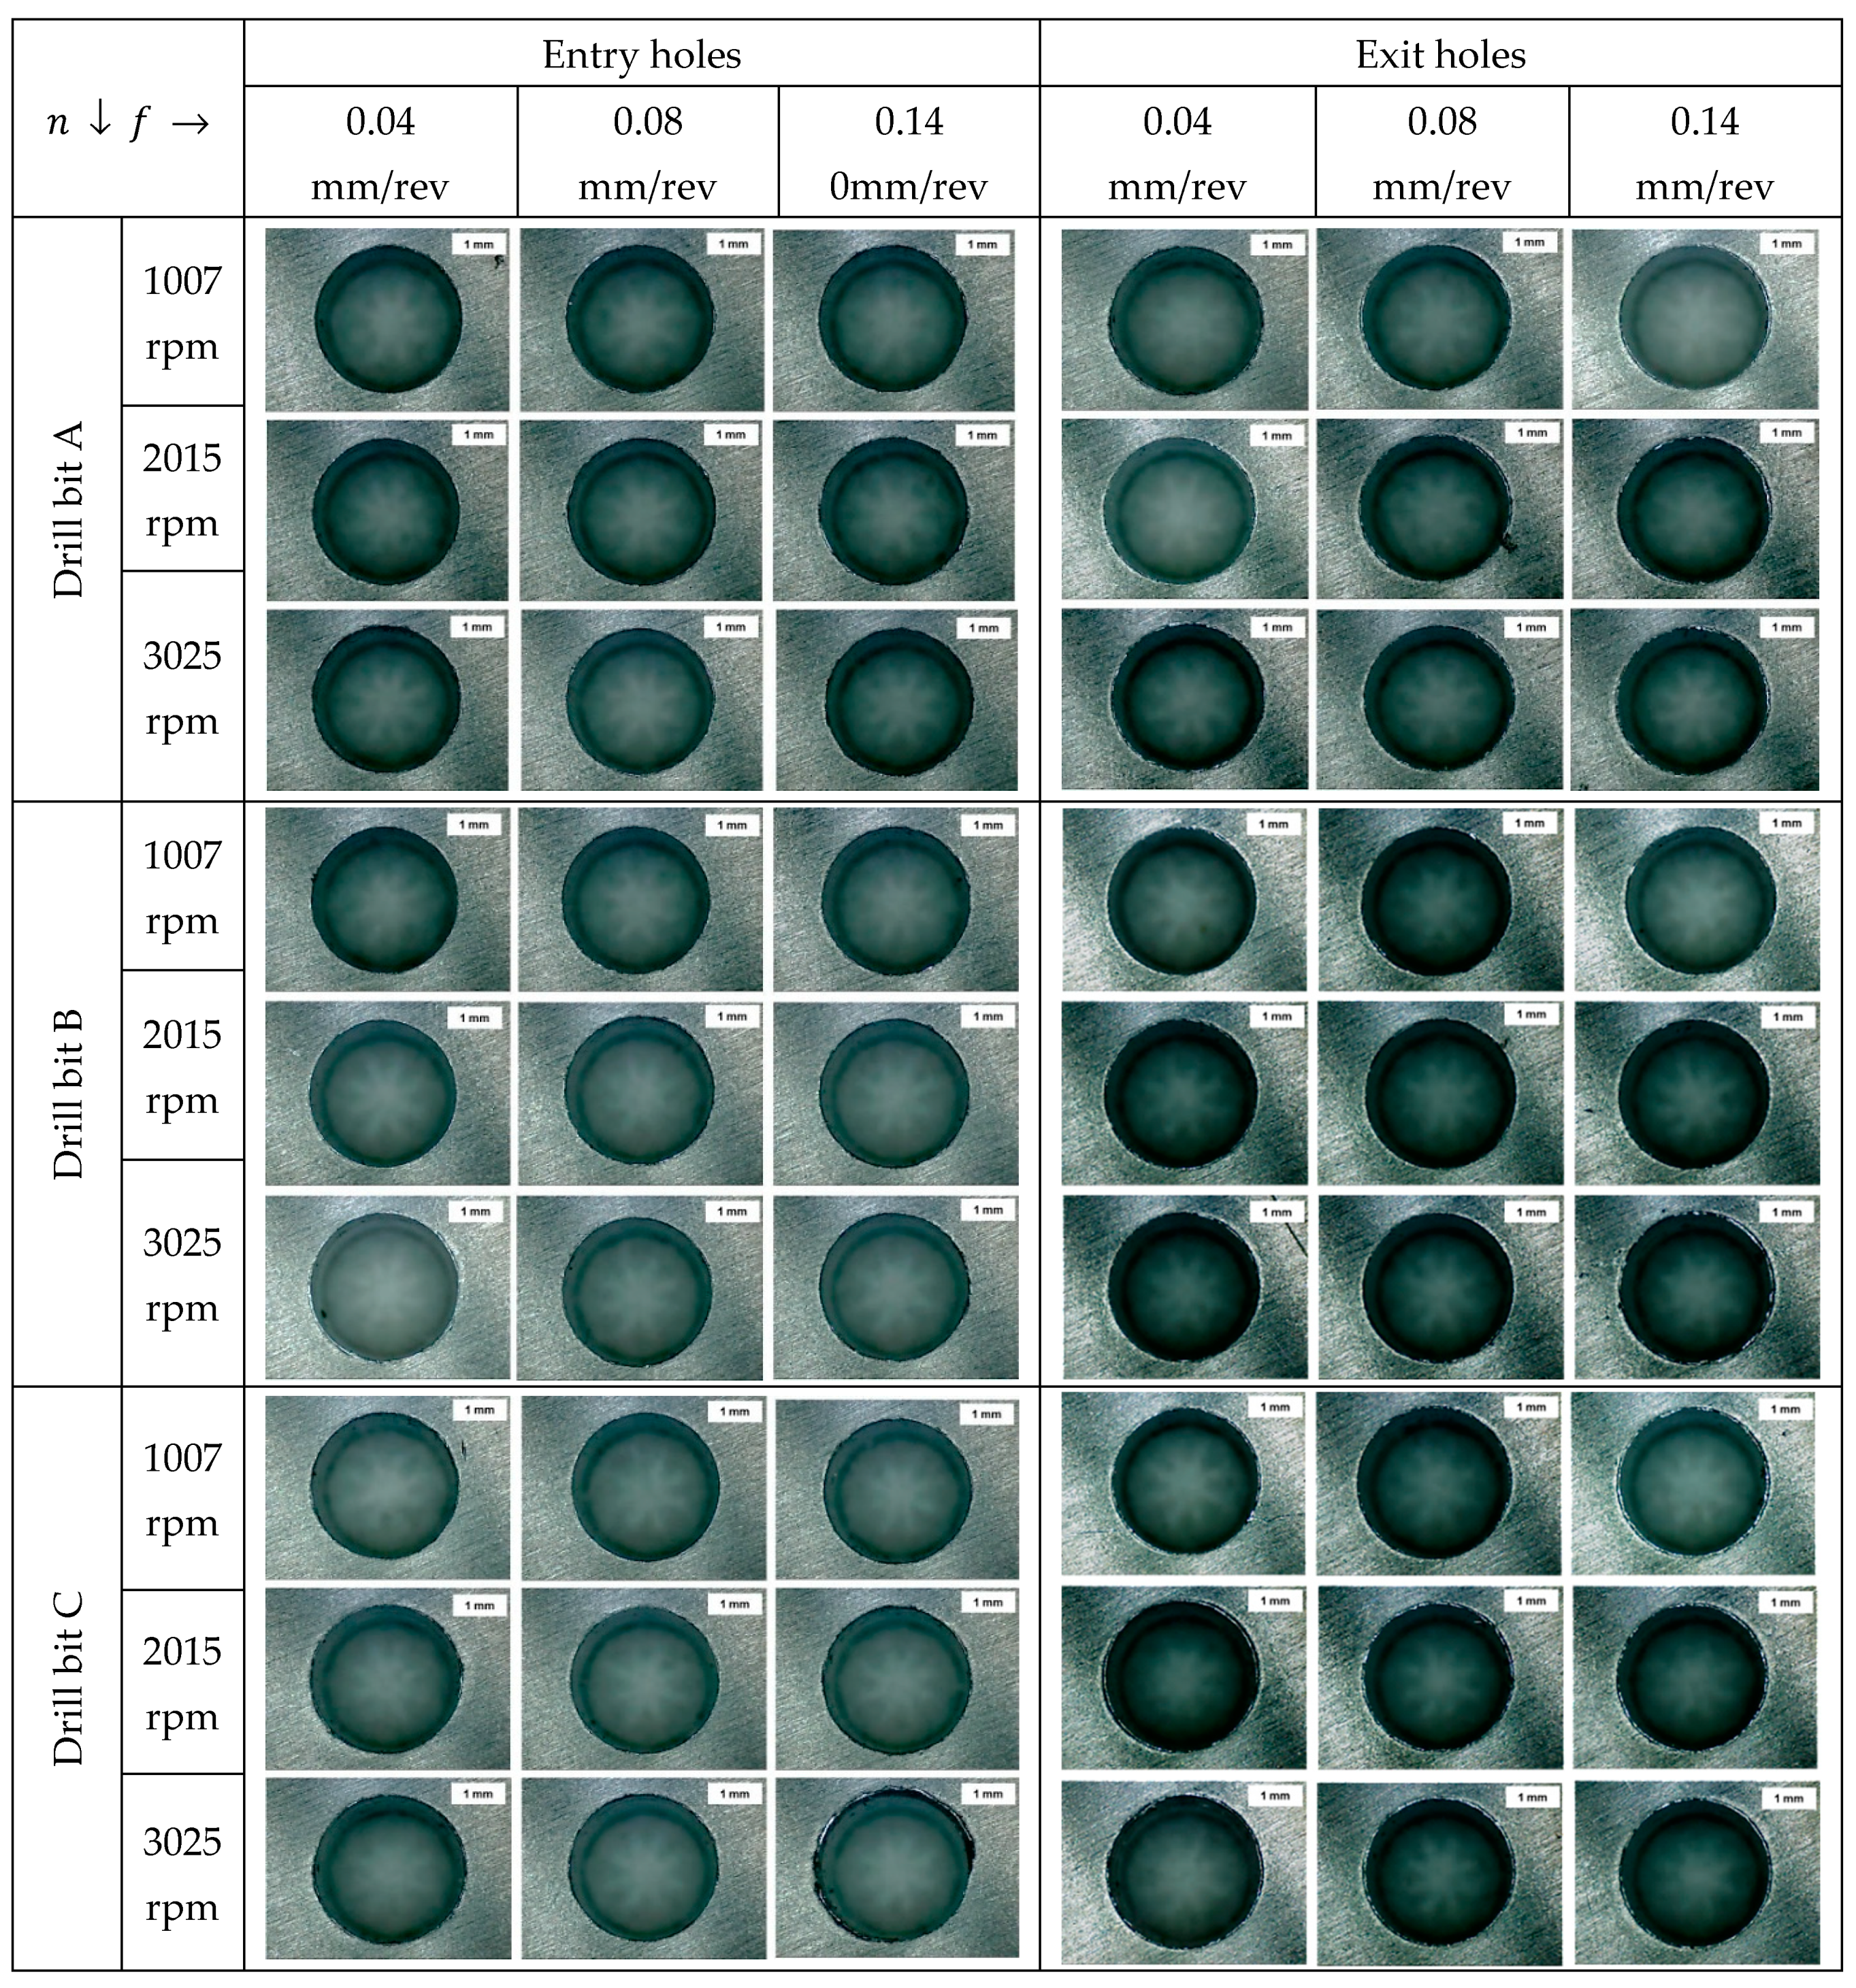
3.2.1. Analyses of Drilled-Hole Images

In this study, the quality of holes in terms of burrs was examined using a digital optical microscope with a scale of 1 mm. These burrs on the entrance and exit side of holes under selected drilling parameters using uncoated and coated drills, i.e., TiN and TiCN, are shown in Figure 3, Figure 4 and Figure 5.
The visual and microscopic inspections of hole quality showed that more burrs were generated at the entrance of holes compared to the exit side, irrespective of the coatings of the drills. Furthermore, the burrs at both sides of the holes increased with the increase in spindle speed and feed. However, the feed was found to be the dominant factor in increasing the burrs while the increase in spindle speed did not produce any considerable burrs. This is likely expected due to the effect of the thrust force where the feed was found to be more influential compared to the spindle speed. Figure 3, Figure 4 and Figure 5 also show that the uncoated drill produces holes with less burr formation compared with the TiN and TiCN coated drills. However, in comparison to TiN, the burrs formed by the TiCN coated drill were found to be less.

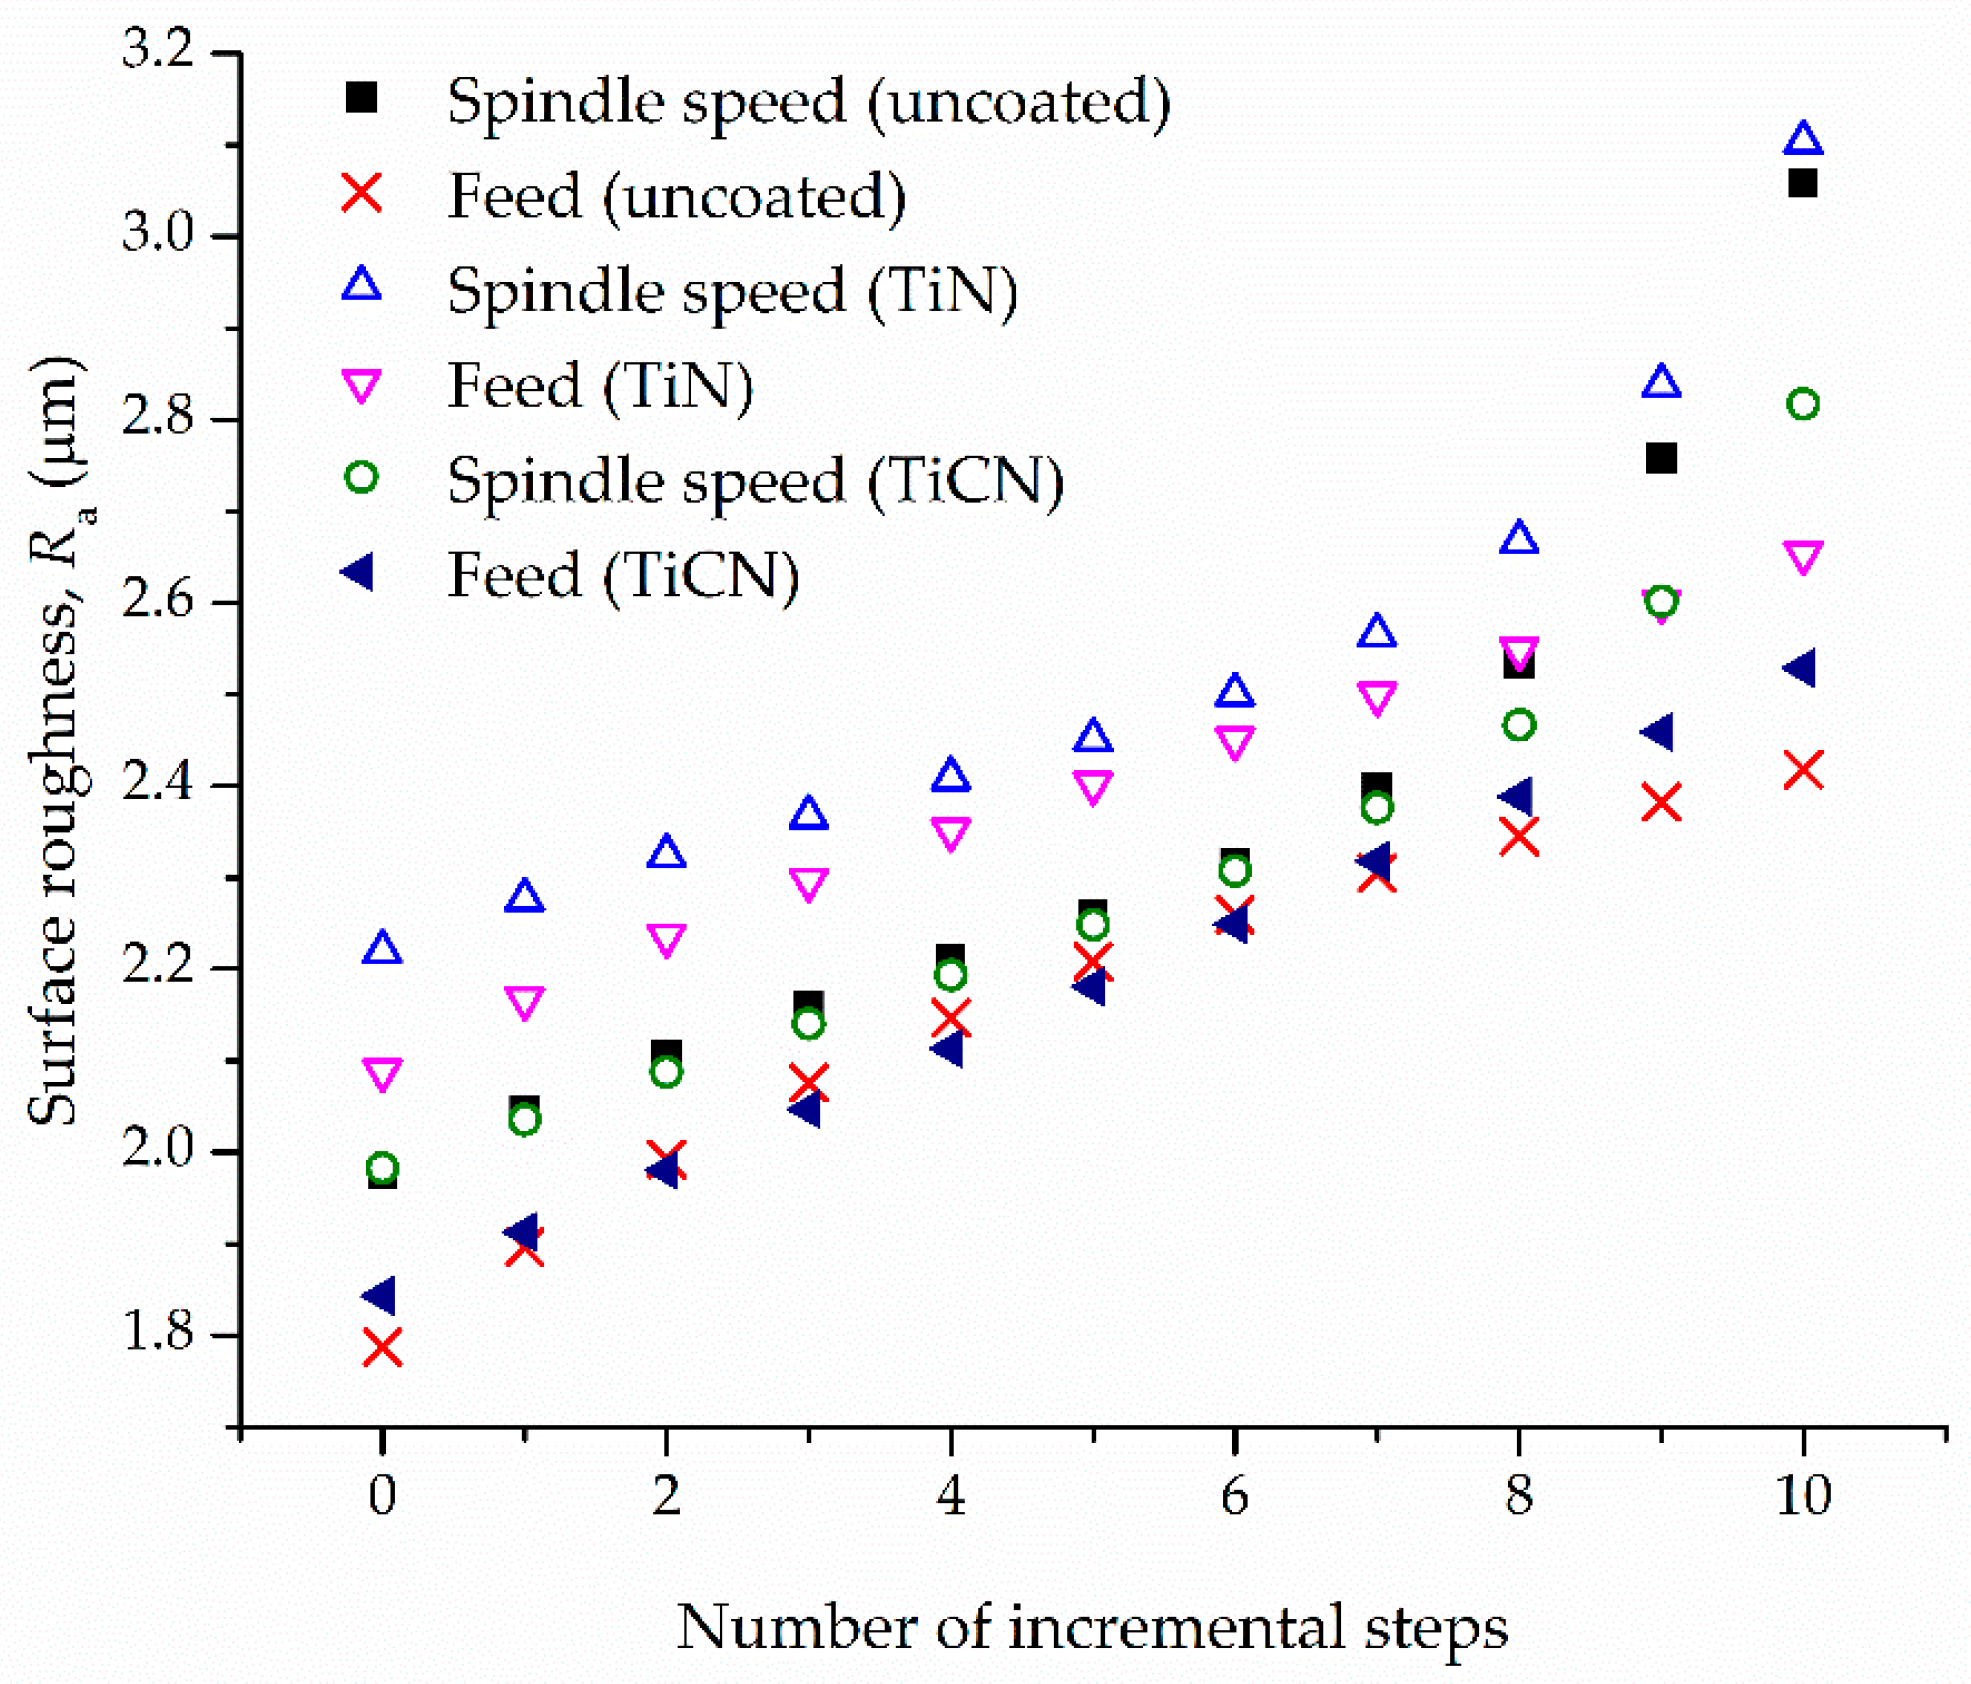
3.2.2. Surface Roughness

The surface roughness has a key role in the evaluation of machining performance of a workpiece [36]. Figure 6 indicates that   R a was affected by the drilling parameters, irrespective of the coatings of the drills. Increase in both spindle speed and feed resulted in increased   R a ; however, the spindle speed was found to be more effective in increasing the   R a compared to feed. This might be due to the increase in the ductility of the workpiece due to the rise in temperature at high spindle speed [43]. Additionally, the possibility of high vibration at high speeds would have caused the rough surface roughness [11]. Regarding the high feed, the increase in chip thickness could be the source of an increase in   R a [37].
Figure 6 also shows that the uncoated carbide tool gave lower values of   R a than the TiN and TiCN coated drills. This is likely attributed due to the built-up edge (BUE) because of the higher chemical affinity of aluminium for coatings due to the constant release of particles on the tool’s surface, which results in high thrust force and increased   R a [10]. However, the TiCN coated drill performed better at a high spindle speed of 3025 rpm. According to Nouari et al. [6], the reason for the lower   R a of holes drilled using coated tools at high spindle speed is because the coating provides a thermal barrier from high temperature therefore reducing the diffusion wear process at high cutting speed for dry drilling of Al2024. Additionally, the   R a obtained during multi-spindle drilling performance of TiN of Al2024 was higher than those measured from TiCN, regardless of the drilling parameters. The reason behind this is expected to be due to the low hardness values and low friction coefficient of TiN compared to TiCN [24]. The hardness of TiN is 23 GPa while that of TiCN is 27 GPa [24]. Previous studies have shown that TiCN coated tools provide better tool life than TiN coated tools due to their higher hardness [44]. Moreover, the addition of carbon adds more hardness and makes the TiCN coating more resistant to adhesions, making TiCN coated tools somewhat more effective in reducing   R a at higher speeds and feeds [45]. Additionally, the coefficient of friction of TiN and TiCN is 0.4 and 0.2, respectively [24], and coatings with a low friction coefficient resulted in low cutting loads and less tool wear; hence, small values of   R a can be expected. This is because the low friction coatings can reduce the tendency to stick and pick up material from the surface used in cutting and forming tools [46]. Table 3 shows the percentage contribution from ANOVA, which indicates that the spindle speed was the most influential drilling parameter on the   R a , following by the feed and the drill type, which includes the uncoated and coated drills. The linear interaction of the input parameters had a negligible contribution on   R a of less than 1.5%.
Therefore, from the ANOVA results, it can be concluded that the use of coated drills does not provide any significant contribution to reducing thrust force or   R a when drilling Al2024 alloy. However, this might be only true for the range of studied feeds and speeds. A broader study that looks into the performance of the studied coatings at higher speeds and feeds is recommended.

4. Artificial Neural Network

ANNs originally developed by McCulloch and Pitts [47] are based on the behaviour and structure of the human brain. The basic computational units of ANN are known as neurons (nodes), which are connected through weights, and are responsible for computing the results within the defined range. To achieve the desired results, the data need to be divided into two groups, i.e., training and testing datasets. Training data usually consist of 70% or 80% of the dataset, which act as patterns and the ANN establishes a non-linear connection between them. A second dataset, known as the testing data, adopts the recognized patterns to evaluate the generalization potential of the system. It is worth noting that the developed network is unfamiliar with the testing data [48]. Therefore, ANNs attempt to learn the hidden pattern from the training dataset and then applies it to the testing dataset, to examine the generalisation ability of the system. A multilayer perceptron (MLP) neural network was employed to establish the relationship between the input and output parameters using a single hidden layer. MLP is the most commonly used network, among the diverse types of ANNs used by various researchers [49,50]. The MLP consists of three layers, namely input, hidden and output layers. Hornik [51] comprehensively proved that, for a regression problem, a single hidden layer is adequate to map a relationship between input and response variables. Additionally, a single hidden layer is adequate to map a relationship between input and response variables as it provides satisfactory results in the approximation of nonlinear problems [52]. Further, the increase in the number of nodes causes the model to become complicated with many different parameters [53]. The proposed scheme for the prediction of   R a using ANN is given in Figure 7.
It is noteworthy that data normalisation is important before feeding it to any machine learning model so that each variable receives the same attention [49]. Therefore, for this study, all parameters were normalised between −1 to 1 using the following relationship.
X n = 2 X X m i n X m a x X m i n 1
where X m a x and X m i n represent the maximum and minimum values of the parameters, respectively.
The tangent-sigmoid activation function is applied between the input and hidden layers given mathematically as [48]:
tanh ( x ) = 2 1 + e 2 x 1
The hit and trial method was utilised to find the optimal number of neurons in the hidden layer. The model with the four hidden neurons is selected as the optimum model with the architecture of 3-4-1 as shown in Figure 8.
The overall output from the MLP can be stated as follows [54]:
y = F H O ( θ O + j = 1 h V j F I H ( θ h j + i = 1 m w i j x i ) )
where F H O is the activation function between the hidden and output layer,   θ O is the bias of the output layer neuron,   V j is the connecting weight of neuron j of the hidden layer and a single output node, F I H is the activation function between the input and the hidden layer,   θ h j is the bias value for neuron j of the hidden layer (j = 1, h), w i j is the connecting weight of input i and neuron j of the hidden layer, and x i is the ith input parameter. The input parameters are spindle speed, feed, and drill type, and the output parameter is the   R a The drill type was coded as 0, 1, and 2 depending on the type of coatings. The uncoated carbide drill is coded as 0, TiN-coated drill as 1, and TiCN as 2. The statistical properties of the complete experimental data are tabulated in Table 4.

4.1. ANN-Based Formula

To facilitate the researchers/practitioners, the developed model was also translated into a trackable mathematical formulation. Based on the developed ANN, the procedure for calculating the   R a is given as follows:
  • Step 1: Normalise the input parameters according to Equation (1). The minimum and maximum ranges of all the parameters are given in Table 4.
  • Step 2: Calculate the normalised   R a as follows:
n n e t = w i j x n + θ h j
n o u t = 2 1 + e 2 n n e t 1
R a ( n ) = V j n o u t + θ o
where n n e t is the net input to the hidden layer neurons, n o u t   is the output of each hidden layer neuron, and   x n   is the normalized values of the input parameters.
The values of w i j , θ h j , V j and θ o are given as follows:
w i j = { 2.2306 0.3088 0.3095 0.3609 0.4736 0.6529 3.0656 2.2762 10.5984 0.5709 0.6985 0.3968 }
θ h j = { 2.5736 1.0580 5.5033 1.4934 }
V j = { 0.5424 0.5781 0.2267 0.7662 }
θ o = { 0.0734 }
  • Step 3: Calculate the   R a as follows:
    R a = 0.5 ( R a ( n ) + 1 ) ( R a ( m a x ) R a ( m i n ) ) + R a ( m i n )
For more comprehension, a design example is presented in the Appendix A section.

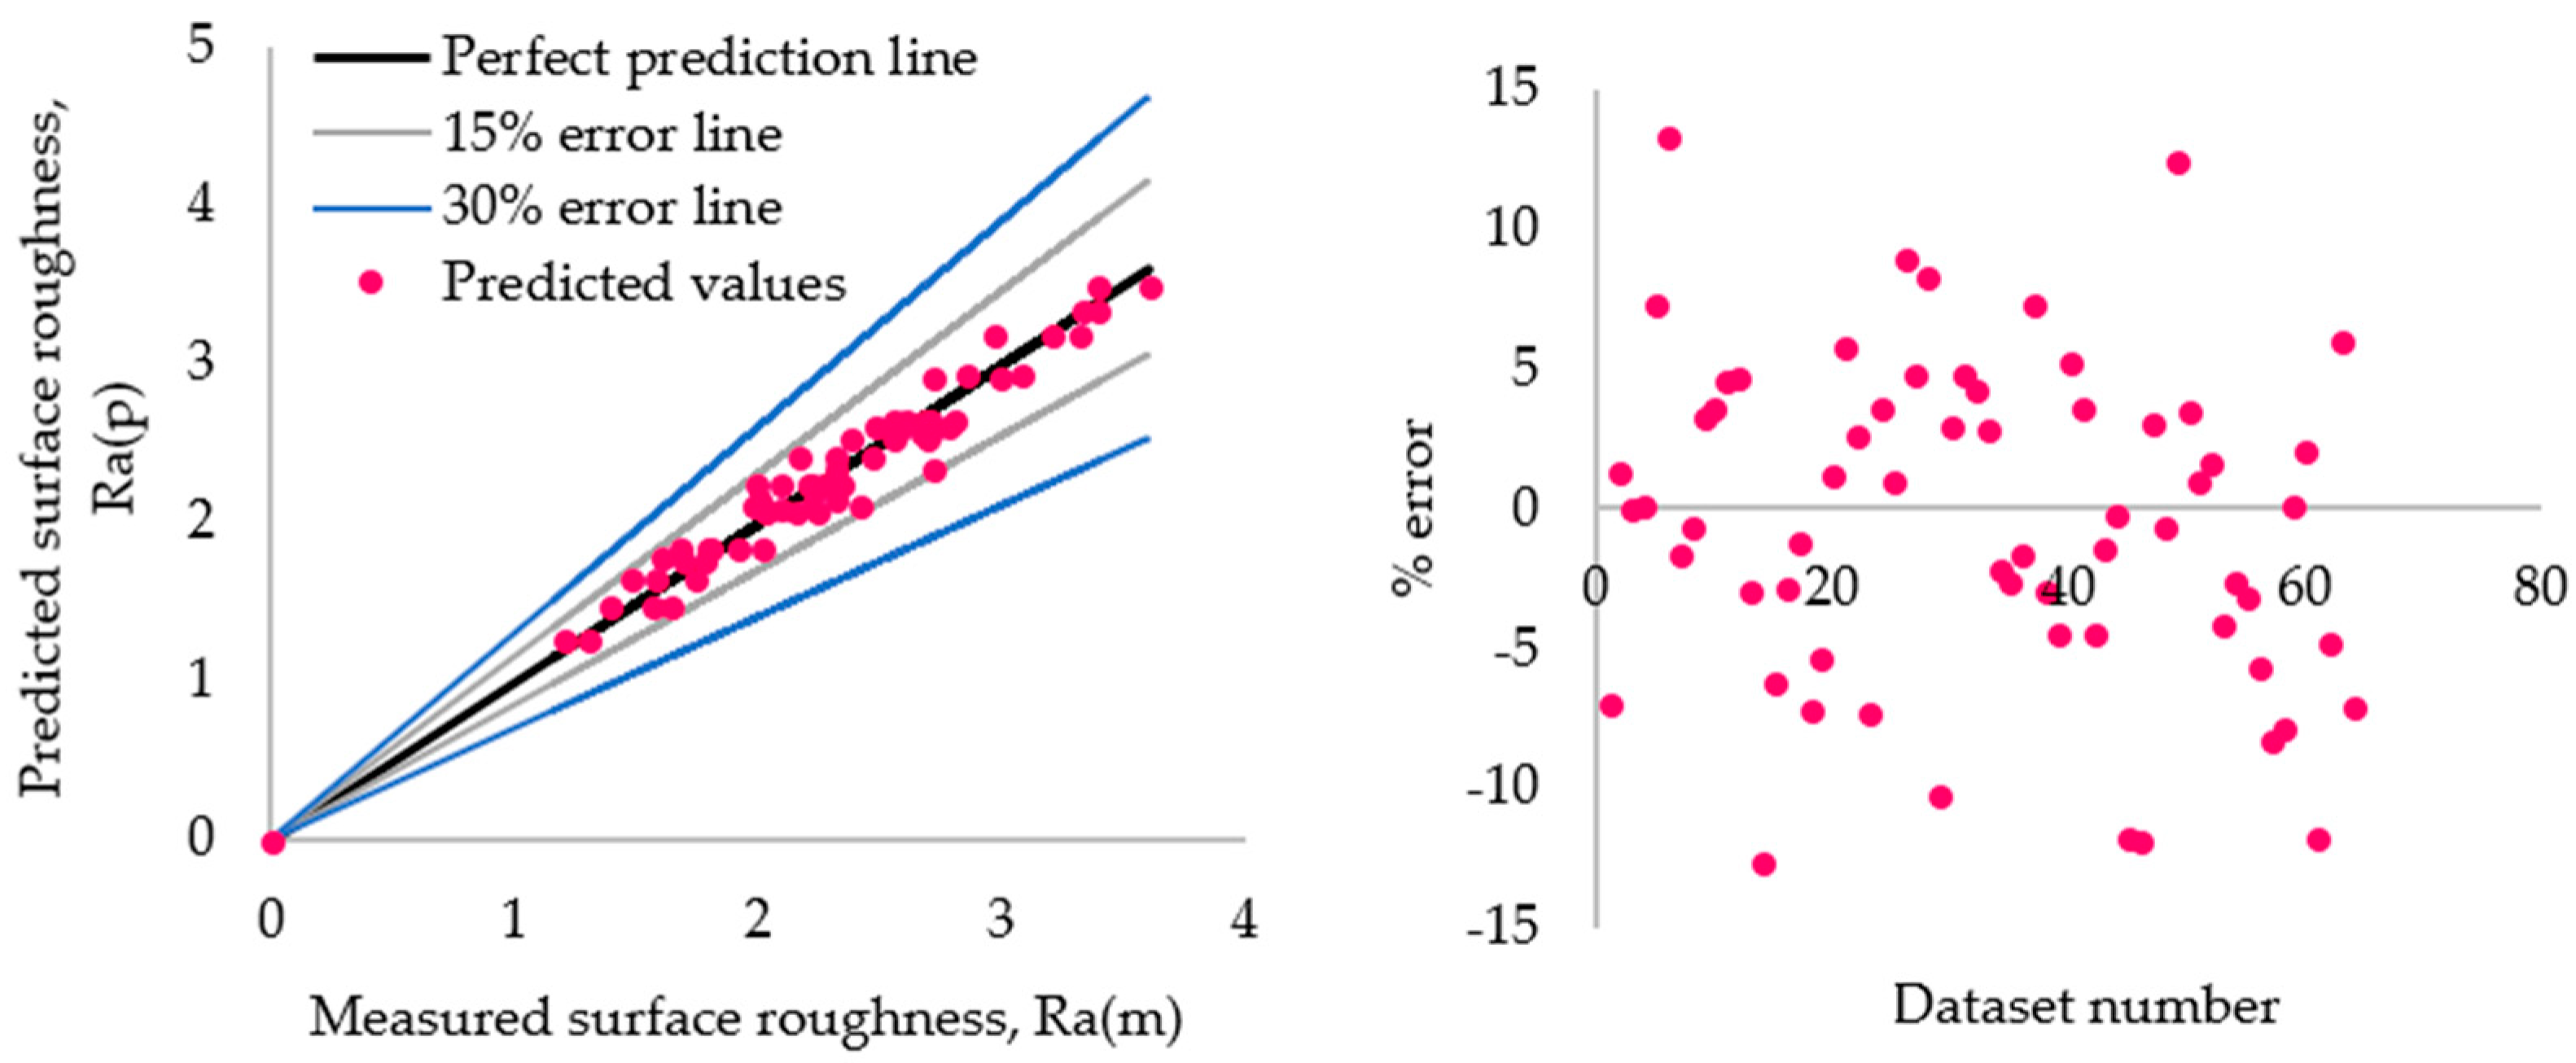
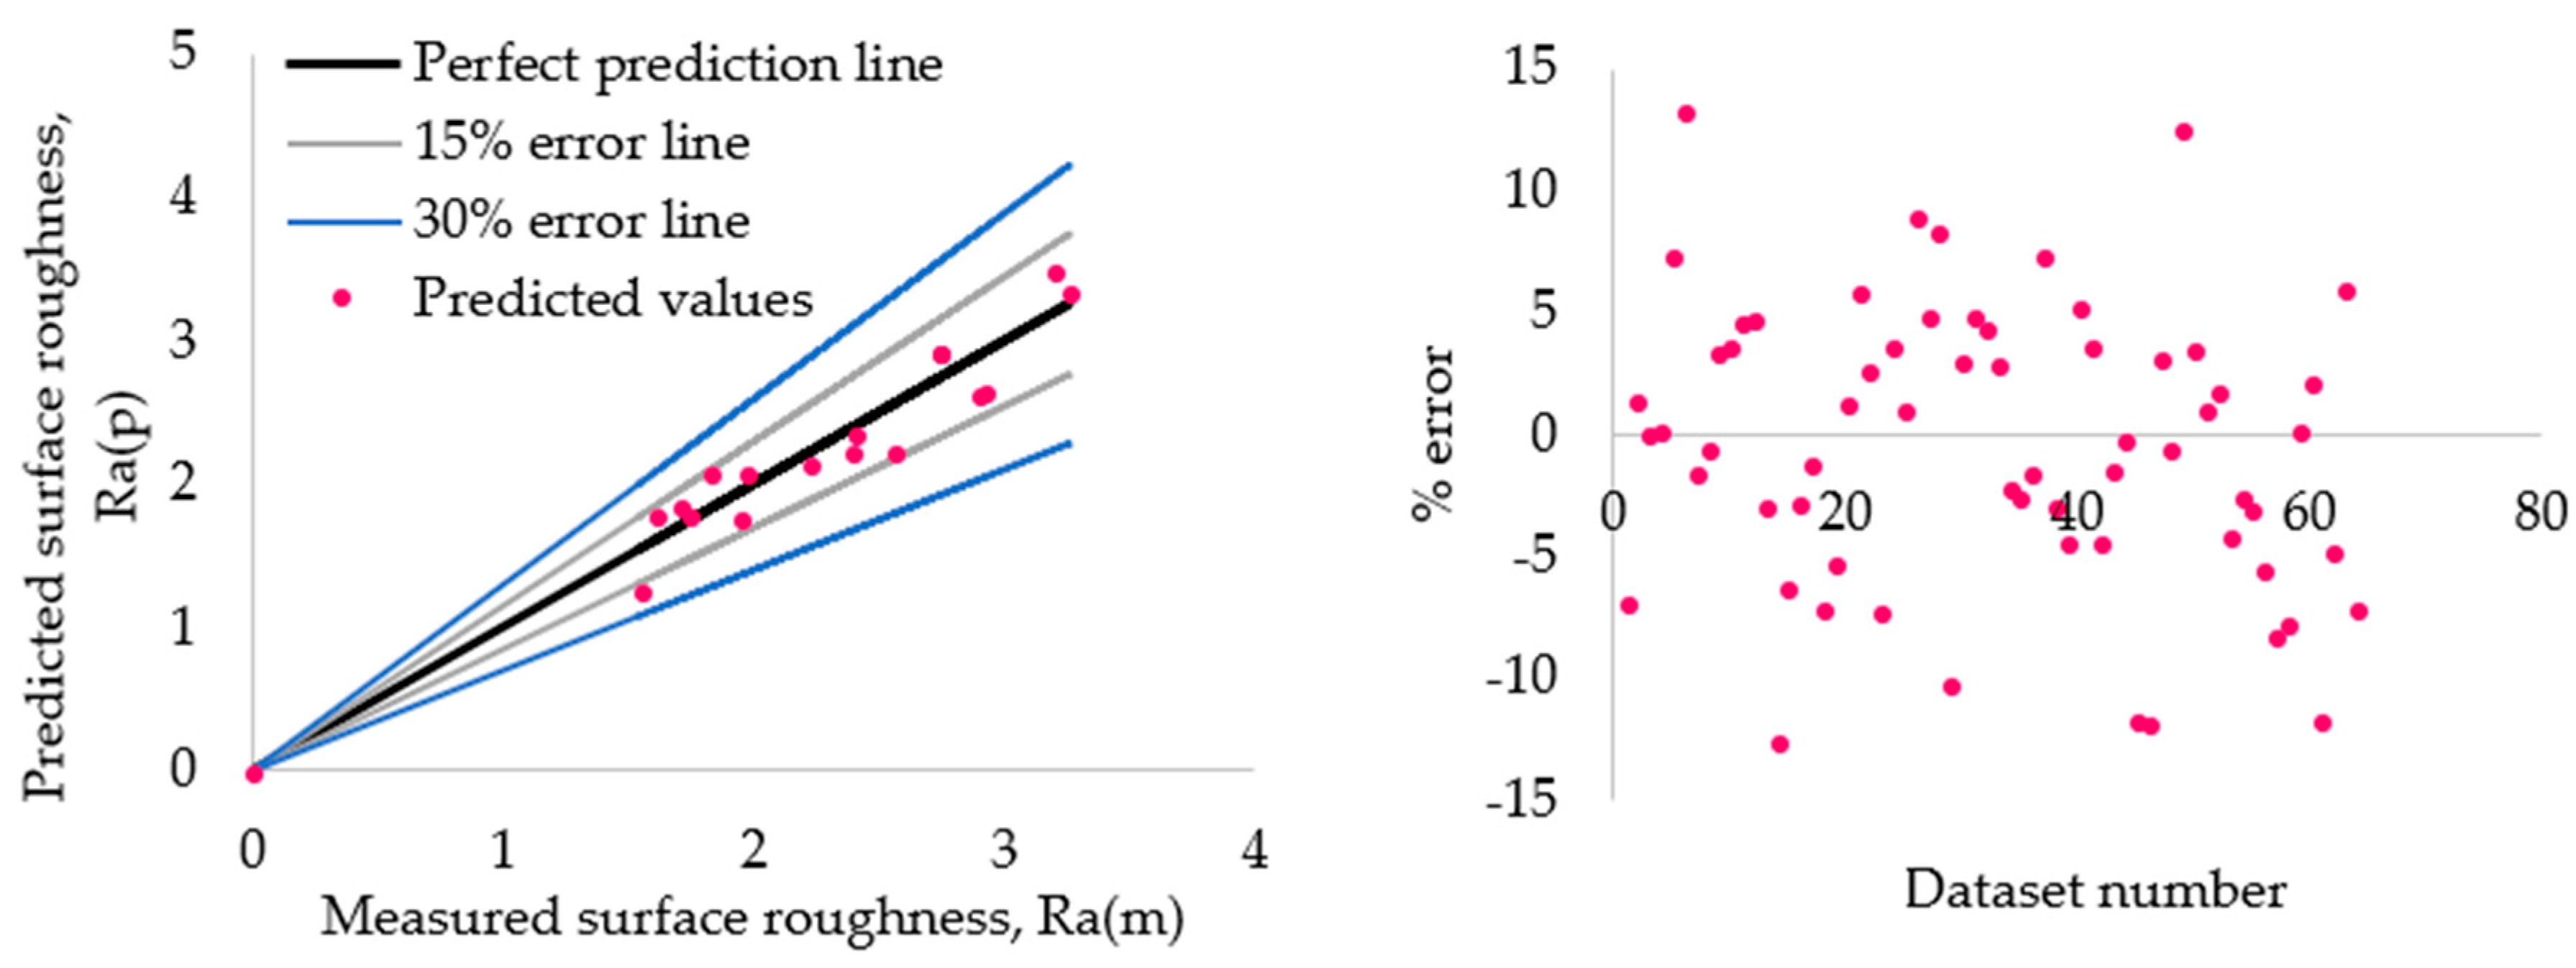
4.2. Model Performance Evaluation

In this study, the widely used and well-established ratio of 80:20 was used to divide the data into training and testing subsets, respectively. As discussed earlier, the training data are used to construct the model network and the testing data are used for validating the performance of the network [49]. The network uses the training data to learn and map the hidden relationships. Thereafter, it was applied to the testing dataset and the predicted outputs were compared with the measured results (targets) to estimate the predictive strength of the model. For this study, three statistical indices were utilised to assess the accuracy of the developed model: (1) root mean square error (RMSE); (2) mean absolute per cent deviation (MAPD); and (3) coefficient of determination (R2). All these indices are predominantly used for evaluating the accuracy of any data-driven modelling technique [49].
R M S E = 1 n i = 1 n [ ( R a i ( m ) R a i ( p ) ) ] 2
M A P D ( % ) = 1 n i = 1 n | R a i ( m ) R a i ( p ) R a i ( m ) | × 100
R 2 = 1 i = 1 n ( R a i ( p ) R a i ( m ) ) 2 i = 1 n ( R a i ( m ) R ¯ a ( m ) ) 2
where n denotes the number of data samples;   R a i ( m ) is the ith measured surface roughness; R a i ( p ) is the ith predicted surface roughness; and R ¯ a ( m ) is the mean value of measured surface roughness. The values of the statistical indices for the training and testing datasets are summarised in Table 5.
For the training dataset, the values of RMSE, MAPD and R2 were 0.127, 4.69 and 0.95, whereas for the testing dataset the values were 0.204, 8.12, and 0.88, respectively, which depicted the satisfactory performance of the developed model.
The scatter and error plots for the training and testing datasets are shown in Figure 9 and Figure 10. The perfect prediction between the data plotted on the abscissa (measured response) and the ordinate (predicted response) is depicted by the perfect prediction line (x = y) in the scatter plot. Additionally, the error plots for the training and testing datasets were created by computing the difference between the measured and simulated response for each data point. From Figure 9 and Figure 10, it can be seen that the developed ANN model produced the outputs close to the observed measurement with approximate ± 10 15 % error.

4.3. Model Robustness

An ANN model may achieve good prediction, which could be evaluated according to the fit obtained between the original outputs of the model and the simulated responses. However, the model may only be considered robust if it predicts the response in a realistic manner, that is, according to the underlying physical behaviour of the investigated system. Hence, the model also needs validation to confirm its robustness to assess the relationship [55]. In this regard, a sensitivity analysis was carried out to evaluate the response of the developed ANN model. The incremental sensitivity method was used to assess the significance of each input parameter in the prediction equation [56]. Sensitivity analysis is a simple and innovative technique that examines the connection weights of the trained network by interpreting the relative significance of the input variables [57]. In the incremental sensitivity analysis, all input variables except one are fixed to the mean values and the other variables are varied between the input range (minimum to maximum); finally, the predicted response is measured in each step [58]. For this study, this process was repeated for all drill types and the robustness was examined to see how well the predicted data are in agreement with the physical behaviour over a range of input data. Figure 11 shows that, in general, for all the drill types,     R a increases by increasing spindle speed and feed. However, the effect of spindle speed was found to be more than that of feed. This is in line with the previous experimental studies conducted by [16,17,18]. In addition, the graph of uncoated drill presented low values of   R a at low spindle speed while a significant increase was observed with the rise in spindle speed. The TiCN coated drills performed better at the high spindle speed whereas the TiN drill gave the highest values of   R a compared to those measured from uncoated and TiCN carbide coated drills. This concluded that the developed model agrees with the expected effect of spindle speed, feed, and coatings on the   R a . Therefore, the developed model can be useful for industries and manufacturing engineers for predicting the surface roughness of Al2024 in multi-hole simultaneous drilling processes.

5. Conclusions

This study includes the use of a multi-spindle drill head to perform a multi-hole simultaneous drilling process to increase productivity and save time. To assess the quality of holes, uncoated carbide and (TiN and TiCN) coated drills were used. It was concluded that low thrust force, low surface roughness and small burrs were observed with the use of the uncoated drills during multi-spindle drilling of Al2024, while the TiN-coated drill gave the highest thrust force and poor hole quality. However, at a high spindle speed, the TiCN performed better than the uncoated drills because of its high hardness value and low coefficient of friction. Therefore, the performance of the TiCN coating tool was good at high spindle speeds and feed rates since it provides similar or less thrust force and better surface finish than the other tools. This means combining TiCN coating with poly drilling can give both better hole quality and also reduce drilling time. Regarding the drilling parameters, the thrust force was highly influenced by the feed, while the effect of spindle speed on thrust force was insignificant. The surface roughness was affected more by the spindle speed than the feed. However, most of the burrs were observed at a high feed as compared to the increase in spindle speed. Furthermore, more burrs were observed at the holes’ exits. In addition, an ANN model, which can be part of a portfolio for the manufacturing engineering work on the drilling of Al2024, was developed for the prediction of surface roughness when using the multi-hole simultaneous drilling process. The ANN model is reliable for the prediction of surface roughness with the values of RMSE, MAPD and R2 of 0.127, 4.69 and 0.95 for the training dataset, and 0.204, 8.12, and 0.88 for the testing dataset, which showed the satisfactory performance of the developed model. This work can be further extended to examine the deviation of the hole from the nominal size and circularity error in the multi-spindle drilling process.

Author Contributions

Conceptualization, M.T.-R. and M.A.; methodology, K.G.; software, M.N.A.R. validation, M.A., M.T.-R., K.G. and M.N.A.R.; investigation, M.A.; writing—original draft preparation, M.A.; writing—review and editing, M.T.-R., K.G., A.V. and M.N.A.R.; supervision, M.T.-R., K.G. and A.V. All authors have read and agreed to the published version of the manuscript.

Funding

This research received no external funding.

Acknowledgments

The authors would like to thank the technical staff, especially Adrian Davis for his help and support in experiments at the Manufacturing Engineering Lab, School of Engineering, Edith Cowan University, Australia. The first author would also like to thank Edith Cowan University for the awarded (ECU-HDR) higher degree research scholarship.

Conflicts of Interest

The authors declare no conflict of interest.

Nomenclature

ANNartificial neural network
BUEbuilt-up edge
HSShigh-speed steel
MAPDmean absolute per cent deviation
MLPmultilayer perceptron
RMSEroot mean square error
Dtdrill type
f (mm/rev)feed
n (rpm)spindle speed
R2coefficient of determination
R a (µm)surface roughness

Appendix A. Numerical Example for Calculating the Surface Roughness

Calculate the surface roughness of the drill hole for the uncoated type of drill type used with a spindle speed of 1007 (rpm) and a feed of 0.08 (mm/rev).
Solution:
From Equation (1), normalise the input variables:
x n = { 1 , 0.2 ,   1 }
From Equation (4):
n n e t = { 4.5585 2.1665 13.4910 0.3860 }
Thereafter, from Equation (5):
n o u t = { 0.9997 0.9741 1 0.3679 }
Additionally, from Equation (6):
R a ( n ) = 0.5234
Finally, the surface roughness estimated using Equation (11) is:
R a = 1.771

References

  1. Aamir, M.; Giasin, K.; Tolouei-Rad, M.; Vafadar, A. A review: Drilling performance and hole quality of aluminium alloys for aerospace applications. J. Mater. Res. Technol. 2020, 9, 12484–12500. [Google Scholar] [CrossRef]
  2. Santos, M.C.; Machado, A.R.; Sales, W.F.; Barrozo, M.A.; Ezugwu, E.O. Machining of aluminum alloys: A review. Int. J. Adv. Manuf. Technol. 2016, 86, 3067–3080. [Google Scholar] [CrossRef]
  3. Giasin, K.; Hodzic, A.; Phadnis, V.; Ayvar-Soberanis, S. Assessment of cutting forces and hole quality in drilling Al2024 aluminium alloy: Experimental and finite element study. Int. J. Adv. Manuf. Technol. 2016, 87, 2041–2061. [Google Scholar] [CrossRef]
  4. Aamir, M.; Tolouei-Rad, M.; Giasin, K.; Nosrati, A. Recent advances in drilling of carbon fiber–reinforced polymers for aerospace applications: A review. Int. J. Adv. Manuf. Technol. 2019, 105, 2289–2308. [Google Scholar] [CrossRef]
  5. Zmarzły, P. Technological Heredity of the Turning Process. Tehnički Vjesnik 2020, 27, 1194–1203. [Google Scholar] [CrossRef]
  6. Nouari, M.; List, G.; Girot, F.; Gehin, D. Effect of machining parameters and coating on wear mechanisms in dry drilling of aluminium alloys. Int. J. Mach. Tools Manuf. 2005, 45, 1436–1442. [Google Scholar] [CrossRef]
  7. Kalidas, S.; DeVor, R.E.; Kapoor, S.G. Experimental investigation of the effect of drill coatings on hole quality under dry and wet drilling conditions. Surf. Coat. Technol. 2001, 148, 117–128. [Google Scholar] [CrossRef]
  8. Nouari, M.; List, G.; Girot, F.; Coupard, D. Experimental analysis and optimisation of tool wear in dry machining of aluminium alloys. Wear 2003, 255, 1359–1368. [Google Scholar] [CrossRef]
  9. Davoudinejad, A.; Ashrafi, S.A.; Hamzah, R.I.R.; Niazi, A. Experimental analysis of wear mechanism and tool life in dry drilling of Al2024. Adv. Mater. Res. 2012, 556, 217–221. [Google Scholar] [CrossRef]
  10. Roy, P.; Sarangi, S.; Ghosh, A.; Chattopadhyay, A. Machinability study of pure aluminium and Al–12% Si alloys against uncoated and coated carbide inserts. Int. J. Refract. Met. Hard Mater. 2009, 27, 535–544. [Google Scholar] [CrossRef]
  11. Kurt, M.; Kaynak, Y.; Bagci, E. Evaluation of drilled hole quality in Al 2024 alloy. Int. J. Adv. Manuf. Technol. 2008, 37, 1051–1060. [Google Scholar] [CrossRef]
  12. Tolouei-Rad, M.; Zolfaghari, S. Productivity improvement using Special-Purpose Modular machine tools. Int. J. Manuf. Res. 2009, 4, 219–235. [Google Scholar]
  13. Tolouei-Rad, M. An efficient algorithm for automatic machining sequence planning in milling operations. Int. J. Product. Res. 2003, 41, 4115–4131. [Google Scholar] [CrossRef]
  14. Tolouei-Rad, M. An intelligent approach to high quantity automated machining. J. Achiev. Mater. Manuf. Eng. 2011, 47, 195–204. [Google Scholar]
  15. Tolouei-Rad, M. Intelligent Analysis of Utilization of Special Purpose Machines for Drilling Operations. In Intelligent Systems; Koleshko, V.M., Ed.; InTech: Croatia, 2012; pp. 297–320. ISBN 978-953-51-0054-6. Available online: http://www.intechopen.com/books/intelligent-systems/intelligent-analysis-of-utilization-of-special-purposemachines-for-drilling-operations (accessed on 10 August 2020).
  16. Aamir, M.; Tu, S.; Giasin, K.; Tolouei-Rad, M. Multi-hole simultaneous drilling of aluminium alloy: A preliminary study and evaluation against one-shot drilling process. J. Mater. Res. Technol. 2020, 9, 3994–4006. [Google Scholar] [CrossRef]
  17. Aamir, M.; Tu, S.; Tolouei-Rad, M.; Giasin, K.; Vafadar, A. Optimization and modeling of process parameters in multi-hole simultaneous drilling using taguchi method and fuzzy logic approach. Materials 2020, 13, 680. [Google Scholar] [CrossRef] [Green Version]
  18. Aamir, M.; Tolouei-Rad, M.; Giasin, K.; Vafadar, A. Machinability of Al2024, Al6061, and Al5083 alloys using multi-hole simultaneous drilling approach. J. Mater. Res. Technol. 2020, 9, 10991–11002. [Google Scholar] [CrossRef]
  19. Aamir, M.; Tolouei-Rad, M.; Giasin, K.; Vafadar, A. Feasibility of tool configuration and the effect of tool material, and tool geometry in multi-hole simultaneous drilling of Al2024. Int. J. Adv. Manuf. Technol. 2020, 111, 861–879. [Google Scholar] [CrossRef]
  20. Pontes, F.J.; Ferreira, J.R.; Silva, M.B.; Paiva, A.P.; Balestrassi, P.P. Artificial neural networks for machining processes surface roughness modeling. Int. J. Adv. Manuf. Technol. 2010, 49, 879–902. [Google Scholar] [CrossRef]
  21. Basheer, A.C.; Dabade, U.A.; Joshi, S.S.; Bhanuprasad, V.; Gadre, V. Modeling of surface roughness in precision machining of metal matrix composites using ANN. J. Mater. Process. Technol. 2008, 197, 439–444. [Google Scholar] [CrossRef]
  22. Dursun, T.; Soutis, C. Recent developments in advanced aircraft aluminium alloys. Mater. Des. 2014, 56, 862–871. [Google Scholar] [CrossRef]
  23. Sheikh-Ahmad, J.Y. Machining of Polymer Composites; Springer: Boston, MA, USA, 2009. [Google Scholar]
  24. Statoncoating. Coatings for Cutting Tools. Available online: https://www.statoncoating.com/en/coatings/coatings-cutting-tools (accessed on 18 August 2020).
  25. Ratnam, M. Factors affecting surface roughness in finish turning. In Comprehensive Materials Finishing; Elsevier, 2017; Volume 1, pp. 1–25. Available online: https://corp.credoreference.com/component/booktracker/edition/11261.html (accessed on 18 August 2020).
  26. Kowalczyk, M. Application of Taguchi and Anova methods in selection of process parameters for surface roughness in precision turning of titanium. Adv. Manuf. Sci. Technol. 2014, 38. [Google Scholar] [CrossRef]
  27. Xu, J.; Mkaddem, A.; El Mansori, M. Recent advances in drilling hybrid FRP/Ti composite: A state-of-the-art review. Compos. Struct. 2016, 135, 316–338. [Google Scholar] [CrossRef] [Green Version]
  28. Meral, G.; Sarıkaya, M.; Mia, M.; Dilipak, H.; Şeker, U. Optimization of hole quality produced by novel drill geometries using the Taguchi S/N approach. Int. J. Adv. Manuf. Technol. 2019, 101, 339–355. [Google Scholar] [CrossRef]
  29. Giasin, K.; Gorey, G.; Byrne, C.; Sinke, J.; Brousseau, E. Effect of machining parameters and cutting tool coating on hole quality in dry drilling of fibre metal laminates. Compos. Struct. 2019, 212, 159–174. [Google Scholar] [CrossRef]
  30. Giasin, K. The effect of drilling parameters, cooling technology, and fiber orientation on hole perpendicularity error in fiber metal laminates. Int. J. Adv. Manuf. Technol. 2018, 97, 4081–4099. [Google Scholar] [CrossRef] [Green Version]
  31. Giasin, K.; Ayvar-Soberanis, S. An Investigation of burrs, chip formation, hole size, circularity and delamination during drilling operation of GLARE using ANOVA. Compos. Struct. 2017, 159, 745–760. [Google Scholar] [CrossRef]
  32. Giasin, K.; Ayvar-Soberanis, S. Evaluation of workpiece temperature during drilling of GLARE fiber metal laminates using infrared techniques: Effect of cutting parameters, fiber orientation and spray mist application. Materials 2016, 9, 622. [Google Scholar] [CrossRef]
  33. Giasin, K.; Ayvar-Soberanis, S.; Hodzic, A. The effects of minimum quantity lubrication and cryogenic liquid nitrogen cooling on drilled hole quality in GLARE fibre metal laminates. Mater. Des. 2016, 89, 996–1006. [Google Scholar] [CrossRef]
  34. Giasin, K.; Ayvar-Soberanis, S.; Hodzic, A. An experimental study on drilling of unidirectional GLARE fibre metal laminates. Compos. Struct. 2015, 133, 794–808. [Google Scholar] [CrossRef]
  35. Kilickap, E. Modeling and optimization of burr height in drilling of Al-7075 using Taguchi method and response surface methodology. Int. J. Adv. Manuf. Technol. 2010, 49, 911–923. [Google Scholar] [CrossRef]
  36. Kurt, M.; Bagci, E.; Kaynak, Y. Application of Taguchi methods in the optimization of cutting parameters for surface finish and hole diameter accuracy in dry drilling processes. Int. J. Adv. Manuf. Technol. 2009, 40, 458–469. [Google Scholar] [CrossRef]
  37. Zhu, Z.; Guo, K.; Sun, J.; Li, J.; Liu, Y.; Zheng, Y.; Chen, L. Evaluation of novel tool geometries in dry drilling aluminium 2024-T351/titanium Ti6Al4V stack. J. Mater. Process. Technol. 2018, 259, 270–281. [Google Scholar] [CrossRef]
  38. Hanif, M.I.; Aamir, M.; Ahmed, N.; Maqsood, S.; Muhammad, R.; Akhtar, R.; Hussain, I. Optimization of facing process by indigenously developed force dynamometer. Int. J. Adv. Manuf. Technol. 2019, 100, 1893–1905. [Google Scholar] [CrossRef]
  39. Hanif, M.I.; Aamir, M.; Muhammad, R.; Ahmed, N.; Maqsood, S. Design and development of low cost compact force dynamometer for cutting forces measurements and process parameters optimization in turning applications. Int. J. Innov. Sci. 2015, 3, 306–3016. [Google Scholar]
  40. Melentiev, R.; Priarone, P.C.; Robiglio, M.; Settineri, L. Effects of tool geometry and process parameters on delamination in CFRP drilling: An overview. Procedia CIRP 2016, 45, 31–34. [Google Scholar] [CrossRef] [Green Version]
  41. Karabulut, S. Study on machining parameters for thrust force and torque in milling aa7039 composites reinforced with al2o3/b4c/sic particles. Int. J. Eng. Technol. 2016, 2, 68–75. [Google Scholar] [CrossRef]
  42. Ramulu, M.; Branson, T.; Kim, D. A study on the drilling of composite and titanium stacks. Compos. Struct. 2001, 54, 67–77. [Google Scholar] [CrossRef]
  43. Giasin, K.; Ayvar-Soberanis, S.; French, T.; Phadnis, V. 3D finite element modelling of cutting forces in drilling fibre metal laminates and experimental hole quality analysis. Appl. Compos. Mater. 2017, 24, 113–137. [Google Scholar] [CrossRef] [Green Version]
  44. Jindal, P.; Santhanam, A.; Schleinkofer, U.; Shuster, A. Performance of PVD TiN, TiCN, and TiAlN coated cemented carbide tools in turning. Int. J. Refract. Met. Hard Mater. 1999, 17, 163–170. [Google Scholar] [CrossRef]
  45. Hosokawa, A.; Shimamura, K.; Ueda, T. Cutting characteristics of PVD-coated tools deposited by unbalanced magnetron sputtering method. CIRP Ann. 2012, 61, 95–98. [Google Scholar] [CrossRef]
  46. Dumkum, C.; Jaritngam, P.; Tangwarodomnukun, V. Surface characteristics and machining performance of TiAlN-, TiN-and AlCrN-coated tungsten carbide drills. Proc. Inst. Mech. Eng. Part B J. Eng. Manuf. 2019, 233, 1075–1086. [Google Scholar] [CrossRef]
  47. McCulloch, W.S.; Pitts, W. A logical calculus of the ideas immanent in nervous activity. Bull. Math. Biophys. 1943, 5, 115–133. [Google Scholar] [CrossRef]
  48. Nazari, S.; Bahiraei, M.; Moayedi, H.; Safarzadeh, H. A proper model to predict energy efficiency, exergy efficiency, and water productivity of a solar still via optimized neural network. J. Clean. Prod. 2020, 227, 123232. [Google Scholar] [CrossRef]
  49. Raja, M.N.A.; Shukla, S.K. An extreme learning machine model for geosynthetic-reinforced sandy soil foundations. Proc. Inst. Civ. Eng. Geotech. Eng. 2020, 1–21. [Google Scholar] [CrossRef]
  50. Gao, W.; Alsarraf, J.; Moayedi, H.; Shahsavar, A.; Nguyen, H. Comprehensive preference learning and feature validity for designing energy-efficient residential buildings using machine learning paradigms. Appl. Soft Comput. 2019, 84, 105748. [Google Scholar] [CrossRef]
  51. Hornik, K. Approximation capabilities of multilayer feedforward networks. Neural Netw. 1991, 4, 251–257. [Google Scholar] [CrossRef]
  52. Ghorbani, B.; Arulrajah, A.; Narsilio, G.; Horpibulsuk, S.; Bo, M.W. Development of genetic-based models for predicting the resilient modulus of cohesive pavement subgrade soils. Soils Found. 2020, 60, 398–412. [Google Scholar] [CrossRef]
  53. Cybenko, G. Approximation by superpositions of a sigmoidal function. Math. Control Signals Syst. 1989, 2, 303–314. [Google Scholar] [CrossRef]
  54. Ziaee, S.A.; Sadrossadat, E.; Alavi, A.H.; Shadmehri, D.M. Explicit formulation of bearing capacity of shallow foundations on rock masses using artificial neural networks: Application and supplementary studies. Environ. Earth Sci. 2015, 73, 3417–3431. [Google Scholar] [CrossRef]
  55. Kingston, G.B.; Maier, H.R.; Lambert, M.F. Calibration and validation of neural networks to ensure physically plausible hydrological modeling. J. Hydrol. 2005, 314, 158–176. [Google Scholar] [CrossRef]
  56. Hamby, D. A comparison of sensitivity analysis techniques. Health Phys. 1995, 68, 195–204. [Google Scholar] [CrossRef] [PubMed] [Green Version]
  57. Shahin, M.A.; Maier, H.R.; Jaksa, M.B. Predicting settlement of shallow foundations using neural networks. J. Geotech. Geoenviron. Eng. 2002, 128, 785–793. [Google Scholar] [CrossRef]
  58. Khosrojerdi, M.; Xiao, M.; Qiu, T.; Nicks, J. Nonlinear Equation for Predicting the Settlement of Reinforced Soil Foundations. J. Geotech. Geoenviron. Eng. 2019, 145, 04019013. [Google Scholar] [CrossRef]
Figure 1. Details of the equipment.
Applsci 10 08633 g001
Figure 2. Average thrust force
Applsci 10 08633 g002
Figure 3. Hole images from uncoated carbide drills [18].
Applsci 10 08633 g003
Figure 4. Hole images from TiN coated carbide drills.
Applsci 10 08633 g004
Figure 5. Hole images from TiCN coated carbide drills.
Applsci 10 08633 g005
Figure 6. Average surface roughness (µm).
Applsci 10 08633 g006
Figure 7. Proposed scheme for predicting the surface roughness.
Applsci 10 08633 g007
Figure 8. The architecture of the artificial neural network.
Applsci 10 08633 g008
Figure 9. Scatter and error plots between the measured and simulated values of surface roughness for training.
Applsci 10 08633 g009
Figure 10. Scatter and error plots between the measured and simulated values of surface roughness for testing.
Applsci 10 08633 g010
Figure 11. Sensitivity analysis.
Applsci 10 08633 g011
Table 1. Previous studies on the machining of aluminium alloys using coated drill bits.
Machining ProcessTool Materials/CoatingsAluminium AlloyConclusionsRef
One shot-drilling processHSS uncoated drills Coatings:
TiAlN/TiN (multilayer)
TiAlN
356 alloyThe results showed that the coatings did not show any significant impact on the temperature of the workpiece and the surface texture of the holes. However, drills with coatings of TiAlN/TiN and TiAlN showed better dimensional accuracy of the hole.[7]
One shot-drilling processUncoated carbide
Coatings:
TiN
TiN + Ag
TiAlN
TiAlN + WC/C
Diamond
Al2024-T351It was reported that in terms of hole quality and tool life in dry drilling of Al2024, the coated drills did not perform well, expect a diamond and Hardlube coated drills with results closed to that obtained in uncoated carbide drills.[8]
One shot-drilling processUncoated HSS
Coatings:
Cobalt
Al2024The study recommended that in comparison to uncoated HSS drills, the longer tool life was obtained when the HSS-Co drills were used.[9]
TurningUncoated carbide
Coatings:
TiC
TiN
Al2O3
AlON
TiB2
Diamond
Pure aluminium and Al–12% SiIt was concluded that coatings were not successful in dry machining of pure aluminium and Al–12% Si alloys because of the formation of built-up edge on the tools and subsequent increased in cutting forces and surface roughness of the materials.[10]
One shot-drilling processUncoated HSS
Coatings:
TiAlN
%5 Co
TiN
Al2024The use of TiAlN and TiN coated HSS drills were not recommended at low cutting parameters. The only coated drill suggested in their study was the HSS-Co 5% that delivered an outstanding performance in all cutting parameters.[11]
Table 2. ANOVA for thrust force.
SourceDFSeq SSAdj SSAdj MSF-Valuep-ValueContribution
Model1811,25,2851,125,28562,516671.61099.93%
Linear61,120,6661,120,666186,7782006.57099.52%
n 26636633323.560.0780.06%
f 21,117,2001,117,200558,6006001.1099.22%
D t 228032803140115.060.0020.25%
2-Way Interactions12461946193854.140.0260.41%
n   ×   f 4213121315335.720.0180.19%
n ×   D t 4136313633413.660.0560.12%
f ×   D t 4112511252813.020.0860.10%
Error874574593--0.07%
Total261,126,029----100.00%
Spindle speed:   n (rpm), feed: f (mm/rev), drill type: D t .
Table 3. ANOVA for surface roughness.
SourceDFSeq SSAdj SSAdj MSF-Valuep-ValueContribution
Model187.707137.707130.42817191.81099.77%
Linear67.526387.526381.2544561.93097.43%
n 25.041595.041592.520791129.24065.26%
f 22.230152.230151.11508499.52028.87%
D t 20.254650.254650.1273257.0403.30%
2-Way Interactions120.180750.180750.015066.750.0062.34%
n   ×   f 40.1020.1020.025511.420.0021.32%
n ×   D t 40.064810.064810.01627.260.0090.84%
f ×   D t 40.013940.013940.003491.560.2740.18%
Error80.017860.017860.00223--0.23%
Total267.72499----100.00%
Spindle speed:   n (rpm), feed: f (mm/rev), drill type: D t .
Table 4. Statistical properties of experimental database.
Statistical PropertiesSpindle Speed (rpm)Feed (mm/rev)Surface Roughness
(µm)
Mean2015.670.092.34
Standard Error92.110.000.06
Median2015.000.082.32
Standard Deviation828.980.040.55
Range2018.000.102.40
Minimum1007.000.041.20
Maximum3025.000.143.60
Table 5. Statistical indices for training and testing datasets.
DatasetStatistical Indices Magnitudes
RMSEMAPD (%)R2
Training 0.1274.690.95
Testing0.2048.120.88
Publisher’s Note: MDPI stays neutral with regard to jurisdictional claims in published maps and institutional affiliations.

