Abstract
Pulse front distortion occurring in lenses can broaden the temporal profile of the pulse at focus and therefore decrease the focused intensity, especially for large-aperture femtosecond lasers. A previously proposed self-reference cross correlator was improved to directly measure the pulse front distortion of high-peak-power femtosecond lasers. The measured results of a 200 TW/27 fs laser are in good accordance with the calculated value. Moreover, the temporal intensity distribution of the pulse in the focal region was also investigated, in order to better guide and further promote the strong laser-matter interaction investigations. According to the measured PFD, the effective pulse duration at far field of this 200 TW laser was theoretically simulated to be ≈49 fs, which is almost two times the generally regarded 27 fs. As a result, the actually available focused intensity of this laser is only 55% of the case without pulse front distortion.
1. Introduction
In the past decade, significant advances in extreme high-field laser physics have been realized, benefiting from the rapid development of high-peak-power lasers. As examples, take the acceleration of high-energy particle beams, and high-order harmonic and X-ray generation [1,2,3]. A crucial factor for the success of these laser–matter interaction studies is the laser intensity at focus. Focused intensity as high as 1022 W/cm2 has been realized in several multi-hundred terawatt (TW) and petawatt (PW) femtosecond lasers [4,5,6,7], and 1023 W/cm2 will probably be realized in 10 PW-level lasers in the near future [8,9]. In a typical high-peak-power femtosecond laser system, the lens-based telescopes are generally employed, which generate pulse front distortion (PFD) because of the dispersion effect of large spectral bandwidth [10,11,12]. In addition, the beam size of femtosecond lasers is increasing correspondingly along with the rapid development of laser peak power, and meanwhile PFD is increasing with the square of laser beam size. Moreover, PFD can broaden the effective pulse duration at the far field and consequently reduce the laser’s focused intensity [13,14]. Therefore, the PFD in high-peak-power femtosecond lasers should be carefully measured and compensated for [15,16], in order to guarantee optimum performance.
PFD can be avoided by using all-reflective or achromatic telescopes [17,18]. However, spherical mirrors have remarkable astigmatism; off-axis parabolic mirrors are expensive and difficult to align; and achromatic lenses are limited by size availability. Therefore, most of existing high-peak-power laser systems are still equipped with lens-based telescopes. In order to measure the PFD, some methods based on the Michelson and Mach–Zehnder interferometers were proposed [19,20,21,22,23]. Nevertheless, the vast majority of them need to introduce or generate an ideal reference pulse without PFD, which will increase the complexity and difficulty in measurement. Especially for high-peak-power femtosecond lasers, the required large-size optical components in measurement may be also a limitation. In 2016, we proposed a novel measurement scheme for the PFD of large-aperture ultra-short laser pulses, which can work without any difficulty for the desired reference pulses, and meanwhile can decrease the size requirements of the optical components in measurement [24]. However, a perfect axisymmrtric quadratic curve assumption of PFD is a prerequisite in this method. Based on the measured results, we can only deduce the assumed quadratic curve of PFD, and the PFD at an arbitrary position of the pulse under investigation cannot be directly measured. Moreover, owning to the thermal lens focusing [25,26] and the long optical paths of high-peak-power femtosecond laser systems, the output pulses are hard to be strictly collimated, and therefore their PFD values are general not strict quadratic curves.
In this work, our previously proposed self-reference cross correlator was improved to measure the PFD values of high-peak-power femtosecond lasers directly, which is induced by the chromatic aberration of lenses. After improvement, the quadratic curve assumption of PFD is not needed in measurement. Moreover, this improved self-reference cross correlator can not only achieve the global PFD, but also directly measure the PFD at any position of the pulse. The disadvantage of this new self-reference cross correlator is that the single-shot measurement of the global PFD is not available, as it is obtained based on a scanning measurement of the PFD at different positions. This new self-reference cross correlator was applied to a 200 TW/27 fs laser [27], and the experimentally measured PFD values are in good agreement with the theoretical curve. In addition, the temporal intensity distribution of this 200 TW laser in the focal region was also theoretically investigated. According to the measured PFD, the effective pulse duration at the far field of this 200 TW laser was simulated to be about 49 fs, rather than the usually regarded 27 fs. As a result, the actually achieved focused intensity of this laser was only 55% of the ideal case (without PFD). It is worth noting that the degradation of focused intensity induced by PFD may be more serious for PW- and 10 PW-class femtosecond lasers with larger beam sizes.
2. Measurement Method
In the previous measurement scheme [24], the pulse under investigation was equally divided into two beams; then, injected into the two arms of a Michelson interferometer; and finally, spatially overlapped after a beam splitter. After adjusting the time delay between two arms, the time delay distribution between the two pulse fronts of the space overlapped pulse is measured by scanning with a second-order autocorrelator. It is notable that this method is based on the quadratic curve assumption of PFD, and thus the relative delay between the two pulse fronts of overlapped pulse is a linear function of radial position r. Through fitting the measured results, we can achieve a linear coefficient k. Then, according to the linear coefficient (k) and the radius (r0) of the investigated pulse, the quadratic coefficient (a = k/2r0) and corresponding curve (T = ar2) of PFD can be obtained. The measured PFD of a 80 mm-diameter pulse is −54.4 fs, which should be a little different from the actual value through the consideration of beam divergence. Moreover, the PFD at any position of the investigated pulse cannot be directly measured by this method.
The setup of the improved self-reference cross correlator is described in Figure 1. Compared to that in [24], an extra iris diaphragm is installed at the entrance and M4 is mounted on a high-precision linear translation stage. The iris diaphragm is concentric with the pulse under investigation, and is utilized to sample pulses with different diameters. The radius of the iris diaphragm corresponds to the radial position of the investigated pulse. Therefore, by changing the aperture of the iris diaphragm and measuring the maximal PFD of each sampled pulse, we can achieve the PDF at any position of the investigated pulse. The maximal PFD of each sampled pulse is the time delay between the pulse fronts at the edge and the center of pulse. However, along with the aperture of the iris diaphragm changing, the two pulse beams after BS will spatially separate. By linearly translating M4 until the two pulse beams are overlapped at the near field hole and far field CCD, in which case the spatial overlap of the two pulse beams is realized, the time delay between the pulse fronts can be measured. In order to realize a precise alignment, a high-resolution CCD (3.7 μm, Beamgage-SP928) and a long-focal-length positive lens (f = 4 m) are used in the far field monitoring system. The misalignment of these two pulse beams can be controlled below 5 μrad, which induces a time delay across the 40 mm overlapped laser beam of about 0.6 fs. The influence is so little it can be ignored.
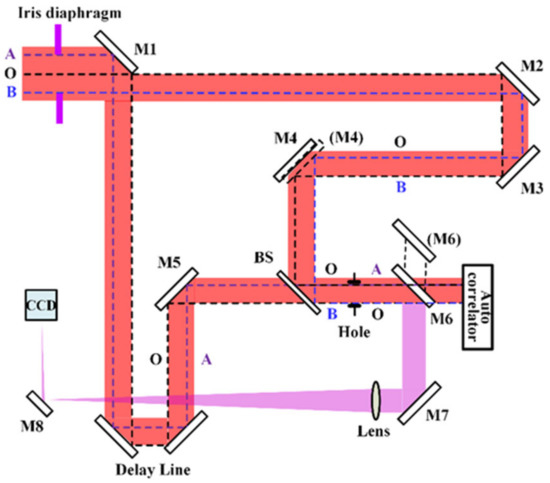
Figure 1.
Setup of the optimized self-reference cross correlator.
As Figure 1 shows, the pulse under investigation is size limited by the iris diaphragm firstly, and then equally divided into two pulse beams by M1. These two equal-sized pulse beams are injected into the two arms of the Michelson interferometer respectively, and finally spatially overlapped after the BS by linearly translating M4. In addition, the two pulse fronts of the overlapped pulse are completely separated by adjusting the delay line. Based on the above description, the pulse front of the overlapped pulse can be described as in Figure 2. As we know, the lens’s induced PFD is symmetrical, even though the pulse has divergence. Therefore, the delay times between the pulse front at the center (O) and the two edges (A/B) are the same; i.e., ∆T1 = ∆T2. Then the maximal PFD of each sampled pulse can be illustrated as Equation (1).
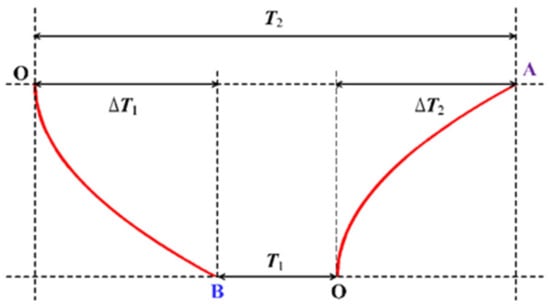
Figure 2.
Distributions of two pulse fronts of the overlapped pulse.
It means that the maximal PFD of each sampled pulse can be directly obtained just by measuring the time delay between the pulse fronts at two edges of the overlapped pulse, i.e., T1 and T2. In order to measure the time delay, the two edge parts (OA and BO) of the overlapped pulse are delivered into a commercial second-order autocorrelator, with a beam diameter of 2 mm. In the measurement, the correlation signal with three peaks is recorded on an oscilloscope, and the temporal interval between the auto- and cross-correlation signals is the time delay between the two pulse fronts at the measured position.
Moreover, by changing the aperture of iris diaphragm and measuring the maximal PFD of each sampled pulse, the PFD is at an arbitrary position, and meanwhile, the global PFD of the investigated pulse can be obtained.
3. Experimental Results
As described in [24], the PFD in a 200 TW/27 fs laser system mainly results from the four-stage lens-based beam expanders. The gratings-induced pulse front tilt has been carefully checked and controlled by the method referred to in [28]. Thus, the PFD in this laser system can be illustrated as Equation (2).
The PFD measurement was performed after the compressor. Limited by the aperture of the output window in the vacuum compressor, the beam diameter of output pulse was decreased from 85 to 80 mm. The diameter of the iris diaphragm is designed to change through 13, 26, 39, 52, 65 and 80 mm, respectively. In the case of a different beam diameter, the spatial overlap of the two pulse beams after BS is realized by linearly translating M4. The recorded correlation signals of the above six sampled pulses are shown in Figure 3, and the blue and red traces represent the results measured at two edges of the overlapped pulse after BS. The temporal intervals between the red auto- and cross-correlation peaks were 140, 237, 224, 275, 270 and 264 fs, corresponding to the time delays of T2 measured at OA. The temporal intervals between the blue ones were 135, 220, 202, 231, 201 and 152 fs, corresponding to the time delays of T1 measured at BO. As a result, the corresponding difference values (T2 − T1) of above six sampled pulses were 5, 17, 22, 44, 69 and 112 fs, respectively.
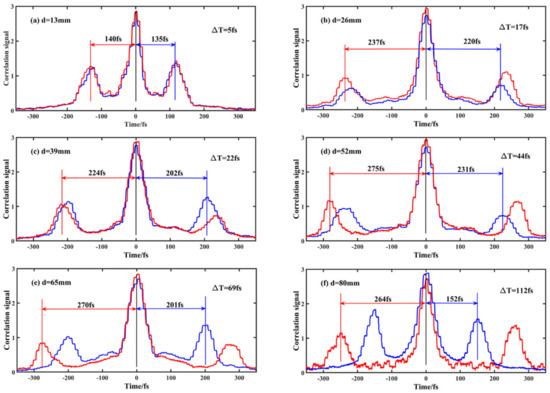
Figure 3.
Measured correlation signals of the six sampled pulses.
Based on the Equation (1), the maximal PFD of the above six sampled pulses are 2.5, 8.5, 11, 22, 34.5 and 56 fs, respectively. In other words, the PFD values of 85 mm-diameter compressed pulse are −2.5, −8.5, −11, −22, −34.5 and −56 fs respectively, at the radii are 6.5, 13, 19.5, 26, 32.5 and 40 mm. As Figure 4 shows, the experimentally measured results fit well with the theoretical curve. The slight difference may have resulted from the little divergence (≈50 μrad) of the pulse beam; the maximal group delay of the pulse front induced by this divergence is below 2 fs. Based on the experimental results and theoretical calculations above, we can deduce the maximal PFD of an 85 mm-diameter compressed pulse is about −62.8 fs. In addition, the experimental results also demonstrate that, by this improved self-reference cross correlator, the PFD at any position of pulse can be directly measured; meanwhile, the global PFD can be obtained by the scanning measurement.
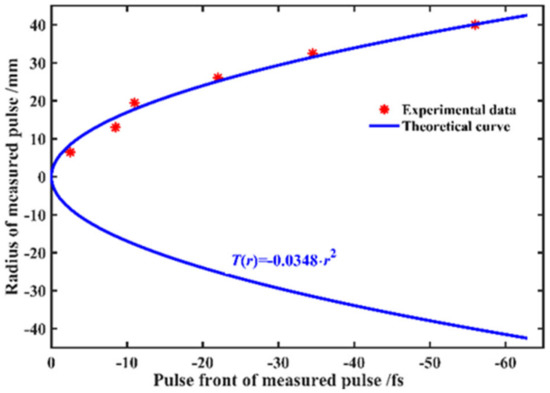
Figure 4.
Measured data and theoretical curve of the pulse front distortion.
4. Far Field Pulse Duration
In order to better guide and further promote the strong laser–matter interaction investigations, the actual available focused intensity of laser should be accurately judged. Thereby, the far field pulse duration of laser should be deduced, which can be much longer than the regarded value due to the presence of PFD. To deduce the effective pulse duration of this 200 TW laser at the far field under the PFD of −62.8 fs, the temporal intensity distribution of the pulse at focus was investigated. Assume the spatial beam profile of a compressed pulse is homogeneous, and the temporal profile is Gaussian type. The 85 mm in diameter compressed pulse is divided into N concentric rings by equal spacing, and then the pulse intensity ratio is equal to the area ratio of rings. In the presence of PFD, the pulse front at a different ring will arrive at the focus at a different time. The central part is delayed with respect to the other parts, and the relevant time delay is the PFD at the corresponding position. The temporal intensity distribution of the 85 mm-diameter compressed pulse at focus is simply illustrated as Figure 5 (N = 20), and all the pulses are assumed as Gaussian-type pulses with 27 fs duration.
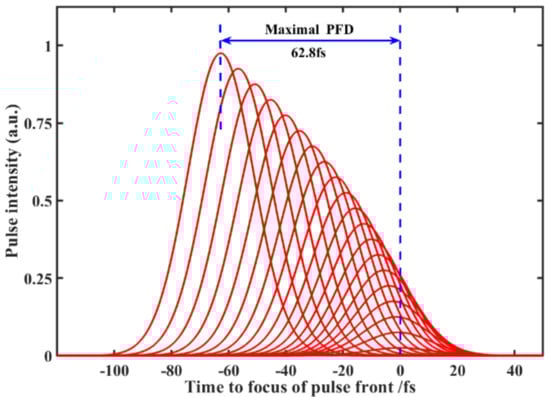
Figure 5.
Temporal intensity distribution at focus of the 200 TW laser.
As a result, the temporal profile of the pulse at focus is an envelope of superposed pulses from different radial positions, and the effective pulse duration at the far field is simulated to be ≈49 fs (N→∞), which is almost two times the generally regarded 27 fs, as shown in Figure 6. Consequently, the actually achieved focused intensity of this laser was only about 55% of the ideal value (without PFD). In general, the influence of PFD is small for ns-class long lasers, and therefore can be ignored. However, for high-peak-power femtosecond lasers, PFD can result in significant temporal broadening of pulse duration at focus, and then dramatically reduce the focused intensity. For example, the PFD in PEAT laser [18] induced a decrease of the focused intensity on the target by a factor of eight compared with the ideal situation. Therefore, in order to achieve higher focused intensity and further promote strong field laser physics investigations, the PFD in high-peak-power femtosecond laser systems should be compensated based on the experimentally measured results [15,16,18,29].
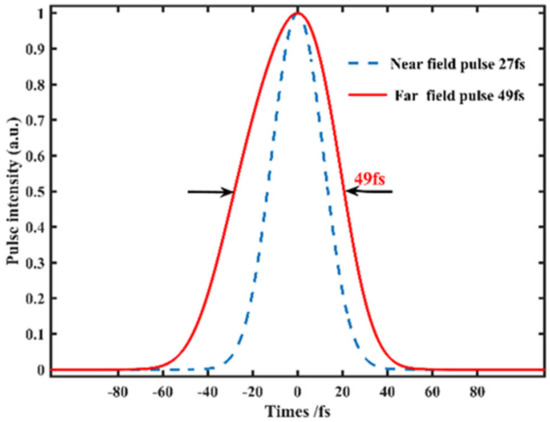
Figure 6.
Near field partial and far field pulse durations of the 200 TW laser.
5. Conclusions
In conclusion, our previous self-reference cross correlator was improved to directly measure the PFD values of high-peak-power femtosecond lasers. After improvement, the PFD at any position of pulse can be directly measured without the quadratic curve assumption, and meanwhile the global PFD can be achieved by the scanning measurement of the PFD at different positions. The measured PFD values of our 200 TW/27 fs laser are in good agreement with the calculated curve. In addition, the temporal intensity distribution of the pulse at focus was also investigated. Based on the measured PFD, the effective pulse duration at the far field of this 200 TW laser is broadened to ≈49 fs, instead of the generally regarded 27 fs. As a result, the actual available focused intensity of this laser is only 55% of the ideal case. It is worth noting that the degradation of focused intensity induced by PFD may be more significant than the degradation for the PW- and 10 PW-class lasers with larger beam sizes.
Author Contributions
Conceptualization, F.W., Y.X. and Y.L.; methodology, Z.Z.; formal analysis, J.H.; investigation, F.W. and X.Y.; writing—Original draft preparation, F.W.; writing—Review and editing, Y.X. and Y.L. All authors participated in the general discussion of the obtained results. All authors have read and agreed to the published version of the manuscript.
Funding
This research was funded by National Natural Science Foundation of China (11127901, 61521093, 61505234); Strategic Priority Research Program of Chinese Academy of Sciences (XDB160301); International S&T Cooperation of China Program (2016YFE0119300); Natural Science Foundation of Shanghai (20ZR1464600); Science and Technology Commission of Shanghai Municipality (2017SHZDZX02).
Conflicts of Interest
The authors declare no conflict of interest.
References
- Volpe, L.; Fedosejevs, R.; Gatti, G.; Pérez-Hernández, J.A.; Méndez, C.; Apiñaniz, J.; Vaisseau, X.; Salgado, C.; Huault, M.; Malko, S.; et al. Generation of high energy laser-driven electron and proton sources with the 200 TW system VEGA 2 at the Centro de Laseres Pulsados. High. Power Laser Sci. Eng. 2019, 7, 25. [Google Scholar] [CrossRef]
- Vampa, G.; Hammond, T.J.; Thire, N.; Schmidt, B.E.; Legare, F.; McDonald, C.R.; Brabec, T.; Corkum, P.B. Linking high harmonics from gases and solids. Nature 2015, 522, 462–464. [Google Scholar] [CrossRef]
- Chapman, H.N.; Fromme, P.; Barty, A.; White, T.A.; Kirian, R.A.; Aquila, A.; Hunter, M.S.; Schulz, J.; DePonte, D.P.; Weierstall, U.; et al. Femtosecond X-ray protein nanocrystallography. Nature 2011, 470, 73–77. [Google Scholar] [CrossRef]
- Yanovsky, V.; Chvykov, V.; Kalinchenko, G.; Rousseau, P.; Planchon, T.; Matsuoka, T.; Maksimchuk, A.; Nees, J.; Cheriaux, G.; Mourou, G.; et al. Ultra-high intensity-300-TW laser at 0.1 Hz repetition rate. Opt. Express 2008, 16, 2109–2114. [Google Scholar] [CrossRef]
- Pirozhkov, A.S.; Fukuda, Y.; Nishiuchi, M.; Kiriyama, H.; Sagisaka, A.; Ogura, K.; Mori, M.; Kishimoto, M.; Sakaki, H.; Dover, N.P.; et al. Approaching the diffraction-limited, bandwidth-limited Petawatt. Opt. Express 2017, 25, 20486–20501. [Google Scholar] [CrossRef]
- Danson, C.N.; Haefner, C.; Bromage, J.; Butcher, T.; Chanteloup, J.-C.F.; Chowdhury, E.A.; Galvanauskas, A.; Gizzi, L.A.; Hein, J.; Hillier, D.I.; et al. Petawatt and exawatt class lasers worldwide. High. Power Laser Sci. Eng. 2019, 7, e54. [Google Scholar] [CrossRef]
- Zhang, Z.; Wu, F.; Hu, J.; Yang, X.; Gui, J.; Ji, P.; Liu, X.; Wang, C.; Liu, Y.; Lu, X.; et al. The 1 PW/0.1 Hz laser beamline in SULF facility. High. Power Laser Sci. Eng. 2020, 8, e4. [Google Scholar] [CrossRef]
- Bromage, J.; Bahk, S.-W.; Begishev, I.A.; Dorrer, C.; Guardalben, M.J.; Hoffman, B.N.; Oliver, J.B.; Roides, R.G.; Schiesser, E.M.; Shoup, M.J., III; et al. Technology development for ultraintense all-OPCPA systems. High. Power Laser Sci. Eng. 2019, 7, e4. [Google Scholar] [CrossRef]
- Turcu, I.C.E.; Shen, B.; Neely, D.; Sarri, G.; Tanaka, K.A.; McKenna, P.; Mangles, S.P.D.; Yu, T.-P.; Luo, W.; Zhu, X.-L.; et al. Quantum electrodynamics experiments with colliding petawatt laser pulses. High. Power Laser Sci. Eng. 2019, 7, e10. [Google Scholar] [CrossRef]
- Bor, Z. Distortion of Femtosecond Laser Pulses in Lenses and Lens Systems. J. Mod. Opt. 1988, 35, 1907–1918. [Google Scholar] [CrossRef]
- Heuck, H.-M.; Neumayer, P.; Kühl, T.; Wittrock, U. Chromatic aberration in petawatt-class lasers. Appl. Phys. B 2006, 84, 421–428. [Google Scholar] [CrossRef]
- Szatmári, S.; Kuhnle, G. Pulse front and pulse duration distortion in refractive optics, and its compensation. Opt. Commun. 1988, 69, 60–65. [Google Scholar] [CrossRef]
- Kempe, M.; Rudolph, W. Femtosecond pulses in the focal region of lenses. Phys. Rev. A 1993, 48, 4721–4729. [Google Scholar] [CrossRef]
- Jeong, T.M.; Ko, D.-K.; Lee, J. Deformation of the Focal Spot of an Ultrashort High-Power Laser Pulse due to Chromatic Aberration by a Beam Expander. J. Korean Phys. Soc. 2008, 52, 1767–1773. [Google Scholar] [CrossRef]
- Bahk, S.-W.; Bromage, J.; Zuegel, J.D. Offner radial group delay compensator for ultra-broadband laser beam transport. Opt. Lett. 2014, 39, 1081–1084. [Google Scholar] [CrossRef]
- Wu, F.; Xu, Y.; Yu, L.; Yang, X.; Li, W.; Lu, J.; Leng, Y. Measurement and compensation schemes for the pulse front distortion of ultra-intensity ultra-short laser pulses. High Power Lasers Appl. VIII 2016, 10016, 1001610. [Google Scholar]
- Zhang, J.; Nie, Y.; Fu, Q.; Peng, Y. Optical-digital joint design of refractive telescope using chromatic priors. Chin. Opt. Lett. 2019, 17, 052201. [Google Scholar] [CrossRef]
- Neauport, J.; Blanchot, N.; Rouyer, C.; Sauteret, C. Chromatism compensation of the PETAL multi petawatt high-energy laser. Appl. Opt. 2007, 46, 1568–1574. [Google Scholar] [CrossRef]
- Bor, Z.; Gogolak, Z.; Szabo, G. Femtosecond-resolution pulse-front distortion measurement by time-of-flight interferometry. Opt. Lett. 1989, 14, 862–864. [Google Scholar] [CrossRef]
- Planchon, T.A.; Ferré, S.; Hamoniaux, G.; Chériaux, G.; Chambaret, J.-P. Experimental evidence of 25-fs laser pulse distortion in singlet beam expanders. Opt. Lett. 2004, 29, 2300–2302. [Google Scholar] [CrossRef]
- Ameer-Beg, S.; Langley, A.; Ross, I.; Shaikh, W.; Taday, P. An achromatic lens for focusing femtosecond pulses: Direct measurement of femtosecond pulse front distortion using a second-order autocorrelation technique. Opt. Commun. 1996, 122, 99–104. [Google Scholar] [CrossRef]
- Miranda, M.; Kotur, M.; Rudawski, P.; Guo, C.; Harth, A.; L’Huillier, A.; Arnold, C.L. Spatiotemporal characterization of ultrashort laser pulses using spatially resolved Fourier transform spectrometry. Opt. Lett. 2014, 39, 5142–5145. [Google Scholar] [CrossRef] [PubMed]
- Netz, R.; Feurer, T.; Wolleschensky, R.; Sauerbrey, R. Measurement of the pulse-front distortion in high-numerical-aperture optics. Appl. Phys. B 2000, 70, 833–837. [Google Scholar] [CrossRef]
- Wu, F.; Xu, Y.; Li, Z.; Li, W.; Lu, J.; Wang, C.; Li, Y.; Liu, Y.; Lu, X.; Peng, Y.; et al. A novel measurement scheme for the radial group delay of large-aperture ultra-short laser pulses. Opt. Commun. 2016, 367, 259–263. [Google Scholar] [CrossRef]
- Hariton, V.; João, C.P.; Pires, H.; Galletti, M.; Figueira, G. Thermal lens analysis in a diode-pumped 10 Hz 100 mJ Yb:YAG amplifier. High. Power Laser Sci. Eng. 2020, 8, e13. [Google Scholar] [CrossRef]
- Wu, F.; Yu, L.; Lu, J.; Li, W.; Xu, Y.; Leng, Y. Suppression of thermal lens effect in high-pulse-energy Ti:sapphire amplifiers. Opt. Laser Technol. 2017, 87, 94–98. [Google Scholar] [CrossRef]
- Xu, Y.; Lu, J.; Li, W.; Wu, F.; Li, Y.; Wang, C.; Li, Z.; Lu, X.; Liu, Y.; Leng, Y.; et al. A Stable 200TW/1Hz Ti:sapphire laser for driving full coherent XFEL. Opt. Laser Technol. 2016, 79, 141–145. [Google Scholar] [CrossRef]
- Liu, F.; Liu, X.L.; Wang, Z.H.; Ma, J.L.; Zhang, L.; Wang, J.; Wang, S.; Lin, X.X.; Li, Y.T.; Chen, L.M.; et al. Compression grating alignment by far-field monitoring. Appl. Phys. B 2010, 101, 587–591. [Google Scholar] [CrossRef]
- Cui, Z.; Kang, J.; Guo, A.; Zhu, H.; Yang, Q.; Zhu, P.; Sun, M.; Gao, Q.; Liu, D.; Ouyang, X.; et al. Dynamic chromatic aberration pre-compensation scheme for ultrashort petawatt laser systems. Opt. Express 2019, 27, 16812–16822. [Google Scholar] [CrossRef]
Publisher’s Note: MDPI stays neutral with regard to jurisdictional claims in published maps and institutional affiliations. |
© 2020 by the authors. Licensee MDPI, Basel, Switzerland. This article is an open access article distributed under the terms and conditions of the Creative Commons Attribution (CC BY) license (http://creativecommons.org/licenses/by/4.0/).