Article

Pores Evolution of Soft Clay under Loading/Unloading Process

School of Naval Architecture, Ocean and Civil Engineering, Shanghai Jiao Tong University, Shanghai 200240, China
*
Author to whom correspondence should be addressed.
Appl. Sci. 2020, 10(23), 8468; https://doi.org/10.3390/app10238468
Submission received: 13 October 2020 / Revised: 14 November 2020 / Accepted: 19 November 2020 / Published: 27 November 2020
(This article belongs to the Section Civil Engineering)

Abstract

:
Loading/unloading tests and field emission scanning electron microscope (FESEM) tests were performed on undisturbed soft clay specimens to study the pore evolution under the loading/unloading process. The results showed that small pores (<0.2 μm) had intrinsic characteristics, and the distribution and the fragmentation fractal dimension of small pores were basically unchanged with pressure, while large pores (>0.6 μm) changed greatly under loading/unloading. The pore-size distribution was mainly influenced by large pores. The microstructure of soft clay before unloading has an influence on the change of the swelling index ( C s ) and the pores evolution under unloading. C s increased as the surface fractal dimension of the pores and the area of large pores decreased, and the fragmentation fractal dimension of the pores increased under the loading process. The variations in fractal dimensions and large pore area increased under unloading. Moreover, the compression index ( C c ) changed nonlinearly with the pore evolution under loading. Below 100 kPa, C c increased slightly with a small increase of the fractal dimensions and large pores area under loading. From 100 kPa to 400 kPa, C c increased to a peak value of 0.484, and the fractal dimensions and large pore area were the greatest under loading. Above 400 kPa, all of them changed slowly. Based on the evolution of pore fractal characteristics, the loading/unloading process could be divided into three stages: the natural structural stage, the structural adjustment stage, and the new equilibrium stage, which was important to study the loading/unloading properties of soft clay.

1. Introduction

Soft clays are widely distributed, with low strength, high sensitivity, and high compressibility [1,2]. Due to the rapid development of urbanization and the increase of population, it is inevitable to carry out a significant number of foundation pit engineering projects, including preloading treatments, and the excavation of foundations. The loading/unloading process may produce large deformation of soil, leading to safety problems.
The loading/unloading process was analyzed quantitatively by the finite element method [3] and constant rate of strain tests [4], showing that soil characteristics under the loading/unloading process behave elastically. The loading/unloading test can be exerted by an oedometer or apparatus to obtain the void ratio–stress curves with loading and unloading loops, which reflect the change of macroscopic mechanical properties of soil. Macro parameters like the compression and swelling indices of soil can be collected [5], reflecting the change of soil structural properties. Moreover, the loading/unloading process is controlled by the microstructure, which provides another method for studying the mechanical properties of clay [6].
SEM tests [7] are widely used, and is has been validated that the analysis of two-dimensional SEM images is consistent with the results from mercury injection tests [8,9] and CT scanning technology [10], to study the microstructure evolution of soil [11,12]. The characteristics of pore shapes [13], sizes [14], and distribution [15] can be obtained from microscopic tests, reflecting the change of soil pores under the loading/unloading process. Research shows that the morphology and size distribution of pores have a strong influence on the microstructure of soft clay in Shanghai [16], and the pore sizes reduce as the plasticity increases [17]. Previous studies have indicated that the soil microstructure is closely related to the macroscopic mechanical properties of soil [18,19], where the mechanical properties of soil under consolidation or swelling are changed by the adjustment and evolution of soil microstructure [20]. It is necessary to study the relationship between microscopic parameters and macro-mechanical properties under the loading/unloading process.
The research objective was to study the evolution of pores under the loading/unloading process and to reveal the relationship between macro and micro properties, including the pore-size distribution and the fractal dimension characteristics of pores.

2. Experimental Program

2.1. Soil Sample

The soft clay samples were from the fourth soil layer, at 9–11 m depth, taken from the Pu Dong New Area of Shanghai. According to the Chinese standard [21], the physical properties of Shanghai soft soil were obtained by laboratory geotechnical tests. The results are shown in Table 1. The soft clay of the fourth layer in Shanghai is grayish-black in a soft-plastic state, characterized by high moisture content, high void ratio, and high compressibility. The main components of the soft clay are quartz and feldspar [22].

2.2. Experimental Method

Oedometers were used to perform the loading/unloading tests, in which the loading process can reflect the consolidation characteristics, and the unloading process can reveal the swelling characteristics. The soil specimens were cylinders of 61.8 mm in diameter and 20 mm in height. The step method, regulated in the Standard for Soil Test Methods [21], was used, in which the first step load was 12.5 kPa, and the loading/unloading rate was 1 (shown in Table 2). The range of pressures was from 0 kPa to 1600 kPa, determined by the high-pressure situation of soft clay in practical engineering. Each loading/unloading step was applied for 24 h. Three parallel experiments were carried out for each case.
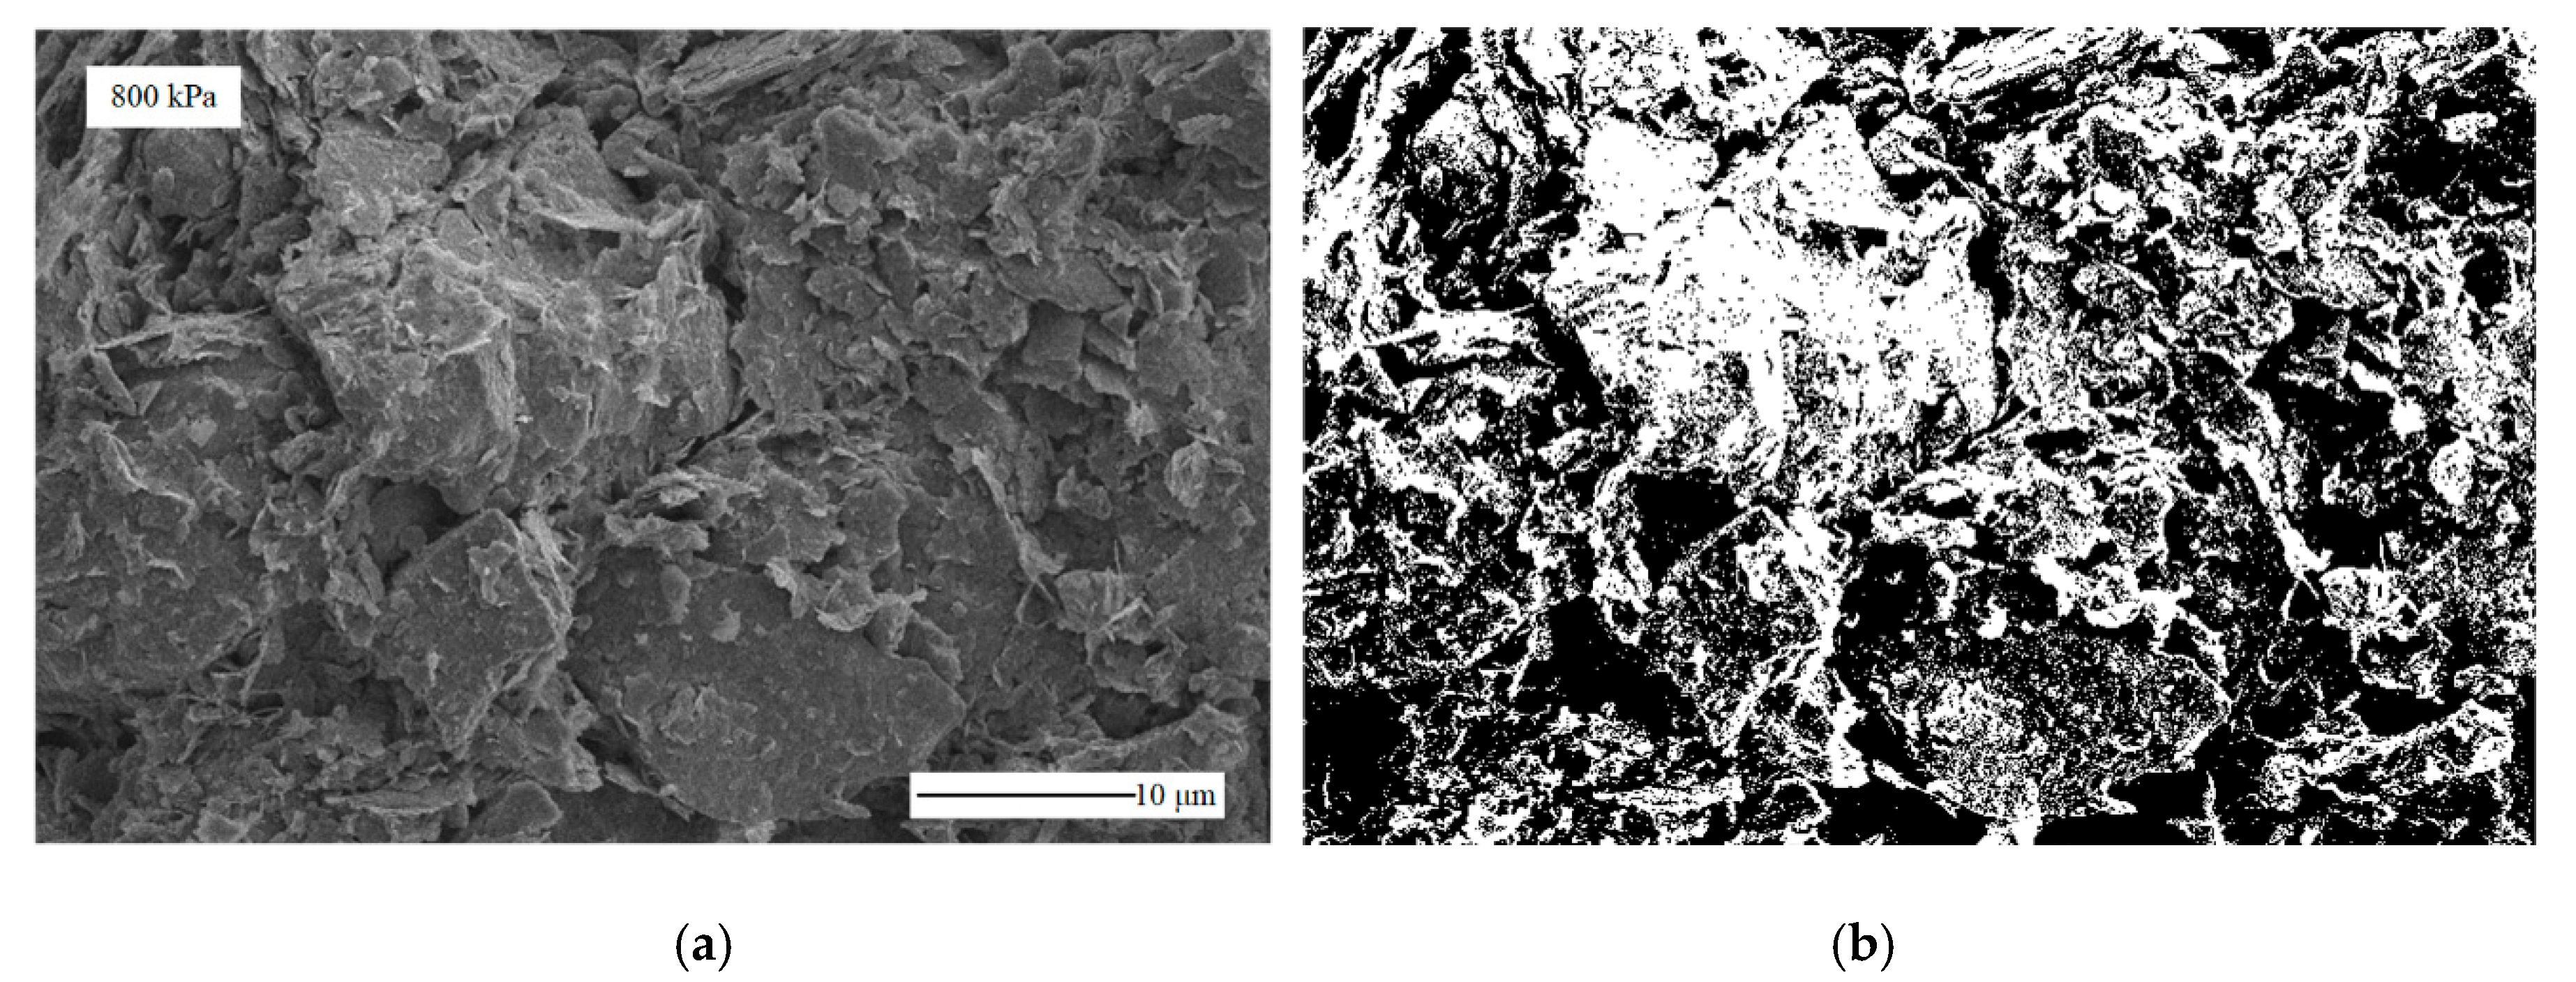
The step load of the FESEM scanning is shown in Figure 1. The FESEM images of the specimens at the end of each loading process were numbered L i   ( i = 1 , 2 , 3 , 4 , 5 , 6 ) , and at the end of each unloading process were numbered U i   ( i = 1 , 2 , 3 , 4 , 5 , 6 ) . Soil samples were cut into 5 mm × 3 mm × 2 mm slices after immediate demolding at the end of each loading/unloading step, and subsequently freeze-dried in a lyophilizer for 24 h. The samples were then forced apart to observe the fracture surface by a secondary electron detector for FESEM, manufactured by Tescan Mira3 in the Czech Republic. Image-Pro Plus software was used for digital analysis. The 256-level greyscale images were converted into binary images by the threshold segmentation method, and the threshold was 80–110, determined by the combination of the Ostu and visual method [23]. Pores were shown in black, and were clearly distinguished from soil particles, in white, after segmentation, as seen in Figure 2. Image pixels were taken as the unit in Image-Pro Plus, which measures the image space according to the number and position of pixels. Then black parts were selected as the measurement objects, the diameter, perimeter, area, and roundness could be selected among the geometric and morphological parameters provided by Image-Pro Plus [24,25,26].
Previous studies have shown that a wide range of materials in the soil have self-similarity characteristics [27]. Fractal dimension theory was used in the analysis of pore-size distribution and shape complexity. The surface fractal dimension, D s [28], and the fragmentation fractal dimension, D f , [27,29,30] were introduced, and the expressions were as follows:
l n L = D s 2 l n A + C 1
l n N ( d ) = D f l n d + C 2
where L is the perimeter of soil pore, d is the diameter of the pore, A is the area of the pore, which were converted from the pixels of a closed graph to the perimeter based on the setting scale in the software. N ( d ) is the number of the pores whose diameter was larger than d , and C 1 and C 2 are constants calculated by expressions (1) and (2). The FESEM images with 50,000 times and 5000 times magnification were used to analyze the surface and fragmentation fractal dimension of the pores, respectively. D s reflects the geometric complexity of the pore shapes. The larger the D s , the higher the geometric complexity of pore shapes. The value of D f is related to the size difference of pores. The larger the D f , the smaller the size difference of the pores.

3. Experimental Results

3.1. The Compression and Swelling Indices

Curves of the void ratio (e) and the step load (p) under each loading/unloading process of the soil samples are shown in Figure 3. The value of e was obtained by the expression as follows [21]:
e i = e 0 1 + e 0 h 0 Δ h i
where e 0 is the initial porosity ratio, h 0 is the initial height of the soil sample, Δ h i is the cumulative deformation of the soil sample under each loading process.
Each curve showed a change of e when the specimens were loaded to a certain load and then unloaded to 0 kPa. The pre-consolidation pressure of soft clay was 88 kPa, by the Casagrand method, and the result agreed with the previous studies [31]. The slope of the unloading process at each step load was much smaller than that of the loading process, showing that the compression of soft clay cannot be fully swelled. The compression index, C c , and the swelling index, C s , are the critical parameters in the loading and unloading processes. C c is defined as the slope of the linear part of the e-logp curve in the loading process, and C s in the unloading process. C c reveals the compressibility of soil, and C s reveals the swelling property of soil [32]. The compression and swelling indices are shown in Figure 4.
The C c of soft clay increased to the peak value of 0.494 at 400 kPa, and then gradually decreased to 0.403 at 1600 kPa. The compressibility of soft clay reached the maximum of 400 kPa. During the unloading process, the C s of soft clay increased to a highest value of 0.097 at 400 kPa, and then changed from 0.097 to 0.082, revealing that the swelling property was enlarged as the step load of unloading increased to 400 kPa and then changed to a small degree.
The results show that C c and C s changed nonlinearly with step load. Both of them increased to a peak at 400 kPa, and changed at a slower rate above 400 kPa, indicating that the compressibility and the swelling property of soft clay increased until 400 kPa. The analysis of C c and C s was not sufficient for the investigation of the pore evolution, and the microscopic analysis is discussed in the following context.

3.2. FESEM Images and Pore Size Distribution

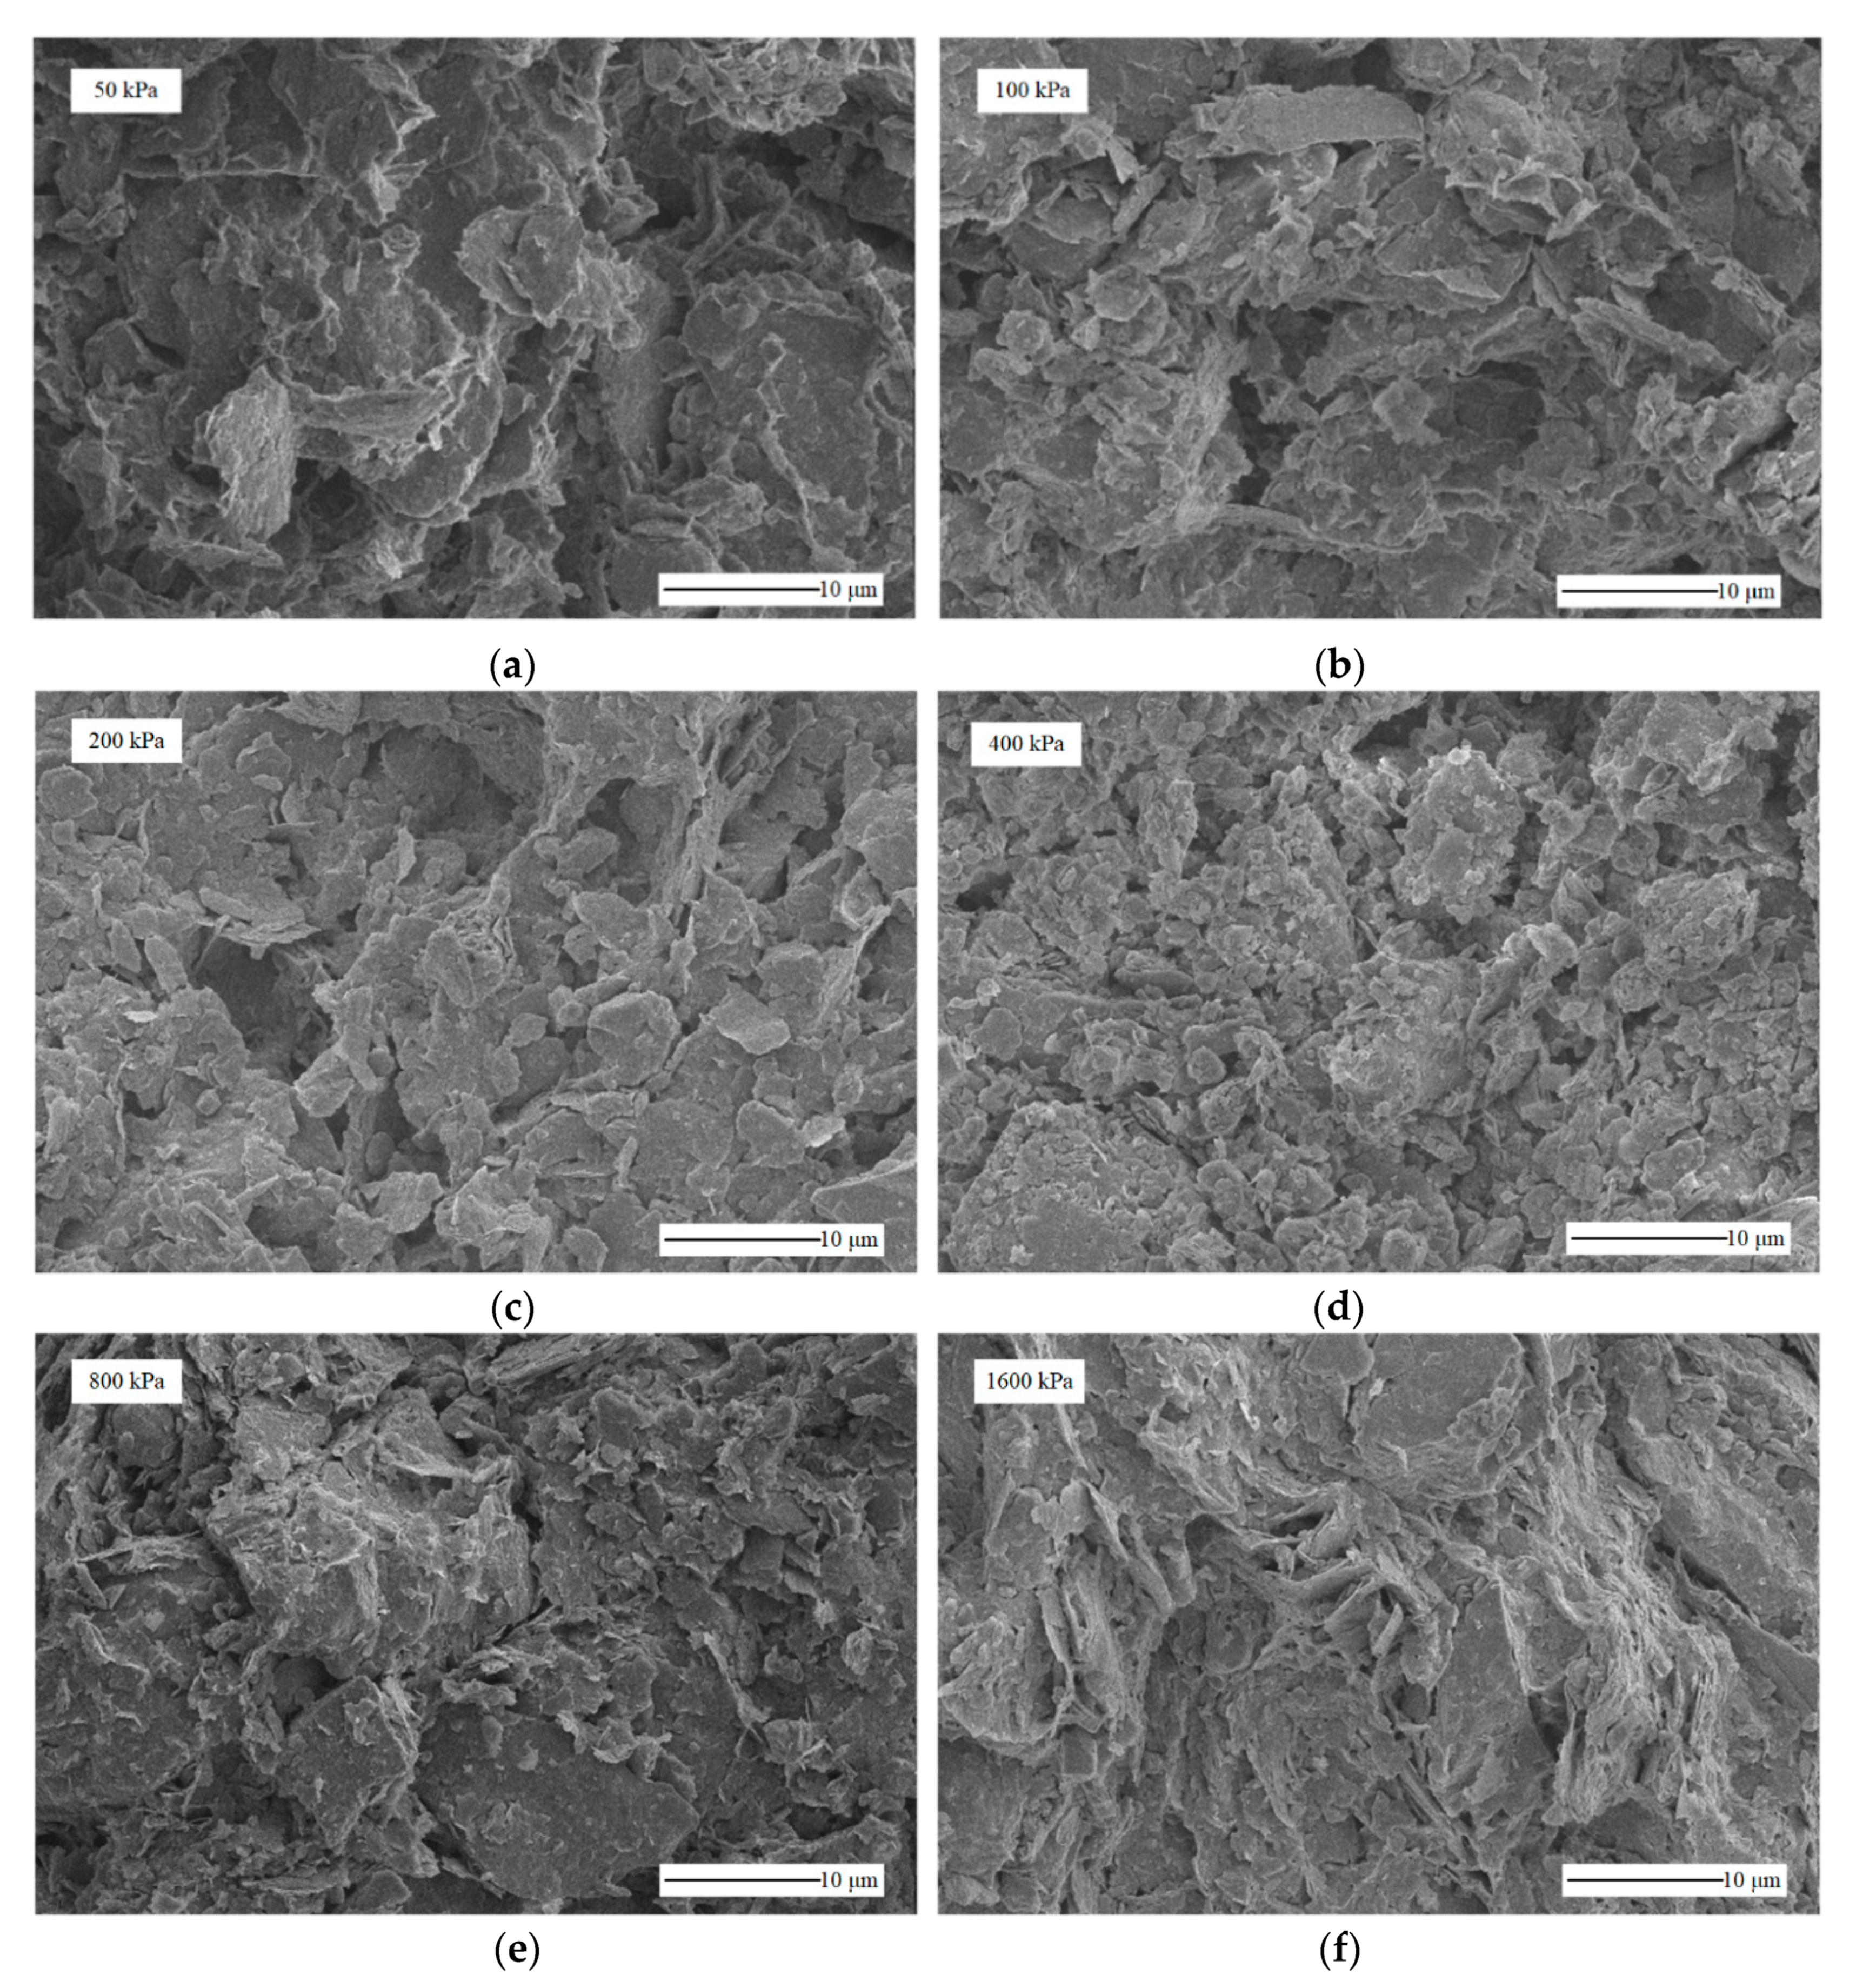
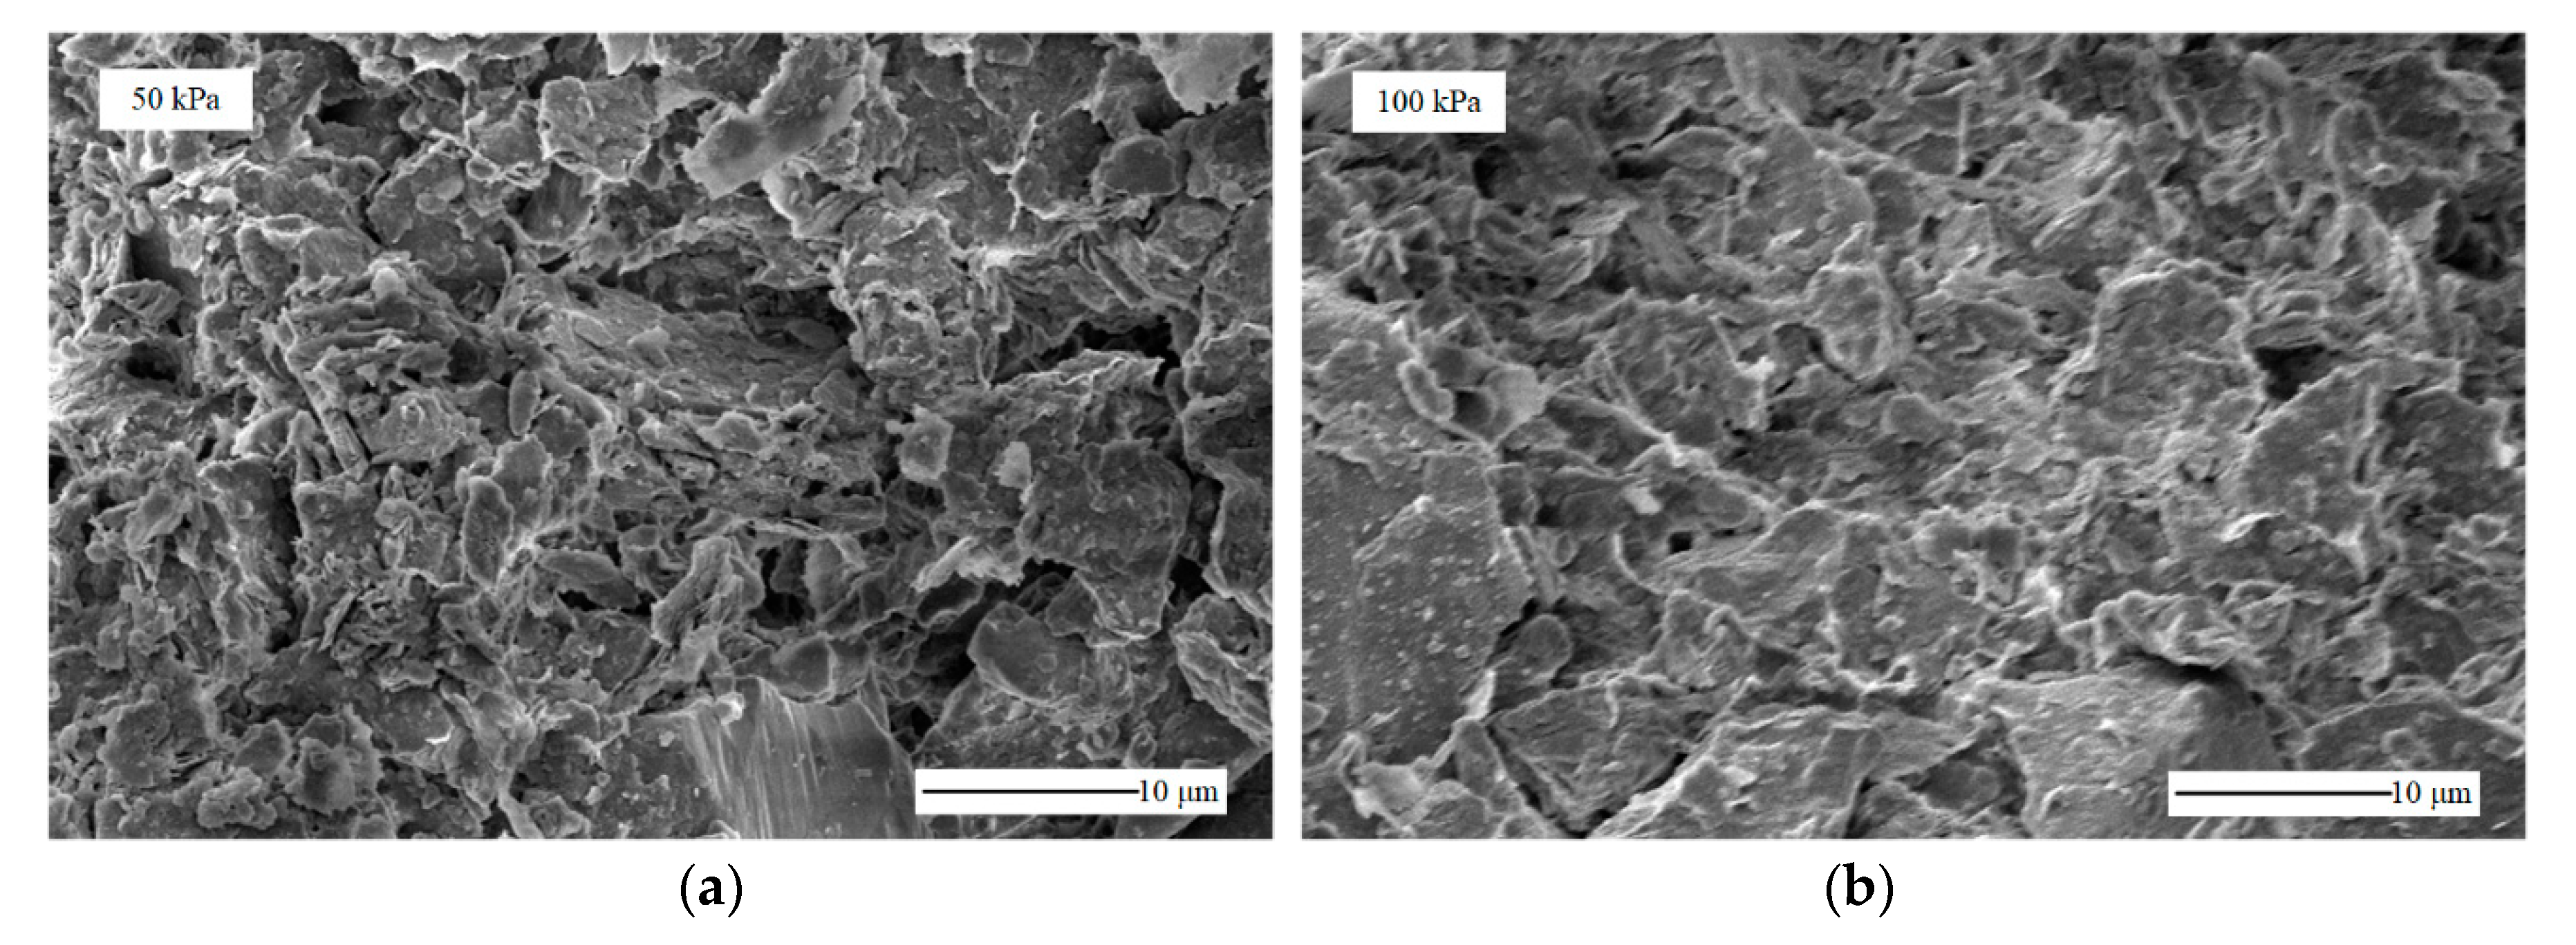
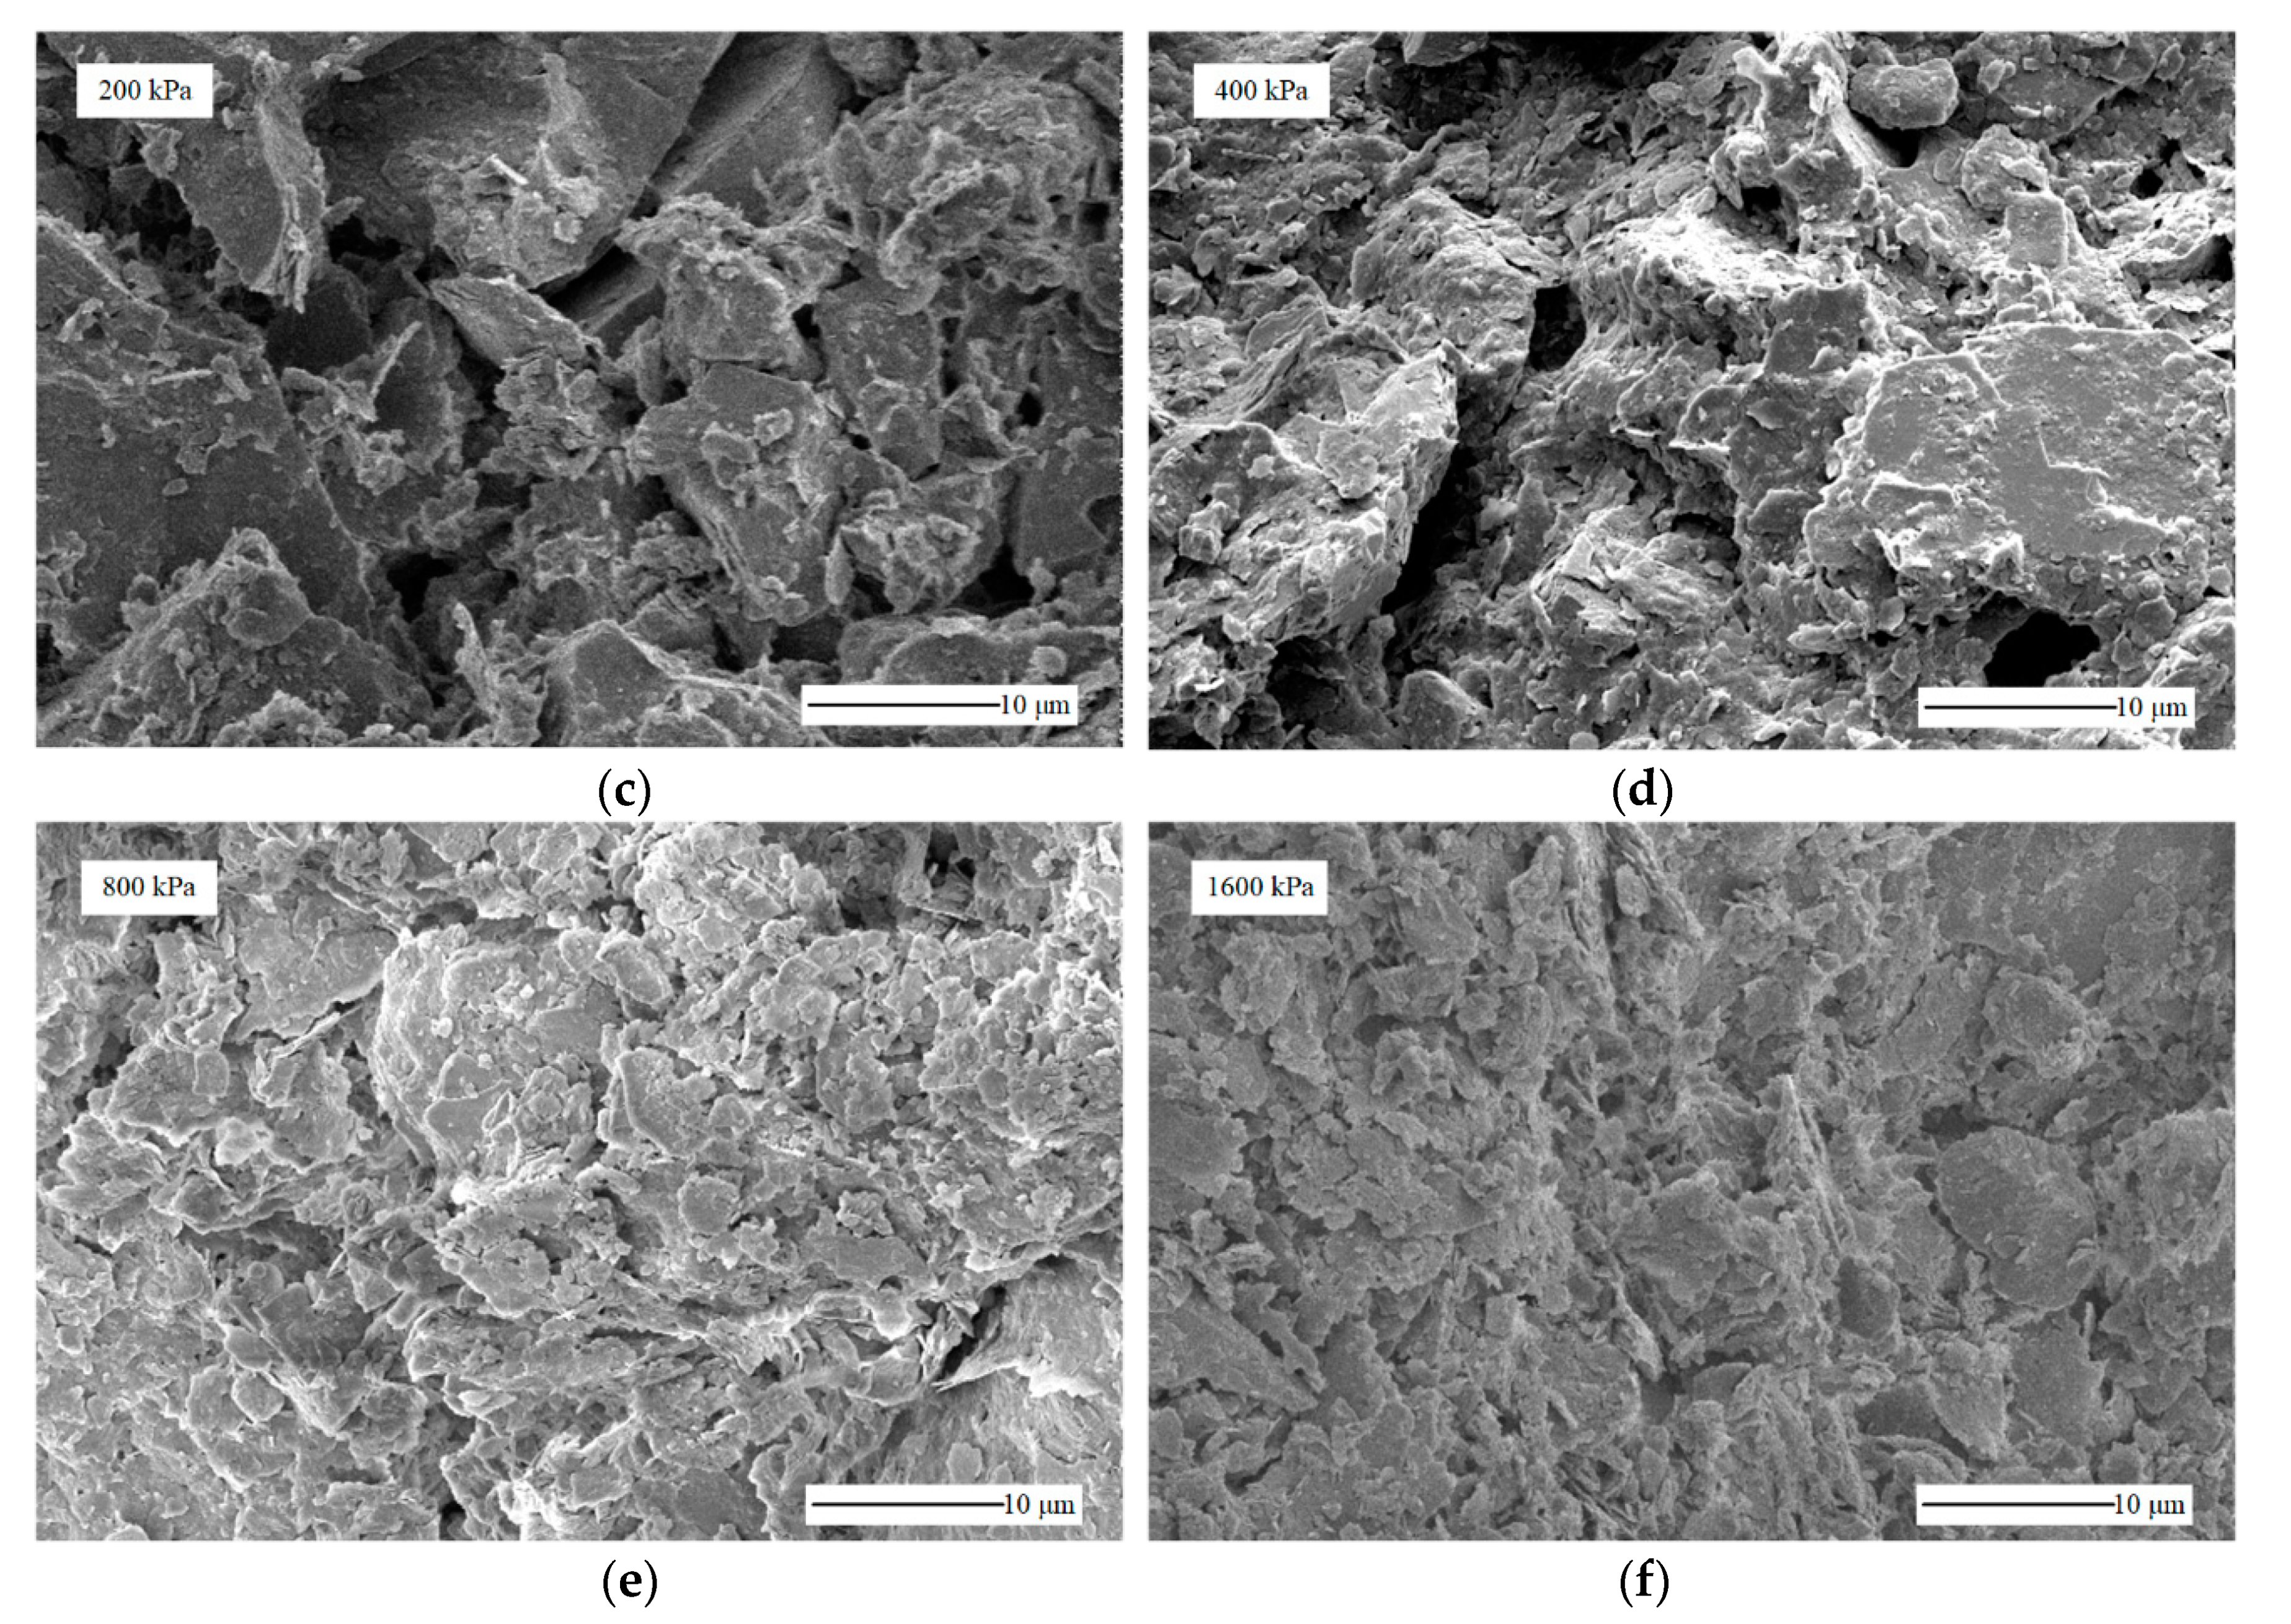
FESEM images are shown in Figure 5 and Figure 6. When the loading pressure was lower than 100 kPa, the microstructure of the soft clay had a flocculent structure. The interaction between soil particles was characterized by face-to-face connection, while the shapes of the pores, between or inside the soil particles, were complicated. However, the microstructure of soft clay turned into a looser flocculent structure under the unloading process. The interaction between soil particles was displayed by face-to-face and face-to-edge types. The area of the large pores decreased, and the shapes of the pores became complicated. When the load ranged from 200 kPa to 400 kPa, soil particles broke into small aggregates. Large pores were collapsed into smaller ones, and were filled with dispersed soil particles. While the loose soil particles were gathered into massive ones under the unloading process, and edge-to-edge and edge-to-point connection types appeared. Pores were connected to develop larger ones, and the boundaries of pores were more apparent than those under the loading process. The microstructure of clay underwent a significant change under the unloading process. At 800 kPa, the interaction between soil particles was represented by face-to-face and face-to-edge types. The loose soil particles were squeezed into massive soil particles, and the boundaries of pores were more apparent than those under loading process. When it was unloaded, the microstructure of the clay changed into a flocculent one, that was much denser than that under 50 kPa. When it was 1600 kPa, the massive soil particles were squeezed into a much denser condition, and formed into a layered state. The area of large pores decreased, and the shapes of the pores became complicated. However, a flocculent and honeycomb structure was developed under the unloading process. The boundaries of the pores became ambiguous again.
The observation of FESEM images shows that it was the trend that the smaller pores were developed as the pressure increased under the loading process, and the complexity of pores shapes decreased and then increased. Under the unloading process, the microstructure of the soft clay changed significantly, comparing each loading step. It was necessary to analyze the micro parameters to describe the change of the microstructure.
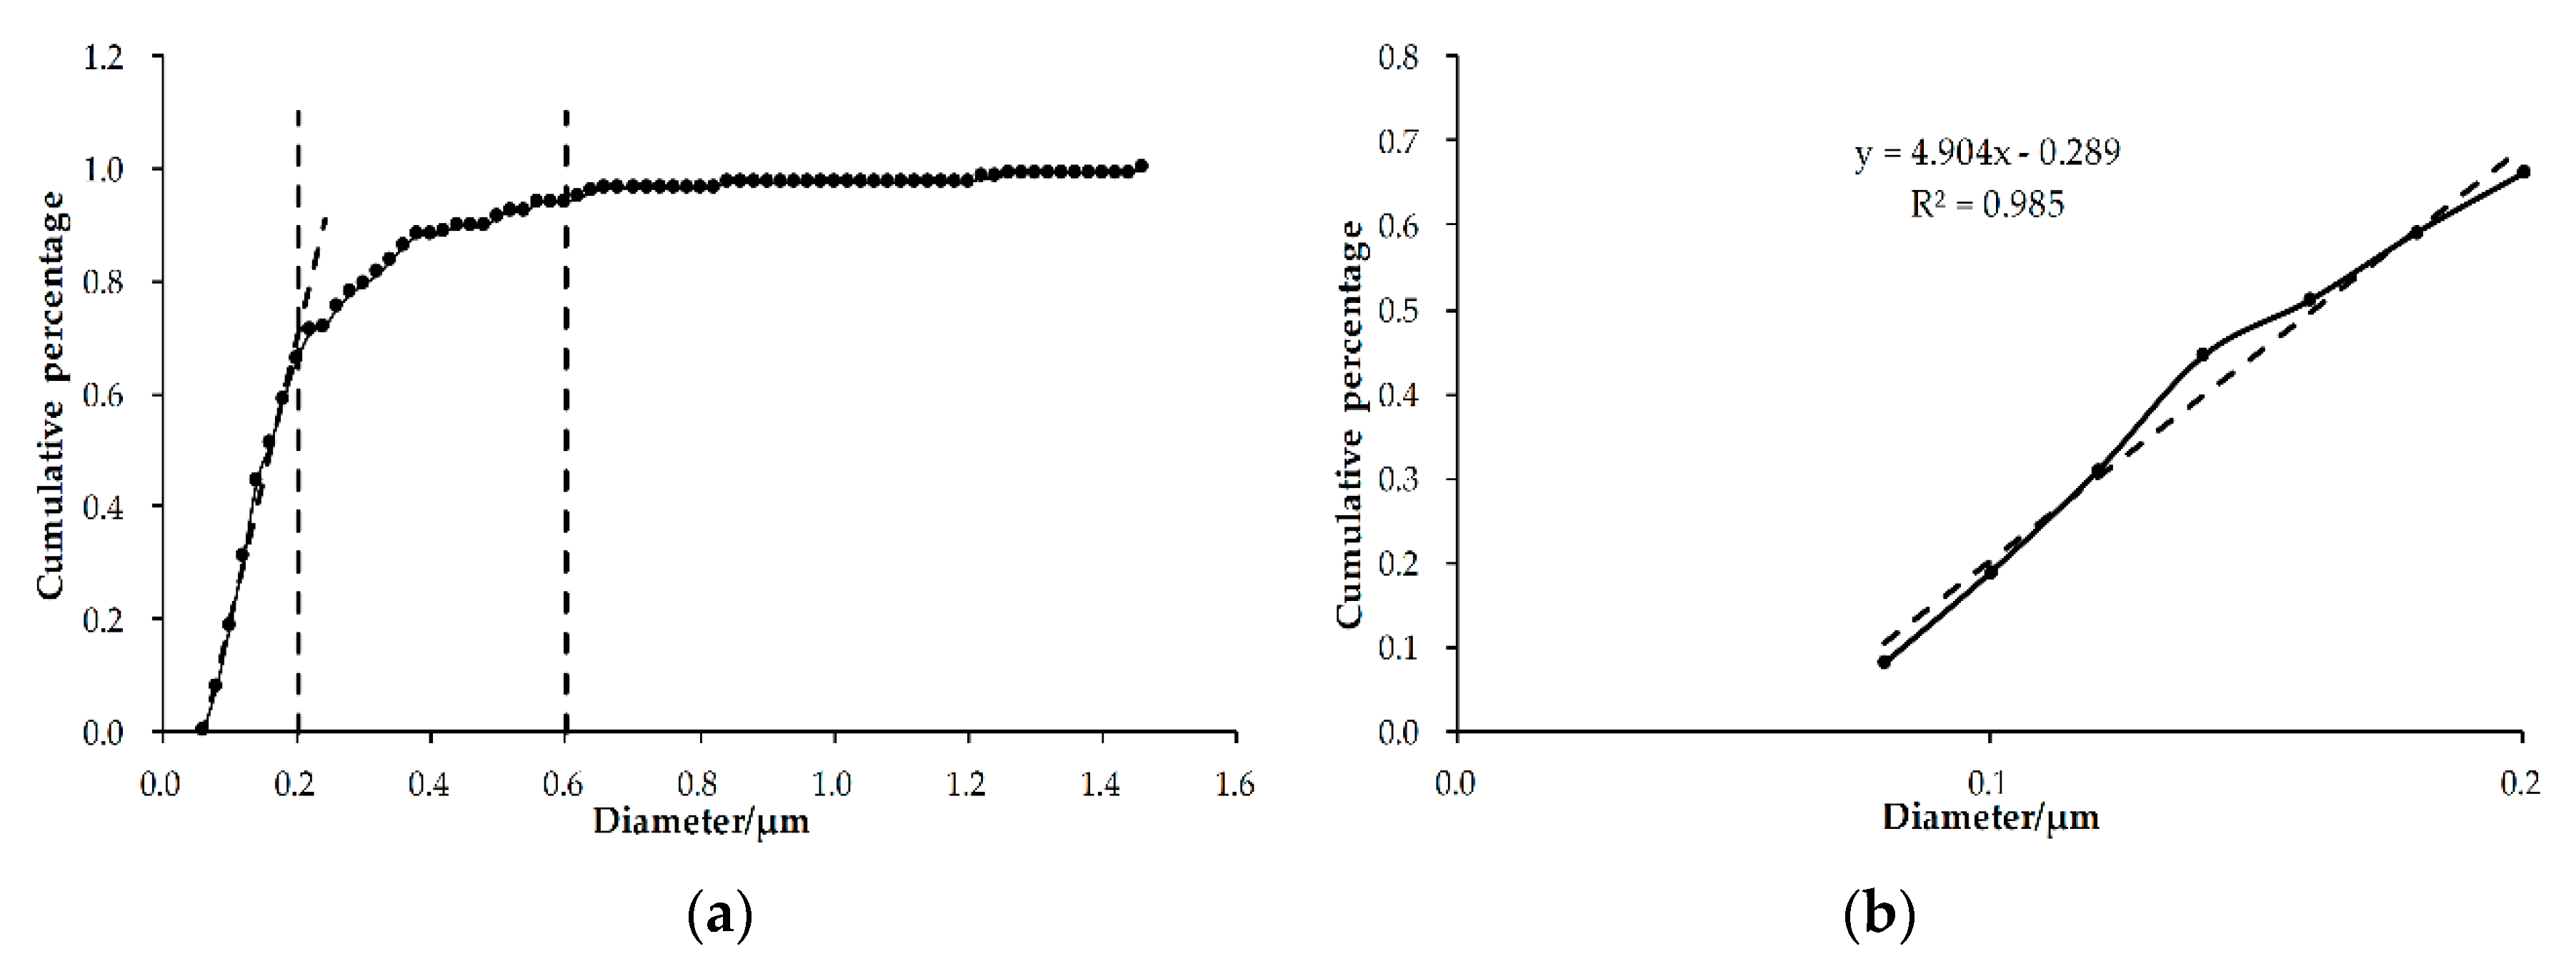
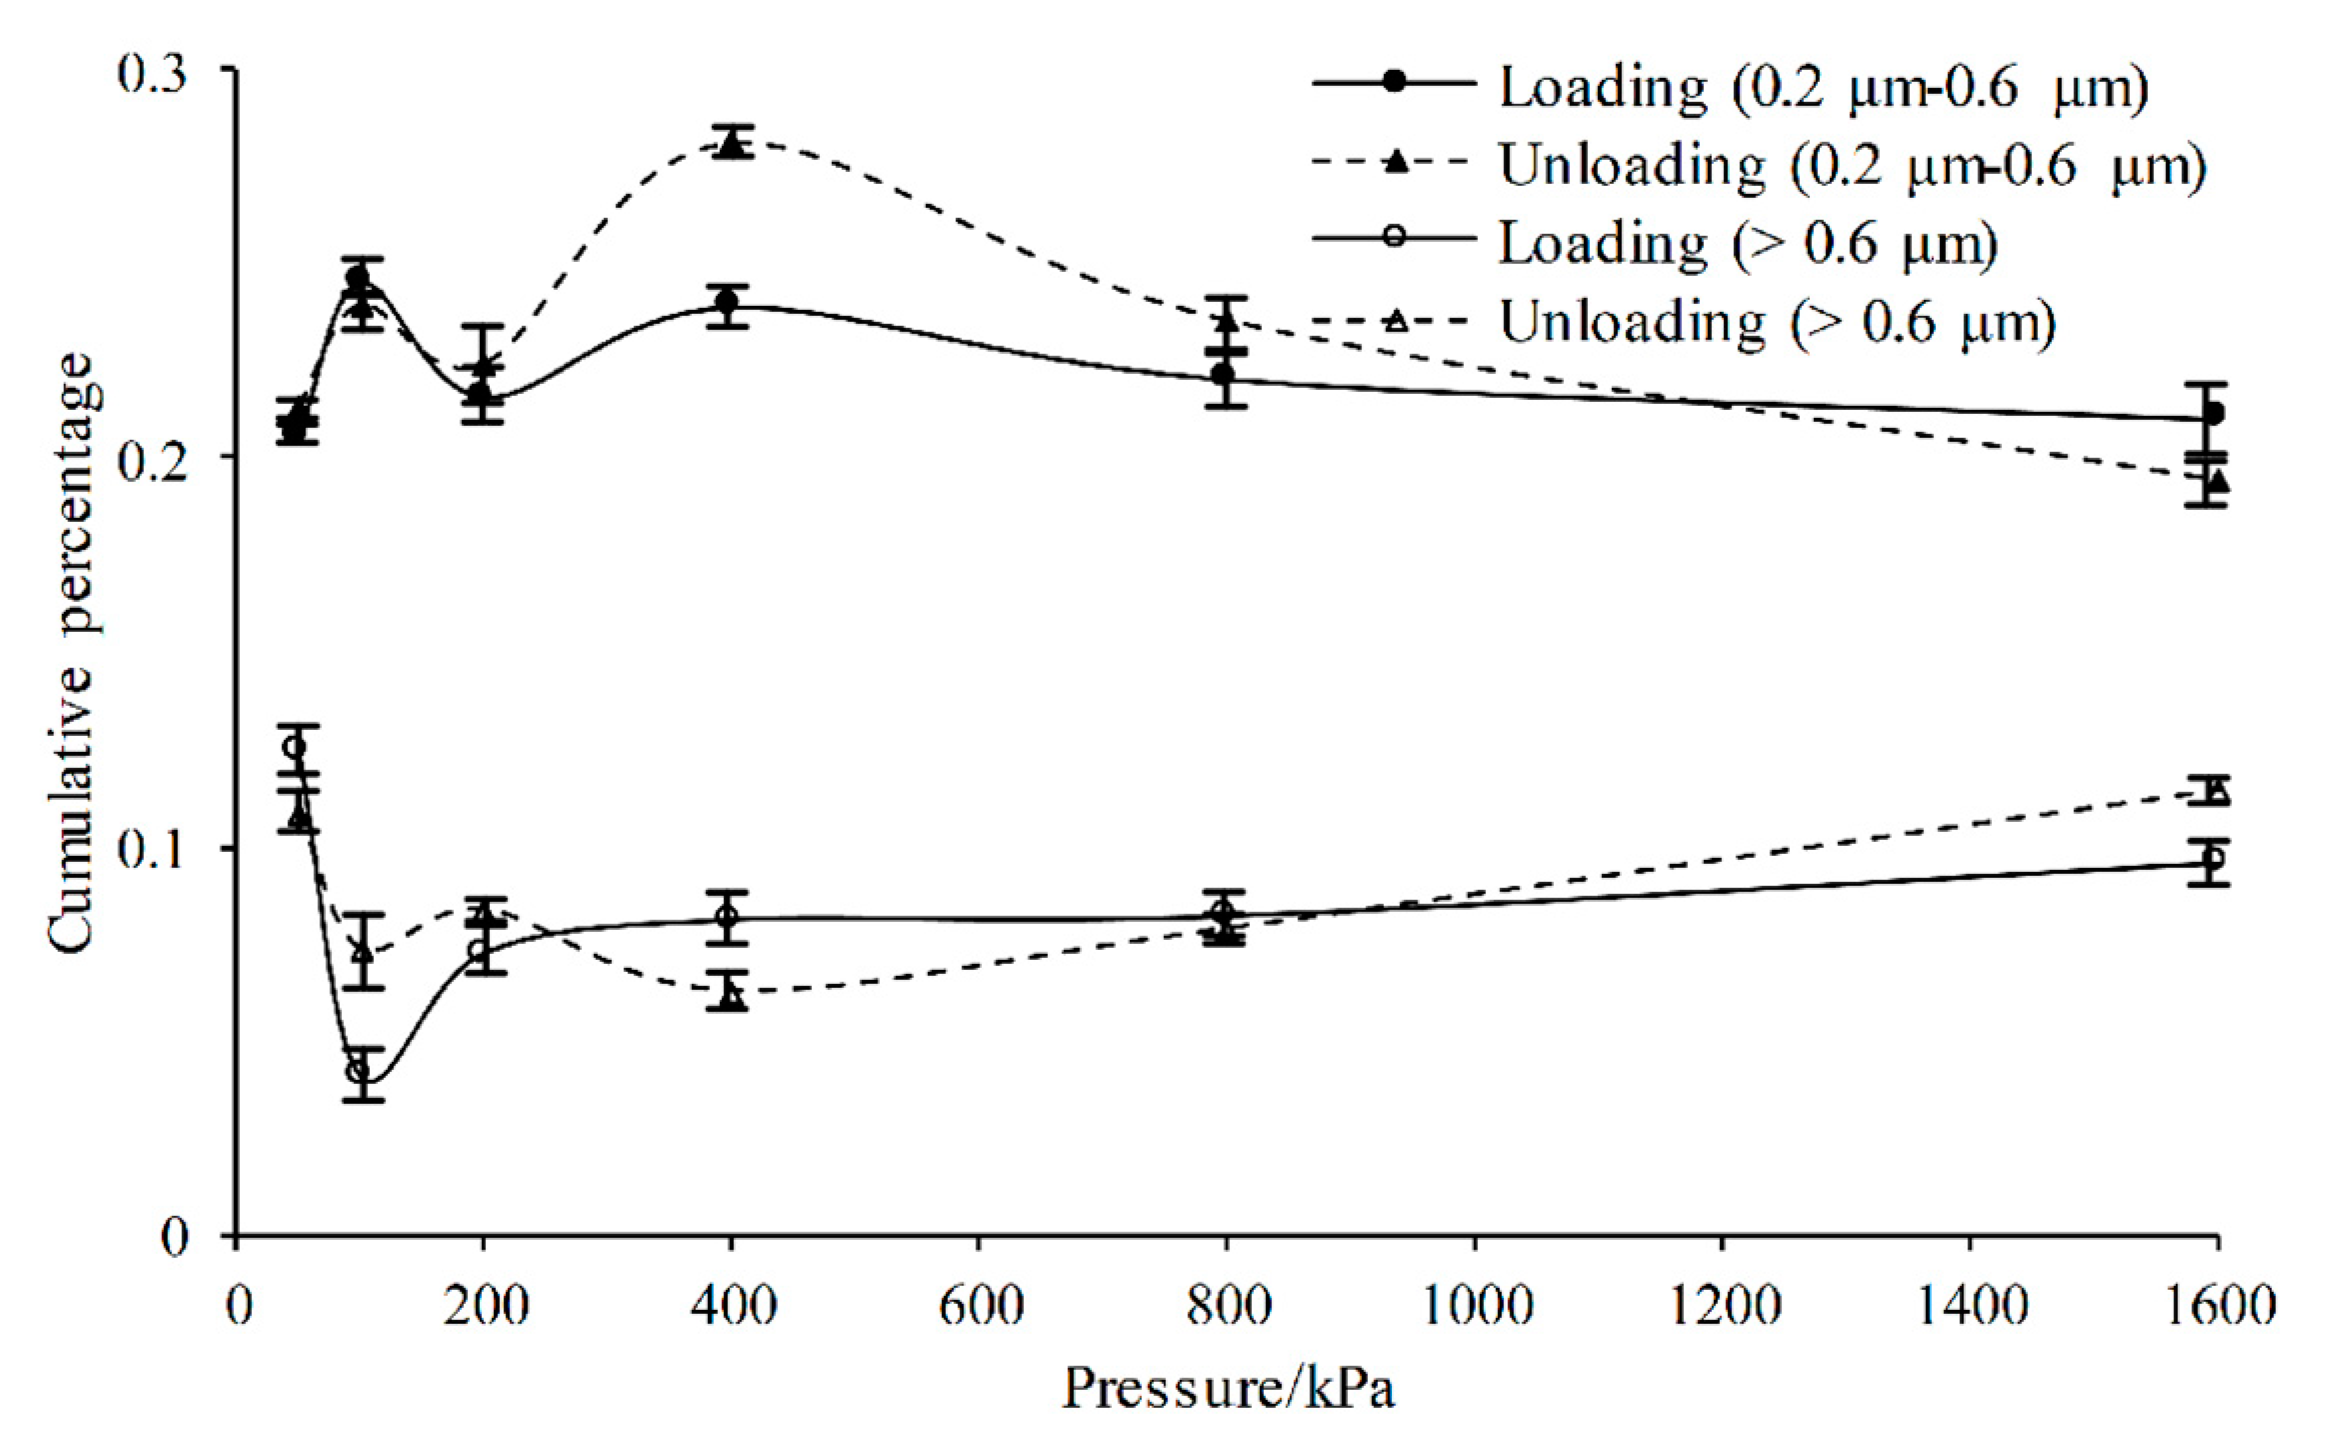
The method of obtaining the cumulative percentage of pore-size distribution is shown in Figure 7. The distribution of pores whose diameters were smaller than 0.2 μm or larger than 0.6 μm was linear to pore diameters. The change rate of the curves between 0.2 μm and 0.6 μm gradually slowed down. The diameters of 0.2 μm and 0.6 μm were regarded as the turning pore diameters. Pores smaller than 0.2 μm were defined as small pores, while pores ranged from 0.2 μm to 0.6 μm as medium ones, and bigger than 0.6 μm as large ones. The size distribution of small pores and the slope, k, of the fitting line below 0.2 μm are shown in Table 3, and was basically unchanged under the loading/unloading process. The correlation coefficient, R 2 , was above 0.950. The change trend of the medium and large pore-size distribution is shown in Figure 8.
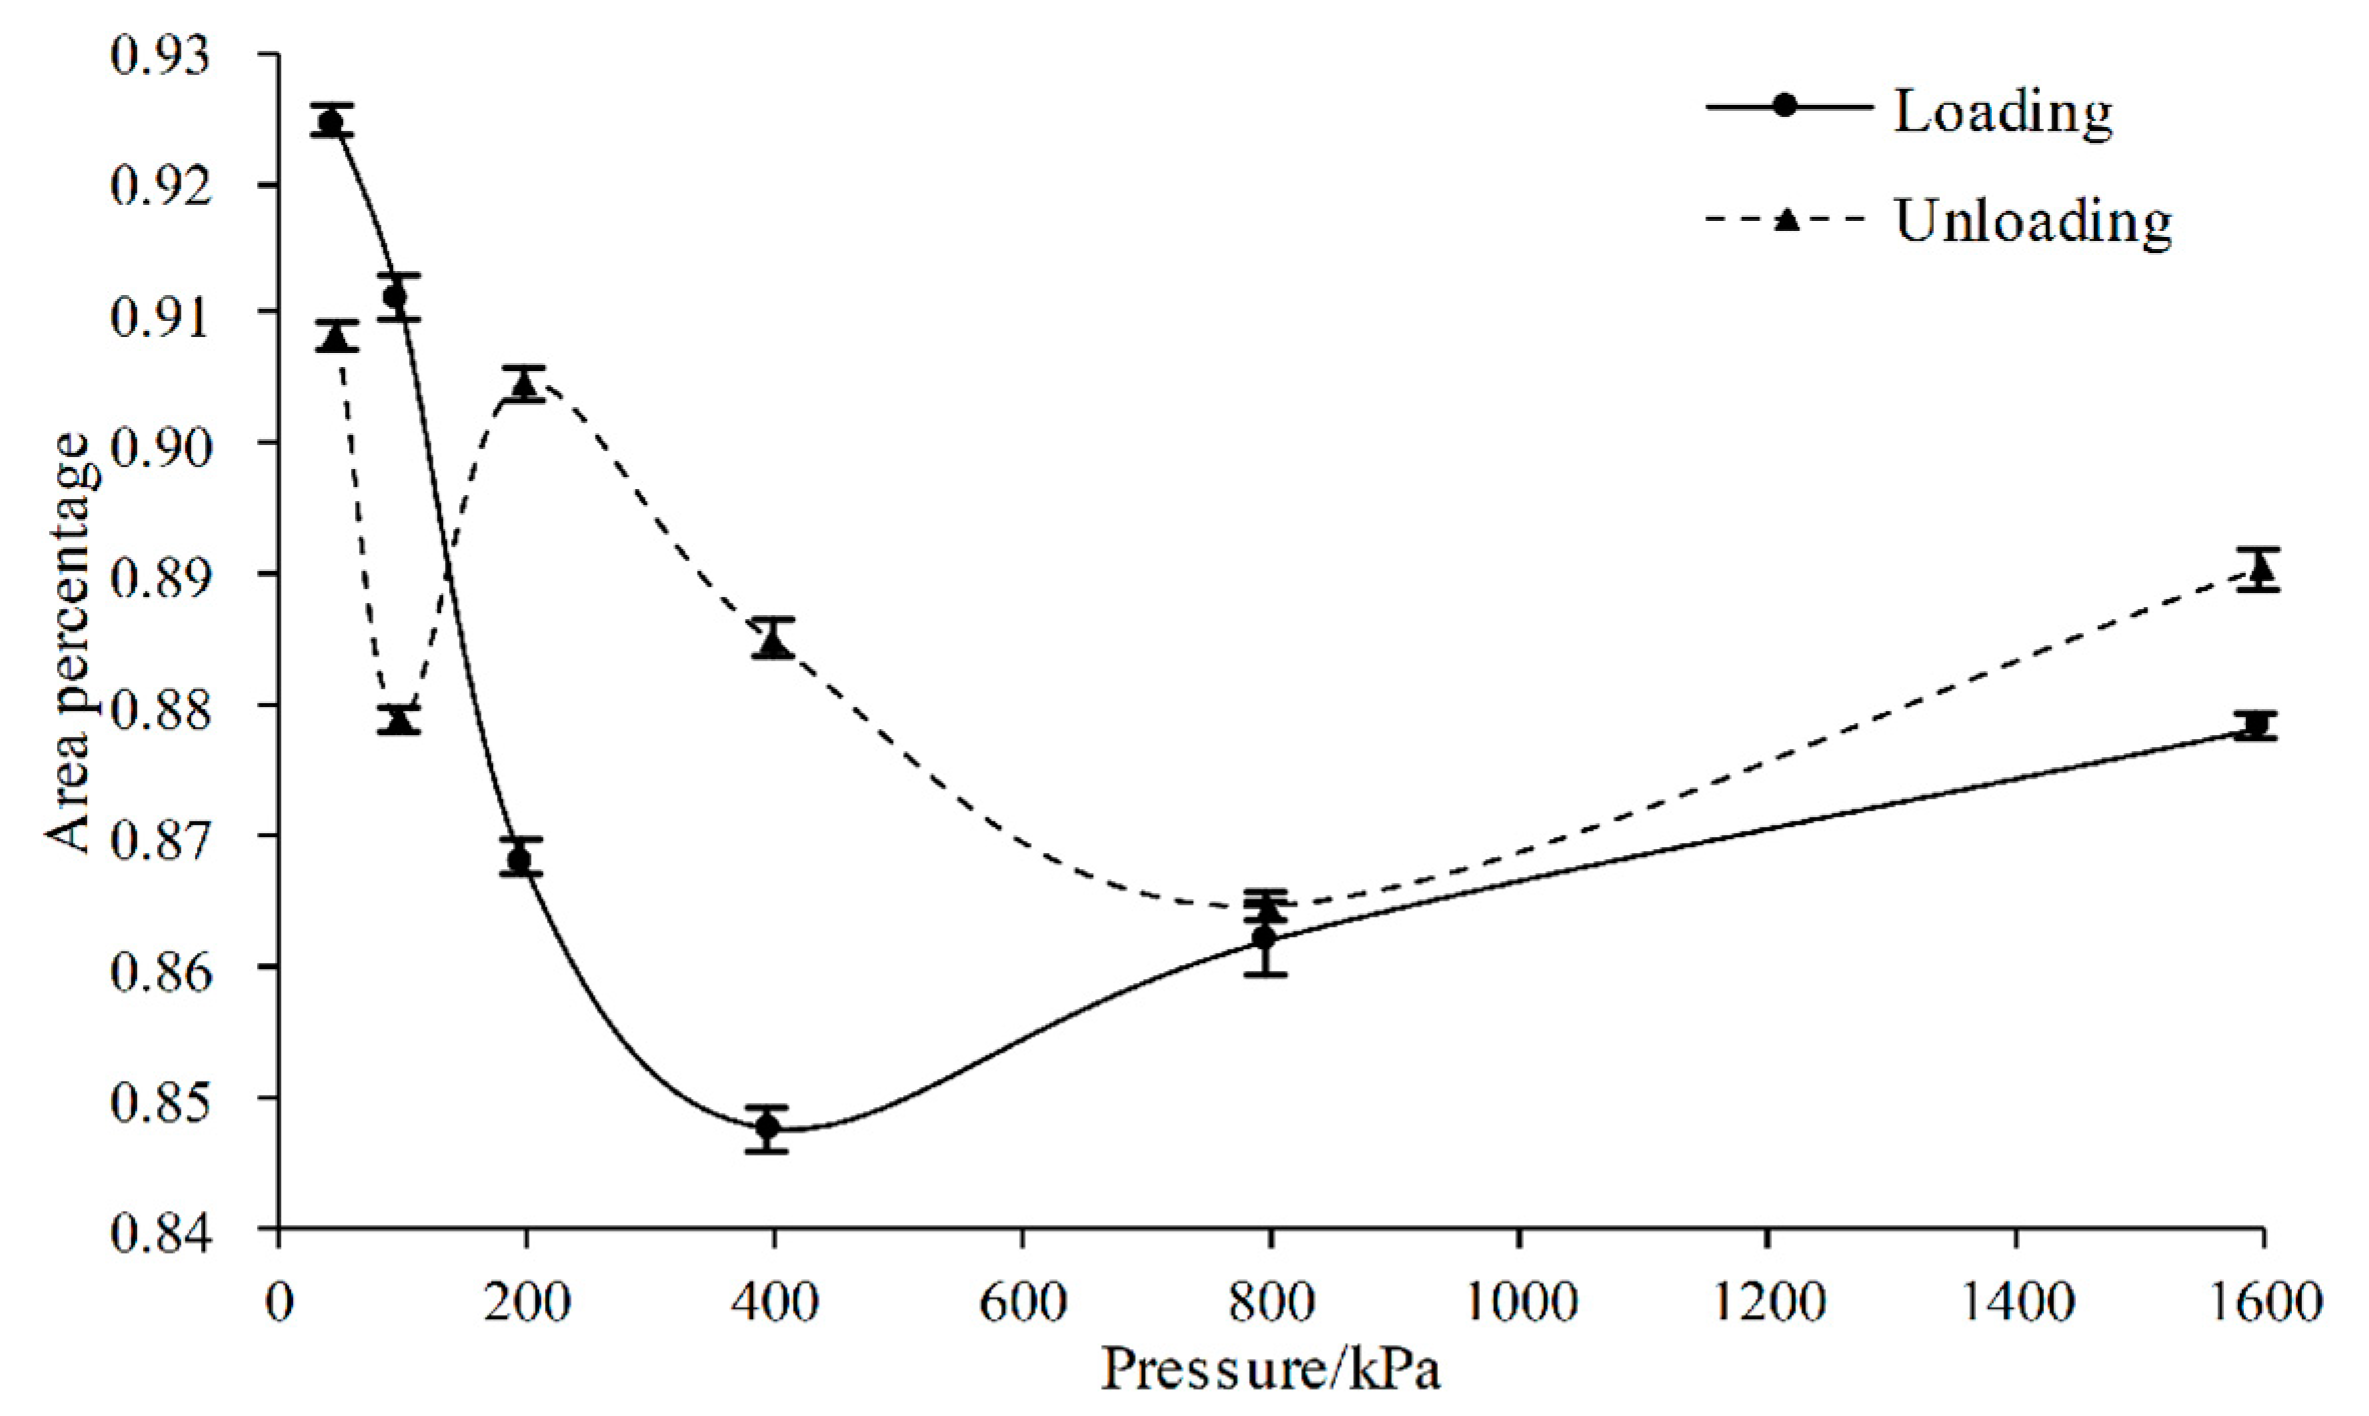
The percentage of large pores decreased to the minimum value of 4.082% at 100 kPa, and increased to 9.542% as the pressure increased to 1600 kPa under the loading process. However, the pore evolution analyzed by pore-size distribution contradicted the previous study [33], which showed that the percentage of large pores sharply decreased when the microstructure of soft clay rearranged. The distribution of pore-size did not reflect well the change of large pores. For example, when the even large pores is broken into several pores including pores bigger than 0.6 μm, the number of large pores increase, but the area might decrease. In this situation, the area percentages of pores would be used to calculate the distribution of large pores, as shown in Figure 9.
The area percentage of large pores underwent significant changes with pressure. Below 100 kPa, the microstructure was converted into the natural state, and the area percentage of large pores was high. As the pressure increased, the area percentage of large pores decreased to 91.087% under loading, while it decreased by 1.562% and 3.192% at 50 kPa and 100 kPa under unloading, respectively. From 100 kPa to 400 kPa, the area percentage of large pores sharply reduced to 84.771% under loading process, while it increased by 4.689 and 3.728 at 200 and 400 kPa under the unloading process, respectively. Above 400 kPa, the increase of area percentage of large pores slowed down. Under the loading process, the area percentage of large pores increased to 87.829%, while it increased slightly under the unloading process.
The distribution of small pores was basically unchanged, while that of large pores changed nonlinearly with pressure under the loading/unloading process. The pore-size distribution under loading/unloading was better analyzed by area percentage of large pores. The area percentage of large pores decreased to 84.771% until 400 kPa, and then increased under the loading process, while it decreased below 100 kPa, and then increased under each unloading process. However, further explanation is needed in combination with the following analysis.

3.3. Fractal Analysis

The surface and fragmentation fractal dimension of the pores of specimens L i and U i are expressed as D s L i , D s U i , D f L i , and D f U i , respectively, and the D f of small pores of specimens L i and U i as D f s L i and D f s U i . The change of fractal characteristics under each unloading process was reflected by the variations in fractal dimensions of specimens L i and U i , which were defined as Δ D s and Δ D f :
Δ D f = D f L i D f U i
Δ D s = D s L i D s U i
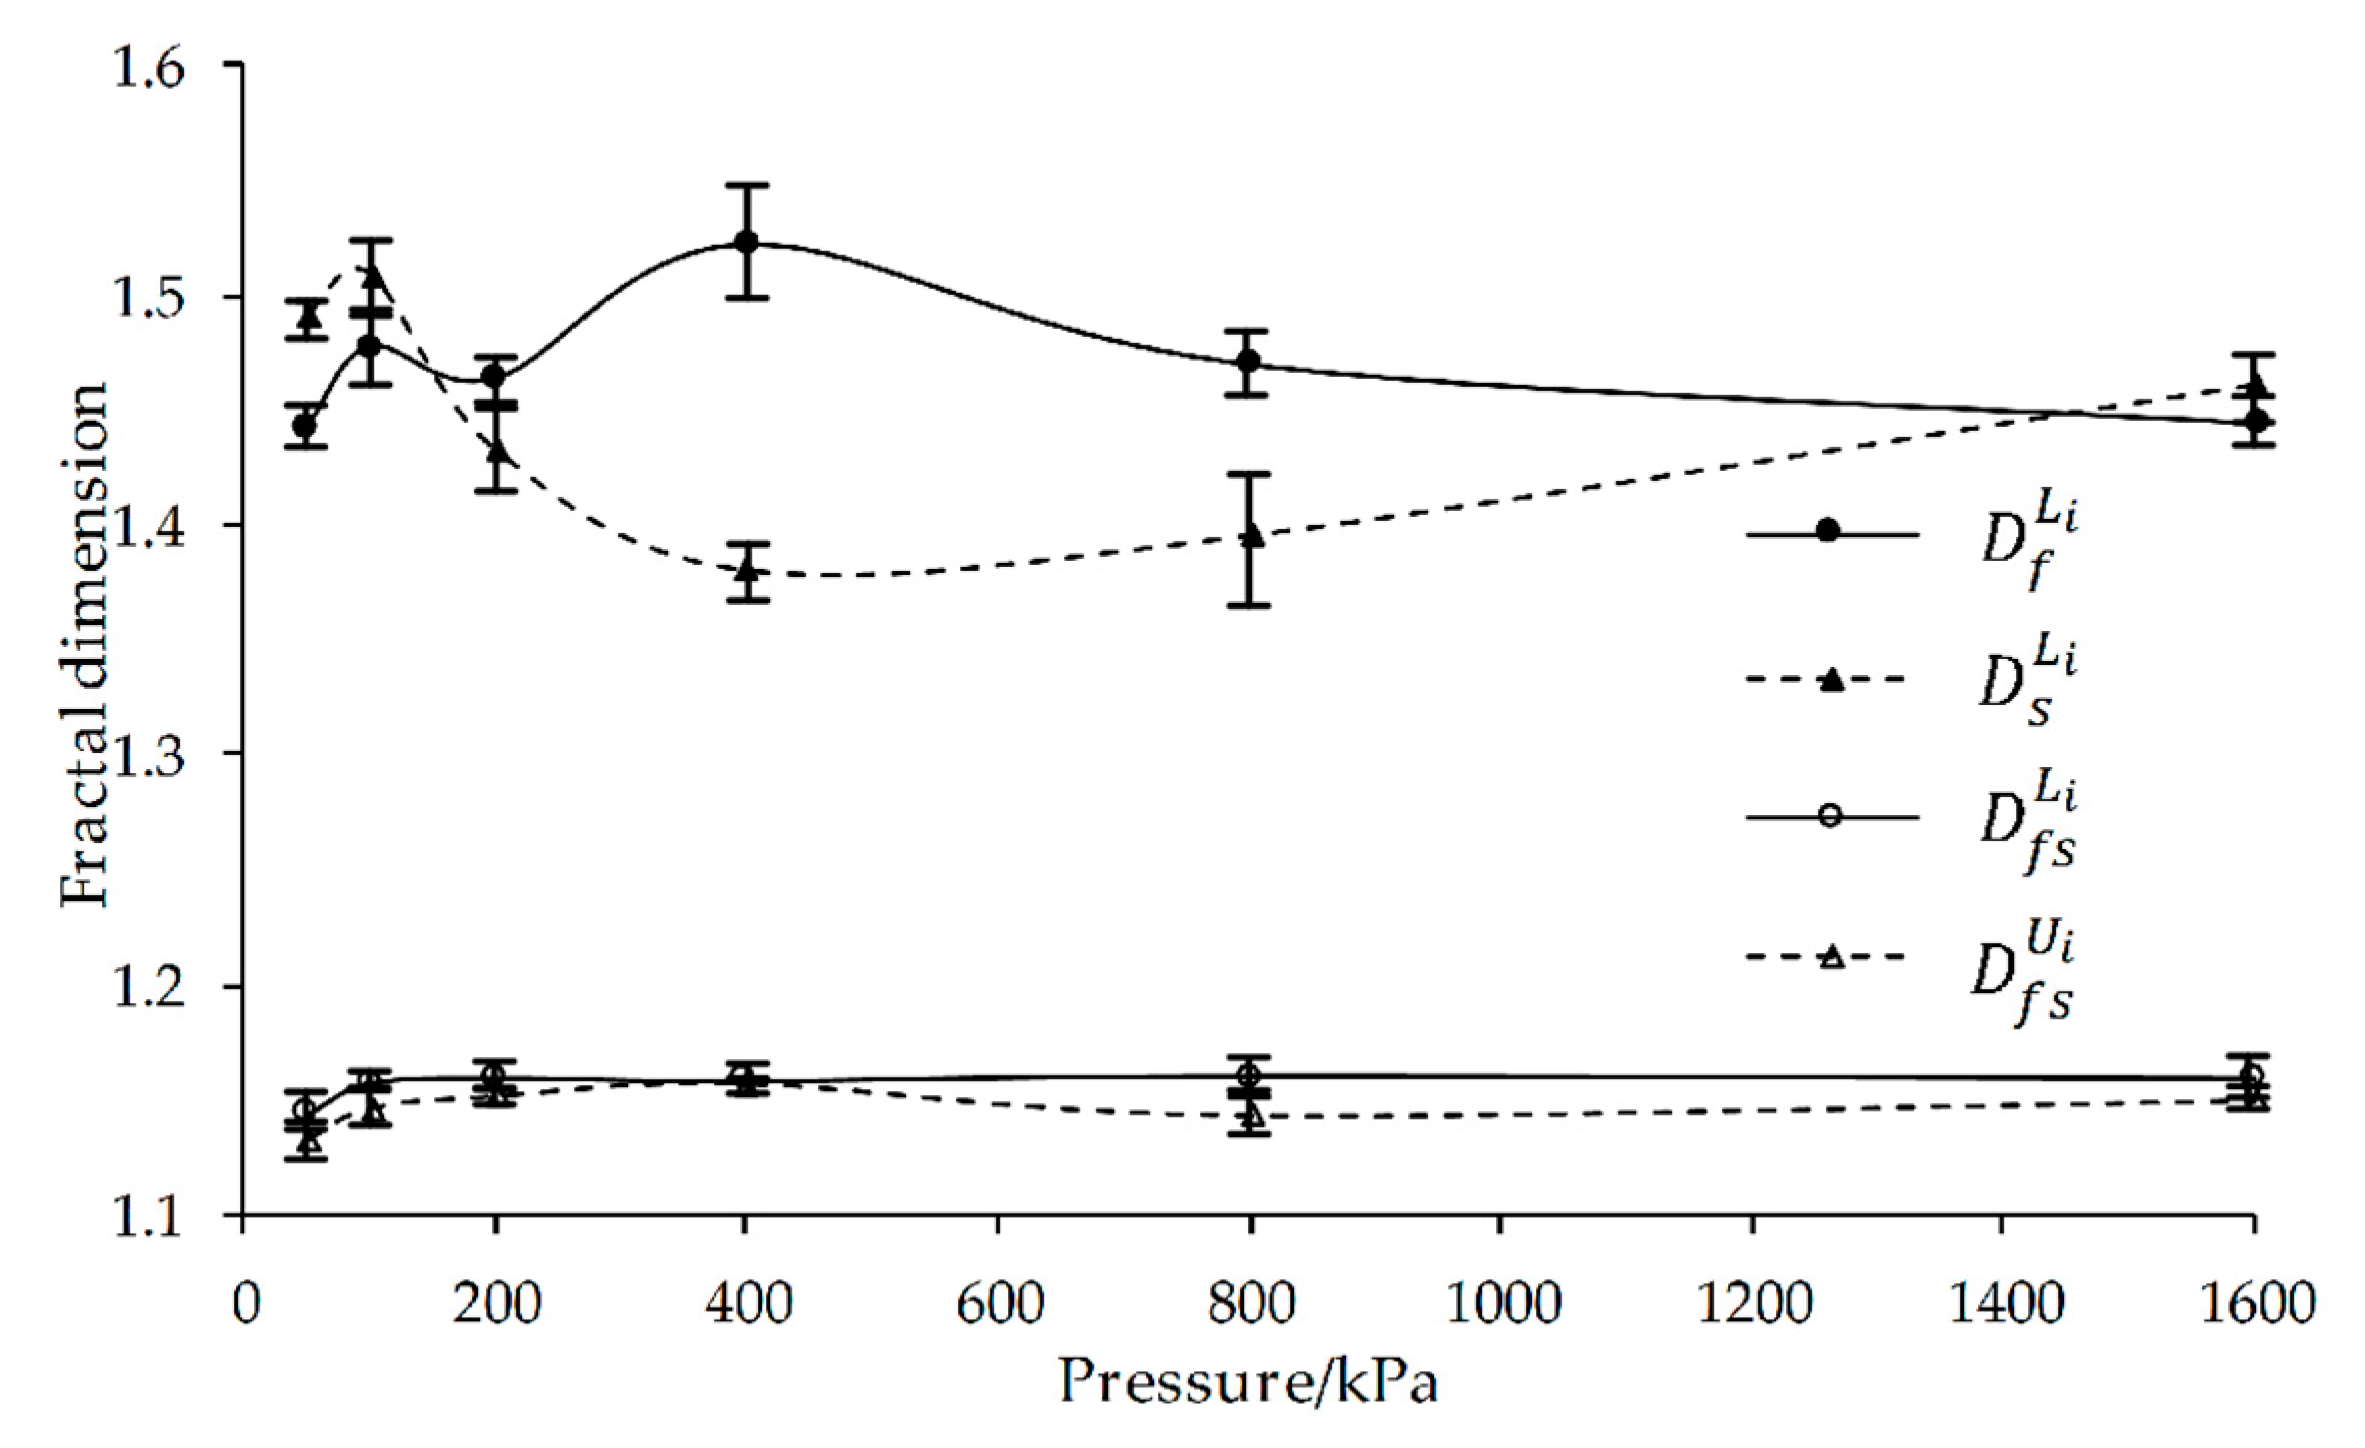
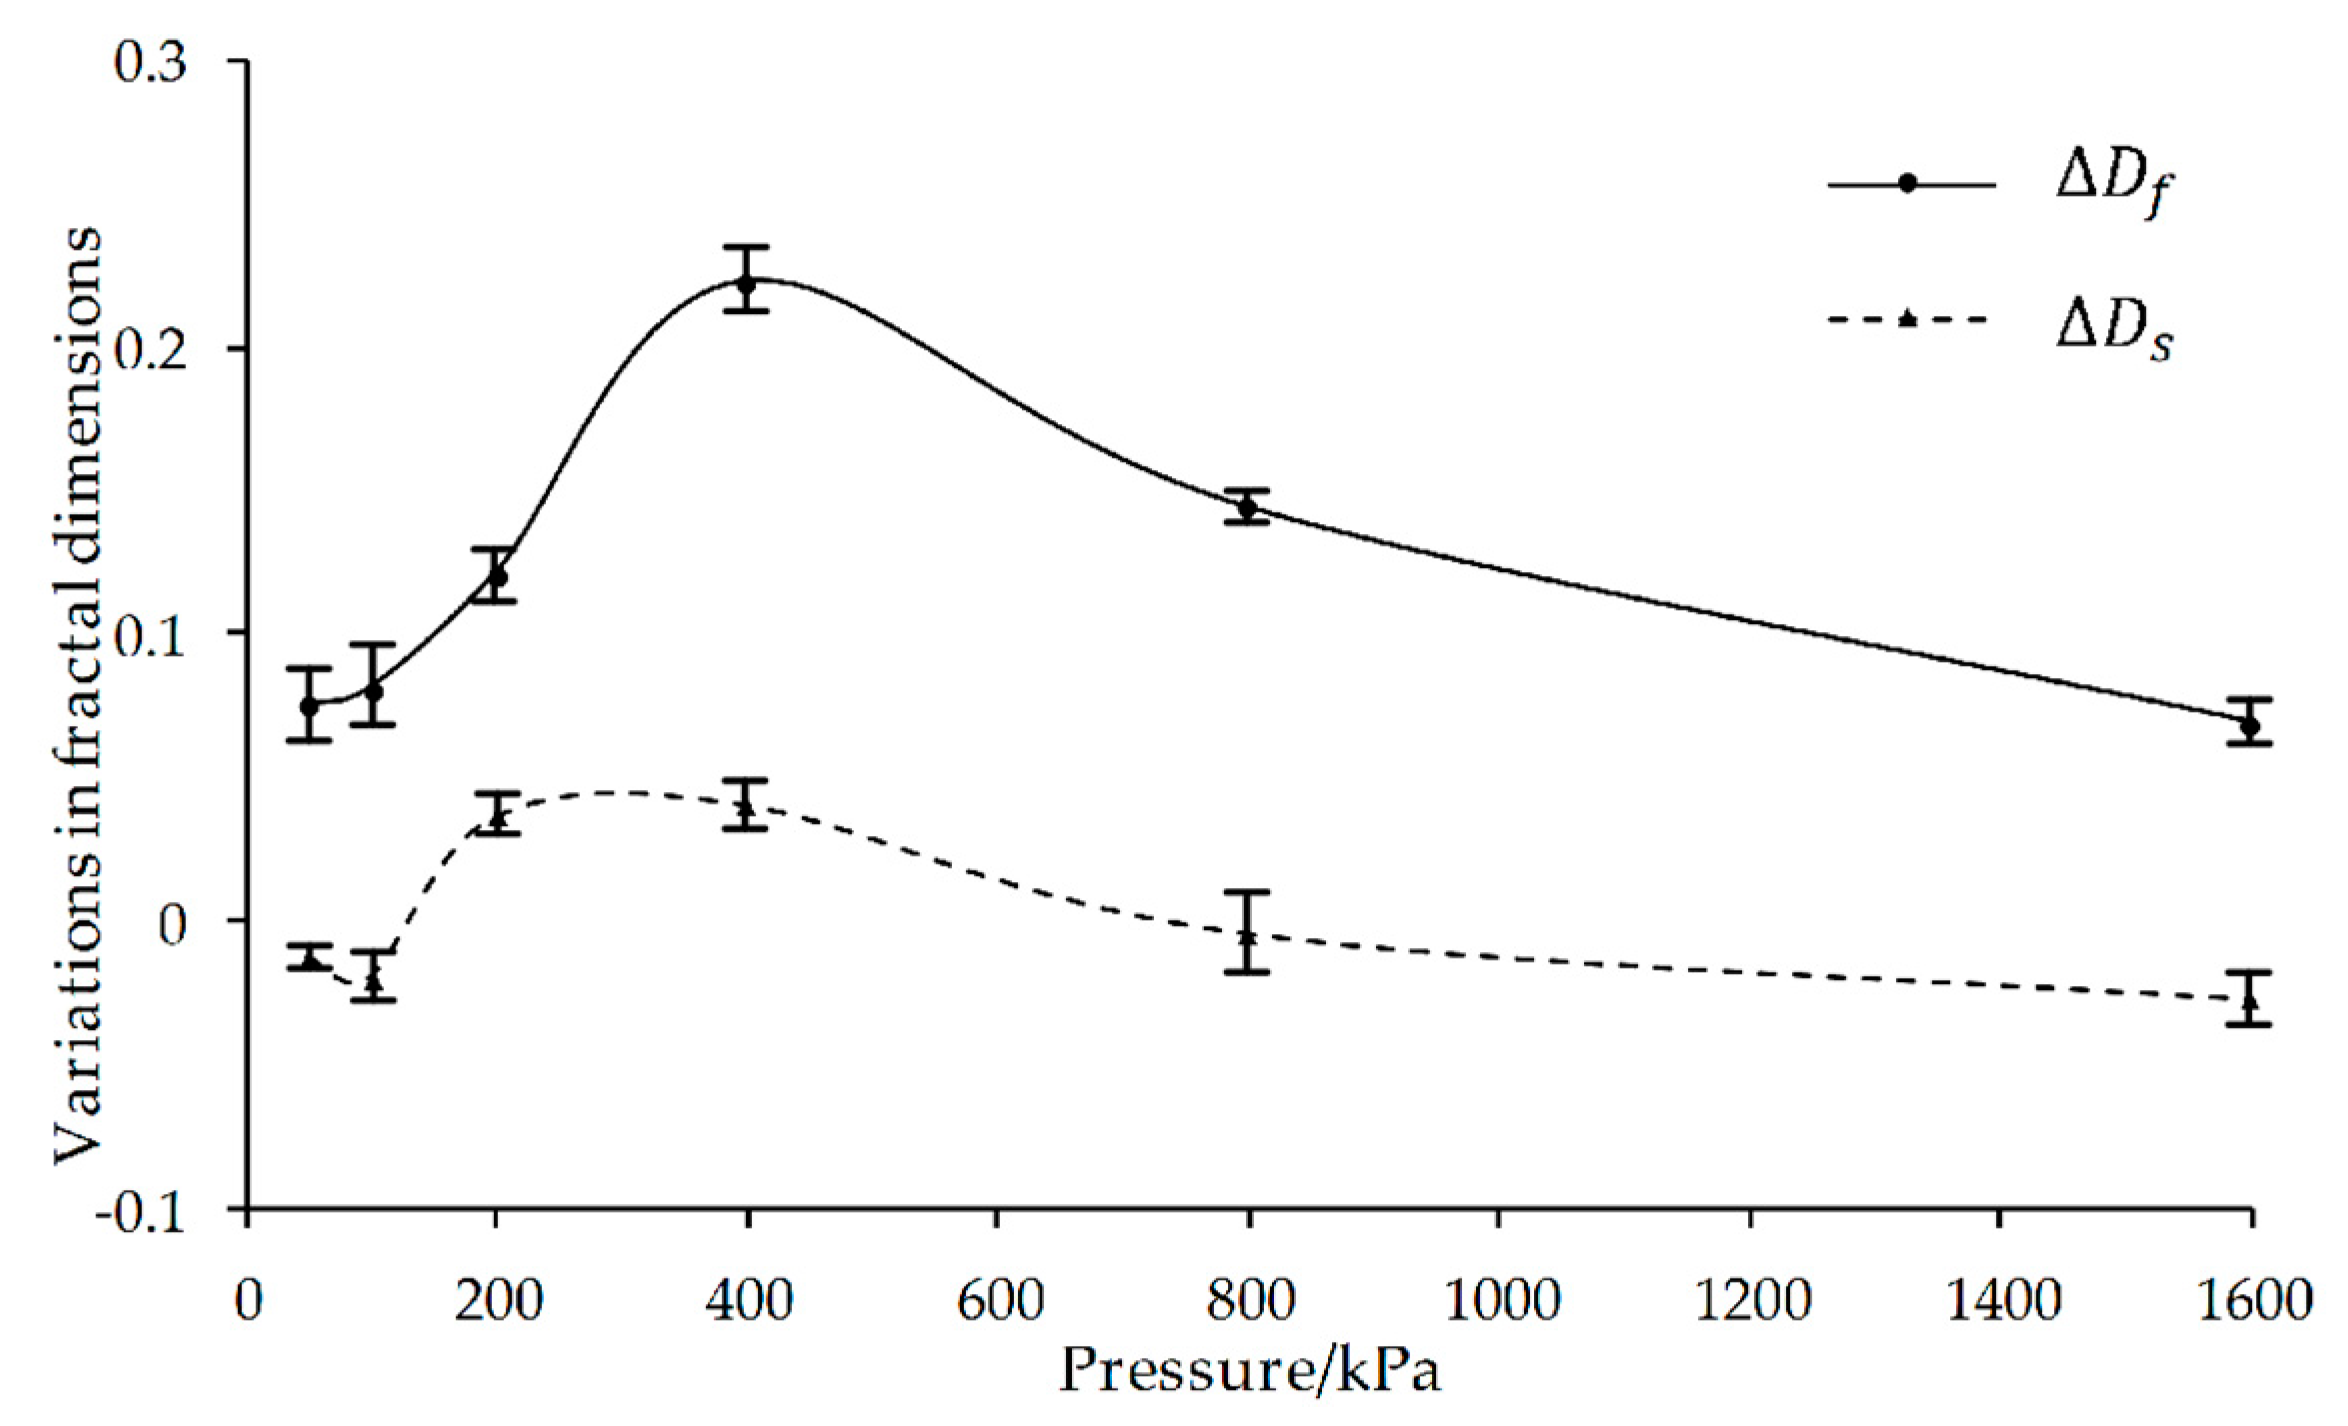
If the value of Δ D s or Δ D f is positive, the fractal dimensions of the pores increase under unloading, otherwise they decrease. D s L i , D f L i , D f s L i , and D f s U i are shown in Figure 10, and Δ D s and Δ D f are shown in Figure 11. The D f of small pores ranged from 1.120 to 1.160, and changed by a small degree. The distribution and size difference of small pores basically was unchanged with pressure, which can be seen as the intrinsic pore characteristics of soft clay. So that the properties of soft clay are mainly influenced by the large pores.
Below 100 kPa, D s L i increased by 0.017 under loading, and D f L i increased from 1.442 to 1.477. The shapes of pores became complicated and the size difference of pores decreased under loading. The value of Δ D f increased slightly while Δ D s was negative and decreased by approximately 0.080 as the step load increased to 100 kPa. The shape complexity and the size difference of pores slightly increased under unloading.
As the pressure increased from 100 kPa to 400 kPa, D s L i decreased by 0.128 under the loading process. Moreover, Δ D s increased to a positive value and then reached the maximum of 0.041 at 400 kPa. The pore shapes became less complicated under the unloading process, and the decrease of shape complexity under each unloading was further increased with the increase of the step load of L i . The value of D f L i changed from 1.477 to 1.522 under loading, while Δ D f increased from 0.081 to 0.223 under each unloading process. The size difference of pores reduced under the loading process, while it increased under the unloading process, and the increase of pore size difference was enlarged with the increase of the step load of L i .
Above 400 kPa, the value of the fractal dimensions changed to a small degree. D s L i gradually increased to 1.460, while D f L i slightly decreased to 1.443. Δ D s changed from 0.004 to 0.027, and Δ D f decreased from 0.223 to 0.069. The complexity of pore shapes increased as the step load of L i increased under the loading/unloading process. The size difference slightly increased under the loading process and decreased under the unloading process.
According to the analysis, small pores had intrinsic characteristics, so that the distribution and D f of the small pores were basically unchanged during loading/unloading. Based on the evolution of the D s and D f of pores, the loading/unloading process could be divided into three stages: the natural structural stage (<100 kPa), the structural adjustment stage (from 100 kPa to 400 kPa), and the new equilibrium stage (>400 kPa). The shape complexity and size difference of pores decreased under loading at the structural adjustment stage, while they increased when the soft clay was in the natural state or in a new balance. The shape complexity of pores under unloading changed in a similar trend with the loading process, while the size difference of pores increased under each unloading process.

4. Discussion

Soft clay has natural structural characteristics [34]. The compressibility of soft clay increased before the failure of the soil microstructure, and then maintained high compressibility [35,36]. The peak value of the compression index of Shanghai soft clay was at 400 kPa, which agreed with the previous research [37]. The microstructure of soft clay rearranged until 400 kPa, and then reached a new equilibrium. Wang and Gao [38] pointed out that surface fractal characteristics have a relationship with the adhesion between the interfaces for micron-sized particles. The larger the surface fractal dimension, the higher the adhesion between particles. The contact between soil particles and the evolution of soil pores were the important manifestations of the soil microstructure failure.
At the natural structural stage, the microstructure of the soft clay recovered to the natural state, and maintained the properties of the soil skeleton; the size difference of pores and the area of large pores were the largest. The interaction between soil particles displayed a face-to-face type, where the adhesion between soil particles was strong. The C c of the soft clay was low and increased slightly. Under the unloading process, a low value of C s and little change in large pore distribution and fractal characteristics occurred, owing to the strong adhesion between soil particles and the high content of large pores at the end of each loading process.
The previous research showed that the collapse of large pores occurs first under the loading process, above the pre-consolidation pressure, leading to irrecoverable volume changes [39]. At the structural adjustment stage, the area percentage of large pores decreased sharply, in that the soil particles were broken into smaller aggregates and filled into pores. The C c of soft clay increased to the peak value of 0.464 at 400 kPa, where the breaking of the soil skeleton occurred. The adhesion between soil particles was weakened and the content of large pores decreased at the end of each loading process, leading to the great increase of C s . The content of large pores increased and the adhesion between soil particles was weakened under the unloading process.
At the new equilibrium stage, the evolution of the pores slowed down. The adhesion between soil particles was enhanced, and the large pores were slightly increased under the loading process, while the C c of the soft clay decreased. The D s and the area percentage of large pores increased slowly and the D f decreased slightly under the loading process. The C s changed by a small degree, the adhesion between soil particles was enhanced, and the content of large pores increased under the unloading process.
According to the analysis above, C c changed nonlinearly with the pore evolution under the loading process, and the microstructure of the soft clay, before unloading, influenced the change of C s and pore evolution under each unloading process. When the D s and the area of the large pores decreased, and the D f increased under loading, the C c increased a lot. When the D s , D f , and area of the large pores slightly changed under loading, C c changed by a small degree. When the D s and the area of large pores decreased, and the D f increased, under loading, C s increased to the peak value of 0.083, and the decrease of fractal dimensions and area of large pores increased under each unloading process.

5. Conclusions

Based on the fractal theory and microscopic analysis, the evolution of pores under loading/unloading process was investigated. The following conclusions can be drawn:
  • Small pores with diameters smaller than 0.2 μm had intrinsic characteristics, their D f and size distribution was basically unchanged with pressure. Large pores, bigger than 0.6 μm, changed greatly under loading/unloading, and the pore-size distribution was mainly influenced by large pores.
  • Based on the evolution of the fractal characteristics of pores, the loading/unloading process could be divided into three stages: the natural structural stage (<100 kPa), the structural adjustment stage (from 100 kPa to 400 kPa), and the new equilibrium stage (>400 kPa).
  • The state of microstructure of soft clay before unloading influenced the change of C s and the pore evolution under unloading. The C s increased greatly as the D s and large pore area decreased, and the D f increased, under loading; and the Δ D s , Δ D f , and large pore area increased under each unloading process.
  • The C c changed nonlinearly with the pore evolution under loading. Below 100 kPa, fractal dimensions and the area of large pores increased slightly under loading, and the C c changed by a small degree. From 100 kPa to 400 kPa, the D s and area of large pores decreased and D f increased, and C c increased greatly to the peak value of 0.464. Above 400 kPa, the change rates of the above parameters slowed down.

Author Contributions

M.Z. conducted the loading/unloading and the FESEM tests and wrote the manuscript. H.S. contributed to the general frame, critical revision of the manuscript at multiple stages. Y.L. conducted the laboratory geotechnical tests. C.S. and M.H. provided a useful modification of the manuscript. All authors have read and agreed to the published version of the manuscript.

Funding

This research was supported by the National Nature Science Foundation of China under Grant Nos.41572255 and 51678361.

Conflicts of Interest

The authors declare no conflict of interest.

References

  1. Indraratna, B.; Chu, J.; Cholachat, R. Embankments with Special Reference to Consolidation and Other Physical Methods. Ground Improvement Case Histories; Elsevier: Amsterdam, The Netherlands, 2015. [Google Scholar]
  2. Huang, W.; Wen, K.; Liu, D.; Dong, Q.; Li, J.; Li, Y.; Li, L. Experimental study on influence of excess pore water pressure and unloading ratio on unloading mechanical properties of marine sedimentary soft soils. Ocean Eng. 2020, 195, 106680. [Google Scholar] [CrossRef]
  3. Lim, A.; Ou, C.-Y. Stress paths in deep excavations under undrained conditions and its influence on deformation analysis. Tunn. Undergr. Space Technol. 2017, 63, 118–132. [Google Scholar] [CrossRef]
  4. Tanaka, H.; Tsutsumi, A.; Ohashi, T. Unloading Behaviour of Clays Measured by CRS Test. Soils Found. 2014, 54, 81–93. [Google Scholar]
  5. Kawaguchi, T.; Tanaka, H. Formulation of Gmax from Reconstituted Clayey Soils and its Application to Gmax Measured in the Field. Soils Found. 2008, 48, 821–831. [Google Scholar] [CrossRef] [Green Version]
  6. Cui, Y.; Nguyen, X.; Tang, A.M.; Li, X. An insight into the unloading/reloading loops on the compression curve of natural stiff clays. Appl. Clay Sci. 2013, 83, 343–348. [Google Scholar] [CrossRef]
  7. Millogo, Y.; Morel, J.-C.; Traoré, K.; Ouedraogo, R. Microstructure, geotechnical and mechanical characteristics of quicklime-lateritic gravels mixtures used in road construction. Constr. Build. Mater. 2012, 26, 663–669. [Google Scholar] [CrossRef]
  8. Collins, K.; Mcgown, A. The form and function of micro fabric features in a variety of natural soils. Géotechnique 1974, 24, 223–254. [Google Scholar]
  9. Hu, Y.; Li, Y.A.; Ruan, C.K.; Lin, J.L.; Chen, S.J.; Tang, H.M.; Duan, W.H. Transformation of pore structure in consolidated silty clay: New insights from quantitative pore profile analysis. Constr. Build. Mater. 2018, 186, 615–625. [Google Scholar] [CrossRef]
  10. Aldaood, A.; Bouasker, M.; Al-Mukhtar, M. Impact of wetting–drying cycles on the microstructure and mechanical properties of lime-stabilized gypseous soils. Eng. Geol. 2014, 174, 11–21. [Google Scholar] [CrossRef]
  11. Cui, Z.-D.; Jia, Y.-J. Analysis of electron microscope images of soil pore structure for the study of land subsidence in centrifuge model tests of high-rise building groups. Eng. Geol. 2013, 164, 107–116. [Google Scholar] [CrossRef]
  12. Lin, B.; Cerato, A.B.; Lin, B. Applications of SEM and ESEM in Microstructural Investigation of Shale-Weathered Expansive Soils along Swelling-Shrinkage Cycles. Eng. Geol. 2014, 177, 66–74. [Google Scholar] [CrossRef]
  13. Roberto, A.; Edmundo, R.E. Saturated Anisotropic Hydraulic Conductivity of a Compacted Lateritic Soil. J. Rock Mech. Geotech. Eng. 2018, 10, 986–991. [Google Scholar]
  14. Asskar, J.C.; Saman, S.K. Microstructure Characteristics of Cement-Stabilized Sandy Soil Using Nanosilica. J. Rock Mech. Geotech. Eng. 2017, 9, 981–988. [Google Scholar]
  15. Saba, S.; Barnichon, J.-D.; Cui, Y.-J.; Tang, A.M.; Delage, P. Microstructure and anisotropic swelling behaviour of compacted bentonite/sand mixture. J. Rock Mech. Geotech. Eng. 2014, 6, 126–132. [Google Scholar] [CrossRef] [Green Version]
  16. Sun, Q.; Zheng, J.; Coop, M.R.; Altuhafi, F.N. Minimum image quality for reliable optical characterizations of soil particle shapes. Comput. Geotech. 2019, 114, 103110. [Google Scholar] [CrossRef]
  17. Cheng, Q.; Tang, C.; Zeng, H.; Zhu, C.; An, N.; Shi, B. Effects of microstructure on desiccation cracking of a compacted soil. Eng. Geol. 2020, 265, 105418. [Google Scholar] [CrossRef]
  18. Tong, C.; Zhang, K.-F.; Zhang, S.; Sheng, D. A stochastic particle breakage model for granular soils subjected to one-dimensional compression with emphasis on the evolution of coordination number. Comput. Geotech. 2019, 112, 72–80. [Google Scholar] [CrossRef]
  19. Cui, Z.-D.; Tang, Y.-Q. Land subsidence and pore structure of soils caused by the high-rise building group through centrifuge model test. Eng. Geol. 2010, 113, 44–52. [Google Scholar] [CrossRef]
  20. Eyo, E.; Ng’Ambi, S.; Abbey, S. Effect of intrinsic microscopic properties and suction on swell characteristics of compacted expansive clays. Transp. Geotech. 2019, 18, 124–131. [Google Scholar] [CrossRef]
  21. Ministry of Water Resources of the People’s Republic of China. Standard for Soil Test Method; China Planning Press: Beijing, China. (In Chinese)
  22. Zhu, Z.C.; Li, J.W.; Lin, F.L.; Chen, F.; Sun, D.A.; Liu, T. Experimental Research on Desorption Curves of Soil Samples under Different Mineral Compositions. Chin. J. Geotech. Eng. 2020, 42, 175–180. (In Chinese) [Google Scholar]
  23. Tang, C.S.; Shi, B.; Wang, B.J. Factors Affecting Analysis of Soil Microstructure Using SEM. Chin. J. Geotech. Eng. 2008, 30, 560–565. (In Chinese) [Google Scholar]
  24. Chen, Q.; Li, W.; Chen, Z.; Qilin, C.; Wei, L.; Zhu, C. Analysis of microstructure characteristics of high sulfur steel based on computer image processing technology. Results Phys. 2019, 12, 392–397. [Google Scholar] [CrossRef]
  25. Zhao, L.; Liu, W.L.; Ying, W. Application of Image-Pro Plus in the Groove Filter Rod Characteristic Parameters Measurement. Appl. Mech. Mater. 2015, 742, 111–117. [Google Scholar] [CrossRef]
  26. Zhang, J.R.; Zhu, J.; Huang, L.; Huang, W.J. IPP Image Technique Used for Quantitative Analysis of Soil Microstructure. J. Wuhan Univ. Technol. 2008, 30, 80–83. (In Chinese) [Google Scholar]
  27. Anderson, A.N.; McBratney, A.B.; Crawford, J.W. Applications of Fractals to Soil Studies. Adv. Agron. 1997, 63, 1–76. [Google Scholar] [CrossRef]
  28. Araujo, G.S.; Bicalho, K.V.; Tristão, F.A. Use of digital image analysis combined with fractal theory to determine particle morphology and surface texture of quartz sands. J. Rock Mech. Geotech. Eng. 2017, 9, 1131–1139. [Google Scholar] [CrossRef]
  29. Liu, D.; Li, D.; Zhao, F.; Wang, C. Fragmentation characteristics analysis of sandstone fragments based on impact rockburst test. J. Rock Mech. Geotech. Eng. 2014, 6, 251–256. [Google Scholar] [CrossRef] [Green Version]
  30. Zhang, J.; Wang, Q.; Wang, W. Research on the Fractal Characteristics of Granularity Composition of Dispers in the West of Jilin Province. Subgrade Eng. 2018, 3, 16–19. (In Chinese) [Google Scholar]
  31. Wu, H.; Li, Q.; Liu, G.B. Characteristics of One-dimensional Compressibility of Shanghai Clay. Chinese. J. Geotech. Eng. 2011, 33, 630–636. (In Chinese) [Google Scholar]
  32. Milligan, G.; Houlsby, G. Basic Soil Mechanics; Elsevier BV: Amsterdam, The Netherlands, 1984. [Google Scholar]
  33. Ke, W.H.; Chen, J.; Sheng, Q. One-dimension Elasto-viscoplastic Model for Structured Soft Clays. Chin. J. Geotech. Eng. 2016, 38, 494–503. (In Chinese) [Google Scholar]
  34. Sun, H.; Hou, M.; Chen, C.; Ge, X. Microstructure investigation of soft clay subjected to triaxial loading. Eng. Geol. 2020, 274, 105735. [Google Scholar] [CrossRef]
  35. Mesri, G.; Godlewski, P.M.J. Time and stress-compressibility interrelationship. International. J. Rock Mech. Min. Sci. Geomech. Abstr. 1977, 103, 417–430. [Google Scholar]
  36. Lv, H.B.; Wang, R.; Kong, L.W.; Shan, H.G. The Influences of Soil Structure on Compressibility of Qiongzhou Strait Soft Marine Clay. Rock Soil Mech. 2001, 22, 467–473. [Google Scholar]
  37. He, P.; Wang, W.D.; Xu, Z.H. Empirical Correlation of Compression Index and Swelling Index for Shanghai Clay. Rock Soil Mech. 2018, 39, 3773–3782. (In Chinese) [Google Scholar]
  38. Wang, J.; Gao, H. Size and shape dependent steady-state pull-off force in molecular adhesion between soft elastic materials. Int. J. Fract. 2010, 166, 13–19. [Google Scholar] [CrossRef]
  39. Delage, P.; Lefebvre, G. Study of the structure of a sensitive Champlain clay and of its evolution during consolidation. Can. Geotech. J. 1984, 21, 21–35. [Google Scholar] [CrossRef]
Figure 1. Curves of ep and the step load of the FESEM scanning.
Applsci 10 08468 g001
Figure 2. The FESEM image and threshold image. (a) FESEM image; (b) threshold image.
Applsci 10 08468 g002
Figure 3. e–p curves under the loading/unloading process.
Applsci 10 08468 g003
Figure 4. The compression and swelling indices.
Applsci 10 08468 g004
Figure 5. FESEM images of specimens L i with ×5000 magnifications. (a) L 1 (50 kPa); (b) L 2 (100 kPa); (c) L 3 (200 kPa); (d) L 4 (400 kPa); (e) L 5 (800 kPa); (f) L 6 (1600 kPa).
Applsci 10 08468 g005
Figure 6. FESEM images of specimens U i with ×5000 magnifications. (a) U 1 (50 kPa); (b) U 2 (100 kPa); (c) U 3 (200 kPa); (d) U 4 (400 kPa); (e) U 5 (800 kPa); (f) U 6 (1600 kPa).
Applsci 10 08468 g006aApplsci 10 08468 g006b
Figure 7. Pore-size distribution (200 kPa). (a) Pore-size distribution of all pores; (b) pore-size distribution of small pores (<0.2 μm).
Applsci 10 08468 g007
Figure 8. Pore-size distribution (>0.2 μm).
Applsci 10 08468 g008
Figure 9. Area percentage of large pores (0.6 μm) under the loading/unloading process.
Applsci 10 08468 g009
Figure 10. Fractal dimensions of specimens L i and U i .
Applsci 10 08468 g010
Figure 11. Δ D s and Δ D f under each unloading process.
Applsci 10 08468 g011
Table 1. Physical properties of soft clay.
Density
ρ
g/cm3
Water Content ω
%
Specific Gravity ds
-
Dried Density ρd
g/cm3
Porosity Ratio e 0
-
Liquid Limit IL
%
Plastic Limit Ip
%
1.7345.72.701.181.2849.723.5
Table 2. The step load of the loading/unloading tests.
The Step Load/kPa
10→12.5→25→50→25→12.5→0
20→12.5→25→50→100→50→25→12.5→0
30→12.5→25→50→100→200→100→50→25→12.5→0
40→12.5→25→50→100→200→400→200→100→50→25→12.5→0
50→12.5→25→50→100→200→400→800→400→200→100→50→25→12.5→0
60→12.5→25→50→100→200→400→800→1600→800→400→200→100→50→25→12.5→0
Table 3. Pore-size distribution and slope of the fitting line (<0.2 μm).
P (kPa)LoadingUnloading
Percentage (%) k R 2 Percentage (%) k R 2
5067.0134.7370.95567.8294.8530.978
10070.4694.8590.96268.7264.8600.975
20070.9154.7310.96569.2314.7510.990
40068.0464.6390.95865.6254.8540.963
80069.7994.8460.95068.6014.9410.987
160069.4664.9430.95669.1984.8340.959
Publisher’s Note: MDPI stays neutral with regard to jurisdictional claims in published maps and institutional affiliations.