Article

Effect of Waves on the Behavior of Emergent Buoyantly Rising Submarines Using CFD

1
Science and Technology on Autonomous Underwater Vehicle Laboratory, Harbin Engineering University, Harbin 150001, China
2
China Ship Scientific Research Center, Wuhan 430064, China
3
Marine Design & Research Institute of China, Shanghai 200011, China
4
Kunming Shipbuilding Equipment Co., Ltd., Kunming 650217, China
*
Author to whom correspondence should be addressed.
Appl. Sci. 2020, 10(23), 8403; https://doi.org/10.3390/app10238403
Submission received: 20 September 2020 / Revised: 8 November 2020 / Accepted: 20 November 2020 / Published: 25 November 2020
(This article belongs to the Section Marine Science and Engineering)

Abstract

:
Emergent buoyantly rising submarines encounter excess roll problems, partially owing to waves that significantly affect their behavior. This study predicts the behavior of a submarine, including when it rises in static water, beam sea, head wave, following wave, 30 bow wave, 60 bow wave, 30 quartering wave, and 60 quartering wave, using the computational fluid dynamics method. The beam sea has a slight effect on pitch prior to the submarine rising to the water surface, but the maximum roll angle in the beam sea is 4.43 times that in static water. After a submarine submerges in water, the pitching oscillation does not decay quickly owing to the yaw angle. The head wave and the following wave have a continuous significant effect on the pitch; the submarine sail remains under the water surface after it submerges from the highest position. The head wave and the following wave have a slight effect on the roll and yaw before the submarine rises to the water surface; however, the roll angle suddenly increases after the submarine submerges from the highest position. As the initial angle between the submarine centerline and wave direction increases, the effect of waves on the longitudinal motion decreases. The amplitude of the pitching oscillation decreases with an increase in the initial angle between the submarine centerline and wave direction, and the waterline when the submarine oscillates on the water surface decreases. The difference in the maximum roll angle between when a submarine rises in an oblique wave and when it rises in beam sea is below 6.3 . Submarines should try to avoid rising in a head wave and the following wave.

1. Introduction

A submarine must rise to the water surface quickly in emergency situations; the most efficient way is to blow the ballast tanks, making the submarine acquire excess buoyancy and rising velocity. However, an emergent buoyantly rising submarine encounters the problem of a large trim angle, especially excess roll. Full-scale trials found that the roll angle of an emergent buoyantly rising submarine could be above 25 [1]; a model test found that it could even exceed 60 . For the safety of the crew and equipment on a submarine, it is critical to analyze the behavior of emergent buoyantly rising submarines to decrease the maximum roll angle.
Early studies on the behavior of an emergent buoyantly rising submarine were conducted using quasi-steady coefficient-based simulations [1,2,3,4]. Watt found that the maximum roll angle was considerably sensitive to the initial roll angle and predicted an emergence roll angle of 9 with an initial heel angle of 2 . When the submarine had no initial heel angle, the emergence roll angle was only 1.5 , which does not agree with the actual situation. In addition, the coefficient method consists of uncertainties.
A submarine is assumed to sail in deep and broad waters when evaluating these coefficients; the flow in the casings is not considered. However, the velocity in the casings of an emergent buoyantly rising submarine is significant, and the flow in the casings affects the behavior of the submarine. When a submarine sails near the water surface, the coefficients are significantly affected; however, this is not considered when calculating coefficients. Hence, these coefficients cannot be used to predict the behavior when a submarine emerges and oscillates on the water surface. In addition, the nonlinear effect of an emergent buoyantly rising submarine is substantial; however, the coefficients can barely model the consequent unsteady effect.
Conducting a model test is the most effective method for studying the behavior of emergent buoyantly rising submarines. The Harbin Engineering University conducted a series of experiments to analyze the effect of each initial condition on the behavior of emergent buoyantly rising submarines, but did not investigate the effect of waves [5,6]. Moreover, a model test is very costly and time-consuming.
The computational fluid dynamics (CFD) method requires less cost and time, and the flow details (such as velocity, pressure, and vorticity) can be acquired; thus, this method is widely used in fluid mechanics. Bettle [7] analyzed the rising stability problem using six-degree-of-freedom Reynolds average Navier-Stokes (RANS)-based simulations in which the disadvantages of coefficients were ignored when modeling the hydrodynamic loads that acted on submarines. However, the effect of casings or flooding holes was not considered; thus, the simulations could not predict the surge of water from the holes when a submarine emerged and oscillated on the water surface. Therefore, only the behavior of an emergent buoyantly rising submarine prior to surfacing was predicted. The CFD simulation conducted by Zhang et al. [8] considered the effect of casings and flooding holes. The predicted results were in good agreement with the experimental results; however, the effect of waves was not analyzed. In this study, the effect of waves on the behavior of emergent buoyantly rising submarines was investigated using the CFD method. The types of waves include the head wave, following wave, beam sea, and oblique waves. Both the submarine model and the CFD method employed in this study are the same as those employed by Shudi ZHANG, except for the simulation of waves.

2. Theory

The state variable, y, is used to express the instantaneous velocities and positions of the submarine.
y = y ( u , v , w , p , q , r , ξ , η , ζ , φ , θ , ψ )
where ( u , v , w ) and ( p , q , r ) are the linear and regular velocities of the submarine in the body-axes directions, and ( ξ , η , ζ ) indicate the position of the submarine in the inertial (Earth-fixed) coordinates. Additionally, ( φ , θ , and ψ ) denote the roll, pitch, and yaw angles of the submarine, respectively. The coordinate systems are shown in Figure 1, and the origin of the body axes is located at the intersection of the submarine centerline and mid-ship plane; y is determined by solving the solid-body equations of motion (EOM) and the fluid EOM.

2.1. Solid Body EOM

The solid-body EOM [9,10] are based on Newton’s second law: F o r c e = M a s s × A c c e l e r a t i o n . The six equations (three for translation and three for rotation) are as follows: Axial translation (along the x-axis)
m u ˙ v r + w p x G q 2 + r 2 + y G p q r ˙ + z G p r + q ˙ = X H t , y W B sin θ
Lateral translation (along the y-axis)
m v ˙ w p + u r y G r 2 + p 2 + z G q r p ˙ + x G q p + r ˙ = Y H t , y W B cos θ sin φ
Normal translation (along the z-axis)
m w ˙ u q + v p z G p 2 + q 2 + x G r p q ˙ + y G r q + p ˙ = Z H t , y W B cos θ cos φ
Rolling rotation (around the x-axis)
I x p ˙ + I z I y q r r ˙ + p q I x z + r 2 q 2 I y z + p r q ˙ I x y + m y G w ˙ u q + v p z G v ˙ w p + u r = K H t , y + y G W y B B cos θ cos φ z G W z B B cos θ sin φ
Pitching rotation (around the y-axis)
I y q ˙ + I x I z r p p ˙ + q r I x y + p 2 r 2 I z x + q p r ˙ I y z + m z G u ˙ v r + w q x G w ˙ u q + v p = M H t , y x G W x B B cos θ cos φ z G W z B B sin θ
Yawing rotation (around the z-axis)
I z r ˙ + I y I z r p q ˙ + r p I y z + q 2 p 2 I x y + r q p ˙ I z x + m x G v ˙ w p + u r y G u ˙ v r + w q = N H t , y + x G W x B B cos θ sin φ + y G W y B B sin θ
where x G , y G , z G are the coordinates of the center of gravity ( C G ) in the mid-ship axes; x B , y B , z B are the coordinates of the center of buoyancy ( C B ) in the mid-ship axes; W is the weight of the submarine; B is the buoyancy of the submarine; I = I x , I y , I z , I x y , I y z , I z x denotes the moment of inertia; F H denotes the hydrodynamic forces and moments acting on the submarine. Note that W, C G , and I are constants throughout the simulation; B and C B depend on the volume of the submarine that emerges from the water; and F H was evaluated through CFD simulations.
The velocity in Equation (2) is defined by body-fixed coordinates, and the position and posture of the submarine are defined by inertial (Earth-fixed) coordinates. The following equations express the relationship between the body-fixed and inertial variables [9,10]:
ξ ˙ = u cos θ cos ψ + v sin φ sin θ sin ψ cos φ sin ψ + w sin φ sin ψ + cos φ sin θ cos ψ
η ˙ = u cos θ sin ψ + v cos φ cos ψ + sin φ sin θ sin ψ + w cos φ sin θ sin ψ sin φ cos ψ
ζ ˙ = u sin θ + v cos θ sin φ + w cos θ cos φ
φ ˙ = p + r cos φ + q sin φ tan θ
θ ˙ = q cos φ r sin φ
ψ ˙ = r cos φ + q sin φ cos θ
The submarine has 12 state variables (as shown in Equation (1)) and 12 differential equations that are defined in Equations (2) and (3); thus, the set of equations is complete.

2.2. Fluid EOM

The fluids in the simulation include two phases, namely air and water, both of which are assumed to be incompressible. The motion of each fluid phase can be expressed by the RANS equations, and the free surface between the water and air is captured by the volume-of-fluid (VOF) method. The following equations represent the mass conservation and momentum conservation, respectively:
ρ t + · ρ U = 0
ρ U i t + ρ U i U j x j = P x i + x j μ U i x j + U j x i x j ρ u i u j ¯ + F B
The instantaneous fluid velocity, U, is denoted by the mean component, U i , and the fluctuating component, u i ; ρ indicates the fluid density, μ is the viscosity of the fluid, and P is the mean component of the instantaneous pressure. Moreover, F B on the right-hand side of Equation (5) denotes the body force:
F B = ρ d 2 R 0 d t 2 + d Ω d t × r 1 + Ω × Ω × r 1 + 2 Ω × U i
where R 0 is the position vector in the inertial coordinates, Ω is the angular velocity vector in the body coordinates ( Ω = p e x + q e y + r e z ), and r 1 is a vector representing a fluid particle in the body axes. The body force depends on the results obtained using Equations (2). The linear acceleration in the body-fixed coordinates is as follows:
d 2 R 0 d t 2 = U + Ω × U
where U is the velocity vector of the submarine ( U = u , v , w and U = u ˙ , v ˙ , w ˙ ).
The Reynolds stress, ρ u i u j ¯ , in Equation (5) was obtained using the shear-stress-transport (SST) k ω turbulence model [11] in this simulation. The frequently used k ϵ turbulence model assumes that the turbulence is fully developed and the viscosity between molecules can be neglected; thus, the calculation for flow fields distant from the boundary layers is highly accurate, whereas it is less accurate for flow fields near the boundary layers [12,13,14]. The k ω turbulence model performs significantly better when predicting the flow near the boundary layers, especially when predicting flow separation under adverse pressure gradients. The SST model uses the k ϵ model for the distant fields and the k ω model near the boundary layers; therefore, this model is highly accurate and is widely used in ship and ocean engineering simulations [15].
The water surface was captured using the VOF method [16]. This method can represent the structure and motion of the free surface, and the solution is considerably simpler than that of other methods, such as the MAC method [17] or Level Set method [18]. The following equations express the density and viscosity of fluid on the water surface:
ρ = α w ρ w + ( 1 α w ) ρ a
μ = α w μ w + ( 1 α w ) μ a
In these equations, α w is the volume fraction of water in the control volume, ρ w and ρ a are the densities of water and air, respectively, and μ w and μ a are the viscosities of water and air, respectively. α w meets Equation (10).
α w t + α w U j x j = 0

2.3. Stokes Waves

The wave in the simulation is generated by five-level stokes waves [19,20] , generating a regular wave considering nonlinear effects. The wave height was 0.4 m whereas the wave length was 15 m. This simulation was used to investigate the motion law of a full-scale submarine (approximately 80∼100 m long) in sea state 6.

3. CFD Implementation

3.1. Submarine Model

The simulations were conducted on the submarine model shown in Figure 2. The main body of the submarine consists of the following three sections: a blunt-shaped nose, a circular cylinder mid-body, and an axis-symmetric tail. The sail (with two sailplanes) is attached to the mid-body of the submarine, and four identical tailplane appendages are attached to the tail. In addition, the submarine consists of the following three casings: fore casing, aft casing, and deck casing. Each casing has flooding holes and vents connected to the external fluid field, as shown in Figure 2.
In this study, it is assumed that the blowing of the ballast tanks is accomplished instantly at the beginning of the simulation; thus, the blowing only changes the structural characteristics ( W , C G , I ) of the submarine and has no effect on the submarine geometry or fluid field throughout the simulation. Therefore, the mass of the submarine is as follows:
m = m F m b l o w n m c a s i n g
where m F is the mass of the submarine form displacement, which equals the mass of water in container with the same shape of the shell. In addition, m b l o w n is the mass of water blown from ballast tanks at the beginning of the simulation, and m c a s i n g is the mass of water in the casings of the submarine.
The C G of the submarine is as follows:
G = m F G F m b l o w n G b l o w n m c a s i n g G c a s i n g m
where G F ( x F , y F , z F ) denotes the center of mass of the submarine form displacement; G b l o w n ( x b l o w n , y b l o w n , z b l o w n ) denotes the center of mass of the blown loads; and G c a s i n g ( x c a s i n g , y c a s i n g , z c a s i n g ) denotes the mass center of water in the casings of the submarine.
The submarine moments of inertia are as follows:
I = I F I b l o w n I c a s i n g
where I F is the moment of inertia of the submarine form displacement; I b l o w n is the moment of inertia of the blown loads; and I c a s i n g is the moment of inertia of water in the submarine casings. The mass, center of mass, and moment of inertia of each part are listed in Table 1. All of them are expressed in mid-ship coordinates (as shown in Figure 1).

3.2. Meshing

An overset mesh can simulate complex relative motions between multiple objects, and it is widely used in CFD simulations of ships and airplanes [21,22]. The mesh constructed for this simulation included two regions: the overset region and the numerical water tank region. The overset region moved along with the submarine, whereas the water tank region was static; the exchange of data between the two regions was achieved by interpolation.
The overset region was defined as a cylinder region out of the submarine; a polyhedral mesh was used in this region. Polyhedral meshes can adapt to complex geometric shapes, and only a small number of cells are sufficient to ensure calculation accuracy [23]. The mesh had to be refined in the regions where the curvature of submarine geometry changes quickly, such as the region near the holes and appendages; there was only a slight deformation in these regions (as shown in Figure 3). The mesh gradually becomes coarse from the submarine model to the cylinder boundary. Note that when the rising speed of the submarine is 0.01 m/s, the average of the wall y+ values is approximately 15; it becomes approximately 120 when the submarine is moving at maximum speed (i.e., ∼1 m/s). The mesh in the boundary layer was sufficiently refined to ensure simulation accuracy, given that the average of wall y+ should be 20∼100 [24,25].
As shown in Figure 4, a trim mesh was used in the numerical water tank to obtain a good simulation accuracy. The mesh near the water surface should be refined to capture the water surface sufficiently and predict the behavior of the submarine correctly when it moves near the water surface. There were more than 20 cells per wave height and more than 80 cells per wave length, and the height of the refinement zone near the water surface was 1.5 times the wave height. The cells in the region around the submarine rising path were the same size as the cells over the cylindrical surface in the overset region, ensuring a good accuracy of the interpolation between the two regions.
To analyze the uncertainty of the simulation, three different grid sizes were used to predict the behavior of the submarine when it rose in static water. The coarse grid included 1.25 million cells, the medium grid included 3.53 million cells, and the fine grid included 10.37 million cells. The predicted results using the medium grid was almost the same as those using the fine grid (as shown in Table 2) ; therefore, a medium grid was used for all the simulations.

3.3. Boundary and Initial Conditions

Figure 5 depicts the design of the numerical water tank; the distance between the water surface and submarine baseline is 0.8 L (4 m). The height of the numerical water tank is 2.5 L, the length of the numerical water tank is 6 L, and the width of the numerical water tank is 4 L. The submarine was set as a no-slip solid boundary in the simulation. The boundary of the water tank at the top and bottom of the submarine was set as the velocity inlet. The boundary of the water tank in front of the submarine was also set as the velocity inlet, and the velocity value was set as the velocity of waves. The boundary on the rear end of the submarine was set as the pressure outlet, and the pressure value was set as the hydrostatic pressure of the waves. The boundary of the water tank on the left and right sides of the submarine was set as the symmetry plane.

3.4. Solution of the Fluid EOM

For numerical evaluation, Equation (2) must be rearranged as follows:
m 0 0 0 m z G m y G 0 m 0 m z G 0 m x G 0 0 m m y G m x G 0 0 m z G m y G I x I x y I z x m z G 0 m x G I x y I y I y z m y G m x G 0 I z x I y z I z u ˙ v ˙ w ˙ p ˙ q ˙ r ˙ = f X t , y f Y t , y f Z t , y f K t , y f M t , y f N t , y
Equation (14) is coupled with the RANS equations through the hydrodynamic forces expressed by f F t , y on the right-hand side of Equation (14). The RANS equation is coupled with Equation (14) through the body force, F B , on the right-hand side of Equation (5). At each time level, k, the iterative predictor-corrector scheme was used to solve the fluid-rigid-body coupling. The submarine model was implemented in the RANS solver, i.e., STAR-CCM+, and the RANS equations were solved by the SIMPLE solver [26]. The RANS equations were discretized using the finite element method [27]; the convective term was discretized using a second-order upwind scheme, whereas the viscosity term was discretized using the second-order central difference method. The time step was 0.01 s in all the simulations. There were 20 iterations during each time step, and the average courant number of submarine surfaces was approximately 0.5.

4. Results and Discussion

The oscillation of submarines becomes violent when the sea states worsen; therefore, the effect of sea state 6 on the behavior of emergent buoyantly rising submarine was analyzed in this study, excluding the effect of lower sea states. To investigate the effect of waves, a simulation of a rising submarine in static water was conducted for comparison. All the initial conditions other than the water surface were kept unchanged: the submarine rose from static, the submarine baseline depth was 4 m, the same weight and position of blown loads, and the same metacentric height ( B G ¯ ). To investigate the effect of the wave direction, the initial conditions in all the simulations were coincident, except for the initial angle between the submarine centerline and the wave direction. Table 3 lists the initial conditions for all the simulations, and wave angle means the initial angle between the submarine centerline and the wave direction.

4.1. Effect of Beam Sea

As shown in Figure 6, the difference in pitch when the submarine rises in static water and beam sea is always below 0.1 prior to 5.3 s. When the submarine rises in both static water and beam sea, the submarine sail reaches the water surface at 6.30 s. The maximum pitch angle when the submarine rises in beam sea ( 19.16 ) is only 0.47 larger than that when the submarine rises in static water ( 18.69 ). When oscillating on the water surface, the deck of the submarine that rises in the beam sea is always above the water surface, similar to when the submarine rises in static water, as shown in Figure 7. The beam sea has a slight effect on pitch prior to the submarine sail reaching the water surface, which is consistent with the study of Zhang et al. [28]. When the submarine rises in static water, the pitching oscillation decays rapidly and the pitch angle is always below 1 after 12.3 s. When the submarine rises in the beam sea, the pitching oscillation on the water surface does not decay rapidly, and the pitch angle oscillates between 5 and 5 . The difference between the pitching oscillating period and the wave period is only 3%; thus, the pitching oscillation is assumed to be caused by the first-order wave force. There is a periodic pitching moment acting on the submarine, mainly due to the yaw changing after the submarine reaches the water surface (the yaw angle is already larger than 7 at 10 s); therefore, the submarine encounters oblique waves, and the first-order wave force will result in a pitching moment.
As shown in Figure 8a,b, when the submarine rises in static water, the roll angle is always below 0.1 prior to 3.7 s, and slowly increases after 3.7 s; the maximum roll angle prior to the submarine emerging through the water surface is only 2.75 . When the submarine rises in the beam sea, the roll angle is 0.1 prior to 0.27 s, and the rolling oscillation occurs prior to the submarine rising to the water surface. During the transformation of the water surface above the submarine from peak to valley, the rolling angle velocity increases as a result of the first-order wave force, whereas during the transformation of the water surface above the submarine from valley to peak, the rolling angle velocity decreases owing to the first-order wave force.
As shown in Figure 8c,d, the beam sea has a slight effect on the axial velocity prior to 5 s. The side velocity oscillates within a range of ±0.1 m/s, which is mainly caused by the first-order wave force. After 5 s, the side velocity continues to oscillate periodically and has a velocity of approximately 0.1 m/s; however, the minimum side velocity is approximately −0.5 m/s. The velocity is significantly larger when the submarine translates to the left side than when the submarine translates to the right, which is mainly due to the effect of the second-order wave force. In addition, the submarine always rolls to the left (the downstream direction of the wave) before reaching the water surface, mainly because of the effect of the second-order wave force. The maximum roll angle when the submarine rises in beam sea ( 29.26 ) is 4.43 times that of when the submarine rises in static water ( 6.61 ), and the rolling oscillation does not decay as quickly as when the submarine rises in static water, despite the oscillating amplitude being equal to approximately 13 after 12 s.
As shown in Figure 8e,f, the direction of the rising submarine in the beam sea slightly turns to the right prior to 4.73 s; however, the yaw angle is always below 0.3 . After 4.73 s, the submarine starts rapidly heading to the left side (downstream direction of the wave), mainly because the pitch angle during this period is above 15 and the position of the submarine nose is significantly higher than that of the stern. Thus, the second-order wave force acting on the submarine nose is significantly larger than that on the stern, as the wave amplitude exponentially decays along the depth. After 6.36 s, the sail and most of the submarine bow are in the air and there is no second-order wave force acting on them; however, the stern remains in the water and is affected by the second-order wave force. Thus, the submarine gradually stops turning to the left and starts turning to the right. After the submarine submerges from the top, both the bow and stern are affected by the second-order wave force; however, the force acting on the bow is slightly larger than that on the stern; thus, the yawing angle velocity slightly decreases; however, it is still above zero. During the valley-to-peak transformation of the water surface near the submarine, the bow decreases as a result of the first-order wave force, and the second-order force acting on the stern is larger than that on the bow; thus, the submarine rapidly starts heading to the right. During the peak-to-valley transformation of the water surface near the submarine, the height of the bow is approximately the same as that of the stern, and the second-order force acting on the bow is slightly larger than that on the stern. The yawing angle velocity decreases, but the submarine remains turning to the right. As a result, the yaw angle after 10 s is ascending in a “staircase” manner.

4.2. Effect of Head Wave and Following Wave

As shown in Figure 9, prior to 1.43 s, the pitching angle velocity q of the submarine rising in the head wave is always below that of the submarine rising in static water, and the water surface above the submarine sail transforms from peak to valley during this period. During the period between 1.43 and 3.18 s, the pitching angle velocity q of the submarine rising in the head wave is always larger than that of the submarine rising in static water, and the water surface above the submarine sail transforms from valley to peak during this period. During the period between 3.18 and 6.94 s, the pitching motion of the submarine rising in the head wave has the same rule: q is larger when the water surface above the submarine sail transforms from valley to peak, or q is smaller when the water surface above the submarine sail transforms from peak to valley. In addition, prior to the submarine rising to the water surface, the pitching motion law for the following wave is the same as that for the head wave.
When the submarine rises in static water, the pitching oscillation decays rapidly after submerging in water from the highest position, and the absolute value of the pitch after 12.3 s is always below 1 . When the submarine rises in the head wave, the water surface around the submarine transforms from peak to valley when the submarine submerges from the highest position. Thus, the first-order wave force aggravates the development of the pitch motion and the maximum downward angle of the nose ( 8.31 ) is 23.3% larger than that in static water. Violent pitching oscillation occurs after the submarine falls into the water; the maximum upward angle of the nose prior to 19 s is 11.98 whereas the maximum downward angle of the nose prior to 19 s is 4.64 ; the posture of the submarine maintains its nose in the upward direction for only 2.22 s during the interval 10–17 s. The downward hydrodynamics due to the attack angle is significantly larger than the upward hydrodynamics; as a result, the submarine cannot rise back up to the water surface after falling (as shown in Figure 10).
When the submarine rises in the following wave, the submarine slowly drops to the water surface from the highest position. As the wave peak spreads from the rear to the submarine and the water surface rises near the nose of the submarine, the nose of the submarine easily glides with the water (as shown in Figure 11). The wave valley spreads from the rear to the water surface near the submarine after the nose of the submarine falls on the water surface. The large bow-down moment acts on the submarine as a result of the first-order wave force; thus, the maximum bow-down angle of the submarine in the following wave ( 12.88 ) is 1.91 times that of the angle in static water ( 6.74 ). The submarine is always in the nose-up position after 11.62 s; however, the pitching oscillates violently, and the maximum pitch angle is 8.91 . The submarine sail cannot rise to the water surface as it does in the head wave. When the submarine rises in the following wave, the wave and submarine sailing directions concide; however, the wave velocity is larger than that of the submarine, and downward hydrodynamics acts on the nose-up submarine as a result of the first-order wave force. The downward force is larger than the sum of blown loads and the wave suction when the submarine is near the water surface; thus, the sail is always below the water surface. The downward force exponentially decays along the depth, and the submarine stops diving when the forces are balanced in the vertical direction. The wave suction acting on the submarine nose is larger than that on the stern. The blown loads are in front of the submarine C G , and the downward force is behind the C G (the same as when the submarine sails backward); thus, the submarine continuously maintains the nose-up position after 11.62 s.
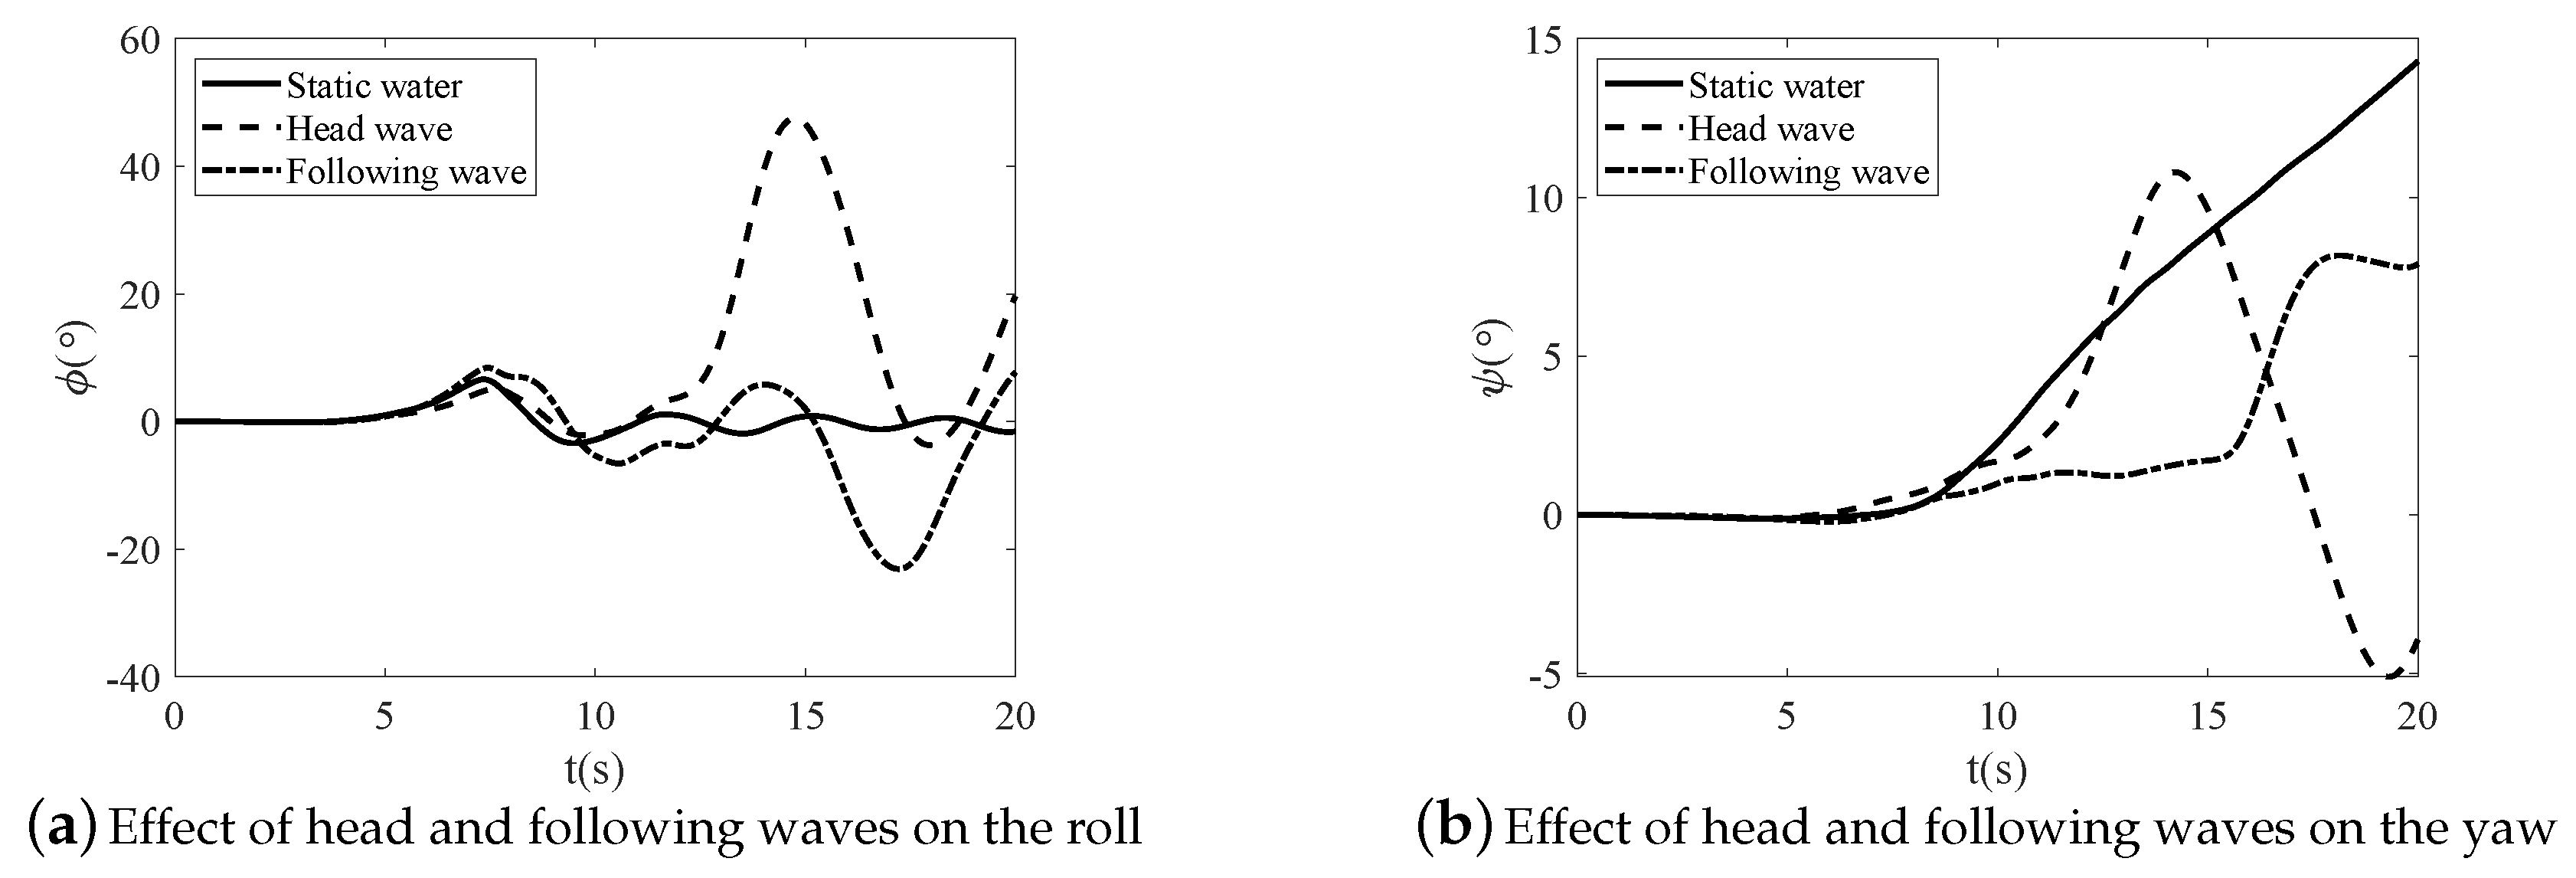
As shown in Figure 12a, the roll angle of the submarine rises in the head wave and the following wave prior to 5 s is approximately the same as that of the submarine rising in static water. Prior to 10 s, the roll-developing rule of the submarine is the same for three situations, for which the maximum roll angle of the submarine in each situation is presented is below 10 . As shown in Figure 12b, prior to 10 s, the developing rule of the yaw angle keeps unchanged and the maximum yaw angle in all three situations are below 2.3 . The CFD results indicate that the head and following waves have a slight effect on the transverse motion of the submarine before it falls in the water from the highest position. After falling to water, the yaw angle of the submarine rises in the head wave begins to oscillate. This is mainly caused by the pitching oscillation. The second-order wave force always points downstream, and the wave decays with the increase in depth, so the yawing moment caused by the second-order wave force when the nose is up is in opposite direction to that when the nose is down.
When the submarine rises in static water, the rolling oscillation gradually decays after 10 s, and the roll angle is always below 2 after 15 s; however, the rolling oscillation quickly develops after 10 s in situations where the submarine rises in the head or following waves. When the submarine rises in the head wave, the yaw angle increases rapidly after 10 s and reaches the maximum value ( 10.79 ) at 14.22 s. The roll angle increases rapidly after the yaw angle starts to increase rapidly as well; the maximum roll angle ( 47.53 ) occurs at 14.74 s. When the submarine rises in the head wave, the rapid increase in the roll angle is due to the following two reasons: first, the submarine experiences an oblique wave as a result of the yaw angle; the components of the first-order wave force in the transverse direction will result in a rolling moment. Second , the side force acts on the sail and main body as a result of the drift angle, and the side force on the sail leads to a large rolling moment because the vertical position of the sail is significantly higher than that of the submarine C G . When the submarine rises in the following wave, the moment when the roll angle rapidly increases occurs sooner than that of the rapid increase in the yaw angle. The minimum roll angle 23.10 occurs at 17.22 s, and the maximum yaw angle 8.17 occurs at 18.12 s. When a submarine rolls to the left, the axial force acts on the sail and main body; the axial force on the sail will lead to yawing to the right. The CFD results indicate that there is a coupling relationship between the roll and yaw motions for emergent buoyantly rising submarines. This is in agreement with an earlier study by Chen et al. [5] and Zhang et al. [8].

4.3. Effect of Oblique Waves

This subsection details the effect of oblique waves on the behavior of emergent buoyantly rising submarines. As shown in Figure 13a,b, the developing pitching rule of a submarine rising in a bow wave is similar to submarines rising in head waves; and the developing pitching rule of submarines rising in quartering waves is similar to submarines rising in following waves. During the rising procedure underwater, when the water surface above the submarine sail translates to a wave valley from a wave peak, the pitching angle velocity, of the submarine, q, rising in the bow (quartering) wave is larger than that of the submarine rising in static water; otherwise, when the water surface transitions from a wave valley to a wave peak, q is below the value when the submarine is rising in static water. After 11 s, pitching oscillation occurs when the submarine rises in both the bow wave and quartering wave. The pitch of the submarine rising in 30 bow wave ranges from 1.79 to 2.90 , the pitch of the submarine rising in 60 bow wave ranges from 2.57 to 2.89 , the pitch of submarine rising in a 30 quartering wave is always above 5 , and the pitch of submarine rising in 60 quartering wave ranges from 0.62 to 7.87 . During the oscillating procedure, when the submarine rises in the 30 bow wave, the deck and half of the sail are under the water surface when the submarine experiences a wave peak; both the deck and sail are above the water surface when the submarine experiences a wave valley, as shown in Figure 14a,b. When the submarine rises in the 60 bow wave during oscillation, the deck is near the water surface when the submarine experiences a wave peak. Both the deck and sail are above the water surface when the submarine experiences a wave valley, as shown in Figure 14c,d. When the submarine rises in the 30 quartering wave during oscillation, the deck and half of the sail are under the water surface when the submarine experiences a wave peak. Both the deck and sail are above the water surface when the submarine experiences a wave valley, as shown in Figure 15a,b. When the submarine rises in the 60 quartering wave during oscillation, the bottom of the sail is near the water surface when the submarine experiences a wave peak; the sail and part of the deck could be above the water surface when the submarine experiences a wave valley, as shown in Figure 15c,d.
As shown in Figure 13c–f, the effect of an oblique wave on the transverse motion of the emergent buoyantly rising submarine is different from the effect of beam sea. When the submarine rises in beam sea, it rolls to one side during the rising procedure underwater because the effect of the wave force and the maximum roll angle prior to the submarine emerging through the water surface is only 4.11 . When the submarine rises in the 30 bow wave, the maximum roll angle prior to the submarine emerging through the water surface is 8.14 . When the submarine rises in the 60 bow wave, the maximum roll angle prior to the submarine emerging through the water surface is 15.89 . When the submarine rises in the 30 and 60 bow waves, the pitch angle is larger than that when the submarine rises in static water prior to 4.54 s; however, the pitch angle when the submarine rises in the beam sea is approximately the same as that when the submarine rises in static water. Therefore, the vertical position of the sail when the submarine rises in 30 and 60 bow waves is higher than that when the submarine rises in the beam sea. As the wave amplitude exponentially decays with depth, the wave force in the lateral direction acting on the sail of the submarine rising in 30 and 60 bow waves is significantly larger than that of the submarine rising in beam sea. The side force acting on the sail results in a large rolling moment because its position is significantly higher than that of the submarine C G ; therefore, a large roll angle occurred during the rising procedure underwater when the submarine was rising in the 30 and 60 bow waves. The maximum roll angle of the rising submarine in the 60 bow wave ( 35.52 ) was 6.26 larger than that of the submarine rising in the beam sea ( 29.26 ). The maximum roll angle of the rising submarine in the 30 bow wave ( 30.41 ) was 1.15 larger than that of the submarine rising in the beam sea ( 29.26 ).
The direction of the submarine turns to the right during the early stages of a submarine rising in 30 and 60 bow waves. The maximum yaw angle prior to 2.38 s of the submarine rising in the 60 bow wave is 0.36 , and the maximum yaw angle prior to 3.01 s of the submarine rising in the 30 bow wave is 0.59 . A significant roll angle (larger than 3 ) forms to the left; thus, the rising submarine has a side velocity v ( v = V ζ sin ϕ ) and heads to the left. Consequently, the minimum yaw angles of the submarine rising in the 30 and 60 bow waves are 1.13 and 2.50 , respectively. When the submarine rises in the beam sea, it gradually heads to the right after falling on the water surface from the highest position in the 30 and 60 bow waves.
The roll-developing procedure of the submarine rising in the 30 quartering wave is similar to that of the submarine rising in the 60 quartering wave. Prior to 5 s, the roll angle is similar and the maximum roll of the submarine for both situations is below 2.55 . The maximum roll angle of the submarine rising in the 30 quartering wave ( 31.40 ) is only 2.65 smaller than that of the submarine rising in the 60 quartering wave. During the oscillation procedure, the moments of the maximum roll angle and the rolling period for both situations are approximately the same. In addition, the maximum roll angle of the submarine rising in both the 30 and 60 quartering waves, is larger than that of the submarine rising in beam sea. The maximum roll angle of the submarine for the three situations is near 30 . Prior to 11.5 s, the yaw angle of the submarine rising in the 30 quartering wave is significantly close to that of the submarine rising in the 60 quartering wave.
In summary, the effect of the bow wave (quartering wave) on the rule of longitudinal motion is the same as the effect of the head wave (following wave); however, the effect gradually decays when the initial angle between the submarine centerline and wave direction increases. The effect of the oblique wave on the rule of transverse motion is different from the effect of the beam sea as follows: the maximum roll angle of the submarine rising in the bow and quartering waves is larger than that of the submarine rising in beam sea. The direction of the submarine rising in the bow wave turns to the right; however, the direction of the submarine rising in the quartering wave is unstable.

5. Summary and Conclusions

In this study, the effect of waves on the behavior of an emergent buoyantly rising submarine was analyzed. The behavior of a submarine rising in different sea situations was predicted using the CFD method. The varying sea situations included static water, head wave, 30 and 60 bow waves, 30 and 60 quartering waves, and beam sea. The motion of the submarine was expressed by solid-body EOM. The hydrodynamic force was calculated using the RANS equations. The wave was generated by the fifth-order Stokes wave method. The submarine had four stern appendages and a sail with planes. There were three casings on the submarine, each of which flooding holes and vents to let air and water flow out into the casing; thus, the CFD could predict behavior of the submarine when it emerged through the water and oscillated on the water surface. Three different meshes were used to predict the behavior of the submarine when it rose in static water. The result of the medium mesh was approximately the same as that of the refined mesh; therefore, the medium mesh was used for all the simulations.
During the rising procedure underwater in the head and following waves, when the water surface above the submarine sail transitioned from wave valley to peak, the pitching angle velocity was larger than that when the submarine rose in static water. When the water surface transitioned from wave peak to valley, the pitching angle velocity was smaller than that when the submarine rose in static water. When the submarine rose in the head and following waves, a large pitching oscillation occurred after the submarine submerged into the water from the highest position; the submarine maintained its nose up most of the time when it rose in the head wave and down when it rose in the following wave. When the submarine rose in beam sea, the pitch angle before the submarine rose to the water surface was approximately the same as that when the submarine rose in static water; however, the pitch oscillated between 5.5 and 5.5 after falling on the water from the highest position. When the submarine rose in the head and following waves, the sail was under the water surface after the submarine submerged into the water from the highest position. When the submarine rose in beam sea, the water line was approximately the same as that when the submarine rose in static water. The rule of longitudinal motion for a submarine rising in the bow (quartering) wave is the same as that for the submarine rising in the head (following) wave; however, the effect of the bow (quartering) wave decays with the increase in the initial angle between the submarine centerline and the wave direction.
When the submarine rose in beam sea, the maximum roll angle was 4.43 times that of the submarine rising in static water, and the submarine rolling oscillated sinusoidally with an amplitude of 13 . The difference in the maximum roll angle between the submarine rising in the oblique wave and beam sea was below 6.3 . Here, for the submarine rising in the head and following waves, the roll and yaw before the submarine rose to the water surface was approximately the same as that when the submarine rose in static water; however, they rapidly increased after the submarine submerged into the water from the highest position, and the maximum roll angle was several times that when the submarine rose in static water.

Author Contributions

Q.C. and H.L. designed the research, Q.C. wrote the paper, Y.P. directed the design of the research, S.Z. performed the research, J.W. and Q.W. analyzed the data. All authors have read and agreed to the published version of the manuscript.

Funding

This research was funded by National Natural Science Foundation of China (No. 51779057, 51709061).

Conflicts of Interest

The authors declare no conflict of interest.

Abbreviations

The following abbreviations are used in this manuscript:
Bbuoyancy
B G metacentric height
C B , C G center of buoyancy, center of gravity
Dmaximum diameter of submarine model
F B body force
I x x , I y y , I z z , I x z inertial moments
I F inertial moments of form displacement
I b l o w n inertial moments of blown loads
I c a s i n g inertial moments of casing
Llength of submarine model
m F weight of form displacement
m b l o w n weight of blown loads
m c a s i n g weight of water in all casings
μ viscosity of water
μ w , μ a viscosities of water and air
O b x y z body-fixed coordinate system
O E ξ η ζ inertia-fixed coordinate system
p , q , r angular velocities in body axis
Ppressure
φ , θ , ψ roll, pitch, and yaw angles in inertial axis
ρ density of water
ρ u i u j ¯ Reynolds stress
ρ w , ρ a densities of water and air
R e = U L ν Reynolds number
R 0 position vector in inertial coordinates
r 1 vector representing a fluid particle in body axes
α w volume fraction of water in control volume
α a volume fraction of air in control volume
u , v , w velocity in body axis
Ufluid velocity
U i , u i mean and fluctuating velocity of fluid
Wweight
x B , y B , z B coordinates of C B in body axes
x G , y G , z G coordinates of C G in body axes

References

  1. Watt, G.D.; Bohlmann, H.J. Submarine rising stability: Quasi-steady theory and unsteady effects. In Proceedings of the 25th Symposium on Naval Hydrodynamics, St. Johns, NL, Canada, 8–13 August 2004; pp. 6–18. [Google Scholar]
  2. Watt, G.D. A quasi-steady evaluation of submarine rising stability: The stability limit. In Proceedings of the RTO-AVT Symposium on Advanced Flow Management, Loen, Norway, 7–11 May 2001. [Google Scholar]
  3. Watt, G.D. Modelling and Simulating Unsteady Six Degrees-of-Freedom Submarine Rising Maneuvers; Defence R and D Canada: Dartmouth, NS, Canada, 2007. [Google Scholar]
  4. Booth, T.B. Stability of buoyant underwater vehicles. Int. Shipbuild. Prog. 1977, 24, 297–305. [Google Scholar] [CrossRef]
  5. Chen, Q.; Li, H.; Pang, Y. Investigation of the excess roll problem of an emergent buoyantly rising submarine. J. Fluids Struct. 2019, 91, 102720. [Google Scholar] [CrossRef]
  6. Zhang, S.; Li, H.; Pang, Y. Experimental investigation on roll stability of blunt-nose submarine in buoyantly rising maneuvers. Appl. Ocean Res. 2018, 81, 34–46. [Google Scholar] [CrossRef]
  7. Bettle, M.C.; Gerber, A.G.; Watt, G.D. Unsteady analysis of the six DOF motion of a buoyantly rising submarine. Comput. Fluids 2009, 38, 1833–1849. [Google Scholar] [CrossRef]
  8. zhang, S.; Li, H.; Zhang, T. Numerical simulation study on the effects of course keeping on the roll stability of submarine emergency rising. Appl. Sci. 2019, 9, 3285–4149. [Google Scholar] [CrossRef] [Green Version]
  9. Gertler, M.; Hagen, G.R. Standard Equations of Motion for Submarine Simulation, NSRDC Report 2510. Available online: https://apps.dtic.mil/dtic/tr/fulltext/u2/653861.pdf (accessed on 25 November 2020).
  10. Feldman, J. DTNSRDC Revised Standard Submarine Equations of Motion, DTNSRDC/SPD-0393-09. Available online: https://apps.dtic.mil/dtic/tr/fulltext/u2/a071804.pdf (accessed on 25 November 2020).
  11. Menter, F.R. Two-equation eddy-viscosity turbulence models for engineering applications. AIAA J. 1994, 32, 1598–1605. [Google Scholar] [CrossRef] [Green Version]
  12. Jones, W.P.; Launder, B.E. The prediction of laminarization with a two-equation model of turbulence. Int. J. Heat Mass Transf. 1972, 15, 301–314. [Google Scholar] [CrossRef]
  13. Launder, B.E.; Sharma, B.I. Application of the energy dissipation model of turbulence to the calculation of flow near a spinning disc. J. Abbr. 1974, 1, 131–138. [Google Scholar]
  14. Shih, T.H.; Liou, W.W.; Shabbir, A. A new kε eddy viscosity model for high reynolds number turbulent flows. Comput. Fluids 1995, 24, 227–238. [Google Scholar] [CrossRef]
  15. Zhang, Z.R.; Hui, L.; Zhu, S.P.; Zhao, F. Application of CFD in ship engineering design practice and ship hydrodynamics. J. Hydrodyn. Ser. B 2006, 18, 315–322. [Google Scholar] [CrossRef]
  16. Hirt, C.W.; Nichols, B.D. Volume of fluid(VOF) method for dynamics of free boundaries. J. Comput. Phys. 1981, 39, 201–225. [Google Scholar] [CrossRef]
  17. Harlow, F.H.; Welch, J.E. Numerical calculation of time-dependent viscous incompressible flow of fluid with free surface. Phys. Fluids 1965, 8, 2182–2189. [Google Scholar] [CrossRef]
  18. Li, H.; Bui, V.A.; Dinh, T.N.; Sehgal, B.R. Numerical study on effects of the gas-coolant free surfaces on the droplet fragmentation behavior in coolants. In Proceedings of the 33rd National Heat Transfer Conference, Albuquerque, NM, USA, 15–17 August 1999; pp. 15–17. [Google Scholar]
  19. Fenton, J.D. A fifth-order stokes theory for steady waves. J. Waterw. Port Coast. Ocean Eng. 1985, 111, 216–234. [Google Scholar] [CrossRef] [Green Version]
  20. Fenton, J. Closure to “A fifth-order stokes theory for steady waves”. J. Waterw. Port Coast. Ocean Eng. 1987, 113, 438. [Google Scholar] [CrossRef]
  21. Aiguo, S.; Ming, W.; Bo, Y. Resistance calculation and motions simulation for free surface ship based on CFD. Procedia Eng. 2012, 31, 68–74. [Google Scholar]
  22. John, H.; Jared, G. Application of the unstructured chimera method for rapid weapons trajectory simulations. AIAA Aerosp. Sci. Meet. Exhib. 2007, 75. [Google Scholar] [CrossRef]
  23. Sosnowski, M.; Krzywanski, J.; Grabowska, K.; Gnatowska, R. Polyhedral Meshing in Numerical Analysis of Conjugate Heat Transfer. In EPJ Web of Conferences; EDP Sciences: Les Ulis, France, 2018; Volume 180, p. 02096. [Google Scholar]
  24. Salim, M.; Cheah, S.C. Wall y+ strategy for dealing with wall-bounded turbulent flows. Lect. Notes Eng. Comput. Sci. 2009, 2, 2165–2170. [Google Scholar]
  25. Mulvany, N.J.; Chen, L.; Tu, J. Steady-State Evaluation of Two Equation RANS Turbulence Models for High-Reynolds Number Hydrodynamic Flow Simulations; DSTO Platform Sciences Laboratory: Victoria, Australia, 2004; pp. 1–54.
  26. Hutchinson, B.R.; Galpin, P.F.; Raithby, G.D. Application of additive correction multi-grid to the coupled fluid flow equations. Numer. Heat Transf. 1988, 13, 133–147. [Google Scholar] [CrossRef]
  27. Schneider, G.E.; Raw, M.J. Control-volume finite element method for heat transfer and fluid flow using co-located variables, Part 1: Computational procedure. Numer. Heat Transf. 1987, 11, 363–390. [Google Scholar]
  28. Zhang, Z.; Guo, L.; Wei, P. Numerical simulation of submarine surfacing motion in regular waves. Iran. J. Sci. Technol. Trans. Mech. Eng. 2018, 44, 359–372. [Google Scholar] [CrossRef]
Figure 1. Coordinate systems used in the simulation.
Applsci 10 08403 g001
Figure 2. Geometry of submarine used in the simulation.
Applsci 10 08403 g002
Figure 3. Mesh of the overset region in the simulation: (a) Mesh of transverse plane in the vicinity of the submarine; (b) Mesh of symmetry plane in the vicinity of the submarine; (c) Mesh near the stern of the submarine; (d) Mesh near the sail of the submarine.
Applsci 10 08403 g003
Figure 4. Grid at centerplane of numerical water tank and refined regions.
Applsci 10 08403 g004
Figure 5. Design of numerical water tank.
Applsci 10 08403 g005
Figure 6. Effect of beam sea on the pitch of an emergent buoyantly rising submarine.
Applsci 10 08403 g006
Figure 7. Effect of beam sea on the submarine posture on water surface: a wave spreads from right to left . Red water surface indicates wave peak, whereas blue water surface indicates wave valley.
Applsci 10 08403 g007
Figure 8. Effect of beam sea on submarine transverse motion.
Applsci 10 08403 g008
Figure 9. Effect of head wave and following wave on the pitching motion.
Applsci 10 08403 g009
Figure 10. Position and posture of the submarine when experiencing the peak and valley of the head wave: the wave spreads from right to left. Red water surface indicates wave peak, whereas blue water surface indicates wave valley.
Applsci 10 08403 g010
Figure 11. Falling procedure of the submarine in the following wave: the wave spreads from left to right. Red water surface indicates wave peak, whereas blue water surface indicates wave valley.
Applsci 10 08403 g011
Figure 12. Effect of head and following waves on transverse motion.
Applsci 10 08403 g012
Figure 13. Effect of oblique wave behavior of emergent buoyantly rising submarine.
Applsci 10 08403 g013
Figure 14. Posture of the submarine rising in bow wave: the wave spreads from right to left. Red water surface indicates wave peak, whereas blue water surface indicates wave valley.
Applsci 10 08403 g014
Figure 15. Posture of the submarine rising in a quartering wave: the wave spreads from left to right. Red water surface indicates wave peak, whereas blue water surface indicates wave valley.
Applsci 10 08403 g015
Table 1. Mechanical Characteristics of Submarine.
Submarine PropertyValue
Length5045.2 mm
Width812.8 mm
Height958.6 mm
Maximum Diameter812.4 mm
m F 1147.2 Kg
x F 223.8 mm
y F 0 mm
z F −9.4 mm
B G ¯ 13.65 mm
I F ( x ) 57.2 Kg · m 2
I F ( y ) 2813.2 Kg · m 2
I F ( z ) Kg · m 2
I F ( x z ) 0.77 Kg · m 2
m c a s i n g 244.4 Kg
x c a s i n g 155.4 mm
y c a s i n g 0 mm
z c a s i n g −127.3mm
I c a s i n g ( x ) 17.5 Kg · m 2
I c a s i n g ( y ) 665.2 Kg · m 2
I c a s i n g ( z ) 650.8 Kg · m 2
m b l o w n 44.89 Kg
x b l o w n 400 mm
y b l o w n 0 mm
z b l o w n −13.3 mm
I b l o w n ( x ) 2.63 Kg · m 2
I b l o w n ( y ) 245.2 Kg · m 2
I b l o w n ( z ) 248.6 Kg · m 2
Table 2. Uncertainty analysis when the submarine rises in static water.
MeshNumber of Cells φ max ( ) θ max ( )
Coarse mesh1.25 million5.8620.25
Medium mesh3.53 million6.6118.73
Fine mesh10.37 million6.5918.70
Table 3. Initial conditions for all the simulations.
No.Submarine StationWave StationWave Angle
1baseline depth: 4 m
metacentric height: 13.65 mm
m b l o w n : 44.89 Kg
x b l o w n : 400 mm
static water
2wave height: 0.4 m
wave length: 15 m
0
3 30
4 60
5 90
6 120
7 150
8 180
Publisher’s Note: MDPI stays neutral with regard to jurisdictional claims in published maps and institutional affiliations.

