1. Introduction
Internet traffic is expected to grow steadily at a rate of about 25% per year by 2022 [
1]. This increase is the result of the new applications’ demands such as cloud computing, Internet of Things (IoT), and fifth generation (5G) networks. Mobile networks are expected to contribute the largest share (50%) of this projected traffic increase [
2] pushing technological changes. A significant amount of this traffic will remain ‘local’ in that it will not be transmitted to remote network locations. Moreover, due to the explosion of traffic data generation coming from many new applications, the access and metropolitan networks will be stressed significantly. In such an environment, there is a need for dynamic and flexible operation and cooperation of these network domains.
Traditionally, the metro, access and mobile networks operate statically and separately. The optical paths (lightpaths) of metropolitan and core optical networks transfer traffic from the IP routers located on their edges, offering connectivity to mobile and access networks. During the lifetime of a lightpath, its quality of transmission (QoT) decreases for a number of reasons: ageing of equipment, increased interference due to new connections, equipment degradation/failures, etc. To this end, optical paths are installed with unfavorable network conditions (“high margins”) in order to operate statically and safely for many years during which real conditions will deteriorate [
3]. Also, due to the static operation of the optical networks, network replanning is needed in order to serve the growing capacity requirements. This includes installation of new equipment and re-configuration of existing devices [
4], resulting in increased capital (CAPEX) and operating costs (OPEX). Overall, the static network operation, the overestimation of the requirements of the optical physical layer, as well as the isolated operation of the different parts of the network, are extremely inefficient. Significant benefits, in terms of capacity and cost, can result from the reduction of “margins”, the dynamic operation of optical networks [
5,
6] and the co-design and co-operation of the different network parts [
4,
7].
Innovative network technologies such as software defined networks (SDN) and network function virtualization (NFV) can enhance efficiency and reduce CAPEX and OPEX costs. SDN is a control framework that provides programmability of network functions and protocols by decoupling the data plane and the control plane. With SDN, network intelligence and state information are logically centralized within controllers. SDN is expected to play a crucial role in the design of future wired and wireless networks, providing dynamic capacity allocation, on demand adaptation of connections, and rerouting of traffic according to network and application characteristics. SDN-based advances have been presented for the joint orchestration of different network and computing domains. The authors in [
8] present an OpenFlow based SDN unified control plane for the integration of heterogeneous state-of-the-art optical and packet transport domains. In the same context, the authors in [
9] apply hierarchical SDN controllers for the orchestration of heterogeneous (Ethernet, OpenFlow/GMPLS) network domains. Multi-domain orchestration was also presented in other works, with orchestrators able to jointly manage cloud and networking resources, operating over multi-layer and multi-domain network controllers [
10]. In [
11], hybrid electrical–optical switching and elastic optical network interconnection technologies are put under a common orchestration framework, providing intra-datacenter and inter-datacenter dedicated capacity in real time. In [
12], an SDN platform is developed supporting reconfigurability over converged fiber–wireless network resources.
At the same time, NFV enables the virtualization of the functions of mobile networks that are traditionally implemented with expensive and specialized (proprietary) equipment. NFV makes network functions available as software that can run in private data centers or in the public ‘cloud’. These functions are deployed easily, quickly and economically [
13]. In this context, open application programming interfaces (APIs) make the network dynamically programmable. In the optical access network, significant benefits arise from the virtualization of equipment in the telephone exchange (Central Office—CO), e.g., virtualization of the optical line termination (OLT) terminal via NFV and by scheduling operations via SDN [
14].
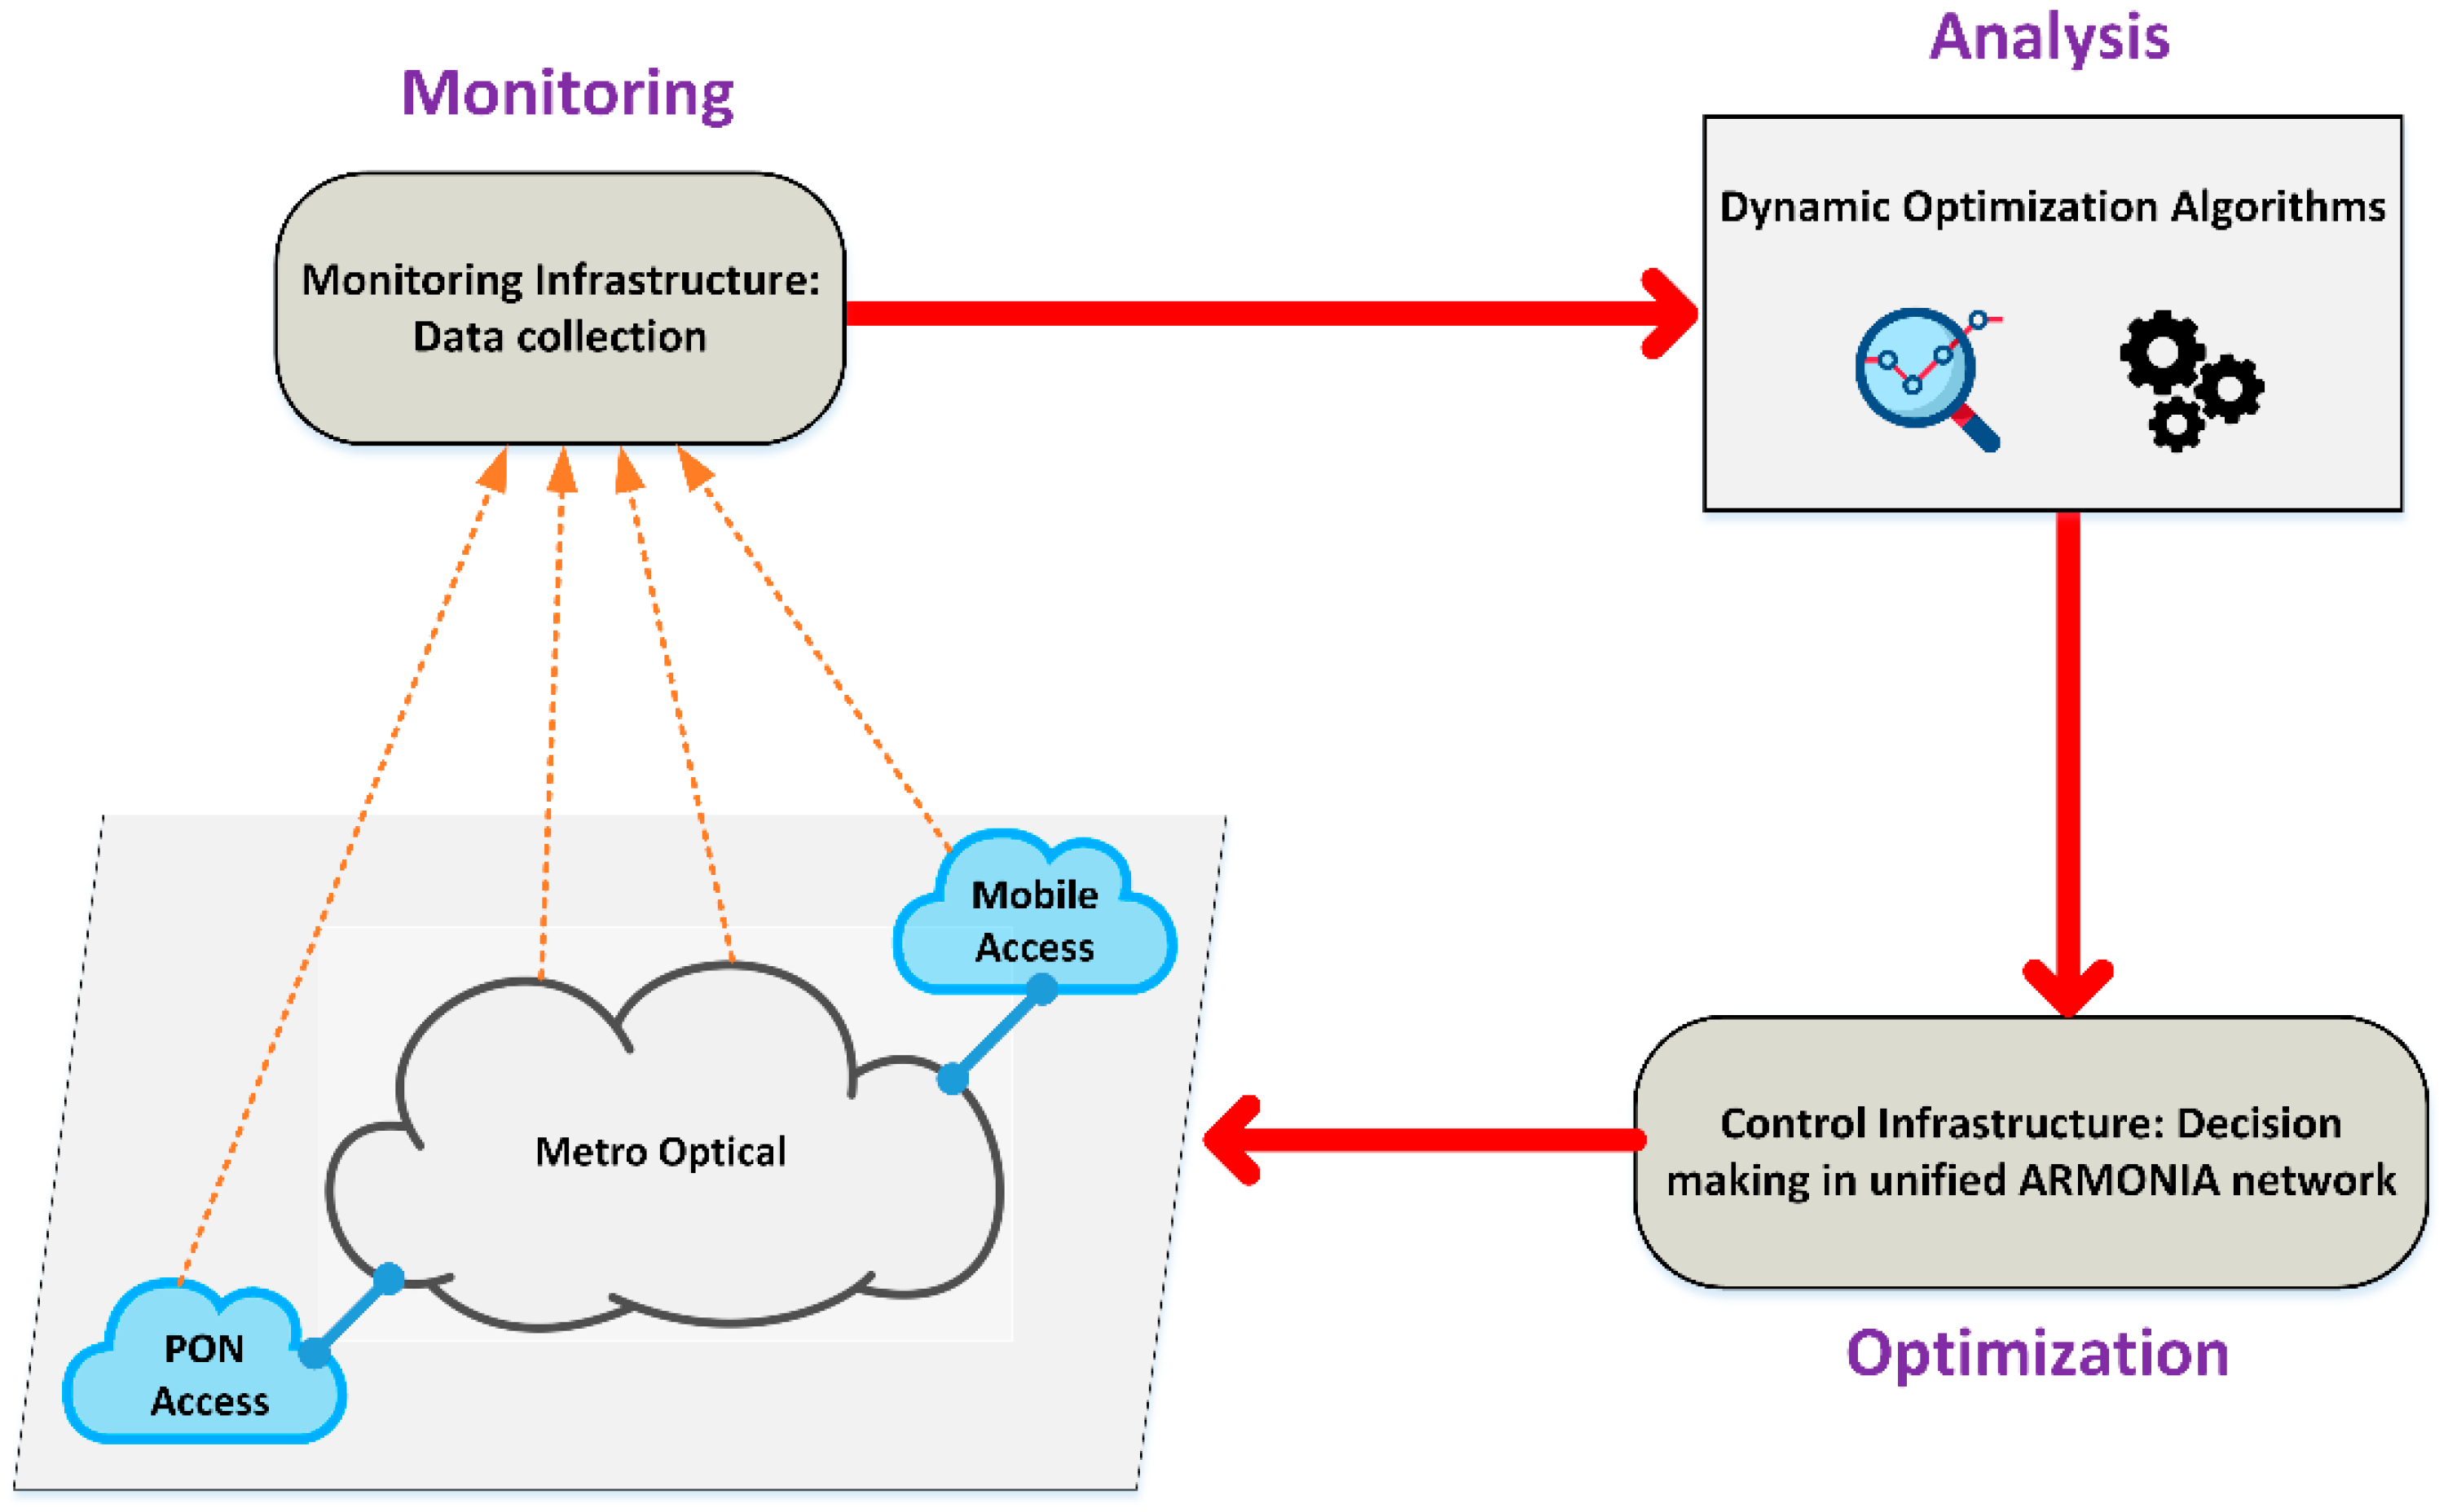
SDN and NFV technologies, when combined with appropriate monitoring mechanisms, also enable the dynamic network operation. These mechanisms allow the network to continuously observe its state in terms of the physical layer and traffic conditions. Moreover, through SDN and NFV technologies, the different parts of the network (mobile, access, metropolitan) are integrated and jointly operated. This multiplies the benefits of the dynamic operation of each individual segment. Leveraging the aforementioned technologies, we propose the Self-Adjusting Unified Metropolitan and Access Network (ARMONIA). ARMONIA is able to monitor its condition, analyze it, and perform (almost real time) optimizations. The optical and IP equipment of the metropolitan and access networks are jointly controlled through a closed control loop operation, utilizing SDN and NFV technologies (
Figure 1). In
Section 3, we present some relevant algorithms that perform dynamic optimization. Moreover, in [
15] we demonstrated a scenario where the network is optimized in near real time in the context of an athletic event that causes unexpected traffic spikes.
2. ARMONIA Architecture
Existing network infrastructures are based on a three-tier hierarchy. The top level of the hierarchy consists of the core networks, which provide increased capacity and high-speed interconnection between the individual networks of the second level. The core networks use very long-distance fiber optic links and are designed to operate at country and/or continent level. The metropolitan networks are located at the second level of the hierarchy. They connect the access networks with the core networks covering areas of the order of a few tens of kilometers. In essence, metropolitan networks connect nodes on an urban or regional scale. At the lower level of the hierarchy, access networks are placed to provide connectivity to several users through various technologies.
2.1. Description of ARMONIA Network
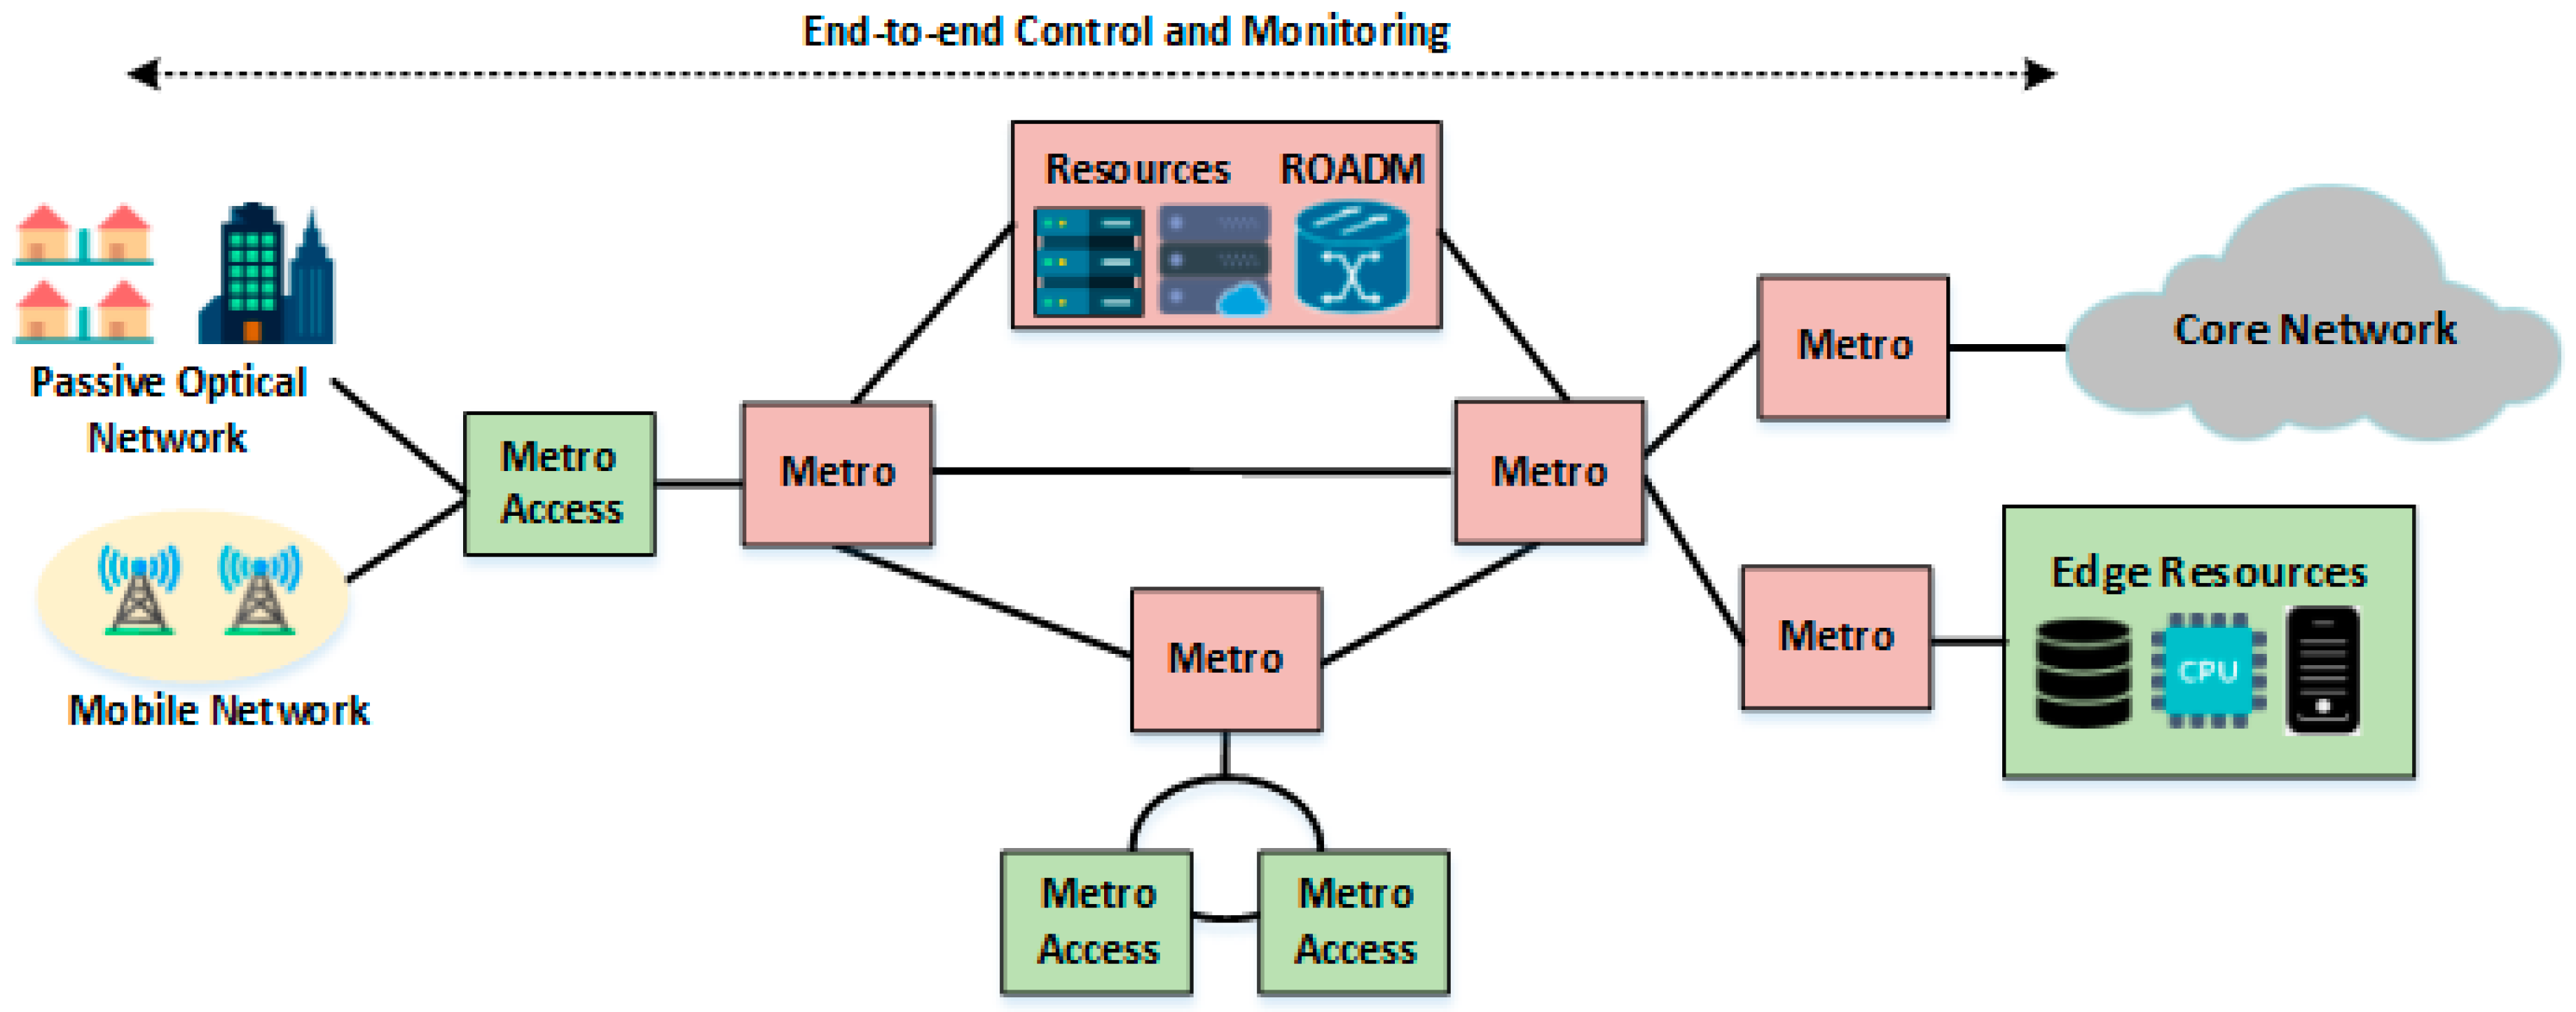
In
Figure 2, we present the general architecture of the unified and self-configured ARMONIA network. The data plane includes the metropolitan optical network, the mobile and the passive optical access (PON) networks. Access networks collect the traffic generated by users (fixed and mobile), homes, and businesses and forward it to the metropolitan network. From there, the traffic is transported to the respective destination either within the same metropolitan network or to another remote destination via the core network. The architecture at the data plane is complemented by the appropriate IP routers placed at the edges. These routers collect traffic from access networks, while there is at least one node that acts as a gateway to the network infrastructure.
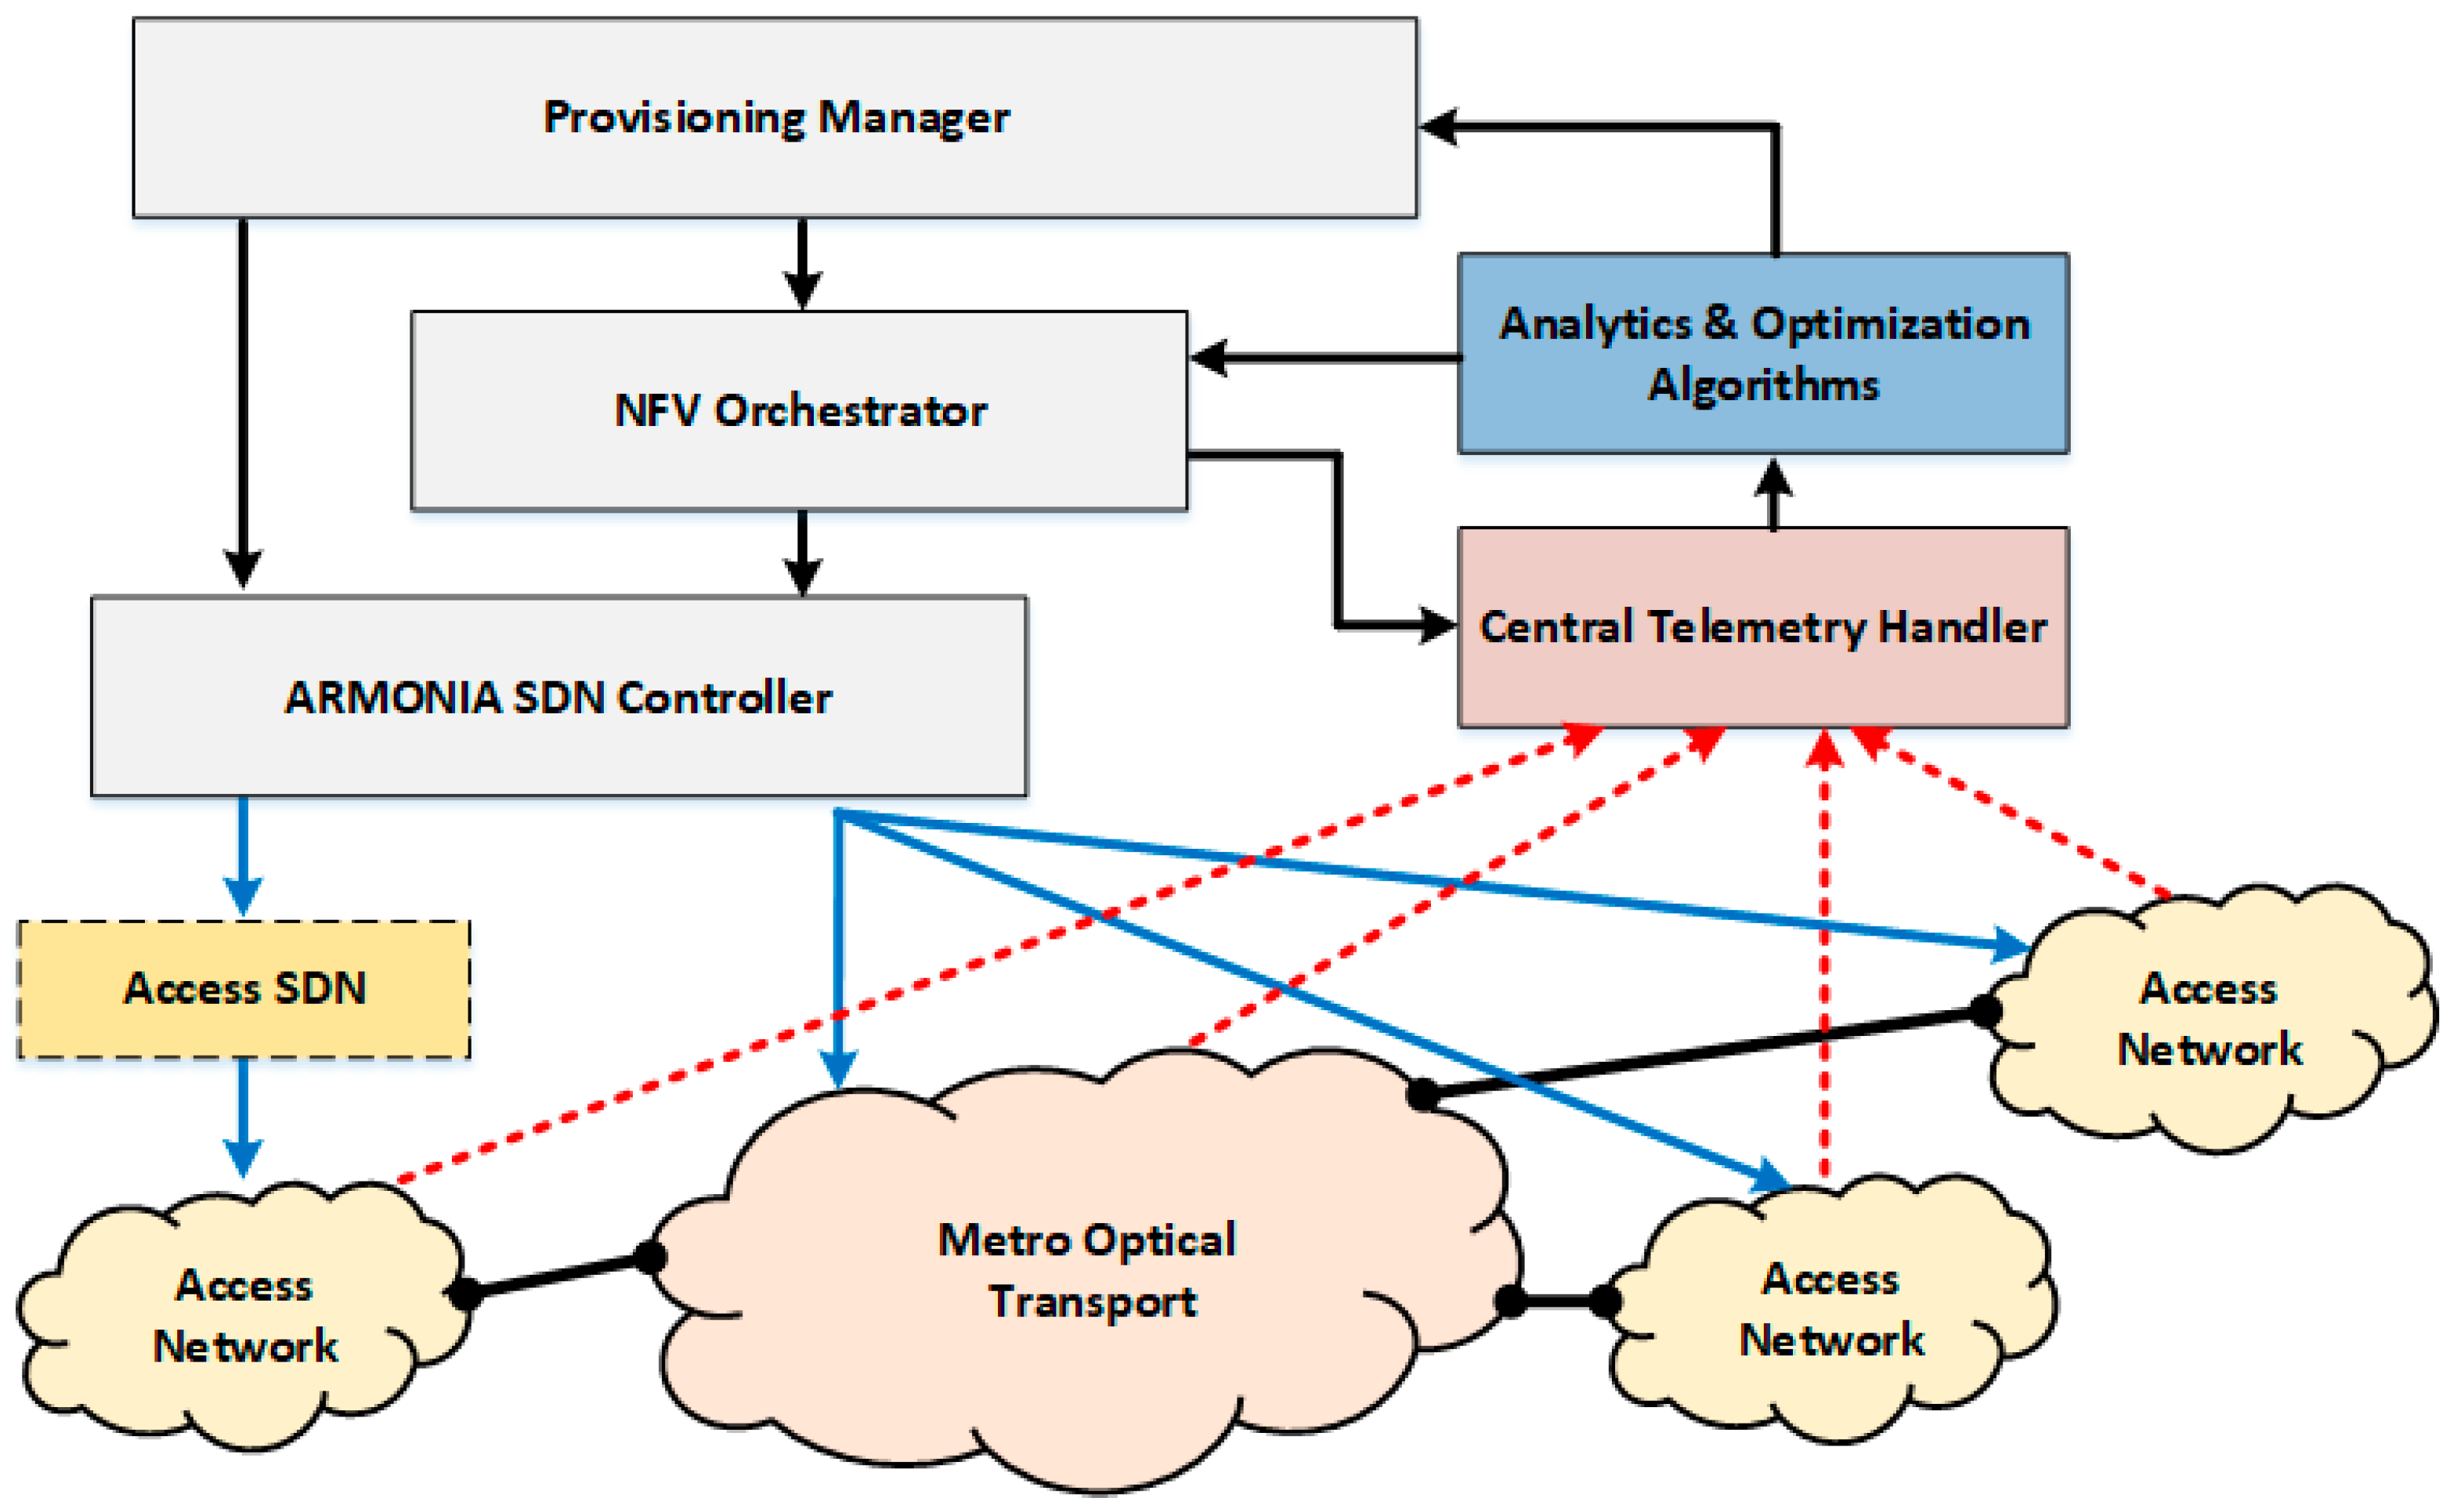
ARMONIA’s goal is to transform existing network infrastructures through their effective integration into an overall control and management infrastructure (
Figure 3). In this way, the metropolitan and access network segments will be dynamically and jointly operated. At the same time, their management can be centralized, using information from the actual state of the overall network infrastructure, and not only individual local information. The convergence and joint supervision of the access and metropolitan networks enables dynamic optimization of their respective resources. Hence, critical changes in the status of a segment can be detected immediately and appropriate actions can be simultaneously executed in any other network segment. Furthermore, the algorithms that analyze the monitoring information facilitate proactive network reconfiguration in order to offer consistent quality of service.
To implement these functions, the architecture of ARMONIA includes the appropriate control and monitoring planes (
Figure 3). The control plane is based on the principles of software defined networking (SDN). The provisioning manager governs the behavior of the network in response to the changing network conditions and in accordance with the applications’ network requirements. It is responsible for the interaction of control, management and monitoring modules, namely (i) the ARMONIA SDN controller, (ii) the central telemetry handler, and (iii) the analytics and optimization algorithms. The ARMONIA SDN controller is responsible for network provisioning and re-configuration within the ARMONIA unified network infrastructure. The controller interfaces, primarily through the network configuration (NETCONF) protocol, with underlying network segments that utilize several networking technologies. ARMONIA supports two different deployment models: (i) the fully centralized model, where a central SDN controller operates on top of the unified network and (ii) the hierarchical model, where there is a set of domain/segment specific SDN controllers that cooperate with the ARMONIA controller. The hierarchical approach complies with the ITU G.7702 standard [
16] and the IETF Abstraction and Control of Traffic Engineering Networks (ACTN) framework [
17]. Both describe a hierarchy of SDN controllers that enable multi-domain coordination to support end-to-end services. Moreover, it is considered to be the most appropriate choice for production deployments since it ensures scalability, flexible control of the traffic, and dynamic configuration of the available network devices.
Through the coordinated operation of the provisioning manager, the central telemetry handler, and the central SDN controller the ARMONIA network is able to perform the necessary actions to create new connections, to optimize existing ones, to configure monitoring devices, and to manage the recovery of a problematic connection (e.g., by rerouting or reconfiguring transmission parameters). In combination with the central SDN controller, the architecture includes a network function virtualization orchestrator (NFV Orchestrator) for the installation and management of virtual network services. In order to ensure the optimal installation and the dynamic reconfiguration of these services, the NFV Orchestrator interconnects and cooperates with the SDN-based control plane, gaining also access to the status information of the overall network infrastructure.
Through ARMONIA’s innovative architecture, the network is able to intelligently monitor its state, correlate the monitoring information to gain insight into its inefficiencies, and use this knowledge to re-optimize its state. The monitoring plane contains a number of enhanced telemetry agents that specialize in monitoring specific network devices from all network segments. The central telemetry handler is placed at the root of the hierarchical telemetry tree and contains details for the overall infrastructure. The number of telemetry agents may vary depending on the size of the network, geographical features, and/or any other criteria. The enhanced telemetry agents collect, pre-process, and correlate telemetry information at the local level. The information is then aggregated and forwarded to the central telemetry handler where it can be used by the provisioning manager and by analytics and optimization algorithms to allocate more efficiently the available resources and trigger automatic re-optimization operations. ARMONIA’s monitoring plane provides the following telemetry information: (a) physical layer monitoring data, including: transmitted/received optical signal power, optical spectrum, and pre-forward error correction (pre-FEC) bit error rate (BER) and optical signal-to-noise ratio (OSNR) at the receiver side; (b) packet layer monitoring data, including packet flows, jitter, delay; and (c) computation and storage resources monitoring data.
2.2. ARMONIA Metropolitan Network
A metropolitan network is the main part of the ARMONIA’s overall network infrastructure. Metropolitan and core optical networks in recent years are usually based on elastic optical networks (EONs) [
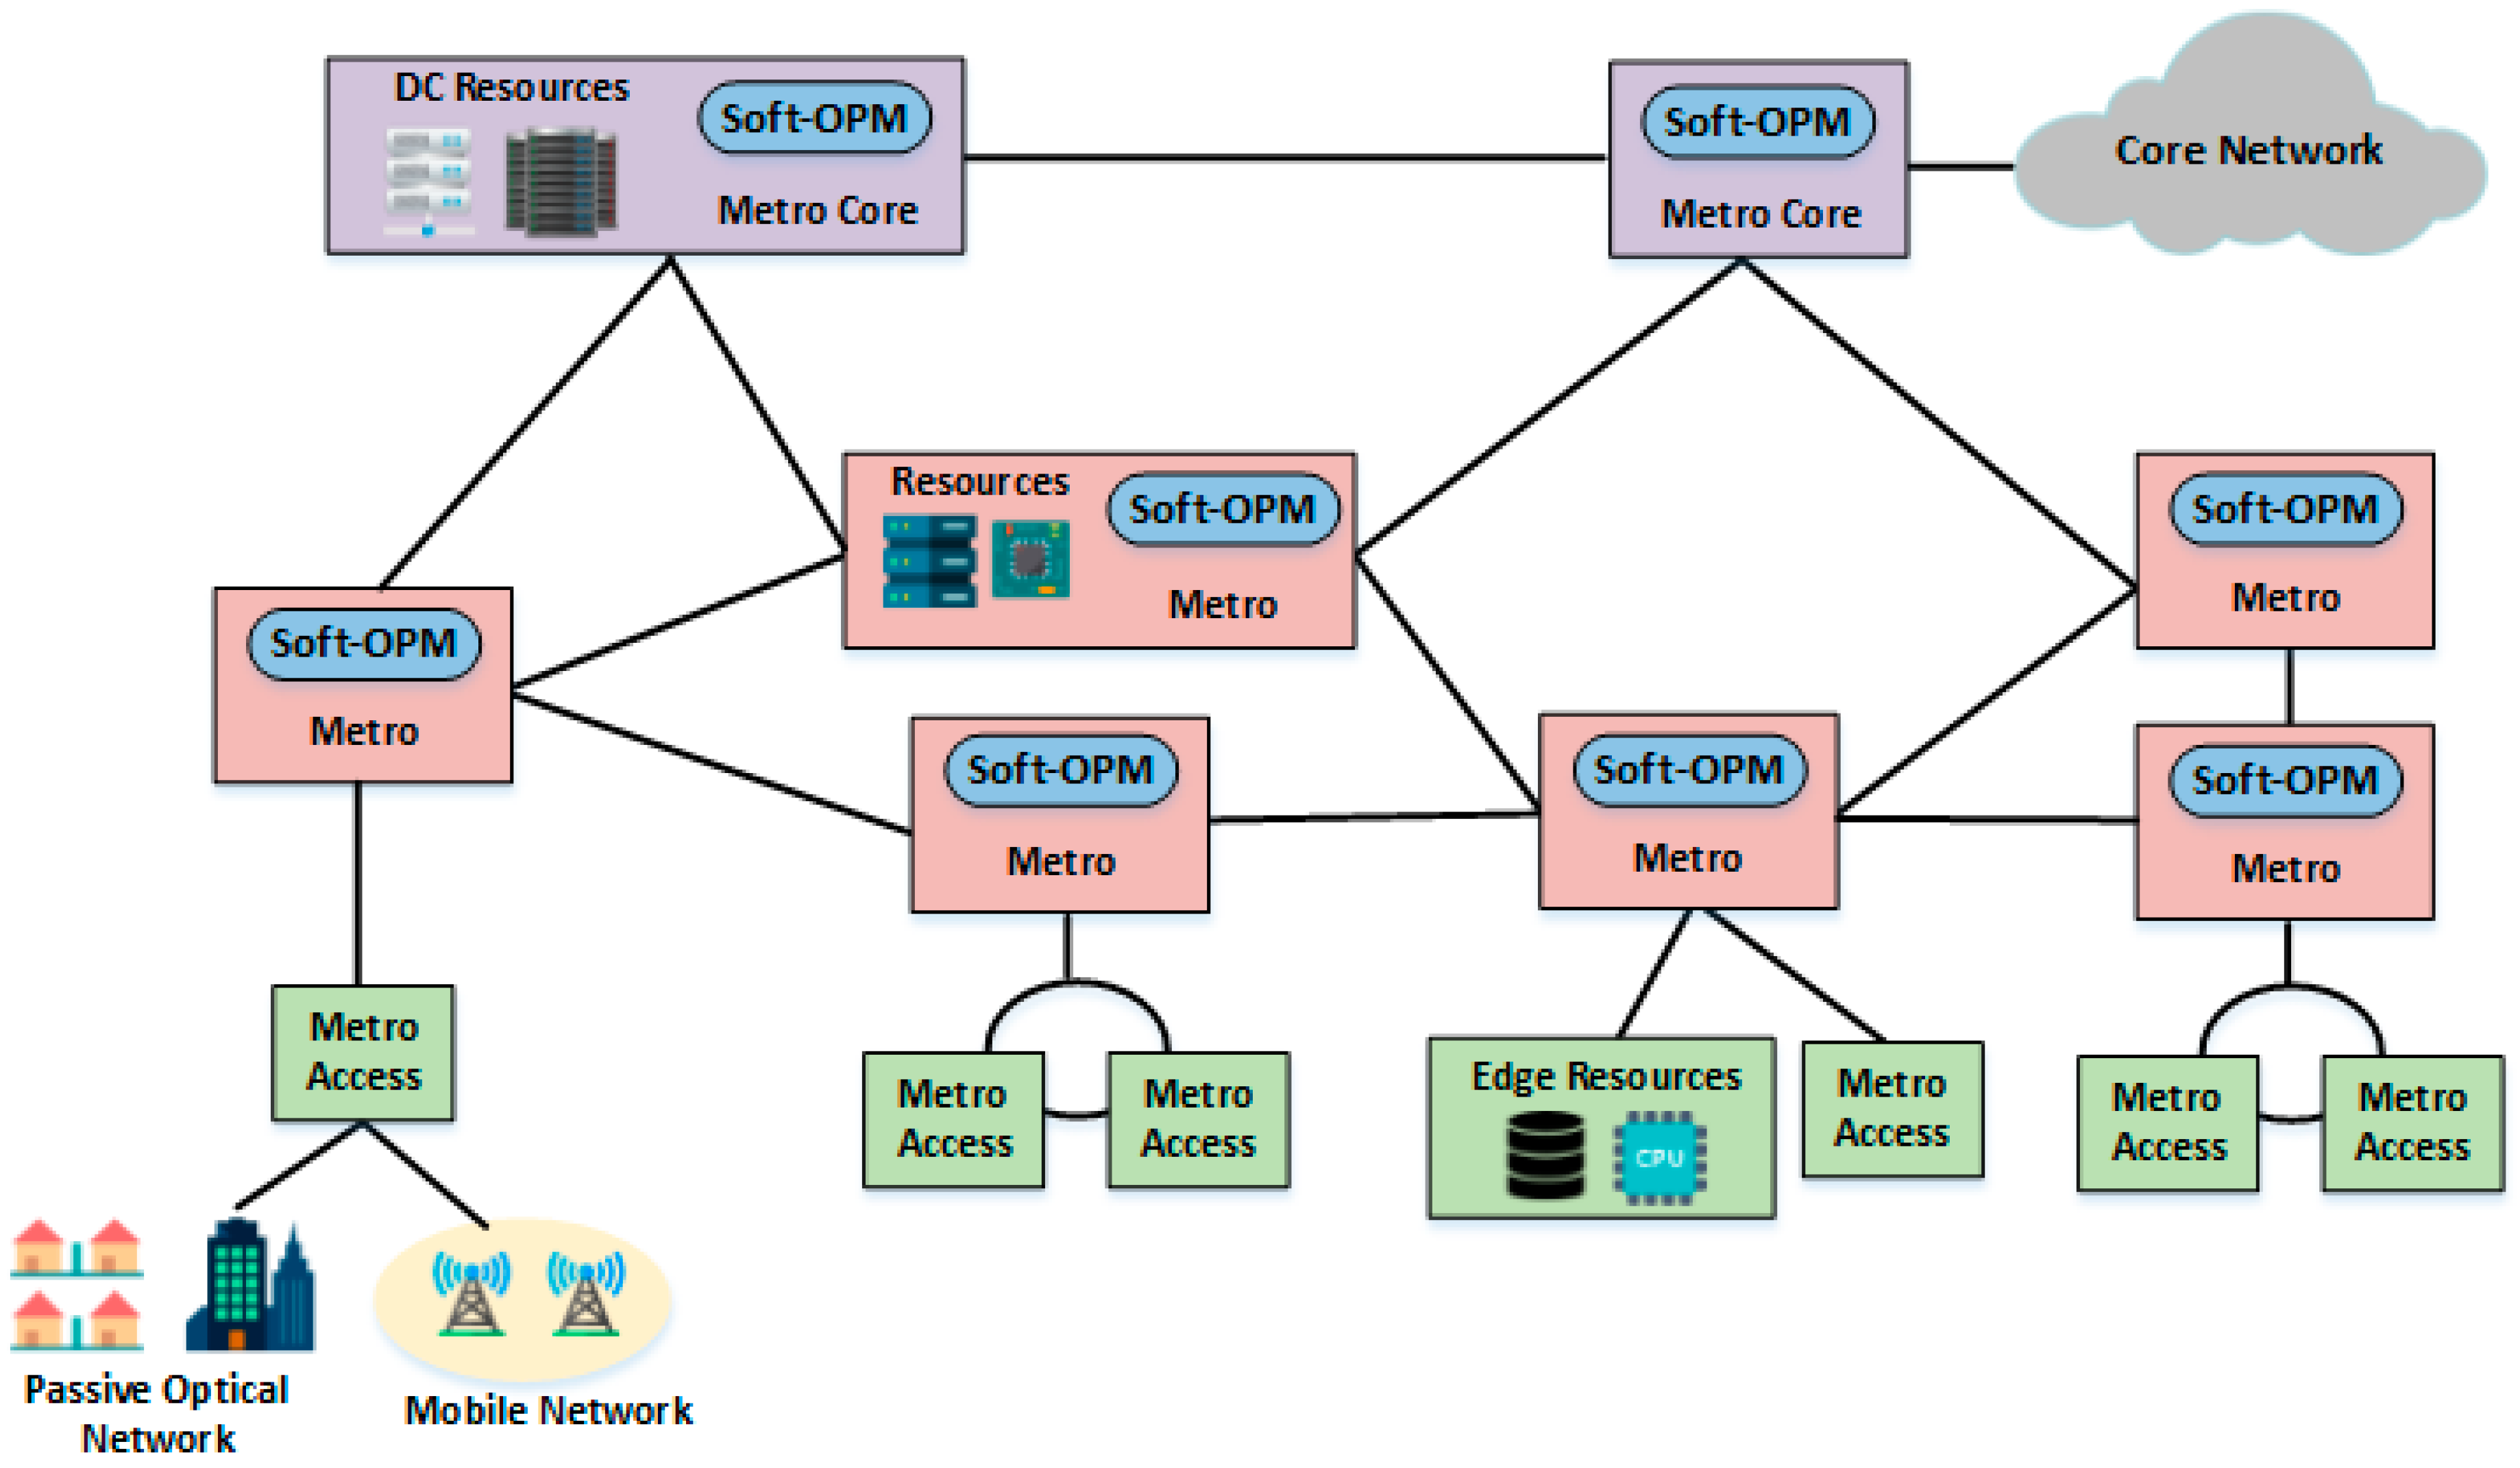
18]. EONs are an evolution of WDM (wavelength division multiplexing) technology, providing resource (spectrum) flexibility and efficiency. ARMONIA considers a general-purpose elastic optical network, equipped with coherent receivers. In order to serve more efficiently the high access demands, the metropolitan network is organized into hierarchical layers (
Figure 4). The exact number of these layers may depend on several parameters such as the coverage area, the number and distribution of users, the traffic characteristics, the capabilities of the networking devices, and other factors.
The nodes of the lower layer, the metro access nodes, are typically co-located with the OLT nodes inside the operators’ central offices and are organized in ring and mesh topologies. In the intermediate metro layers, the supported transmission rates increase as more powerful transceivers are employed to transfer the aggregated traffic. The higher layers of the metro infrastructure consist of fewer nodes, namely the metro core nodes, and are organized in mesh topologies. Internet traffic from access networks (wired-PON or wireless-4G/5G) is concentrated on IP routers connected to metropolitan access nodes. The traffic is then transferred to the main intersections of the metropolitan network in order to be routed to the final destination. Traffic can also be forwarded through an IP router directly to a key node of the metropolitan network.
The use of coherent receivers at the nodes of the ARMONIA network provides real-time monitoring capabilities. Potentially, each receiver in the network can be extended almost for free (through software) to act as an optical performance monitor (soft-OPM). Therefore, a rich amount of information can be leveraged to make dynamic optimization decisions. These monitors can be accessed by the SDN controller through the NETCONF protocol following the network disaggregation model. In disaggregated optical networks, which are recently gaining consensus, networking hardware can be provided by multiple vendors, avoiding vendor lock-in. In addition, open and standardized interfaces (OpenConfig [
19] and ONF Transport API [
20]) based on Yet Another Next Generation (YANG) modeling enable vendor-neutral provisioning, monitoring, and resource management operations.
An increasing number of telecommunications providers are gradually introducing datacenters into their network infrastructure and especially in the metropolitan area. Generally, the nodes near the edge of the network provide lower layer computation and storage resources while the metro core nodes support higher layer ones. Hence, a hierarchical computing infrastructure is created that provides the necessary capacity for the creation of virtual network infrastructure (NFVI) services. This infrastructure is interconnected with high-speed optical connections through the metropolitan network.
2.3. ARMONIA Access Networks
Passive optical networks (PONs) are adopted worldwide as the most efficient way to extend the optical fiber deep into the access network. Using PONs, multiple clients share the interface between the central office (CO) and the provider’s metro network, as well as the optical fibers of the distribution network. PONs reduce the capital and the operational (energy) costs of the equipment, since they are based on passive components. The ARMONIA architecture supports a number of different types of PONs, handling the technological heterogeneity of the existing infrastructures and supporting their smooth upgrade. In particular, ARMONIA leverages PON networks based on optical line terminal (OLT) devices that support either the NETCONF protocol or can be controlled through a dedicated access network controller that exposes the appropriate northbound interfaces (e.g., through NETCONF, RESTCONF). In addition, ARMONIA is able to integrate mobile access networks that support software defined networking principles.
3. ARMONIA Algorithmic Mechanisms
In the previous sections, we described the architecture of the ARMONIA network and its vision regarding the unified operation of the access and the metro segments. In this section, we present mechanisms that enable its dynamic and efficient operation.
3.1. QoT Estimation for Metro Networks
It is to the network operator’s advantage to estimate the Quality of Transmission (QoT) of a new lightpath before its establishment or before modifying an existing one for a number of reasons: (a) avoid a trial-and-error approach of establishing several lightpaths; (b) reduce the operating margins, and thus reduce network costs; (c) enable the dynamic operation of the network, by estimating the QoT of a candidate set of reconfigured lightpaths.
Many recent research papers have studied various methods to estimate the QoT using machine learning (ML) [
21]. There are a number of different approaches for the task at hand. One is to leverage QoT data (e.g., from OPMs) to train an agnostic (in terms of the transmission model) ML algorithm. The algorithm can either estimate a raw QoT value (regression) [
22], or estimate whether a lightpath has acceptable QoT (classification) [
23]. Another approach is to leverage QoT data to improve the accuracy of the parameters’ values of an existing QoT model based on theoretical formulas [
22,
24].
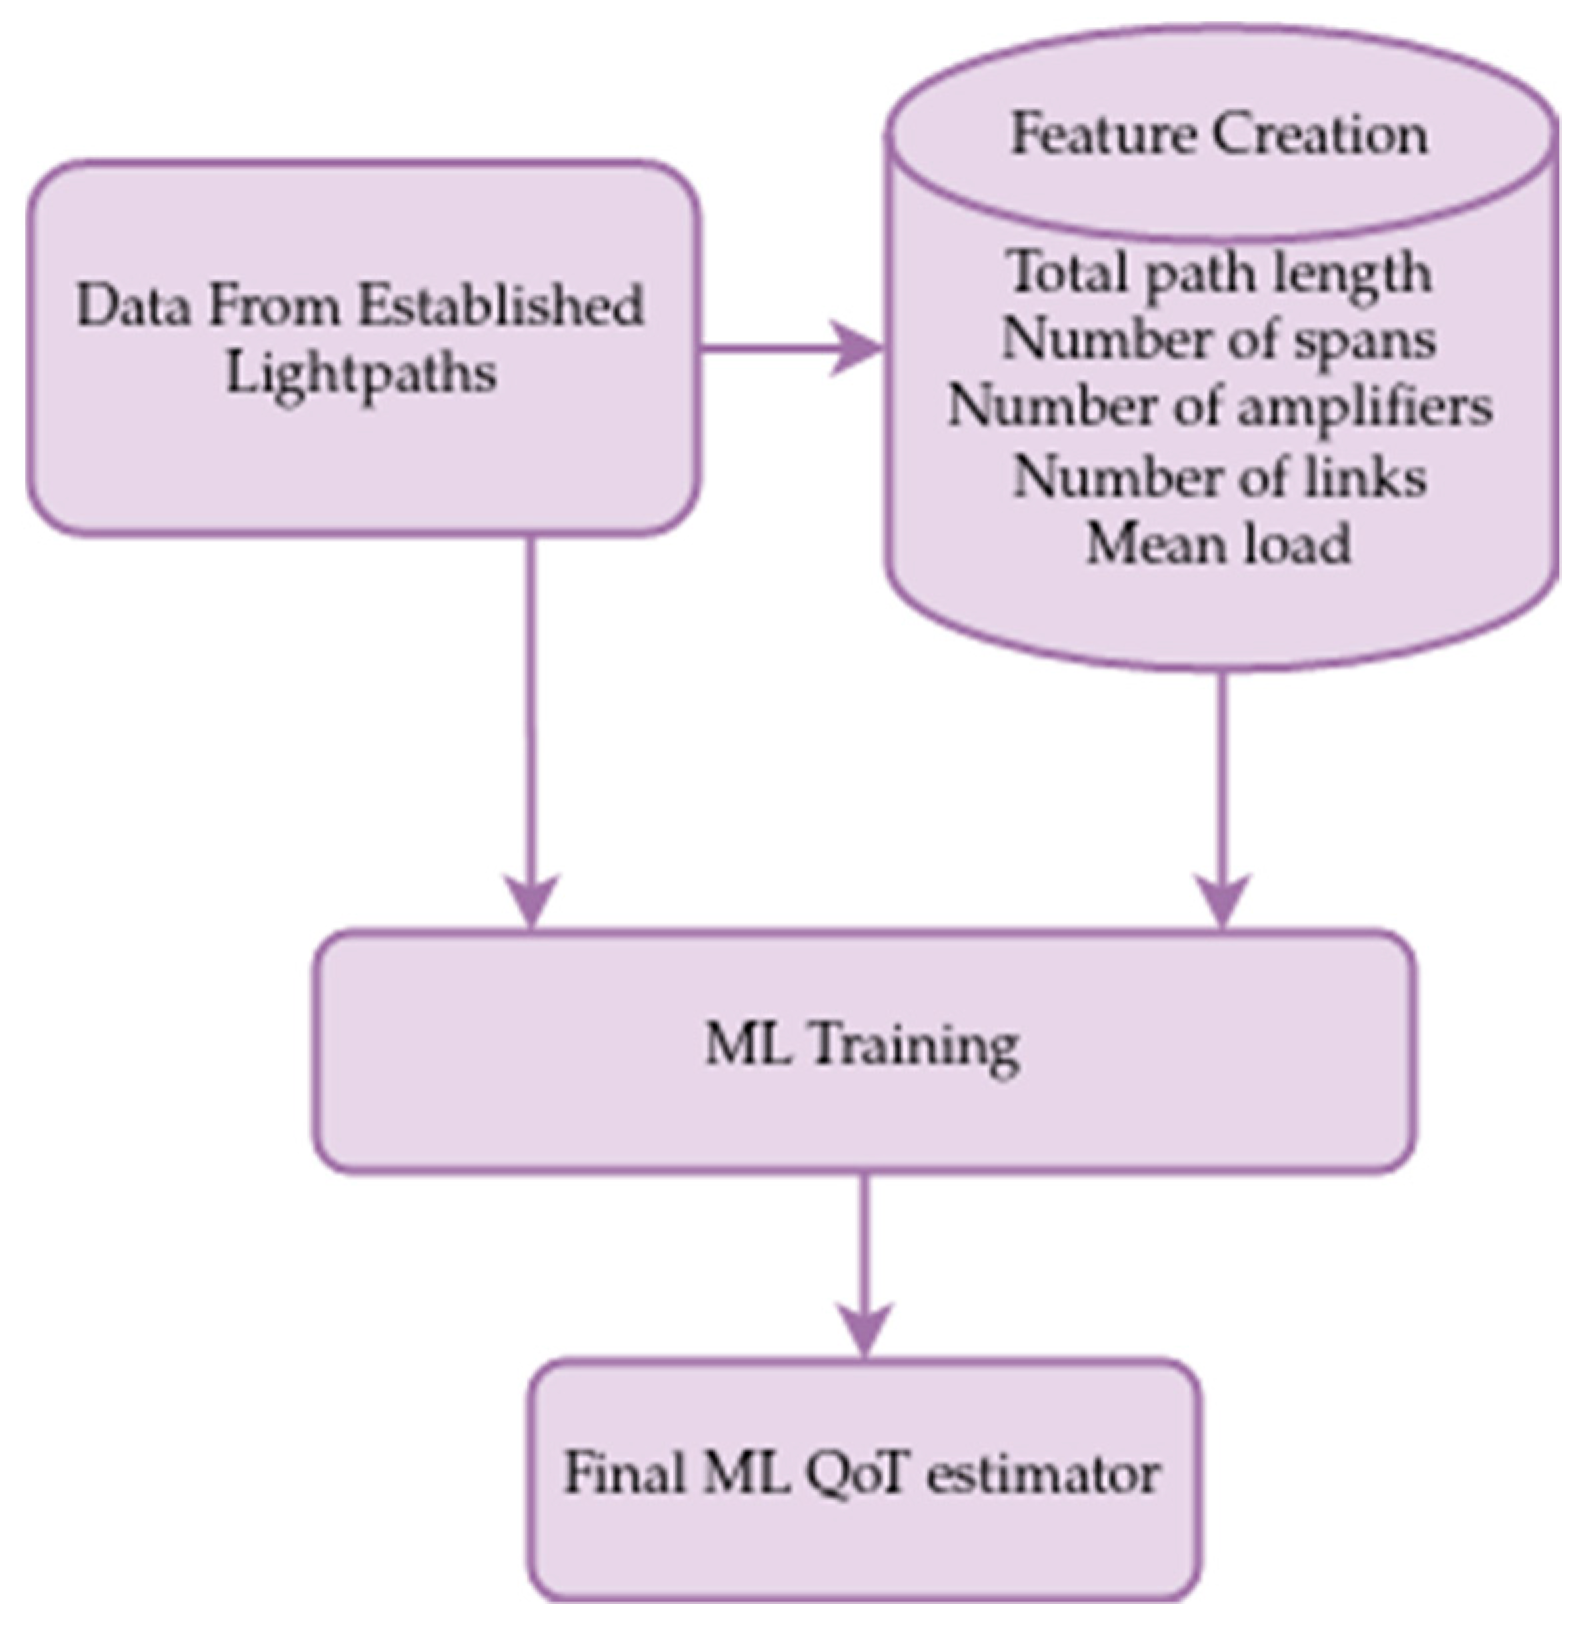
In our work, we designed a ML QoT estimator (
Figure 5) that takes into account the specific characteristics of the metro topologies such as flexible amplifier placement (some spans may not have an amplifier), and high number of links that make it difficult to acquire sufficient training data. We consider the following features for each lightpath: number of spans, number of amplifiers, number of links, total path length, baud rate, and the mean load of a lightpath’s links. We employ both the number of spans and the number of amplifiers, because in metro networks links’ lengths are shorter than in core networks, and some spans may not have amplifiers. We also consider the number of links that a path contains, to capture the intermediate (e.g., insertion) losses that Reconfigurable Optical Add/Drop Multiplexers (ROADMs) and other devices may incur. We use the load metric to approximate the actual load of the network, instead of making a worst-case assumption for the nonlinear noise when all the neighboring channels are utilized. We avoid the use of individual features for each link of the network. In this way, the proposed ML algorithm can be adequately trained even with small sized training data. Therefore, the proposed algorithm can provide an estimation of the QoT of a new lightpath, even in the absence of training samples for some links.
The objective of the proposed ML algorithm is the estimation of the lightpath’s SNR. To do so, we use linear regression to train the ML model, assuming that the inverse of the SNR is approximately additive per link (GN model [
25]). After the estimation of the SNR, the BER can be calculated by taking into account the modulation format of each lightpath. The BER is in turn compared to a threshold specified by the selected forward error correction (FEC) code. The result of this comparison is used to determine whether a lightpath is acceptable or not. We used the GN model to approximate the behavior of the physical layer and obtain the SNR estimates of certain lightpaths. These SNR estimates are in essence the synthetic data that the ML model will leverage for training. More specifically, we used Equations 120 and 127–129 of [
25] to calculate the power spectral density (PSD) of the non-linear noise. Then, we used Equation 15 to calculate the PSD of the amplified spontaneous emission noise, and Equation 11 to obtain the SNR. In practice the estimator can use the actual monitoring values from the OPMs for the training purposes. In
Section 4, we describe the GN model parameters we considered to generate the data and we examine the accuracy of the QoT estimator.
3.2. Network Slice Requirements Prediction
The evolution of 5G networks marked the introduction of network slicing. Network slicing embeds different logical networks on the same physical network infrastructure. Each network slice is an isolated end-to-end network that leverages a subset of the physical network resources. Each slice is tailored for diverse and stringent application requirements, in terms of latency, capacity, and other parameters. A number of previous works focused on the task of resource allocation for network slicing [
26,
27,
28]. More recently dynamic network slicing has received increased attention [
29,
30,
31,
32,
33,
34]. A basic idea is to leverage a traffic predictor to estimate the future demands of the slices in order to perform dynamic resource allocation.
Different timeframes can be selected for the prediction—e.g., over hours or days—depending on its purpose. A dynamic slicing management during the day requires a mechanism that can predict the traffic volume of the next e.g., few hours. The traffic prediction in this timeframe could be useful in scenarios of large volume variations e.g., during a popular athletic event, resulting in efficient resource allocation. The continuous slice adaptation during the day is however questionable: on the one hand, the network will be able to continuously adapt to the current conditions. On the other hand, the continuous parameter adaptation will increase the network management burden and even lead to misconfigurations. Another solution could be to perform traffic forecasting on longer timeframes and slowly adapt the network to the predicted conditions. This would incur a lower control plane overhead, but would result in a higher resource overprovisioning compared to the first alternative. In any case, traffic forecasting in longer timeframes is still better than static overprovisioning or dynamic overprovisioning, where no traffic prediction is performed, but the resource allocation is adapted based on static or dynamic rough estimates of the required resources.
In our work, we consider a traffic prediction algorithm that can estimate the requirements of a slice in a daily timeframe. More specifically, we assumed that the daily traffic volume consists of discrete values of traffic volume per, e.g., 10 min. The traffic prediction algorithm takes as input the traffic volume of a number of previous days, and outputs the prediction for the whole following day. We assume that this process is executed on a daily basis. The predicted traffic volume for each slice is then given to the resource allocation algorithm to plan the network for the respective demands.
The literature on short-term traffic forecasting covers a broad spectrum of research areas, including linear and non-linear methods [
35,
36,
37,
38]. Linear mechanisms include statistical approaches such as ARIMA and Prophet, whereas non-linear include machine learning algorithms such as multilayer perceptrons (MLPs) and recurrent neural networks (RNNs). In this work, we considered two different traffic prediction algorithms, the first is based on long short-term memory networks (LSTMs) [
35], and the second on Prophet [
36]. LSTMs are a type of RNNs. In conventional neural networks the adjacent layers may be fully connected, but there are no connections between the nodes of a given layer. RNNs have hidden states by which previous outputs can be used as inputs. In this way, the relationship between current and past input can be modeled. However, if a sequence is long enough, they tend to forget the information from earlier time steps; this is known as the vanishing gradient problem. LSTMs have a hidden layer that acts as memory. This layer can capture short- and long-term correlations in the time domain. Prophet is an automatic time series forecasting algorithm that is based on the idea of fitting generalized additive models. The three main model components are trend, seasonality and holidays. Non-periodic changes are modeled by trend function, non-linear periodic changes are represented by yearly, weekly, and daily seasonality, and effects which occur on potentially irregular schedules over one or more days are modeled by holiday effects. It is a modular regression model with intuitive adjustable interpretable parameters. In
Section 4, we evaluate both traffic prediction algorithms.
3.3. Resource Allocation
In this subsection, we consider the problem of jointly (i) allocating access and metro optical network resources and (ii) placing applications’ workload to edge and core processing nodes. The problem can be described as follows. The network topology is represented as a directed graph G = (V, E). The set of nodes V represents the access and metro network nodes, while the set E represents the physical connections (links) between two nodes. Each physical link e ∈ E, is characterized by its length le. Specific nodes are equipped with processing capacity cv and a number of optical transceivers Mv. We assume that the metro network is organized into layers, with different processing and networking capabilities and thus different processing ξv cost for the nodes of different layers.
We assume coherent BVTs which can control some or all of the following parameters: (a) modulation format (MF), (b) baud rate (BR), (c) transmission power (TP), and (d) FEC overhead (OV). A possible transmission configuration is described by a tuple t = {MFt, BRt, TPt, OVt}. The modulation format MFt (bits/symbol) describes the number of bits encoded in a symbol, and the baud rate BRt (symbols/sec) describes the number of transmitted symbols per sec. Thus, the total transmission rate of a given tuple t equals . Finally, the FEC overhead OVt is taken under consideration to calculate the net transmission rate. We assume Nyquist WDM transmission, and thus a tuple t requires spectrum slots, assuming a bandwidth overhead factor y and spectrum slots of width equal to z.
Each slice demand
r ∈
R from a source node
s to a destination node
d, is characterized by its requested network capacity
ζr and processing capacity
εr (measured in Floating-point Operations per Second -FLOPS). The slices’ demanded network capacity is routed through the network. Processing power is allocated at the traversed nodes, with the objective to serve all the slice requests, minimizing the utilized bandwidth and the processing cost. In doing so, we leverage the QoT estimator (
Section 3.1) and the traffic prediction algorithm (
Section 3.2). The QoT estimator allows to estimate beforehand the QoT of the lightpaths to be considered by the resource allocation algorithm. The estimator provides accurate QoT metrics that help the allocation algorithm to assign the most suitable combination of modulation format (
MFt) and baud rate (
BRt) in order to efficiently serve the demands. The predicted traffic is used by the allocation algorithm in order to efficiently plan the network’s resources, avoiding resource overprovisioning.
Different resource allocation algorithms can be used including integer linear programming (ILP) based and heuristics. Since the described problem is NP-hard and we are considering realistic size metro and access networks, with high number of nodes and links, we decided to use the following heuristic algorithm also presented in Algorithm 1. The proposed heuristic algorithm serves the slice requests sequentially, one by one and can efficiently serve a large number of slice requests. To do so, it starts with a pre-processing phase to calculate a set of candidate paths for each slice request
Pr. Then, for each one of these demands and for each transmission configuration (tuple)
t it calculates the regeneration points (if needed) based on the QoT estimator and the set of nodes where the slice’s processing requirements can be served. Since the solution space for each demand can be vast, slowing the execution, our algorithm has an additional phase where it prunes the dominated candidate solutions. These are the configurations with more spectrum requirements and paths with available processing capacity of higher cost than other candidate solutions. For each slice demand the additional cost of each solution is considered, taking thus into account the slice demands served up to that point (the current state of the network). The objective function is a weighted combination of (i) the incremental spectrum utilized, (ii) the number of transponders, and (iii) the cost of processing nodes.
| Algorithm 1 Pseudocode of the resource allocation heuristic algorithm. |
| 1: Inputs: Network Topology, |
| 2: Transponder configurations T |
| 3: Objective weights: w1,w2 |
| 4: New slice demand = (s, d, bandwidth, processing) |
| 5: |
| 6: calculate k paths |
| 7: For each path with av_processing > slice required_processing |
| 8: Find spectrum voids |
| 9: For each transmission configuration combination T |
| 10: Use the QoT estimator to calculate the QoT |
| 11: Calculate number of connections, spectrum slots needed |
| 12: endfor |
| 13: endfor |
| 14: |
| 15: For each non-dominated path-tuple-processing cost configuration |
| 16: For each connection |
| 17: if size(void) > required_spectrum |
| 18: Select best fit void |
| 19: endif |
| 20: Select best fit processing |
| 21: endfor |
| 22: |
| 23: if cost < min cost |
| 24: update best solution |
| 25: endif |
| 26: endfor |
| 27: if size(best_solution) > 1 |
| 28: establish the slice demand |
| 29: elseif |
| 30: block slice demand |
| 31: endif |
3.4. ARMONIA Deployment Consideration
ARMONIA leverages machine learning algorithms that enable the dynamic and efficient optimization of the network’s resources. The most significant challenges of this proposal will emerge in an actual operating environment. In such an environment the inaccuracies of the machine learning algorithms may cause (unforeseen) service level agreement breeches. To prevent these, a thorough investigation of the accuracy and generally the behavior of the algorithms is needed. Furthermore, the proposed QoT estimator is suitable for brownfield scenarios, where there are historical QoT data to train the algorithm. In the case of a greenfield scenario (a completely new network) a QoT model can be leveraged as mentioned in [
22,
24]. As far as the architecture is concerned, it will be realized utilizing open and standardized interfaces (NETCONF, RESTCONF, OpenConfig, Open Transport API) and protocols, and integrating state of the art platforms (ONOS SDN Controller, Open Source Mano, gRPC, Prometheus, Apache Kafka), implementing all the required extensions. Moreover, the selected modular architecture along with the well-defined interfaces will enable the production deployment of the proposed unified access and metro network orchestration and control platform along with the easy implementation of future extensions. In any case, we consider that our proposal is far better than the static and isolated operation of the different network domains as is mainly the case today. The challenges that may arise are probably relatively easy to overcome. The end outcome can result in significant savings as we will show in the simulation experiments in the following section.
4. Simulation Results
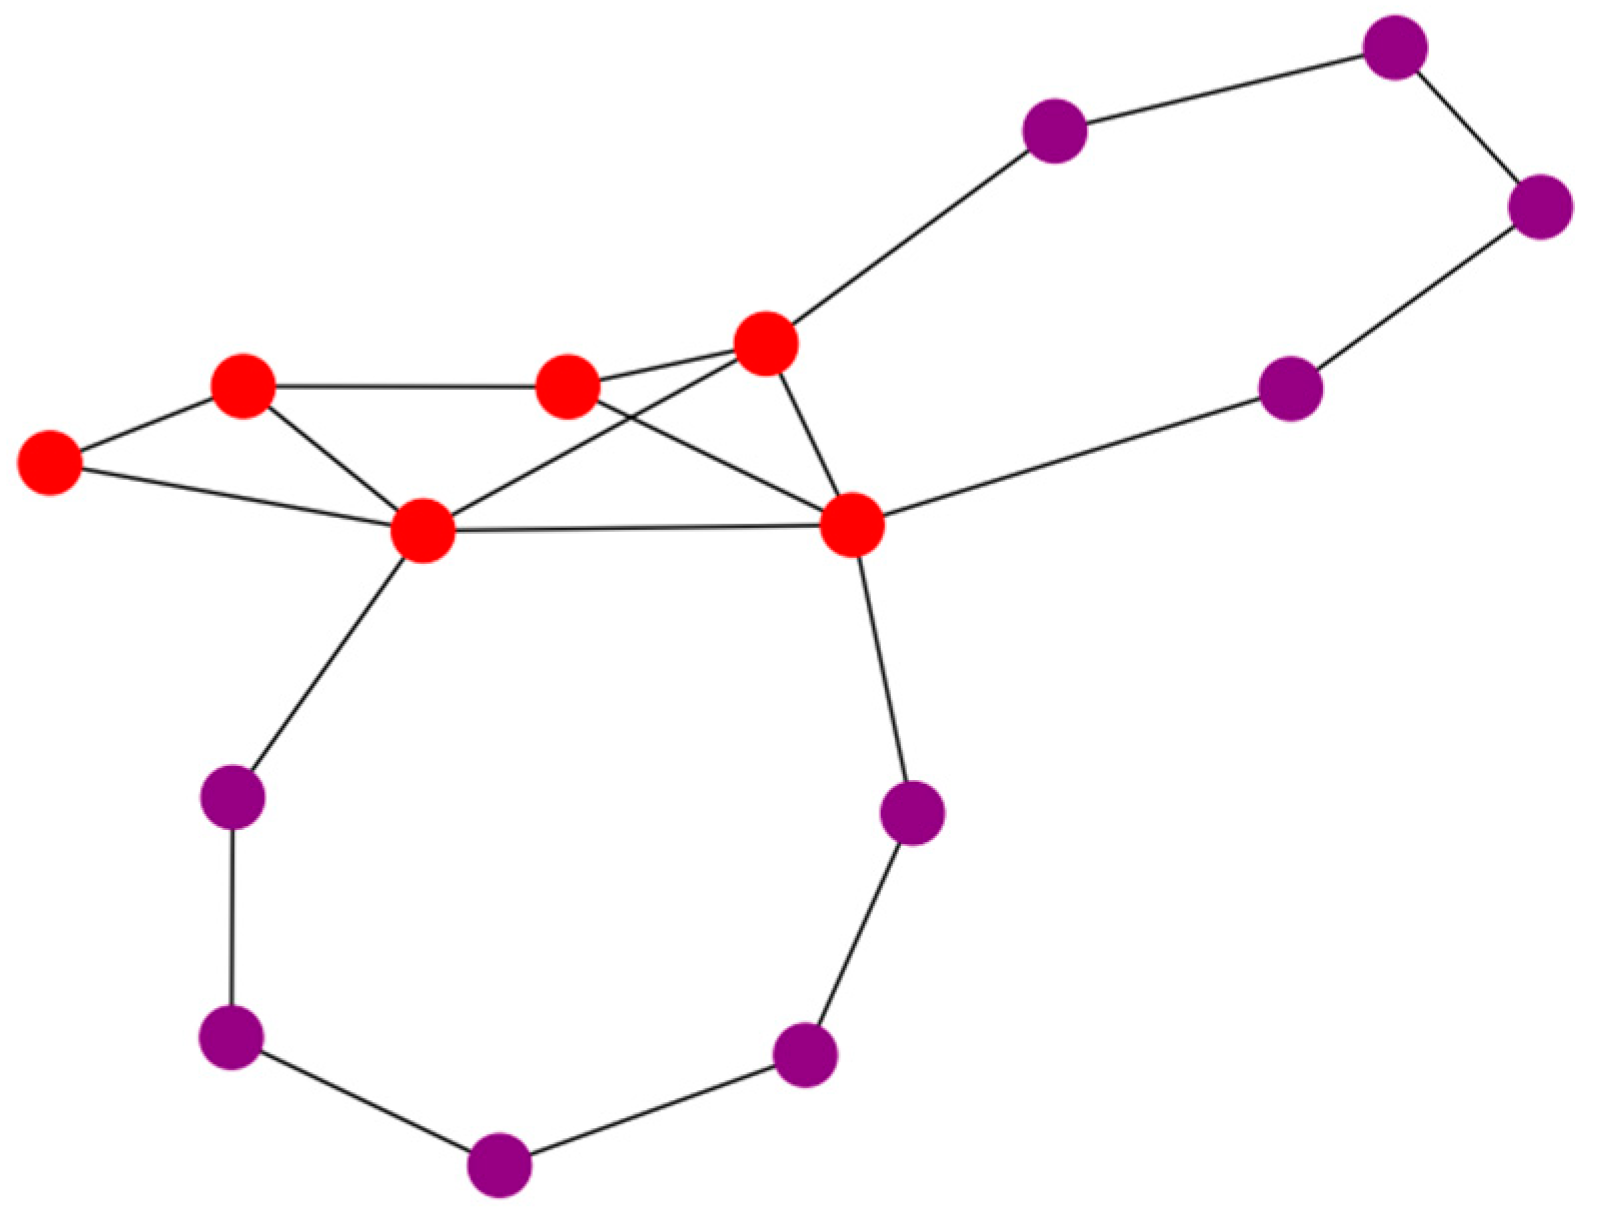
We evaluated the performance of the proposed ARMONIA-related algorithms through simulation experiments. Simulations were performed over the metro network topology of
Figure 6 that consists of 15 nodes, organized into two hierarchical layers. Layer 1 consists of nine metro-edge nodes, while layer 2 consists of six metro-core nodes. The physical link distances between the network nodes are drawn from a uniform distribution on the interval [10–200] km. The span length was taken to be equal to 80 km. For links shorter than the span length only a pre-boost amplifier was used. Each link supports up to 320 spectrum slots of 12.5 GHz width. For the transmission we assumed coherent BVTs that support different modulation formats (DP-BPSK, DP-QPSK) and baud rates that vary between 30–50 Gbaud. The launch power of the BVTs was taken to be equal to 0 dBm and 13% overhead was assumed for FEC.
4.1. QoT Estimation
We first evaluated the accuracy of the proposed QoT estimator. Assuming the aforementioned topology and transmission parameters, we used the GN model as described in the previous section to obtain the SNR metrics for training. We considered three traffic loads of 80, 120, 160 random lightpaths, with uniformly chosen source-destination pairs. We used 80% of the lightpaths for linear regression training, 10% for validation, and 10% for testing and executed 300 iterations for each case. To evaluate the estimation algorithm three accuracy related metrics were considered: (i) the mean squared error (MSE), (ii) the maximum overestimation (where the reported SNR is better than the actual), and (iii) minimum underestimation (where the reported SNR is worse than the actual).
Figure 7 shows the evaluation metrics in dB for various number of lightpaths. We notice that the MSE is quite low even with a relatively low number of lightpaths. The maximum overestimation is as low as 0.43 dB and the minimum understimation −0.2 dB when we employ information from 160 lightpaths. We notice that the accuracy of the estimator is generally quite good. The maximum overestimation (0.43 dB) is a design margin that should be used to avoid establishing a lightpath with inappropriate QoT. This design margin is quite lower than the standard design margin of 2 dBs [
3] that is typically used. The lower margins have been shown to result in equipment cost savings in various scenarios [
6,
39].
4.2. Traffic Prediction
We also evaluated the accuracy of the traffic predictor. The implemented LSTM architecture consists of a three-layer structure. The LSTM input layer includes 200 hidden units and is followed by two dense fully connected layers with 160 and 144 hidden units, respectively. LeakyReLU was used (with alpha = 0.1) as activation function across all layers for computational simplicity, while the stochastic gradient descent (SGD) algorithm was used as optimizer. Moreover, mean squared error (MSE) was used as loss function. In the Prophet model, all types of seasonalities that are added to the model, are estimated using a partial Fourier sum. The implemented model incorporates trend and daily seasonality, since sub-daily data are used. No additional seasonalities and holiday effects were considered in this schema. In order to prevent overfit in terms of daily seasonality, the default Fourier order of 3 was used. Furthermore, to imprint a more stable trend the changepoint_prior_scale argument was set to 0.001 since trend changes were being overfit.
We produced the training and test data as described in [
40]: we summed four sin time series with different amplitude and time shift to generate a traffic profile that resembles a daily traffic pattern. We also added Gaussian noise with zero mean and standard deviation of 0.05 to account for random irregularities. We considered that each day consists of 10-min discrete traffic values. The algorithms take as input the traffic volume of three days and output the prediction for the next day. In both algorithms, we considered the root relative squared error (RRSE) as our evaluation metric. The RRSE is the scaled version of the root-mean-square error (RMSE). The RRSE is an accuracy metric that does not depend on the data scale (i.e., the scale of the vertical axis’s values). Prior to fitting LSTM, we applied the following preprocessing strategy on the training data: a standard scaler was fitted to the data and afterwards the dataset was split in training and test set at a ratio of 75%/25% respectively. The model was trained for 20 epochs and batch size was set to 16 considering the input size. Prophet is a statistical model and there is no need for scaling the data. As with LSTM, the dataset was split in training and test at the same ratio. The RRSE of the LSTM was 0.083, and that of the Prophet was 0.047. The accuracy of the Prophet means that its predicted values differ approximately 5% from the actual ones. These results demonstrate that the traffic prediction accuracy is high and can be used for resource allocation purposes. Moreover, to take into account the inaccuracy of the prediction, we assumed an overprovision margin that is considered during the resource allocation.
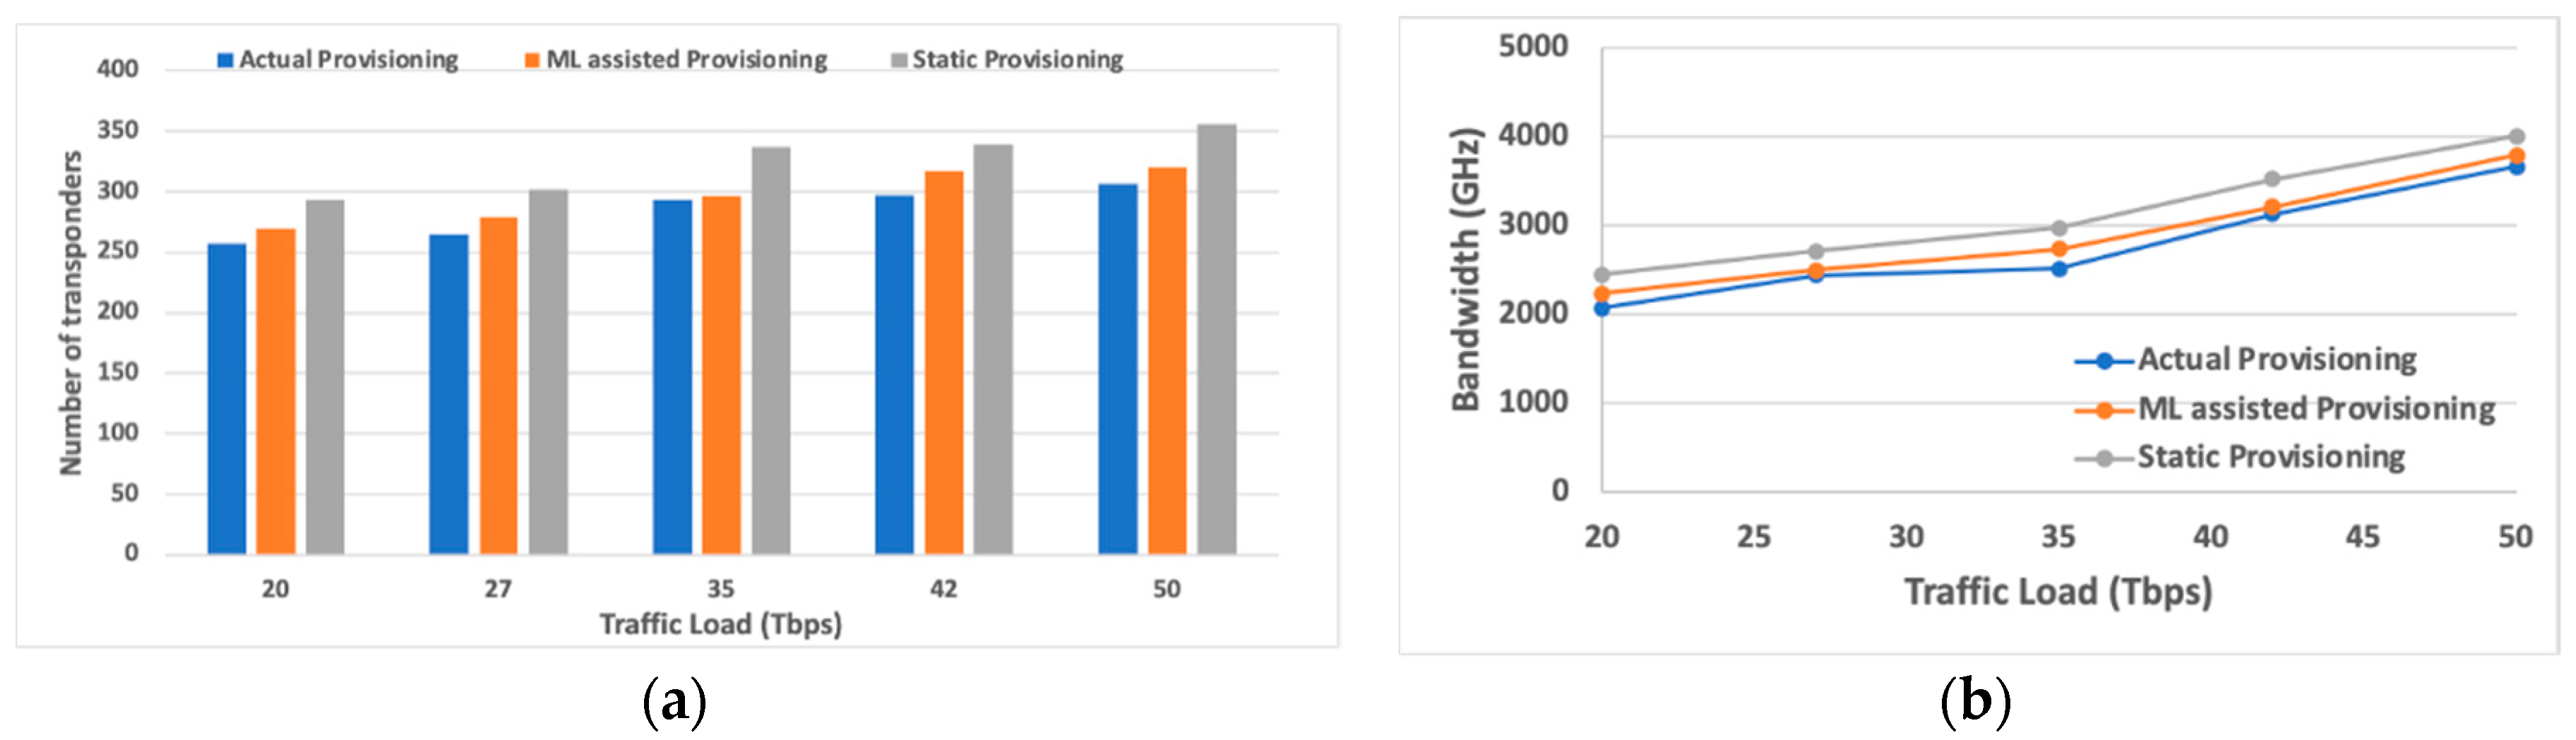
Figure 8 presents the utilization of transponders and spectrum for the different traffic loads and for the different resource allocation scenarios. As expected, the actual provisioning achieves the lowest resource utilization. The ML assisted provisioning is close, with a difference that varies up to 7%, while for some loads (T = 35 Tbps for transponder utilization and T = 27 Tbps for spectrum utilization) it is almost identical to the actual provisioning scenario. This is due to the fact that the transponder allocation depends on the selected transmission configurations. As the number and size of slicing requests change, the transponders are dynamically reconfigured and are able to serve the higher networking demands without utilizing extra ones. The static resource allocation, which allocates the resources statically based on the highest expected traffic, achieves the worst performance and allocates up to 15% more transponders and 11% more spectrum.
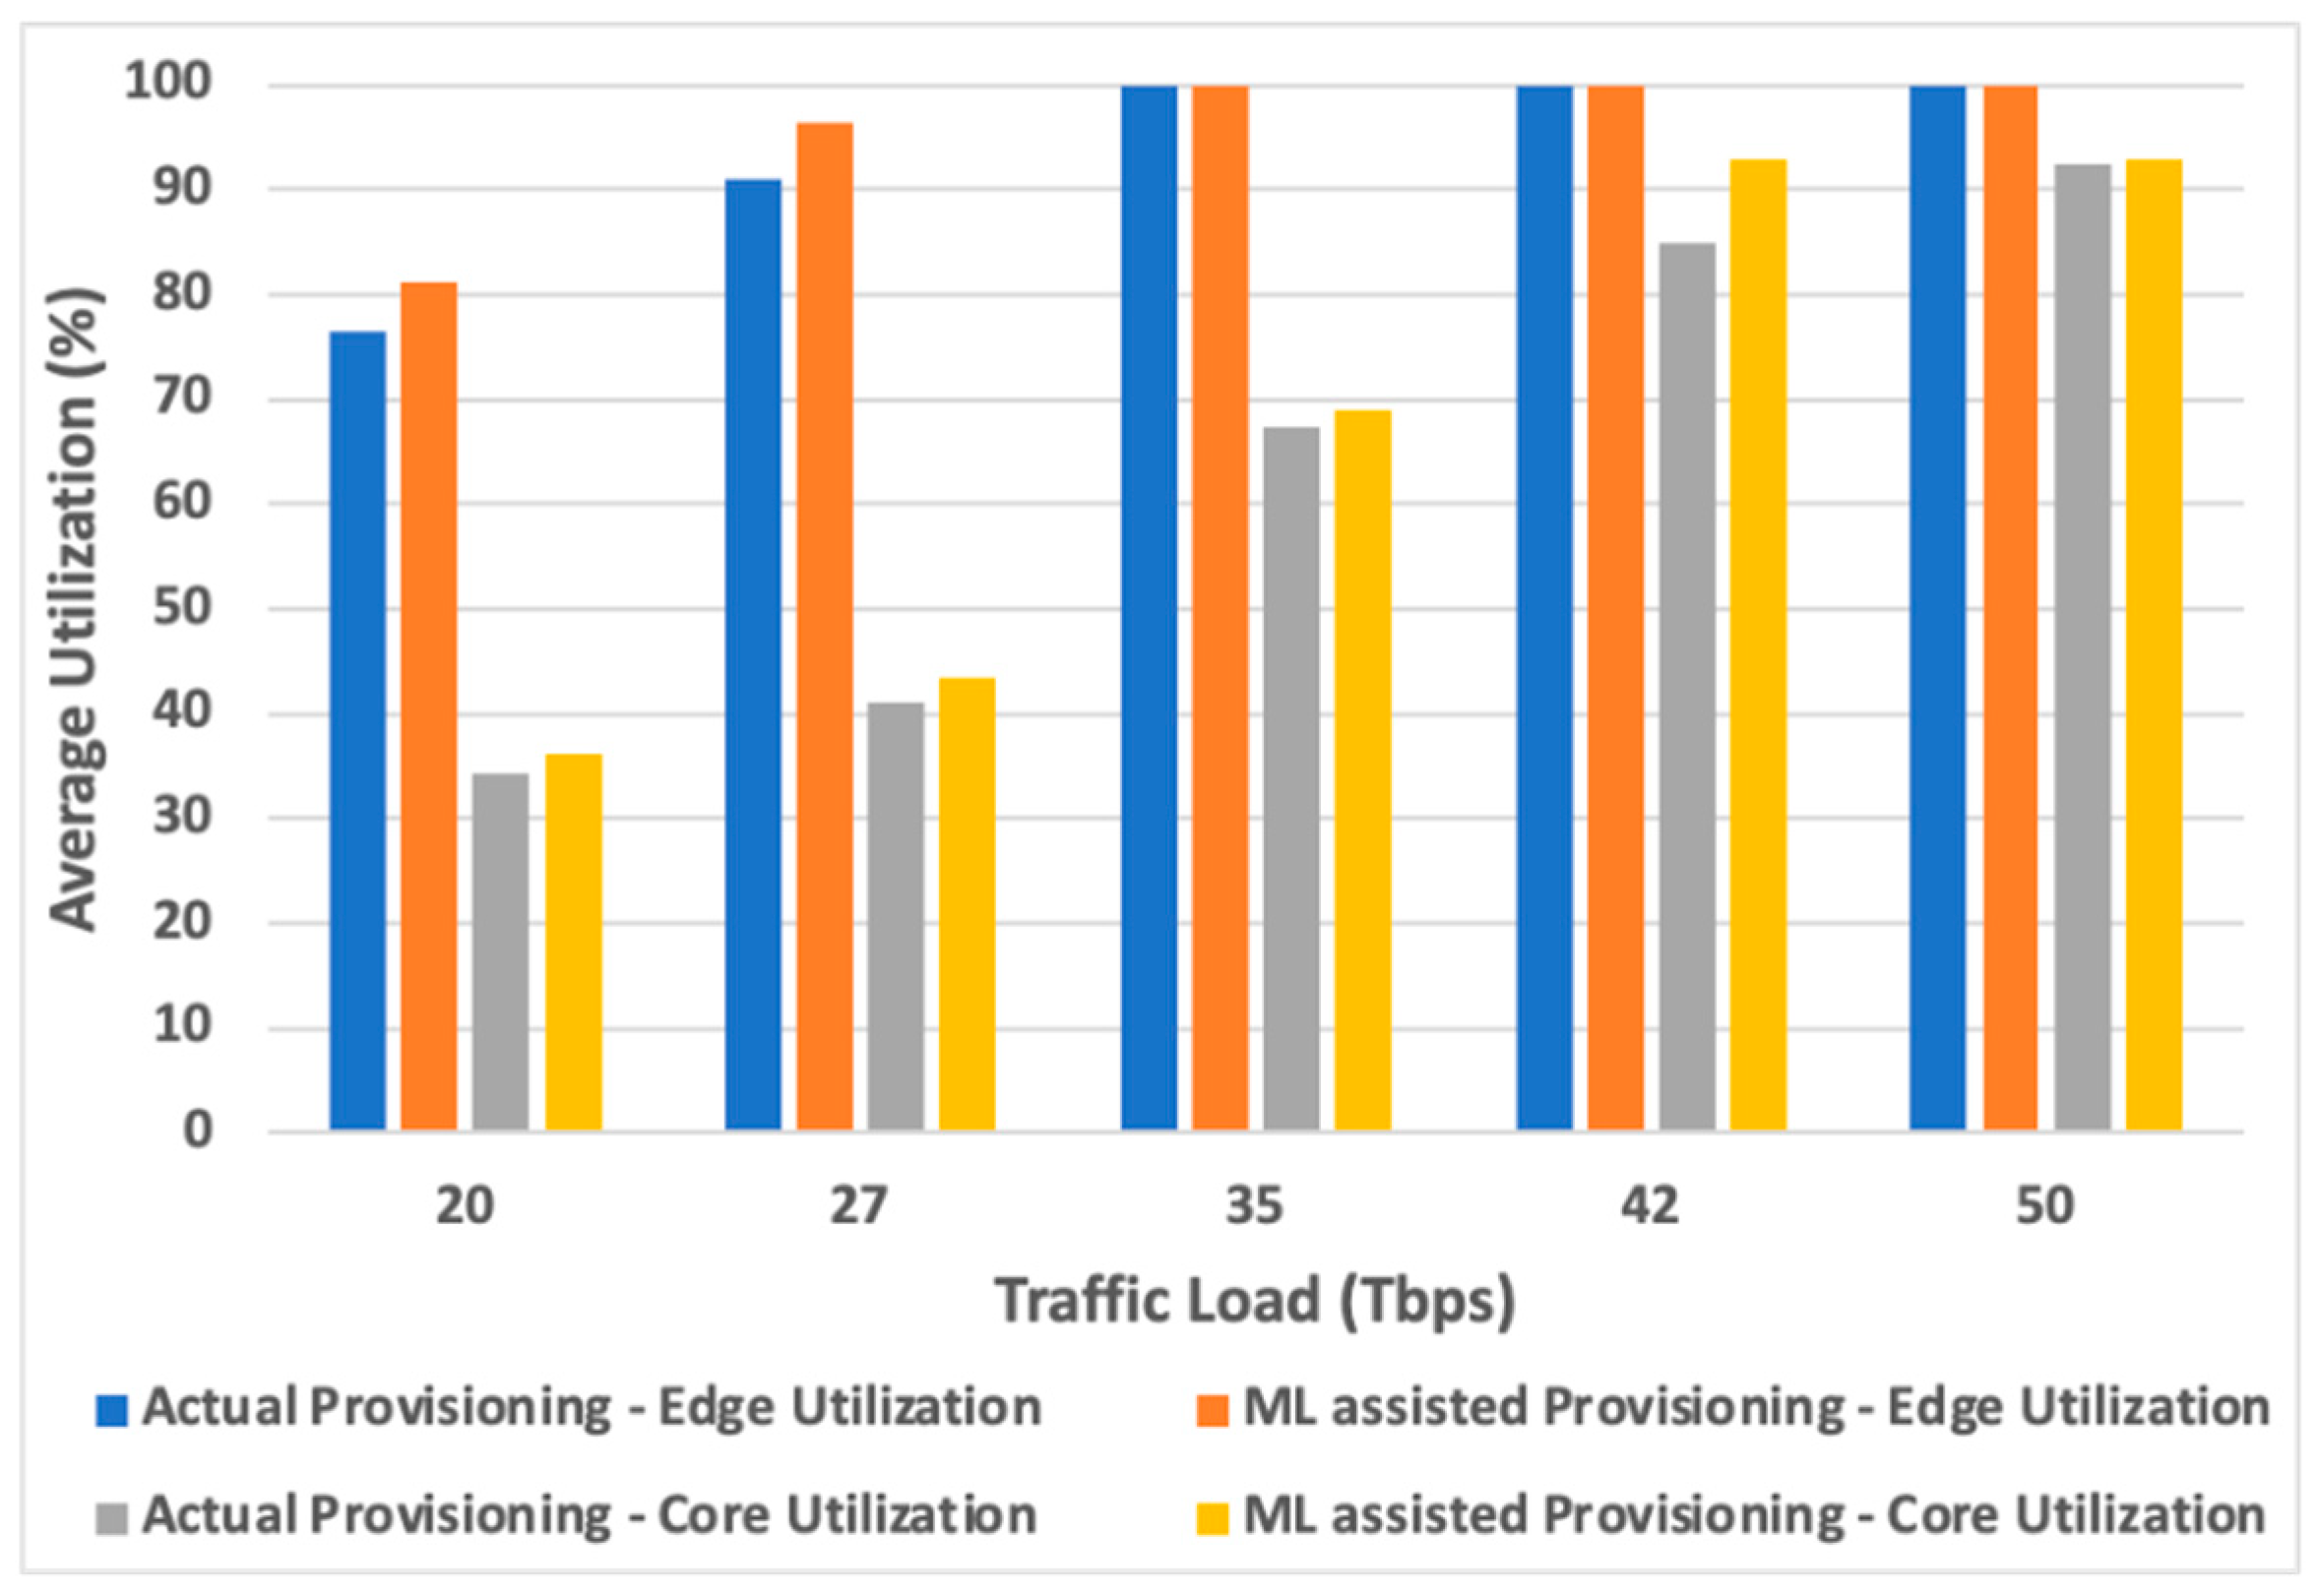
We then examined the average utilization of the processing nodes of the different network layers. As
Figure 9 illustrates, the utilization between the actual and the ML assisted provisioning scenarios is close. The static provisioning scenario, though not presented in
Figure 9, results up to 20% more utilization of the processing resources both in the layer 1 and 2, while for the highest load it would require the full utilization of the resources. Lower, on average, nodes’ processing utilization results in the use of fewer processing nodes, reducing the respective capital cost and improving the overall energy savings.
It is clear that the use of machine learning algorithms has several advantages. ARMONIA resource allocation algorithms leverage the QoT estimator that provides highly accurate QoT metrics, and the traffic predictor that provides a reliable forecast for the expected future traffic loads, allocating just enough network resources. Consequently, the joint operation and the dynamic reconfiguration of the different network parts results in significant savings in network resource utilization. These savings are translated to CAPEX savings when network dimensioning decisions need to be taken. OPEX are also reduced by using smaller overprovisioning margins during the resource allocation and adaptively changing them based on the forecasted traffic.
5. Conclusions
In this work, we presented a self-configured and unified access and metro network architecture, called ARMONIA. In ARMONIA, the optical and the IP equipment used in the different network segments are jointly and efficiently controlled. The control of ARMONIA’s converged segments is performed through an SDN-based resource orchestration framework. Additionally, a hierarchical monitoring plane based on enhanced telemetry agents provides the required monitoring information. ARMONIA leverages dynamic optimization algorithms that adapt and optimize the unified network. We demonstrated the merits of the proposed architecture through simulation experiments of a dynamic slicing allocation scenario. ML algorithms were used to provide accurate predictions (QoT metrics and traffic volume), helping reduce the resource provisioning margins. Our simulation results indicate savings up to 15% in transponders, 11% in spectrum, and 20% in processing utilization, for the examined scenarios. Future work includes the application of the traffic prediction algorithms in different timeframes (during a day or week) to make the resource allocation even more efficient. Also, we plan to extend the ML QoT estimator, leveraging a physical layer model that takes into account the behavior of certain equipment (amplifiers, filters), providing even more accurate QoT estimation.

 ,
, 


