Article

Searching for Appropriate Storage Conditions for Short-Term Wet Preservation of Porphyridium purpureum

Flemish Institute for Technological Research (VITO), 2400 Mol, Belgium
*
Authors to whom correspondence should be addressed.
Appl. Sci. 2020, 10(23), 8315; https://doi.org/10.3390/app10238315
Submission received: 30 October 2020 / Revised: 18 November 2020 / Accepted: 20 November 2020 / Published: 24 November 2020
(This article belongs to the Special Issue Algal Biomass, Biofuels and Bioproducts)

Abstract

:
It is often impossible in practice to process micro-algae immediately after their cultivation and harvest. This study, therefore, aimed to identify appropriate storage conditions for the wet preservation of Porphyridium purpureum. Algae were stored either as a concentrate or as a dilute culture at 4 °C, 8 °C, or 20 °C for 14 days and their quality was monitored. Concentrate storage tended to result in higher microbial numbers than dilute culture storage and clearly led to higher concentrations of malodorous organic acids. Butyric and isovaleric acid concentrations were about two orders of magnitude larger than their odor threshold values after 14 days of concentrate storage at 20 °C. Average B-phycoeryhrin (B-PE) levels were slightly higher after concentrate storage (2.5 ± 0.2 g B-PE/100 g organic matter) than after dilute culture storage (2.2 ± 0.5 g B-PE/100 g organic matter), probably due to respiration losses of other organic compounds in the first case. Significant amounts of organic matter got lost during concentrate storage (4–35%) as a result of carbohydrate degradation. The main restriction of concentrate storage was the rapid viscosity increase and formation of a weak gel structure complicating the later processing of the concentrates. These findings are highly relevant for P. purpureum cultivators and processors who have to store Porphyridium suspensions, even on a term of one day or less.

1. Introduction

There is an increasing interest in algae both from academia and commercial actors [1,2]. In 2018, the worldwide algae products market value was estimated to be US$ 33.9 billion and forecasted to reach US$ 56.5 billion by 2027 [3]. The sustainable nature of their cultivation and the wealth of valuable and nutritious constituents are often cited to explain the increasing demand for algae [2]. Micro-algae are generally more efficient in converting solar energy to biomass than traditional crops while their cultivation requires no arable land [4]. Algae cultivation thus allows efficient land use which is one of the elements of an effective climate change mitigation strategy [5]. Despite the large number of algae species found in nature, only a few are currently being commercially exploited. The red micro-algae Porphyridium purpureum (Bory) K.M. Drew & R. Ross 1965 [6], also referred to as Porphyridium cruentum, is one of them. It has received the GRAS (generally regarded as safe) status by the United States Food and Drug Administration [7] and is grown for aquaculture, cosmetic, and diagnostic applications [8,9]. The red pigment phycoerythrin is the most valuable constituent with market prices ranging between $30 USD/mg and 150 USD/mg for highly purified B-phycoerythrin (B-PE) [10]. Due to its good water solubility and powerful fluorogenic properties, B-PE is commonly used for diagnostic applications such as flow cytometry and immunofluorescence microscopy [11,12]. In addition, literature often highlights the potential use of P. purpureum in food applications where it may serve not only as a colorant but also as a thickening or gelling agent. The viscosity-increasing properties and the (weak) gelling behavior are usually attributed to the presence of sulfated exopolysaccharides (EPS), excreted by P. purpureum and encapsulating its cells [13]. Finally, the lipid fraction including long-chain polyunsaturated fatty acids has been suggested as a potential target for Porphyridium biorefinery and valorization [8]. However, the lipid content of P. purpureum is rather low, often below 15% of its dry matter [12,14,15].
Several studies have provided important information on the effect of cultivation conditions [13,14,16,17] and of down-stream processing operations [13,17] on Porphyridium phycoerythrin levels, polysaccharide composition, and rheological properties. Yet, very little is known about how this algae should be preserved in between harvest and down-stream processing. Nevertheless, this intermediate storage step is often unavoidable. The course of algae cultivation and the harvesting time is partly unpredictable as it depends on weather conditions. Due to the unpredictability of algae cultivation, it is impossible in practice to carry out harvest and processing immediately when algae are harvest-ready. The algae must, therefore, be temporarily stored.
Against this background, the current study aims to identify appropriate storage conditions for P. purpureum biomass. Only wet, cooled (T > 0 °C) storage will be considered as drying [18,19] and freezing are rather expensive and because heat-based drying can be expected to reduce B-PE levels [20].
A first storage study aimed to understand the effect of wet storage on B-PE levels, the formation of odorous short-chain fatty acids, and microbial load. The latter two parameters are important quality parameters when food or feed applications are envisioned. A second preservation test was performed to study organic matter losses, carbohydrate composition, and the algal rheological properties during storage.

2. Materials and Methods

2.1. Storage Experiment Set-Up

P. purpureum was grown in a brackish medium (1.2% w/v NaCl) in a tubular 1500 L photobioreactor in a greenhouse at the Sunbuilt facility (Geel, Belgium). The algal culture was either taken out of the bioreactor and stored as such or it was concentrated by continuous centrifugation (800 L/h, SSD 6-06-007 Gea Westfalia separator, GEA Westfalia Separator Group GmbH, Oelde, Germany) and stored subsequently. These two storage approaches are schematically shown in Figure 1 and are further referred to as dilute culture storage and concentrate storage.
Two separate tests were performed and each was started with a fresh P. purpureum culture with initial dry matter content between 1.3% and 1.7% and initial organic matter contents between 14% and 16% on a dry matter (dm) basis (Supplementary Materials Table S1). In both tests, concentrate storage was done by storing 15 mL concentrates in a 50 mL tube sealed with a cotton plug and placed in a dark incubator (New Brunswick, Innova 42/42R, Eppendorf) at 4 °C, 8 °C, or 20 °C. Dilute culture storage was performed in 10 L barrels covered with perforated plastic seals and incubated in the dark at 4 °C, 8 °C, or 20 °C. Before analysis, the dilute algae culture was concentrated after storage by batch centrifugation (2 × 10 min, 10,000× g, Sorvall LYNX 6000, Thermo Scientific, Waltham, MA, USA) and the supernatant discarded. Algae were stored for 0, 7, or 14 days in the first test and for 0, 1, 7, and 14 days in the second test. Microbiology analyses (test 1) and rheology measurements (test 2) were done immediately after sampling, while the remaining algae were stored at −20 °C for further analysis. Samples for B-PE and carbohydrate analysis were freeze-dried prior to analysis.

2.2. Dry Matter and Organic Matter Analysis

Dry matter content was determined after overnight drying at 105 °C, whereas ash content was determined after subsequent drying at 550 °C (4 h). The organic matter content was calculated as the difference between dry matter and ash content. When the amount of ash in the concentrate at the start (t0) and after a certain storage time (t) are considered equal, the retained organic matter fraction can be calculated as follows:
(   m a s s   o r g a n i c   m a t t e r   m a s s   d r y   m a t t e r m a s s   a s h m a s s   d r y   m a t t e r ) t (   m a s s   o r g a n i c   m a t t e r m a s s   d r y   m a t t e r m a s s   a s h m a s s   d r y   m a t t e r ) t 0     =   ( m a s s   o r g a n i c   m a t t e r m a s s   a s h ) t ( m a s s   o r g a n i c   m a t t e r m a s s   a s h ) t 0   =   retained   organic   matter   fraction

2.3. Microbial Analysis

The total number of micro-organisms was estimated by pour plate counting according to ISO (International Organization for Standardization) procedure 4833-1:2013 [21]. A series of 10-fold dilution was prepared, of which 1 mL aliquots were transferred to a plate count agar medium. After 72 h incubation under aerobic conditions at 30 °C, colonies were counted.

2.4. Short-Chain Fatty Acid Analysis

The short-chain fatty acid analysis was performed by gas chromatography (GC) as detailed before [22]. In short, algae concentrates were extracted with diethyl ether after the addition of an internal standard solution (2-methyl hexanoic acid), NaCl, and an H2SO4 solution. NaCl and H2SO4 were added to improve the transfer of organic acids to the organic phase by increasing the ionic strength of the aqueous phase and by protonating the acids, respectively. Extracts were analyzed by GC and flame ionization detection together with calibration solutions containing (i) all straight-chain saturated monocarboxylic acids with 2 to 5 carbon atoms, (ii) isobutyric acid, (iii) isovaleric acid, and (iv) the internal standard.

2.5. B-Phycoerythrin Analysis

B-PE levels were determined by UV–Vis spectrophotometry after cell disruption by repeated freezing and thawing of the algae cells as described previously [23,24]. About 30 mg freeze-dried concentrate was mixed with 5 mL sodium phosphate buffer (pH 6.8, 0.1 M) for 1 min, incubated for 1 h at −20 °C, sonicated for 15 min at 4 °C, centrifuged (10 min, 20,000× g), and the supernatant was collected. This process was repeated until the extraction did not yield any additional B-PE. Absorbance was measured at 565 nm, 620 nm, and 650 nm with a UV–Vis spectrophotometer (Tecan Infinite 200 PRO, Tecan, Männedorf, Switzerland). After blank corrections, B-PE levels were calculated according to the formula of Bermejo Román et al. [12].

2.6. Carbohydrate Analysis

The carbohydrate composition was studied by high-performance anion-exchange chromatography (HPAEC) with pulsed amperometric detection after acid hydrolysis similar to the method of Gilbert-López et al. [25]. Approximately 45 mg freeze-dried concentrate was heated for 1 h at 37 °C in 1 mL H2SO4 (11 M). The hydrolysate was diluted until a final H2SO4 concentration of 1 M and subsequently incubated for 2 h at 100 °C. A 1 mL aliquot of the hydrolysate was added to 0.5 mL of a NaOH solution (400 mM), centrifuged (10 min, 10,000× g), and analyzed by HPAEC with a Dionex ICS-5000 system (Thermofisher Scientific, Waltham, MA, USA). After injection (5 µL), monosaccharides were separated on a CarboPac PA1-column (4 × 250 mm) protected by a CarboPac PA1-guard column (4 × 50 mm). The eluent, pumped at 1 mL/min, was applied according to the following gradient: 15 mM NaOH (0–10 min), 15 mM NaOH and 0–150 mM sodium acetate (10–30 min), 15–0 mM NaOH and 0.15–1 M sodium acetate (30–35 min). An 8-point calibration series was used to quantify monosaccharides and uronic acids. The total carbohydrate content was calculated as the sum of all monosaccharides and uronic acids each corrected for water uptake during hydrolysis.

2.7. Rheology Analysis

Rheological properties of the microalgal suspension were measured with a Haake Mars II rheometer (Thermofisher Scientific) using a parallel plate geometry PP35 Ti and a measuring gap of 1.000 mm. The temperature was kept constant at 25.00 °C by a universal temperature module controller box. Samples were loaded on the device by a spatula, and the visco-elastic behavior was studied by oscillatory shear measurements. First, the flow behavior of the samples was studied in a shear rate interval of 0.10 s−1 to 300.0 s−1 where the shear rate was logarithmically increased. Secondly, the gelling properties were evaluated by an amplitude sweep test. The frequency was kept constant at 10 rad/s and the strain was increased logarithmically from 0.1% to 1000%. The storage modulus (G’) and the loss modulus (G”) were determined. Before each measurement, the sample was able to stabilize for 30 s and all measurements were performed in duplicate. The data were processed with HAAKE Rheowin software, version 4.86.0002 (Thermofisher Scientific).

2.8. Statistics

The effect of storage time, temperature, and storage approach (concentrate vs dilute culture storage) were studied using a full factorial design. Factorial ANOVA (analysis of variance) was used to determine which factor had a significant impact on the quality parameters of stored algae and to detect interaction effects. In the case of a positive omnibus test, a post hoc Tukey-test was performed. To assess whether the results were different from the initial (t0) value, one-way ANOVA was performed. All analyses described above were done in triplicate except for the microbiology and rheology analyses that were done in duplicate. Statistica version 12 (Dell Inc., Tulsa, OK, USA, 2015) was used for all statistical analyses with 5% as the significance threshold level.

3. Results and Discussion

P. purpureum was stored either as a dilute culture or as a concentrate. It is important to bear in mind that these two approaches do not only differ in terms of algae concentration during storage but also in the treatment preceding storage. For concentrate storage, algae were centrifuged before storage and hence they experienced shear forces prior to storage. This can damage the cells which in turn can compromise algae stability. During dilute culture storage, on the other hand, samples were only centrifuged right before analysis. This study is hence unable to purely evaluate the impact of the algae concentration but rather compares two different storage approaches that are feasible in practice and are relevant for algae growers. Therefore, we refer throughout the paper to the effect of the storage approach instead of the storage concentration effect.

3.1. Microbiology

The total number of micro-organisms able to grow under aerobic conditions at 30 °C was determined in the first storage test. At the start (t0), concentrate storage and dilute culture storage concentrates had 24.7 ± 1.0 × 10⁶ and 8.2 ± 4.6 ×10⁶ colony forming units (CFU) per gram organic matter, respectively. The t0 average microbial count was not different from that after storage (p = 0.20, one-way ANOVA). When stored concentrates were analyzed (without t0 data), a trend for higher microbial numbers was observed after concentrate storage than after dilute culture storage (Figure 2) but the difference was not significant (p = 0.081). Storage time (p = 0.108) and storage temperature (p = 0.422) had no impact on the total microbial count after storage. These data suggest that microbial numbers tend to be higher after concentrate storage than after dilute culture storage. This is possibly due to the higher salt/biomass ratio for during dilute culture storage and the preservative effect of salt on non-halophile micro-organisms. However, more precise analysis is needed to clearly expose differences between the two storage approaches.

3.2. Short-Chain Fatty Acids

The concentration of short-chain fatty acids (SCFA) was determined as they were previously reported to contribute to the bad odor of algae stored under inappropriate conditions [22]. SCFA levels, expressed on an organic matter base, were assessed to evaluate the effect of storage approach, time, and temperature (Figure 3). Acetic acid was always the main SCFA and its concentration was affected by storage temperature, time, and storage approach where the effect of storage approach interacted with that of storage temperature and time (p < 0.001). A higher concentration of acetic acid was present after concentrate storage than after dilute culture storage (p < 0.001). Propionic, butyric, and isovaleric acid levels were significantly influenced by all studied factors (storage approach, storage time, and storage temperature) and their interactions (p < 0.01). Higher levels were observed with increasing storage time, increasing storage temperature, and after concentrate storage (Figure 3). Propionic, butyric, and isovaleric acid have an unpleasant odor and they are known to be present in foot sweet [26] and human stool [27], contributing to pungent off-odors. To evaluate their effect on P. purpureum odor more directly, their concentrations expressed per liter algae suspension were plotted (Supplementary Materials Figure S1) and compared to their odor threshold values (OTV) in pure water [28]. Propionic acid only surpassed its OTV (20 mg/L) when the algae were stored at 20 °C. Although the initial dry matter concentration of the algae pellet obtained after dilute culture storage was about two times higher than that after concentrate storage (Supplementary Materials Table S1), lower propionic acid concentrations (in mg/L) were observed for dilute culture storage. Butyrate levels were usually of the same order of magnitude as the OTV in pure water (0.24 mg/L), except for concentrate storage at 20 °C. In fact, after 14 days of concentrate storage at 20 °C, the butyrate concentration was about 100 times the OTV. The concentration of isovaleric acid was only clearly higher than its OTV (0.12–0.7 mg/L) after 20 °C concentrate storage (Supplementary Materials Figure S1) and this compound was never detected in samples that were stored as a dilute culture (detection limit = 0.046 mg/L).
As observed before [22], the temperature had a major influence on SCFA levels but also the storage approach had a clear impact. The latter is possibly a result of a partial release and dissolution of SCFA in the medium during storage and/or during subsequent centrifugation in the case of dilute storage. Indeed, after storing the dilute culture, the majority of the medium including the dissolved metabolites is removed by centrifugation. In addition, it can be expected that the level of dissolved O2 drops faster during concentrate storage than during dilute culture storage. The amount of O2 that can dissolve in the algae suspension is limited and the concentrates contained more algae cells per unit volume that rely on the respiration for their energy supply. In a dark environment, O2 levels will decrease due to respiration creating eventually (local) hypoxic or anoxic conditions, as reported before [22]. Under such circumstances, proteins and carbohydrates can be the substrate for (bacterial) fermentation [27], resulting in amongst others the formation of the SCFA [22] or methane [29]. It is expected that this process occurs faster during concentrate storage than during dilute culture storage. Moreover, it is likely that additional compounds with a notorious off-odor, like H2S or organic sulfur compounds such as methanethiol [22], were formed as seen before for other algae species stored under anoxic conditions [22,29,30]. Accordingly, a pungent off-odor was perceived for all samples stored as a concentrate at 20 °C (authors personal observation). In conclusion, the off-odor formation can become a serious issue during the wet preservation of P. purpureum. The data of this study suggest that this risk can be mitigated when P. purpureum is cooled and stored as a dilute culture.

3.3. B-Phycoerythrin

B-PE levels were similar for the concentrate storage and dilute culture storage concentrates at t0 (2.20 ± 0.11 and 2.19 ± 0.17 g/100 g organic matter, respectively) and consistent with literature data for P. purpureum [12,14,24]. On average, B-PE levels were higher (p = 0.017) after concentrate storage (2.45 ± 0.16 g B-PE/100 g organic matter) than after dilute culture storage (2.17 ± 0.47 g B-PE/100 g organic matter). This rather small difference is possibly a result of respiration losses of (non-B-PE) organic matter during concentrate storage. Indeed, when B-PE levels are expressed on an ash basis, no increase was observed during concentrate storage (7.03 ± 0.36 and 6.52 ± 0.38 g B-PE/100 g ash after 0 and 14 days, respectively). Factorial ANOVA analysis indicated that also storage temperature had an influence on B-PE levels (p = 0.039, Figure 4) but there were no significant differences according to the post hoc test. Storage time (7 or 14 days) had no significant impact (p = 0.37). All in all, differences were small and B-PE levels were fairly stable during storage.

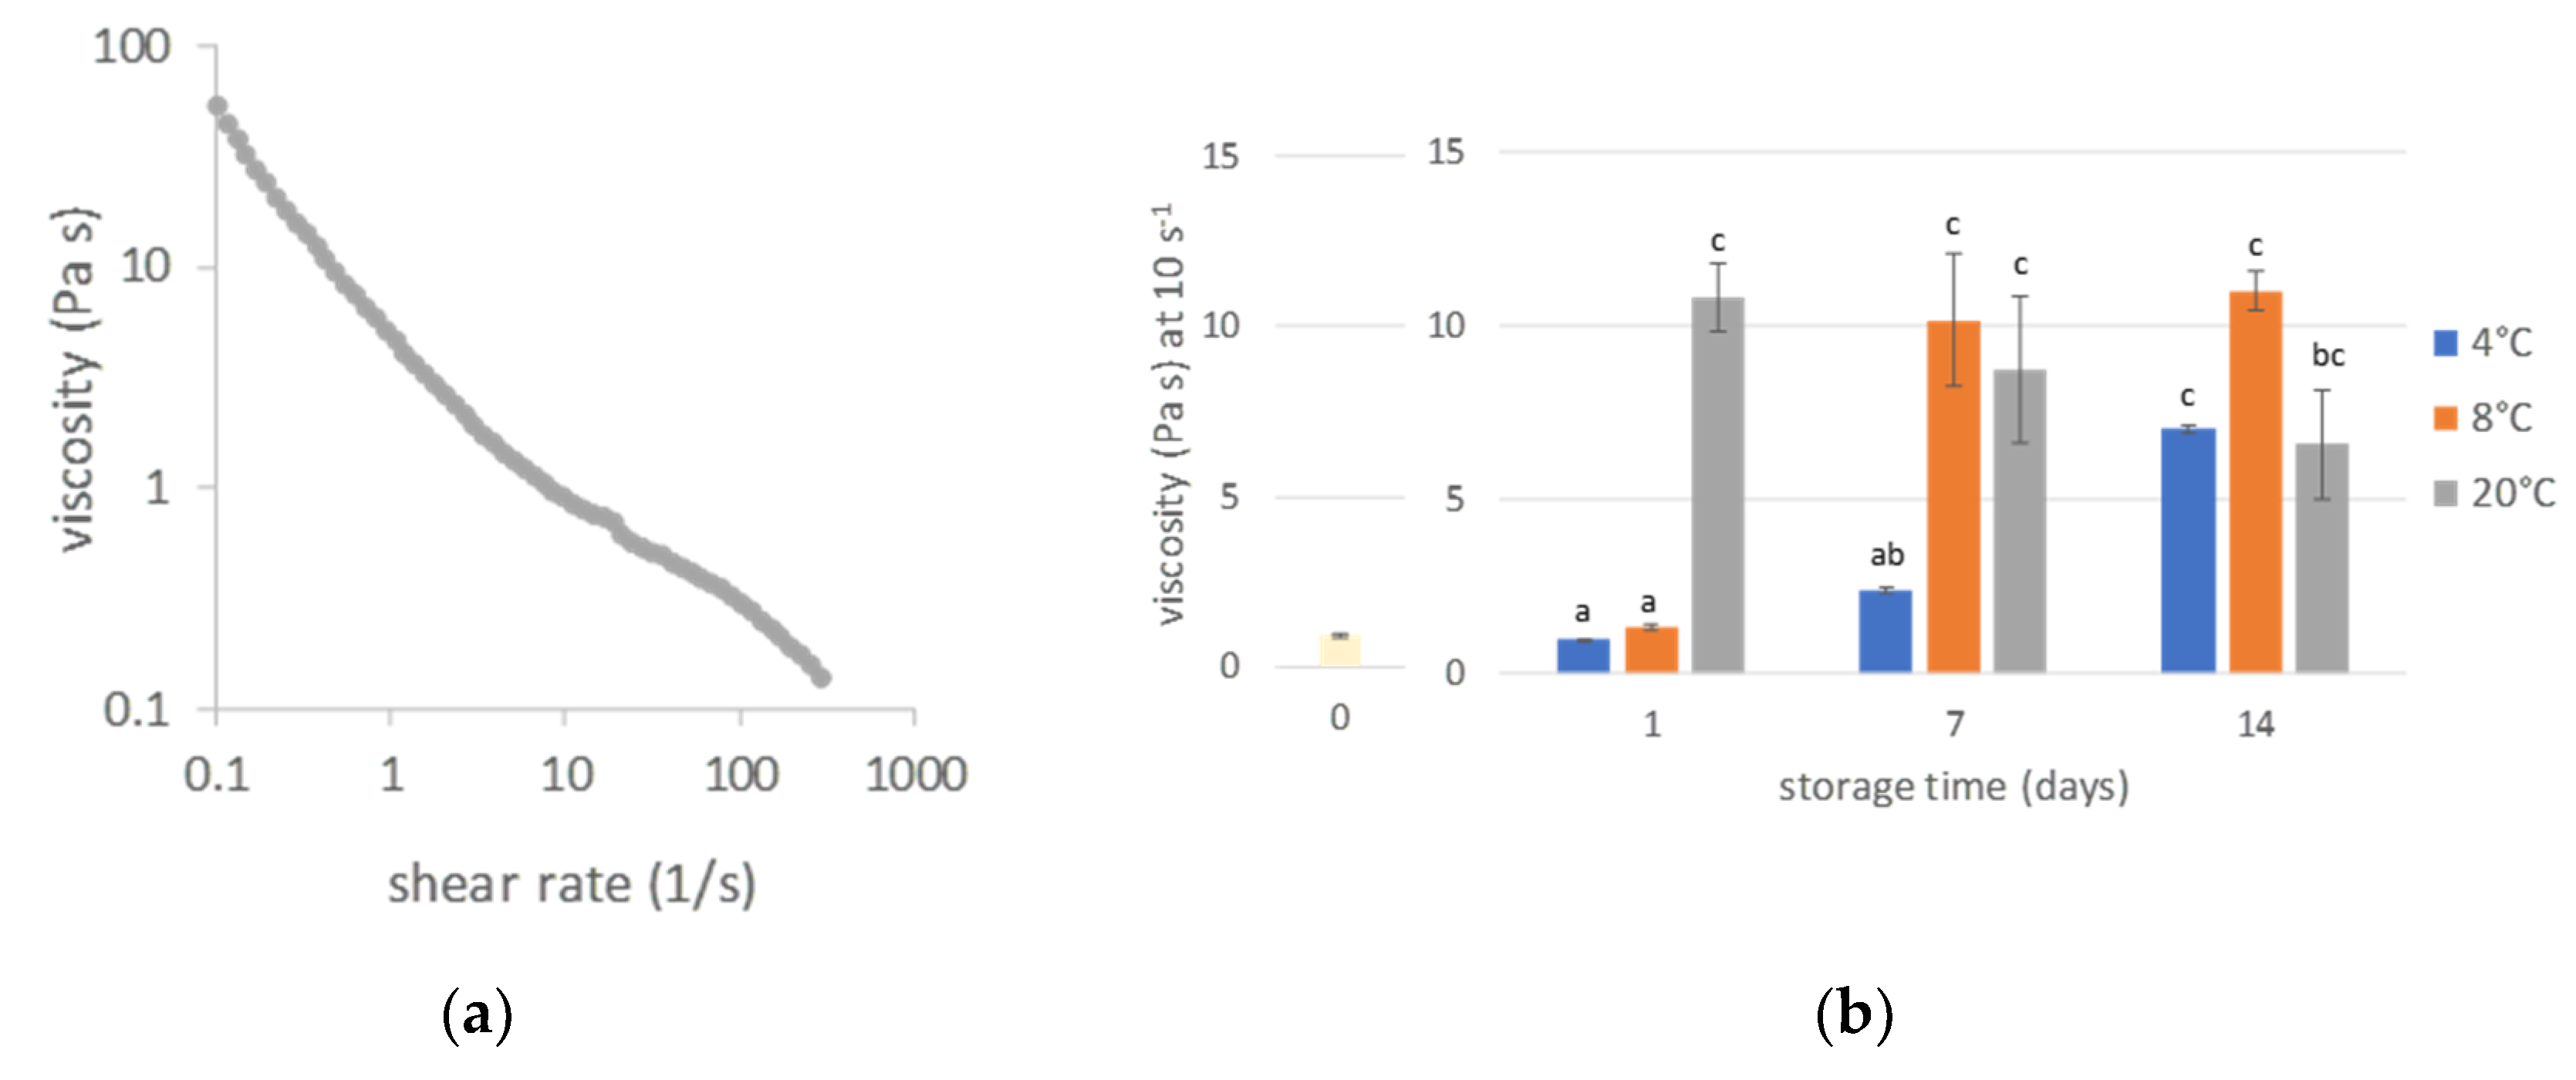
3.4. Rheological Properties

In the course of the first storage test, rapid and clear changes in the rheological properties of P. purpureum concentrates were visually noted, with gel formation occurring within a day in the case of concentrate storage. A second storage test was, therefore, conducted to study this systematically. The samples obtained from concentrate storage and dilute culture storage (after centrifugation) had different dm concentrations, initially 6.4 ± 0.1% and 12.7 ± 0.1%, respectively. Because the biomass concentration [31] and EPS concentration [32] are known to have a large influence on the rheological properties of algae suspensions, our rheology data cannot be used to expose the effect of the storage approach independently from the concentration effect. Hence, this study does not engage with the influence of the storage approach on the rheological properties. Instead, the emphasis is on the changes in the function of time, especially in the case of concentrate storage. After all, when P. purpureum cells can form a gel during concentrate storage, this has a serious impact on later down-stream processing, complicating for instance pumping or mixing of such a solid-like material. On the other hand, when P. purpureum is stored as a dilute culture, this dilute suspension is much more manageable and the rheological properties of the final concentrate can still be adapted by changing the centrifuge settings and adapting the concentration factor.

3.4.1. Viscosity

The t0 concentrates displayed shear-thinning behavior (Figure 5a,c). In other words, the viscosity of the t0 concentrate suspensions decreased with increasing shear rate, in line with previous observations for Porphyridium concentrates [33]. Furthermore, concentrates of other algae species exhibited shear-thinning behavior [34] once their concentration exceeded a critical value that depends on the algae species [31]. Figure 5a,c indicate that this critical value was exceeded in this study. The high viscosity values of Porphyridium sp. suspensions are generally ascribed to the presence of EPS that entangle once the biomass concentration is sufficiently high. EPS are believed to disentangle at higher shear rates, resulting in shear-thinning behavior [32,33,35,36].
The discussion on the storage effect will focus on the viscosity at a shear rate that is relevant for field applications. A shear rate of 10 s−1 was chosen as it is within the expected shear rate range for algae harvest and pumping [31] and food processing [37]. During concentrate storage (Figure 5b), storage time, temperature, and their interaction affected the viscosity (p < 0.01). Already after 1 day of storage at 20 °C, the viscosity increased strongly, i.e., about 10 times compared to the t0 situation. The viscosity increased at a slower pace during 4 °C and 8 °C concentrate storage (Figure 5b). This finding has important implications for the organization of a P. purpureum processing facility. Once the culture is centrifuged, the concentrate should either be immediately processed or immediately cooled in order to minimize energy requirements for pumping and mixing. In the case of dilute culture storage, only storage time had an impact on the viscosity of the concentrate obtained after dilute culture storage (p < 0.001), and this effect interacted with storage temperature (p = 0.013, Figure 5d). No large viscosity increase was observed compared to the t0 concentrate.

3.4.2. Amplitude Sweep

Amplitude sweep testing was done to assess the visco-elastic properties of the P. purpureum samples after storage. Figure 6a shows the storage modulus (G’) and loss modulus (G’’) in function of shear strain for the concentrate storage paste at t0. Within the linear visco-elastic region, i.e., the region where G’ and G” are independent of the shear strain, G’ was higher than G”, indicating predominantly elastic behavior (Figure 6a). For the analysis of the storage effect, G’ and the phase angle (δ = tan − 1 (G”/G’)) are displayed for 1% shear strains in Figure 6b,c, respectively. The storage modulus G’ gives an indication of the gel stiffness, while δ gives information about the visco-elastic behavior. During concentrate storage, all studied storage factors including their interaction had a significant impact on G’ (p < 0.001) and on δ (p < 0.05). The G’ modulus raised during concentrate storage where the rise was fast during 20 °C storage and slow during 4 °C and 8 °C storage (Figure 6b). The decreasing δ values indicate that the samples became more solid-like during storage (Figure 6c). This evolution was the fastest during 20 °C concentrate storage and was slowed down by cooling. During dilute culture storage, the G’ value of the algae pellet was not influenced by storage time (p = 0.091) nor by the storage temperature (p = 0.14), while δ was only affected by the storage temperature (p = 0.006). Slightly lower δ values were observed after 20 °C storage than after 4 °C or 8 °C storage (Supplementary Materials Figure S2).
The observed formation of a gel network by Porphyridium suspensions is in line with the findings of Bernaerts et al. [33,38]. They found that EPS can act as a kind of binder enhancing cell aggregation [33,38]. Furthermore, they noticed an increase in gel stiffness when the suspensions were heated (15 min, 95 °C) probably due to an enhanced cell aggregate formation [38]. EPS inter-chain interactions probably play a key role here as the disintegration of such interactions in EPS solutions by sonication can reduce the viscosity dramatically and can shift such a solution from a weak gel to a liquid-like system [35]. Our data suggest that a gel network is formed fast in freshly harvested and concentrated P. purpureum suspensions and that this process is slowed down by cooling. This has important consequences for further processing of the biomass in a down-stream processing context. The stronger the gelling behavior, the more difficult it becomes to dissolve the biomass. Moreover, strong cell aggregation will compromise extraction such as in the case of aqueous B-PE extraction.

3.5. Carbohydrate Composition

Table 1 shows the carbohydrate levels expressed on an organic matter base. In line with literature data [12,39], carbohydrates were a major constituent, with initial total carbohydrate concentrations close to 50% of the organic matter (Table 1).
At the start (t0), no large differences were observed between the two storage approaches in terms of carbohydrate levels. As expected, glucose was initially the main monosaccharide followed by galactose and xylose. Indeed, floridean starch, a glucose-based polymer, is known to be the main energy storage polymer in Porphyridium sp. [40], while the cell wall polysaccharides and the extracellular polymeric substances have glucose, galactose, and xylose as main monosaccharides [15]. Glucose concentrations decreased during storage, particularly during concentrate storage and during 20 °C storage. The concentration of galactose, xylose, and glucuronic acid remained equal or increased, where increases were probably due to a loss of other organic compounds during preservation. To better understand the evolution of carbohydrate levels independently from changes of other organic compounds, results were also calculated on ash basis (Supplementary Materials Table S3) as ash can be considered as an inert internal standard in the case of concentrate storage. In this instance, glucose levels dropped drastically during concentrate storage, even at 4 °C. The other monosaccharides and uronic acid levels decreased to a smaller extent or remained equal. The net decrease of glucose is probably due to the consumption of floridean starch since algae were forced to call on their reserve resources during dark preservation. Carbohydrate consumption can occur fast as significant carbohydrate losses have been observed for other algae species after one night [41] and even after 30 min [42] of dark incubation. The cell wall and extracellular polysaccharide concentrations appeared to be much more stable in the current study as the amounts of galactose and xylose, two of their main building blocks, were little or not affected by cooled concentrate storage (Supplementary Materials Table S3). Hence, this observation cannot explain the changing rheological properties seen for concentrates during cooled storage (Figure 5B and Figure 6B). Although conclusive evidence is not provided here, it is likely that physical interactions including EPS entanglement are needed for viscosity build-up and the formation of a (weak) gel in a P. purpureum concentrate immediately after centrifuge harvesting. Such inter-molecular interactions can be expected to occur slower at low temperatures as they depend on polysaccharide solubility and Brownian motion.
During dilute culture storage, no or limited changes were observed in carbohydrate composition during 4 and 8 °C storage (Table 1). During 20 °C storage, glucose levels had decreased after 14 days, albeit to a much smaller extent than during concentrate storage. It can be concluded that glucose was preferentially degraded during storage, especially during uncooled concentrate storage, and that this has consequences for the final organic matter yield.

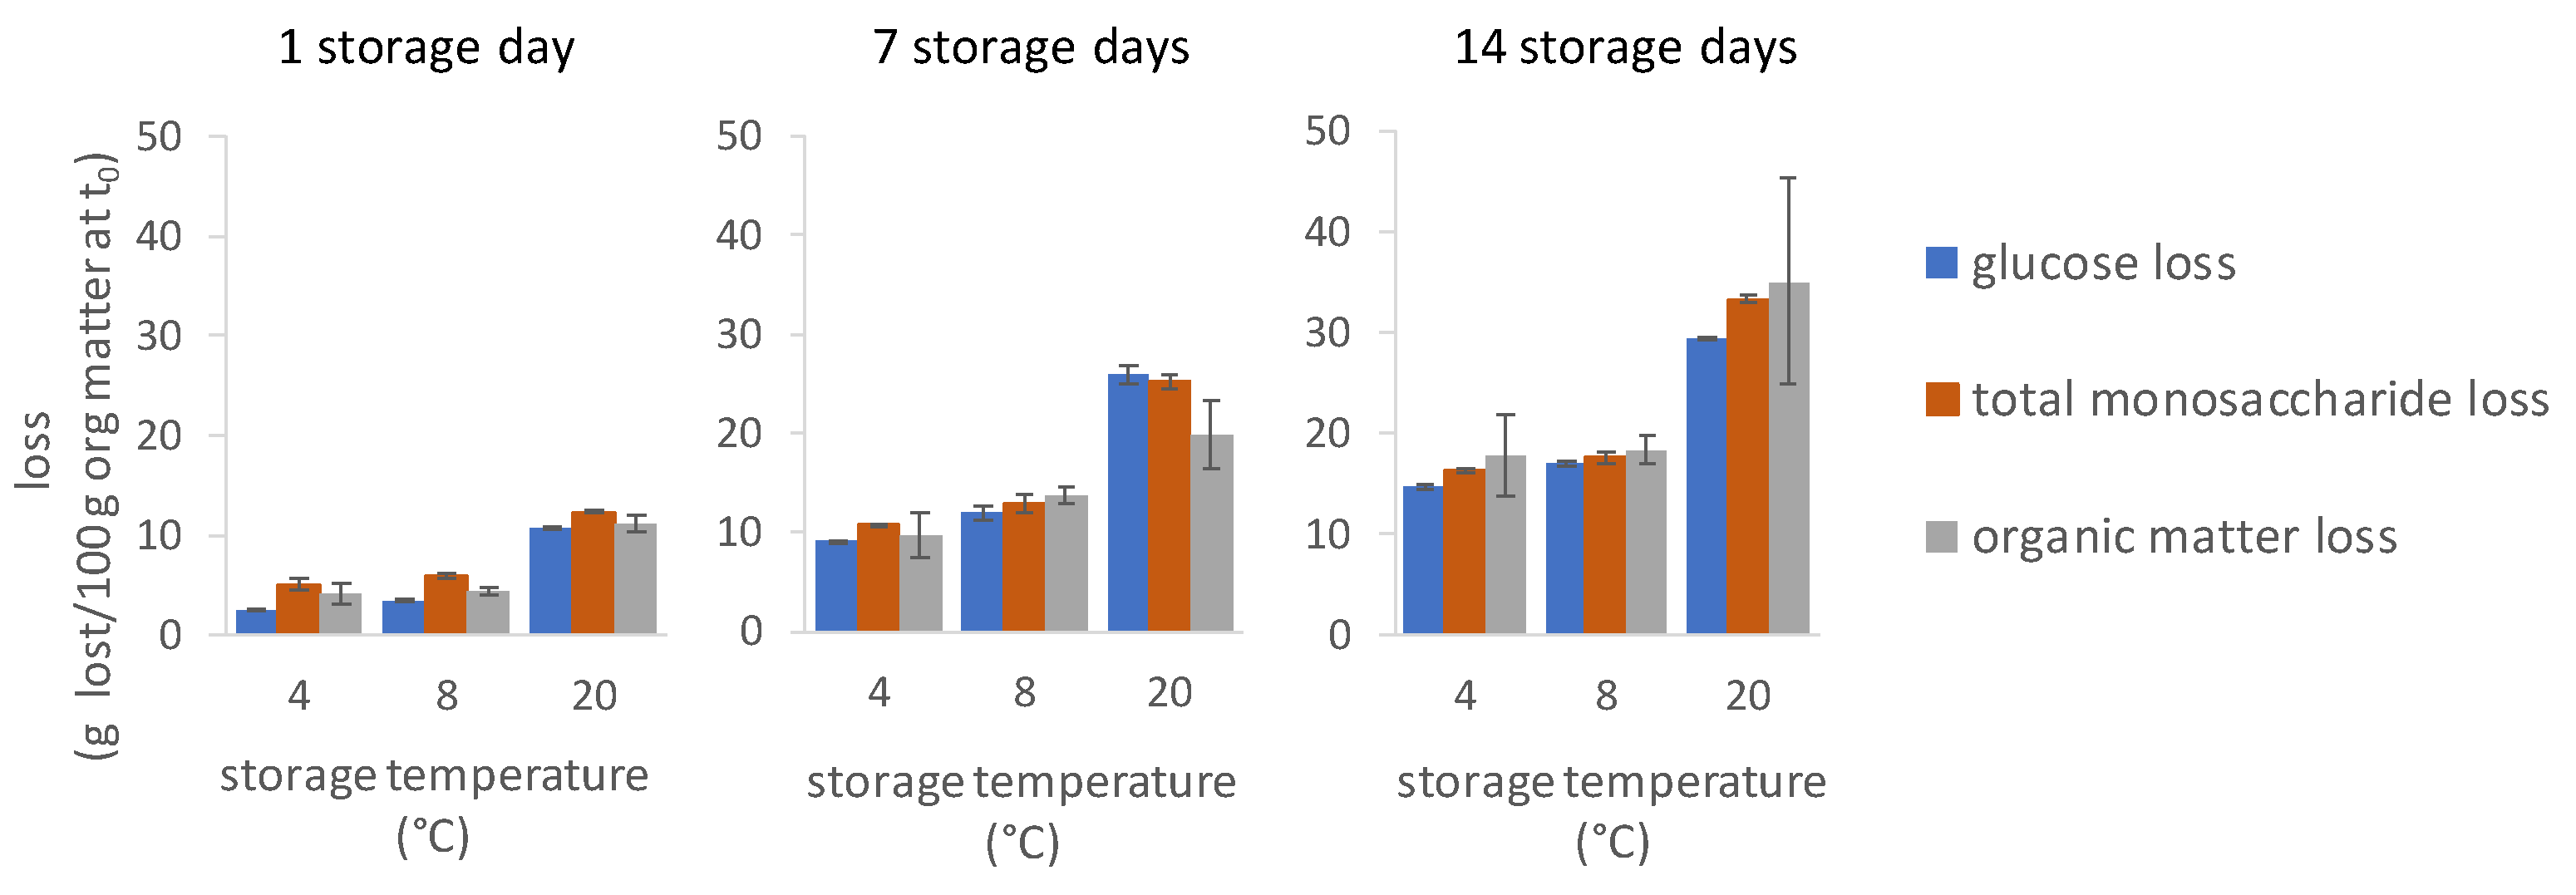
3.6. Organic Matter Losses

The total amount of organic matter changed surprisingly fast during concentrate storage, especially at 20 °C (Figure 7).
Both storage temperature and storage time affected organic matter loss during concentrate storage (p < 0.001). Organic matter loss increased with increasing storage time and temperature with an average loss of up to 35% after 14 days of storage at 20 °C. Almost all loss of organic matter can be attributed to the breakdown of carbohydrates, which in turn is almost entirely due to the loss of glucose (Figure 7). This confirms previous findings on other algae species showing that algae initially consume carbohydrates during dark respiration while other compounds like proteins [41,43] and lipids [41,44,45,46] are spared, though not always in the case of lipids [43,47]. Unfortunately, the organic matter loss could not be determined precisely for dilute culture storage (average estimated coefficient of variation of 61%, results not shown). This was probably because centrifugation after dilute culture storage introduced an additional source of variation which was not the case for concentrate storage where all samples were generated by the same centrifugation step. As explained above, carbohydrate levels expressed on an organic matter basis were rather stable for dilute culture storage but not for concentrate storage (Table 1), and similar trends were observed for phycoerythrin (Figure 4). Hence, it seems likely that the absolute amounts of carbohydrates, B-PE, and the organic matter remained stable during cooled dilute storage. However, these relative data must be interpreted with caution. Further research is recommended to establish the effect of dilute culture storage on algae yield in terms of absolute amounts obtained per culture volume. Anyway, this analysis shows that post-harvest storage conditions can have a major impact on the cultivation yield and that organic matter losses are significant during concentrate storage.

3.7. Conclusions

To bridge the time period between P. purpureum harvest and its processing, algae can be stored either as a concentrate or as a dilute culture. Dilute culture storage requires the use of large and expensive storage vessels, which is not the case for concentrate storage. This study revealed, however, that concentrate storage also entails adverse effects on algae quality and processability, especially when concentrates are not cooled. Microbial numbers tended to be higher for concentrate storage and the concentrations of smelly volatile components were clearly higher than for dilute culture storage. There was a small but significant difference in the relative B-PE levels with slightly higher levels after concentrate storage. Nevertheless, B-PE extraction can be expected to be more difficult after concentrate storage due to the formation of a weak gel structure. Gel formation occurred fast when concentrates were not cooled during storage. A solid-like behavior of a concentrate seriously hinders its processability and concentrates will no longer be able to be pumped, among other things. Finally, it was demonstrated that significant amounts of organic matter (4–35%) get lost during concentrate storage, already after one day of storage. In conclusion, this study demonstrated that concentrate storage can lead to serious quality losses even within the span of one day. These findings provide support to optimize the organization of daily operations in a P. purpureum cultivation and processing facility.

Supplementary Materials

The following are available online at https://www.mdpi.com/2076-3417/10/23/8315/s1, Figure S1: Short-chain fatty acid levels expressed in mg/L, Figure S2: Effect of dilute culture storage on rheology, Table S1: Dry and organic matter content at the start of storage test 1 and 2, Table S2: Results of the factorial ANOVA analysis on the impact of storage factors on carbohydrate levels, Table S3: Monosaccharide and uronic acid levels during concentrate storage expressed on ash basis.

Author Contributions

Conceptualization, J.V., L.S., and L.B.; methodology, J.V., L.S., and L.B.; validation, J.V. and L.S.; formal analysis, J.V. and L.S.; investigation, J.V. and L.S.; resources, L.B.; data curation, J.V.; writing—original draft preparation, J.V.; writing—review and editing, J.V., L.S., and L.B.; visualization, J.V.; supervision, L.B.; project administration, L.B.; funding acquisition, L.B. All authors have read and agreed to the published version of the manuscript.

Funding

This research was funded by NORTH-WEST EUROPE INTERREG, grant number NWE 639 as part of the IDEA project (Implementation and development of economic viable algae-based value chains in North-West Europe).

Acknowledgments

The authors would like to thank Jornt Spit (Thomas More Kempen, Belgium) for the algae cultivation and Nady Hufkens (VITO) and Mattia Zazzaroni (MSc student at the University of Parma) for technical assistance.

Conflicts of Interest

The authors declare no conflict of interest. The funders had no role in the design of the study; in the collection, analyses, or interpretation of data; in the writing of the manuscript, or in the decision to publish the results.

References

  1. Allnutt, F.C.T. Promising future products from microalgae for commercial applications. In Sustainable Downstream Processing of Microalgae for Industrial Application; Gayen, K., Bhowmick, T.K., Maity, S.K., Eds.; CRC Press: Boca Raton, FL, USA, 2019; p. 30. ISBN 9780429027970. [Google Scholar]
  2. Mobin, S.M.A.; Chowdhury, H.; Alam, F. Commercially important bioproducts from microalgae and their current applications—A review. Energy Procedia 2019, 160, 752–760. [Google Scholar] [CrossRef]
  3. Credence Research Algae Products Market by Type (Spirulina, Chlorella, Astaxanthin, Beta Carotene, Hydrocolloids), by Source (Brown, Blue-Green, Green, Red, Others), by Application (Nutraceuticals, Food & Feed Supplements, Pharmaceuticals, Paints & Colorants, Chemicals, fuels, Others)-Growth, Share, Opportunities & Competitive Analysis, 2019–2027. Available online: https://www.credenceresearch.com/report/algae-products-market (accessed on 12 November 2020).
  4. Melis, A. Solar energy conversion efficiencies in photosynthesis: Minimizing the chlorophyll antennae to maximize efficiency. Plant Sci. 2009, 177, 272–280. [Google Scholar] [CrossRef]
  5. IPCC. Special Report on Climate Change, Desertification, Land Degradation, Sustainable Land Management, Food Security, and Greenhouse Gas Fluxes in Terrestrial Ecosystems; IPCC: Geneva, Switzerland, 2019; Available online: https://www.ipcc.ch/srccl/ (accessed on 12 November 2020).
  6. Guiry, M.D. Porphyridium Purpureum (Bory) K.M.Drew & R.Ross. 1965. Available online: http://www.algaebase.org/search/species/detail/?species_id=564 (accessed on 12 November 2020).
  7. Enzing, C.; Nooijen, A.; Eggink, G.; Springer, J.; Wijffels, R.H. Algae and Genetic Modification Research, Production and Risks; Technopolis Group: Amsterdam, The Netherlands, 2012; Available online: https://cogem.net/publicatie/algae-and-genetic-modification-research-production-and-risks/ (accessed on 12 November 2020).
  8. Gaignard, C.; Gargouch, N.; Dubessay, P.; Delattre, C.; Pierre, G.; Laroche, C.; Fendri, I.; Abdelkafi, S.; Michaud, P. New horizons in culture and valorization of red microalgae. Biotechnol. Adv. 2019, 37, 193–222. [Google Scholar] [CrossRef]
  9. Paliwal, C.; Nesamma, A.A.; Jutur, P.P. Industrial scope with high-value biomolecules from microalgae. In Sustainable Downstream Processing of Microalgae for Industrial Application; CRC Press: Boca Raton, FL, USA, 2019; pp. 83–98. [Google Scholar]
  10. Ruiz-Ruiz, F.; Benavides, J.; Rito-Palomares, M. Scaling-up of a B-phycoerythrin production and purification bioprocess involving aqueous two-phase systems: Practical experiences. Process Biochem. 2013, 48, 738–745. [Google Scholar] [CrossRef]
  11. Leney, A.C.; Tschanz, A.; Heck, A.J.R. Connecting color with assembly in the fluorescent B-phycoerythrin protein complex. FEBS J. 2018, 285, 178–187. [Google Scholar] [CrossRef] [Green Version]
  12. Bermejo Román, R.; Alvárez-Pez, J.M.; Acién Fernández, F.G.; Molina Grima, E. Recovery of pure B-phycoerythrin from the microalga Porphyridium cruentum. J. Biotechnol. 2002, 93, 73–85. [Google Scholar] [CrossRef]
  13. Bernaerts, T.M.M.; Gheysen, L.; Foubert, I.; Hendrickx, M.E.; Van Loey, A.M. The potential of microalgae and their biopolymers as structuring ingredients in food: A review. Biotechnol. Adv. 2019, 37, 107419. [Google Scholar] [CrossRef]
  14. Rebolloso Fuentes, M.M.; Acién Fernández, G.G.; Sánchez Pérez, J.A.; Guil Guerrero, J.L. Biomass nutrient profiles of the microalga Porphyridium cruentum. Food Chem. 2000, 70, 345–353. [Google Scholar] [CrossRef]
  15. Bernaerts, T.M.M.; Gheysen, L.; Kyomugasho, C.; Jamsazzadeh Kermani, Z.; Vandionant, S.; Foubert, I.; Hendrickx, M.E.; Van Loey, A.M. Comparison of microalgal biomasses as functional food ingredients: Focus on the composition of cell wall related polysaccharides. Algal Res. 2018, 32, 150–161. [Google Scholar] [CrossRef]
  16. Sánchez-Saavedra, M.D.P.; Castro-Ochoa, F.Y.; Nava-Ruiz, V.M.; Ruiz-Güereca, D.A.; Villagómez-Aranda, A.L.; Siqueiros-Vargas, F.; Molina-Cárdenas, C.A. Effects of nitrogen source and irradiance on Porphyridium cruentum. J. Appl. Phycol. 2018, 30, 783–792. [Google Scholar] [CrossRef]
  17. Hsieh-Lo, M.; Castillo, G.; Ochoa-Becerra, M.A.; Mojica, L. Phycocyanin and phycoerythrin: Strategies to improve production yield and chemical stability. Algal Res. 2019, 42, 101600. [Google Scholar] [CrossRef]
  18. Soomro, R.R.; Ndikubwimana, T.; Zeng, X.; Lu, Y.; Lin, L.; Danquah, M.K. Development of a two-stage microalgae dewatering process—A life cycle assessment approach. Front. Plant Sci. 2016, 7, 1–12. [Google Scholar] [CrossRef] [Green Version]
  19. Milledge, J.J.; Heaven, S. A review of the harvesting of micro-algae for biofuel production. Rev. Environ. Sci. Biotechnol. 2013, 12, 165–178. [Google Scholar] [CrossRef] [Green Version]
  20. Munier, M.; Jubeau, S.; Wijaya, A.; Morançais, M.; Dumay, J.; Marchal, L.; Jaouen, P.; Fleurence, J. Physicochemical factors affecting the stability of two pigments: R-phycoerythrin of Grateloupia turuturu and B-phycoerythrin of Porphyridium cruentum. Food Chem. 2014, 150, 400–407. [Google Scholar] [CrossRef]
  21. ISO/TC 34/SC 9 Microbiology ISO 4833-1:2013-Microbiology of the Food Chain—Horizontal Method for the Enumeration of Microorganisms—Part 1: Colony Count at 30 Degrees C by the Pour Plate Technique. Available online: https://www.iso.org/standard/53728.html (accessed on 12 November 2020).
  22. Verspreet, J.; Kreps, S.; Bastiaens, L. Evaluation of Microbial Load, Formation of Odorous Metabolites and Lipid Stability during Wet Preservation of Nannochloropsis gaditana Concentrates. Appl. Sci. 2020, 10, 3419. [Google Scholar] [CrossRef]
  23. Li, T.; Xu, J.; Wu, H.; Jiang, P.; Chen, Z.; Xiang, W. Growth and biochemical composition of porphyridium purpureum SCS-02 under different nitrogen concentrations. Mar. Drugs 2019, 17. [Google Scholar] [CrossRef] [Green Version]
  24. Kavitha, M.D.; Seema Shree, M.H.; Vidyashankar, S.; Sarada, R. Acute and subchronic safety assessment of Porphyridium purpureum biomass in the rat model. J. Appl. Phycol. 2016, 28, 1071–1083. [Google Scholar] [CrossRef]
  25. Gilbert-López, B.; Mendiola, J.A.; Fontecha, J.; van den Broek, L.A.M.; Sijtsma, L.; Cifuentes, A.; Herrero, M.; Ibáñez, E. Downstream processing of Isochrysis galbana: A step towards microalgal biorefinery. Green Chem. 2015, 17, 4599–4609. [Google Scholar] [CrossRef] [Green Version]
  26. Ara, K.; Hama, M.; Akiba, S.; Koike, K.; Okisaka, K.; Hagura, T.; Kamiya, T.; Tomita, F. Foot odor due to microbial metabolism and its control. Can. J. Microbiol. 2006, 52, 357–364. [Google Scholar] [CrossRef] [Green Version]
  27. Smith, E.; Macfarlane, G. Dissimilatory amino acid metabolism in human colonic bacteria. Anaerobe 1997, 3, 327–337. [Google Scholar] [CrossRef]
  28. Leffingwell, J.C.; Leffingwell, D. GRAS flavor chemicals detection thresholds. Perfum. Flavorist 1991, 16, 1–13. [Google Scholar]
  29. Roberts, K.P.; Heaven, S.; Banks, C.J. Comparative testing of energy yields from micro-algal biomass cultures processed via anaerobic digestion. Renew. Energy 2016, 87, 744–753. [Google Scholar] [CrossRef] [Green Version]
  30. Achyuthan, K.; Harper, J.; Manginell, R.; Moorman, M. Volatile metabolites emission by in vivo microalgae—An overlooked opportunity? Metabolites 2017, 7, 39. [Google Scholar] [CrossRef]
  31. Wileman, A.; Ozkan, A.; Berberoglu, H. Rheological properties of algae slurries for minimizing harvesting energy requirements in biofuel production. Bioresour. Technol. 2012, 104, 432–439. [Google Scholar] [CrossRef]
  32. Patel, A.K.; Laroche, C.; Marcati, A.; Ursu, A.V.; Jubeau, S.; Marchal, L.; Petit, E.; Djelveh, G.; Michaud, P. Separation and fractionation of exopolysaccharides from Porphyridium cruentum. Bioresour. Technol. 2013, 145, 345–350. [Google Scholar] [CrossRef]
  33. Bernaerts, T.M.M.; Panozzo, A.; Doumen, V.; Foubert, I.; Gheysen, L.; Goiris, K.; Moldenaers, P.; Hendrickx, M.E.; Van Loey, A.M. Microalgal biomass as a (multi)functional ingredient in food products: Rheological properties of microalgal suspensions as affected by mechanical and thermal processing. Algal Res. 2017, 25, 452–463. [Google Scholar] [CrossRef]
  34. Schneider, N.; Gerber, M. Correlation between viscosity, temperature and total solid content of algal biomass. Bioresour. Technol. 2014, 170, 293–302. [Google Scholar] [CrossRef]
  35. Geresh, S.; Adin, I.; Yarmolinsky, E.; Karpasas, M. Characterization of the extracellular polysaccharide of Porphyridium sp.: Molecular weight determination and rheological properties. Carbohydr. Polym. 2002, 50, 183–189. [Google Scholar] [CrossRef]
  36. Bernaerts, T.M.M.; Kyomugasho, C.; Van Looveren, N.; Gheysen, L.; Foubert, I.; Hendrickx, M.E.; Van Loey, A.M. Molecular and rheological characterization of different cell wall fractions of Porphyridium cruentum. Carbohydr. Polym. 2018, 195, 542–550. [Google Scholar] [CrossRef]
  37. Rao, M.A. Rheology of Fluid, Semisolid, and Solid Foods; Food Engineering Series; Springer US: Boston, MA, USA, 2014; ISBN 978-1-4614-9229-0. [Google Scholar]
  38. Bernaerts, T.M.M.; Panozzo, A.; Verhaegen, K.A.F.; Gheysen, L.; Foubert, I.; Moldenaers, P.; Hendrickx, M.E.; Van Loey, A.M. Impact of different sequences of mechanical and thermal processing on the rheological properties of Porphyridium cruentum and Chlorella vulgaris as functional food ingredients. Food Funct. 2018, 9, 2433–2446. [Google Scholar] [CrossRef]
  39. Madeira, M.S.; Cardoso, C.; Lopes, P.A.; Coelho, D.; Afonso, C.; Bandarra, N.M.; Prates, J.A.M. Microalgae as feed ingredients for livestock production and meat quality: A review. Livest. Sci. 2017, 205, 111–121. [Google Scholar] [CrossRef]
  40. Li, S.Y.; Lellouche, J.P.; Shabtai, Y.; Arad, S. Fixed carbon partitioning in the red microalga Porphyridium sp. (Rhodophyta). J. Phycol. 2001, 37, 289–297. [Google Scholar] [CrossRef]
  41. Brown, M.; Robert, R. Preparation and assessment of microalgal concentrates as feeds for larval and juvenile Pacific oyster (Crassostrea gigas). Aquaculture 2002, 207, 289–309. [Google Scholar] [CrossRef]
  42. Beardall, J.; Burger-Wiersma, T.; Rijkeboer, M.; Sukenik, A.; Lemoalle, J.; Dubinsky, Z.; Fontvielle, D. Studies on enhanced post-illumination respiration in microalgae. J. Plankton Res. 1994, 16, 1401–1410. [Google Scholar] [CrossRef]
  43. Welladsen, H.; Kent, M.; Mangott, A.; Li, Y. Shelf-life assessment of microalgae concentrates: Effect of cold preservation on microalgal nutrition profiles. Aquaculture 2014, 430, 241–247. [Google Scholar] [CrossRef]
  44. Montaini, E.; Chini Zittelli, G.; Tredici, M.R.; Molina Grima, E.; Fernández Sevilla, J.M.; Sánchez Pérez, J.A. Long-term preservation of Tetraselmis suecica: Influence of storage on viability and fatty acid profile. Aquaculture 1995, 134, 81–90. [Google Scholar] [CrossRef]
  45. Balduyck, L.; Bijttebier, S.; Bruneel, C.; Jacobs, G.; Voorspoels, S.; Van Durme, J.; Muylaert, K.; Foubert, I. Lipolysis in T-Isochrysis lutea during wet storage at different temperatures. Algal Res. 2016, 18, 281–287. [Google Scholar] [CrossRef]
  46. Balduyck, L.; Stock, T.; Bijttebier, S.; Bruneel, C.; Jacobs, G.; Voorspoels, S.; Muylaert, K.; Foubert, I. Integrity of the microalgal cell plays a major role in the lipolytic stability during wet storage. Algal Res. 2017, 25, 516–524. [Google Scholar] [CrossRef]
  47. Ponis, E.; Parisi, G.; Chini Zittelli, G.; Lavista, F.; Robert, R.; Tredici, M.R. Pavlova lutheri: Production, preservation and use as food for Crassostrea gigas larvae. Aquaculture 2008, 282, 97–103. [Google Scholar] [CrossRef] [Green Version]
Figure 1. Schematic representation of the two storage approaches: concentrate storage and dilute culture storage.
Applsci 10 08315 g001
Figure 2. Average number of colony-forming units (CFU) (a) at t0 and (b) after 7 and 14 days of storage. The p-values of the factorial ANOVA analysis (without t0 data) are shown above the right graph. Error bars represent standard deviations. For the bar marked with an asterisk, the lower error bar is not displayed as it must go below the minimal value on the vertical axis.
Applsci 10 08315 g002
Figure 3. Short-chain fatty acid (SCFA) levels-storage test 1. SCFA levels during concentrate storage (left) and dilute culture storage (right). Error bars represent standard deviations. Propionic acid, butyric acid, and isovaleric acid levels that are not labeled by a common letter are significantly different. For acetic acid, there was no significant interaction between storage approach, time, and temperature (p = 0.138), so no post hoc analysis was performed and no letter labels were added in the acetic acid figures. No isovaleric acid was detected in the samples obtained after dilute culture storage (isovaleric acid detection limit = 0.046 mg/L). Supplementary Materials Figure S1 shows SCFA levels expressed in mg/L.
Applsci 10 08315 g003
Figure 4. (a) B-Phycoerythrin (B-PE) levels at the start and (b) after storage (both 7 and 14 days) grouped by storage approach. (c) B-PE levels after storage (both 7 and 14 days) grouped by storage temperature. Bars that are not marked with a common lowercase letter within one graph are statistically different, t0 data were not included in the statistical analysis of data in graphs (b) and (c). Because storage time had no significant impact, 7- and 14-days storage data were pooled in graphs (b) and (c).
Applsci 10 08315 g004
Figure 5. (a) Viscosity of the storage concentrate at t0 in function of the applied shear rate and (b) after storage at a shear rate of 10 s−1. (c) Viscosity of the dilute culture storage concentrate at t0 in function of the applied shear rate and (d) after storage at a shear rate of 10 s−1. Viscosity values in panel (b,d) are averages of duplicate measurements with error bars depicting the standard deviations. Bars that are not marked with a common lowercase letter within one graph are statistically different, t0 data are not included in the statistical analysis.
Applsci 10 08315 g005aApplsci 10 08315 g005b
Figure 6. (a) Storage modulus (G’) and loss modulus (G”) for the concentrate storage paste at t0. (b) Storage modulus at a 1% shear strain during concentrate storage. (c) Phase shift δ at a 1% shear strain during concentrate storage. Values in panel (b,c) are averages of duplicate measurements with error bars depicting the standard deviations. Bars that are not marked with a common lowercase letter within one graph are statistically different, t0 data are not included in the statistical analysis.
Applsci 10 08315 g006
Figure 7. Glucose, total monosaccharide, and organic matter losses during concentrate storage.
Applsci 10 08315 g007
Table 1. Monosaccharide and uronic acid levels expressed on organic matter basis. The last column shows the sum of all monosaccharides and uronic acids corrected for water uptake during hydrolysis. Results of the factorial ANOVA analysis on the impact of storage factors on carbohydrate levels are shown in Supplementary Materials Table S2.
Storage Temperature (°C)Storage Time (Days)Glucose (% Organic Matter)Galactose (% Organic Matter)Xylose (% Organic Matter)Glucuronic Acid (% Organic Matter)Mannuronic Acid (% Organic Matter)Sum (% Organic Matter)
Concentrate storage033.1 ± 1.08.6 ± 0.36.7 ± 0.20.82 ± 0.010.38 ± 0.0145.2 ± 1.3
4132.0 ± 0.18.7 ± 0.27.0 ± 0.10.50 ± 0.390.38 ± 0.0144.1 ± 0.7
726.6 ± 0.09.3 ± 0.07.1 ± 0.00.89 ± 0.020.40 ± 0.0140.2 ± 0.1
1422.4 ± 0.39.6 ± 0.17.5 ± 0.10.92 ± 0.000.47 ± 0.0037.1 ± 0.3
8131.0 ± 0.28.6 ± 0.17.0 ± 0.00.78 ± 0.040.39 ± 0.0043.3 ± 0.3
723.7 ± 0.79.5 ± 0.47.3 ± 0.20.93 ± 0.040.44 ± 0.0138.2 ± 1.3
1419.9 ± 0.410.0 ± 0.37.9 ± 0.11.00 ± 0.010.53 ± 0.0135.9 ± 0.7
20125.3 ± 0.18.9 ± 0.17.5 ± 0.10.82 ± 0.020.41 ± 0.0139.0 ± 0.2
79.0 ± 1.29.9 ± 0.28.7 ± 0.41.16 ± 0.040.37 ± 0.0226.4 ± 0.9
149.6 ± 0.112.1 ± 0.412.0 ± 0.31.86 ± 0.080.28 ± 0.0233.2 ± 0.9
Dilute culture storage031.9 ± 0.18.8 ± 0.16.3 ± 0.10.85 ± 0.010.43 ± 0.0044.1 ± 0.3
4132.4 ± 1.09.1 ± 0.27.1 ± 0.10.78 ± 0.030.21 ± 0.0145.2 ± 1.3
730.6 ± 0.18.8 ± 0.16.8 ± 0.00.87 ± 0.010.43 ± 0.0143.2 ± 0.2
1429.1 ± 0.48.9 ± 0.26.9 ± 0.10.86 ± 0.020.47 ± 0.0142.0 ± 0.6
8131.7 ± 0.49.2 ± 0.56.8 ± 0.10.78 ± 0.140.23 ± 0.0144.4 ± 0.4
731.1 ± 0.19.0 ± 0.17.0 ± 0.10.86 ± 0.010.45 ± 0.0044.0 ± 0.2
1429.6 ± 0.19.2 ± 0.07.1 ± 0.10.89 ± 0.020.49 ± 0.0243.0 ± 0.2
20131.9 ± 0.18.7 ± 0.07.1 ± 0.10.77 ± 0.010.21 ± 0.0044.2 ± 0.1
729.6 ± 0.39.5 ± 0.17.5 ± 0.10.93 ± 0.020.44 ± 0.0143.6 ± 0.5
1425.1 ± 0.39.3 ± 0.27.1 ± 0.10.94 ± 0.010.58 ± 0.0139.3 ± 0.6
Publisher’s Note: MDPI stays neutral with regard to jurisdictional claims in published maps and institutional affiliations.

