Deep-Learning-Based Computer-Aided Systems for Breast Cancer Imaging: A Critical Review

 ,
,  and
and 
Abstract
1. Introduction
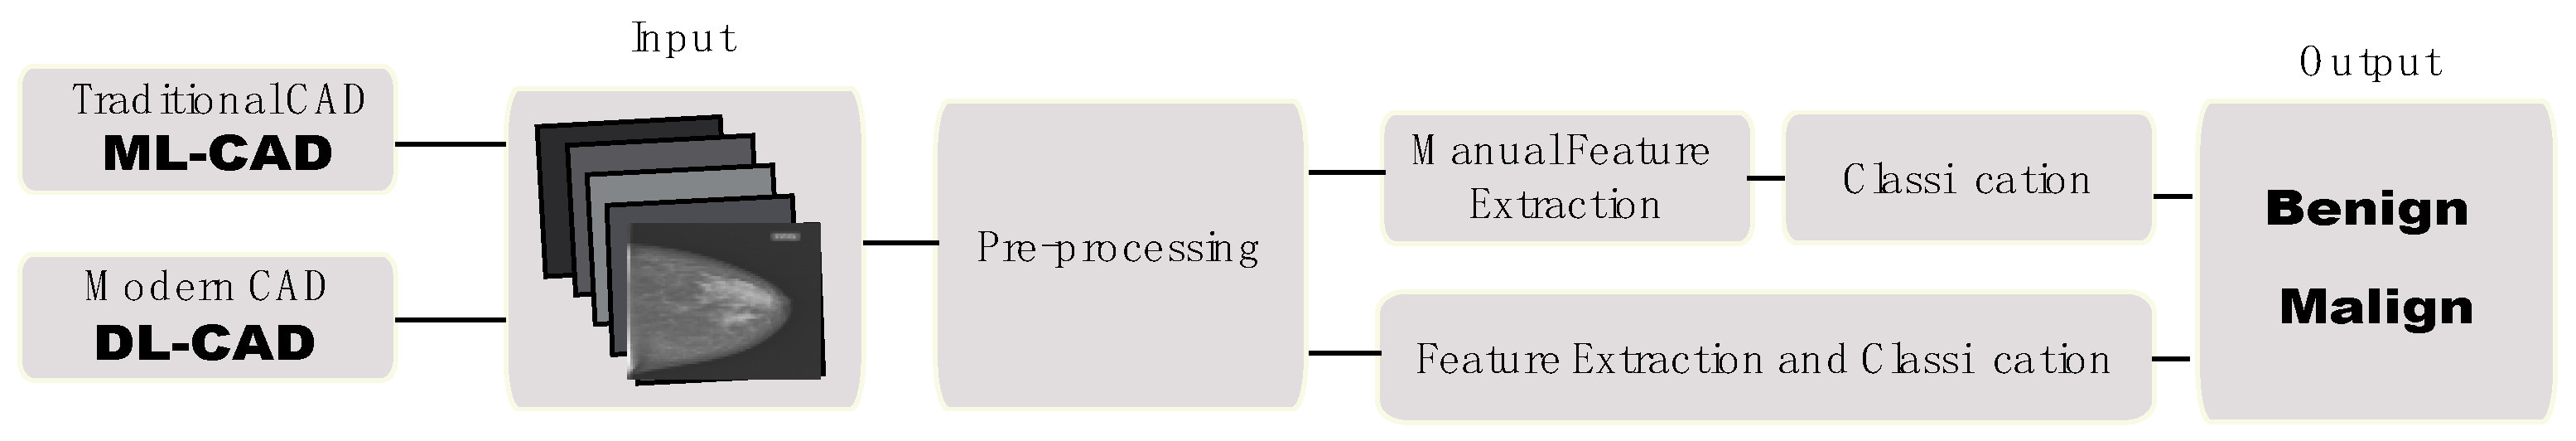
- How the new DL-CAD systems provide breast imaging classification in comparison with the traditional CAD system?
- Which artificial neural networks implemented in DL-CAD systems give better performance regarding breast tumor classification?
- Which are the main DL-CAD architectures used for breast tumor diagnosis/detection?
- What are the performance metrics used for evaluating DL-CAD systems?
2. Materials and Methods
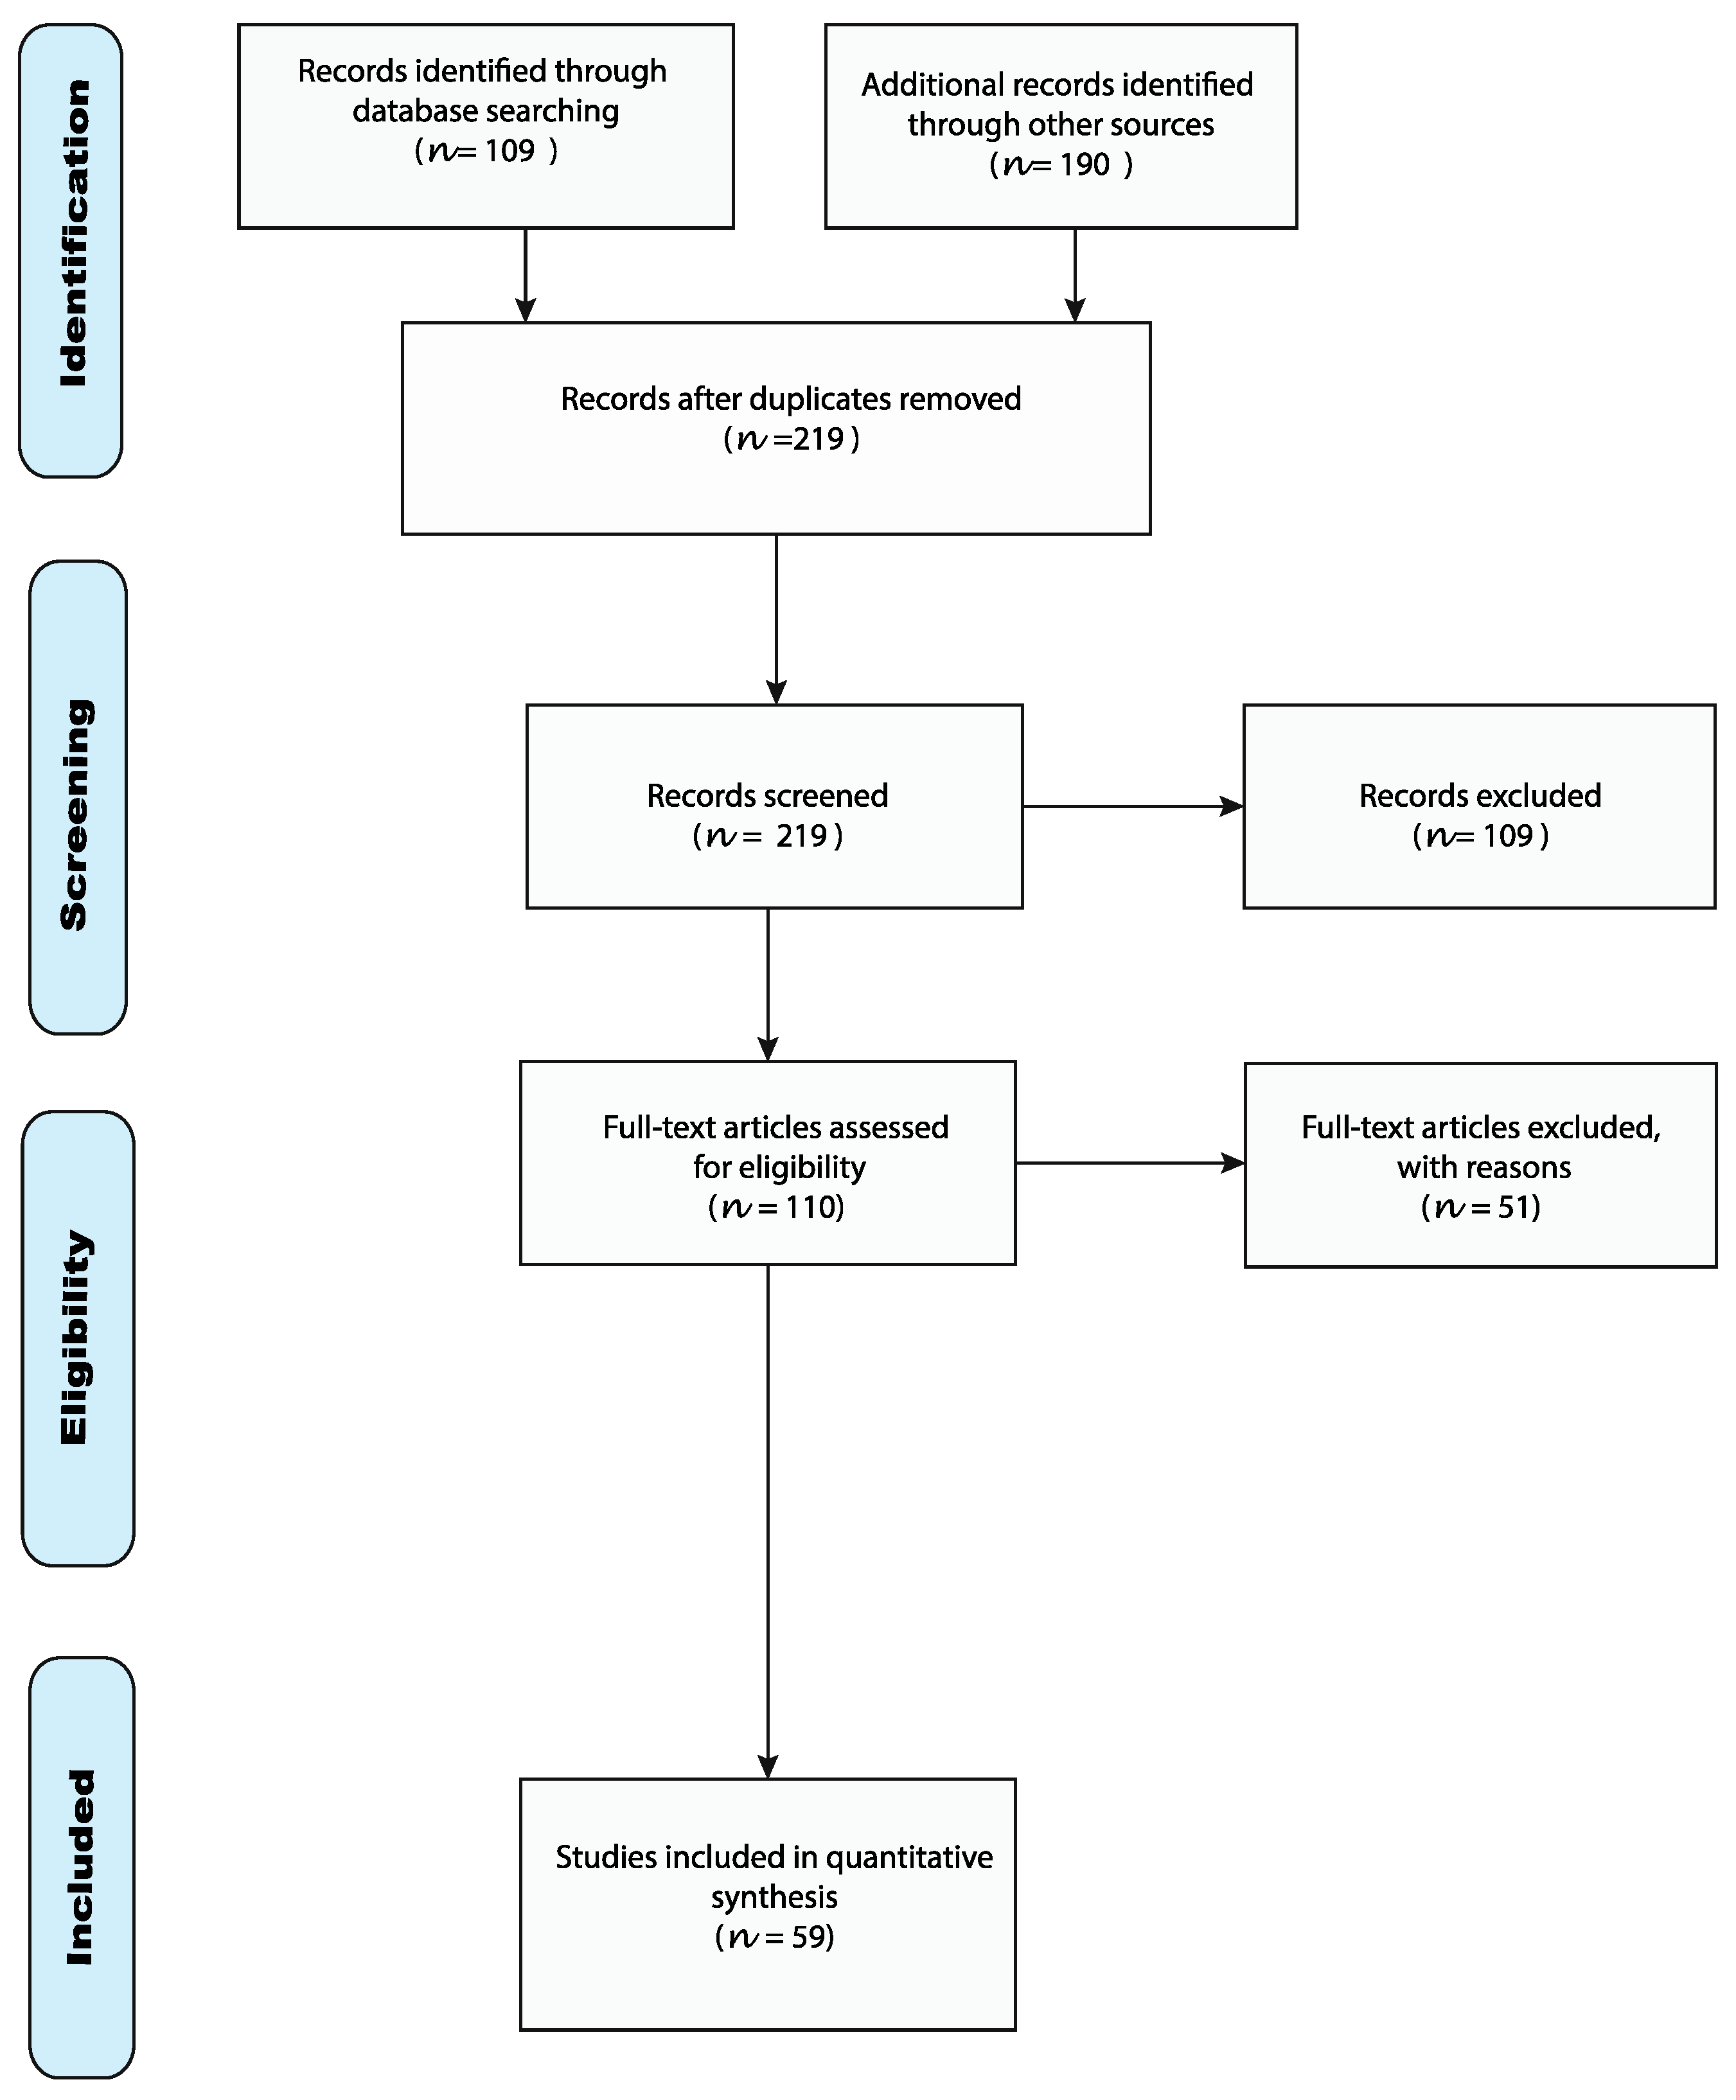
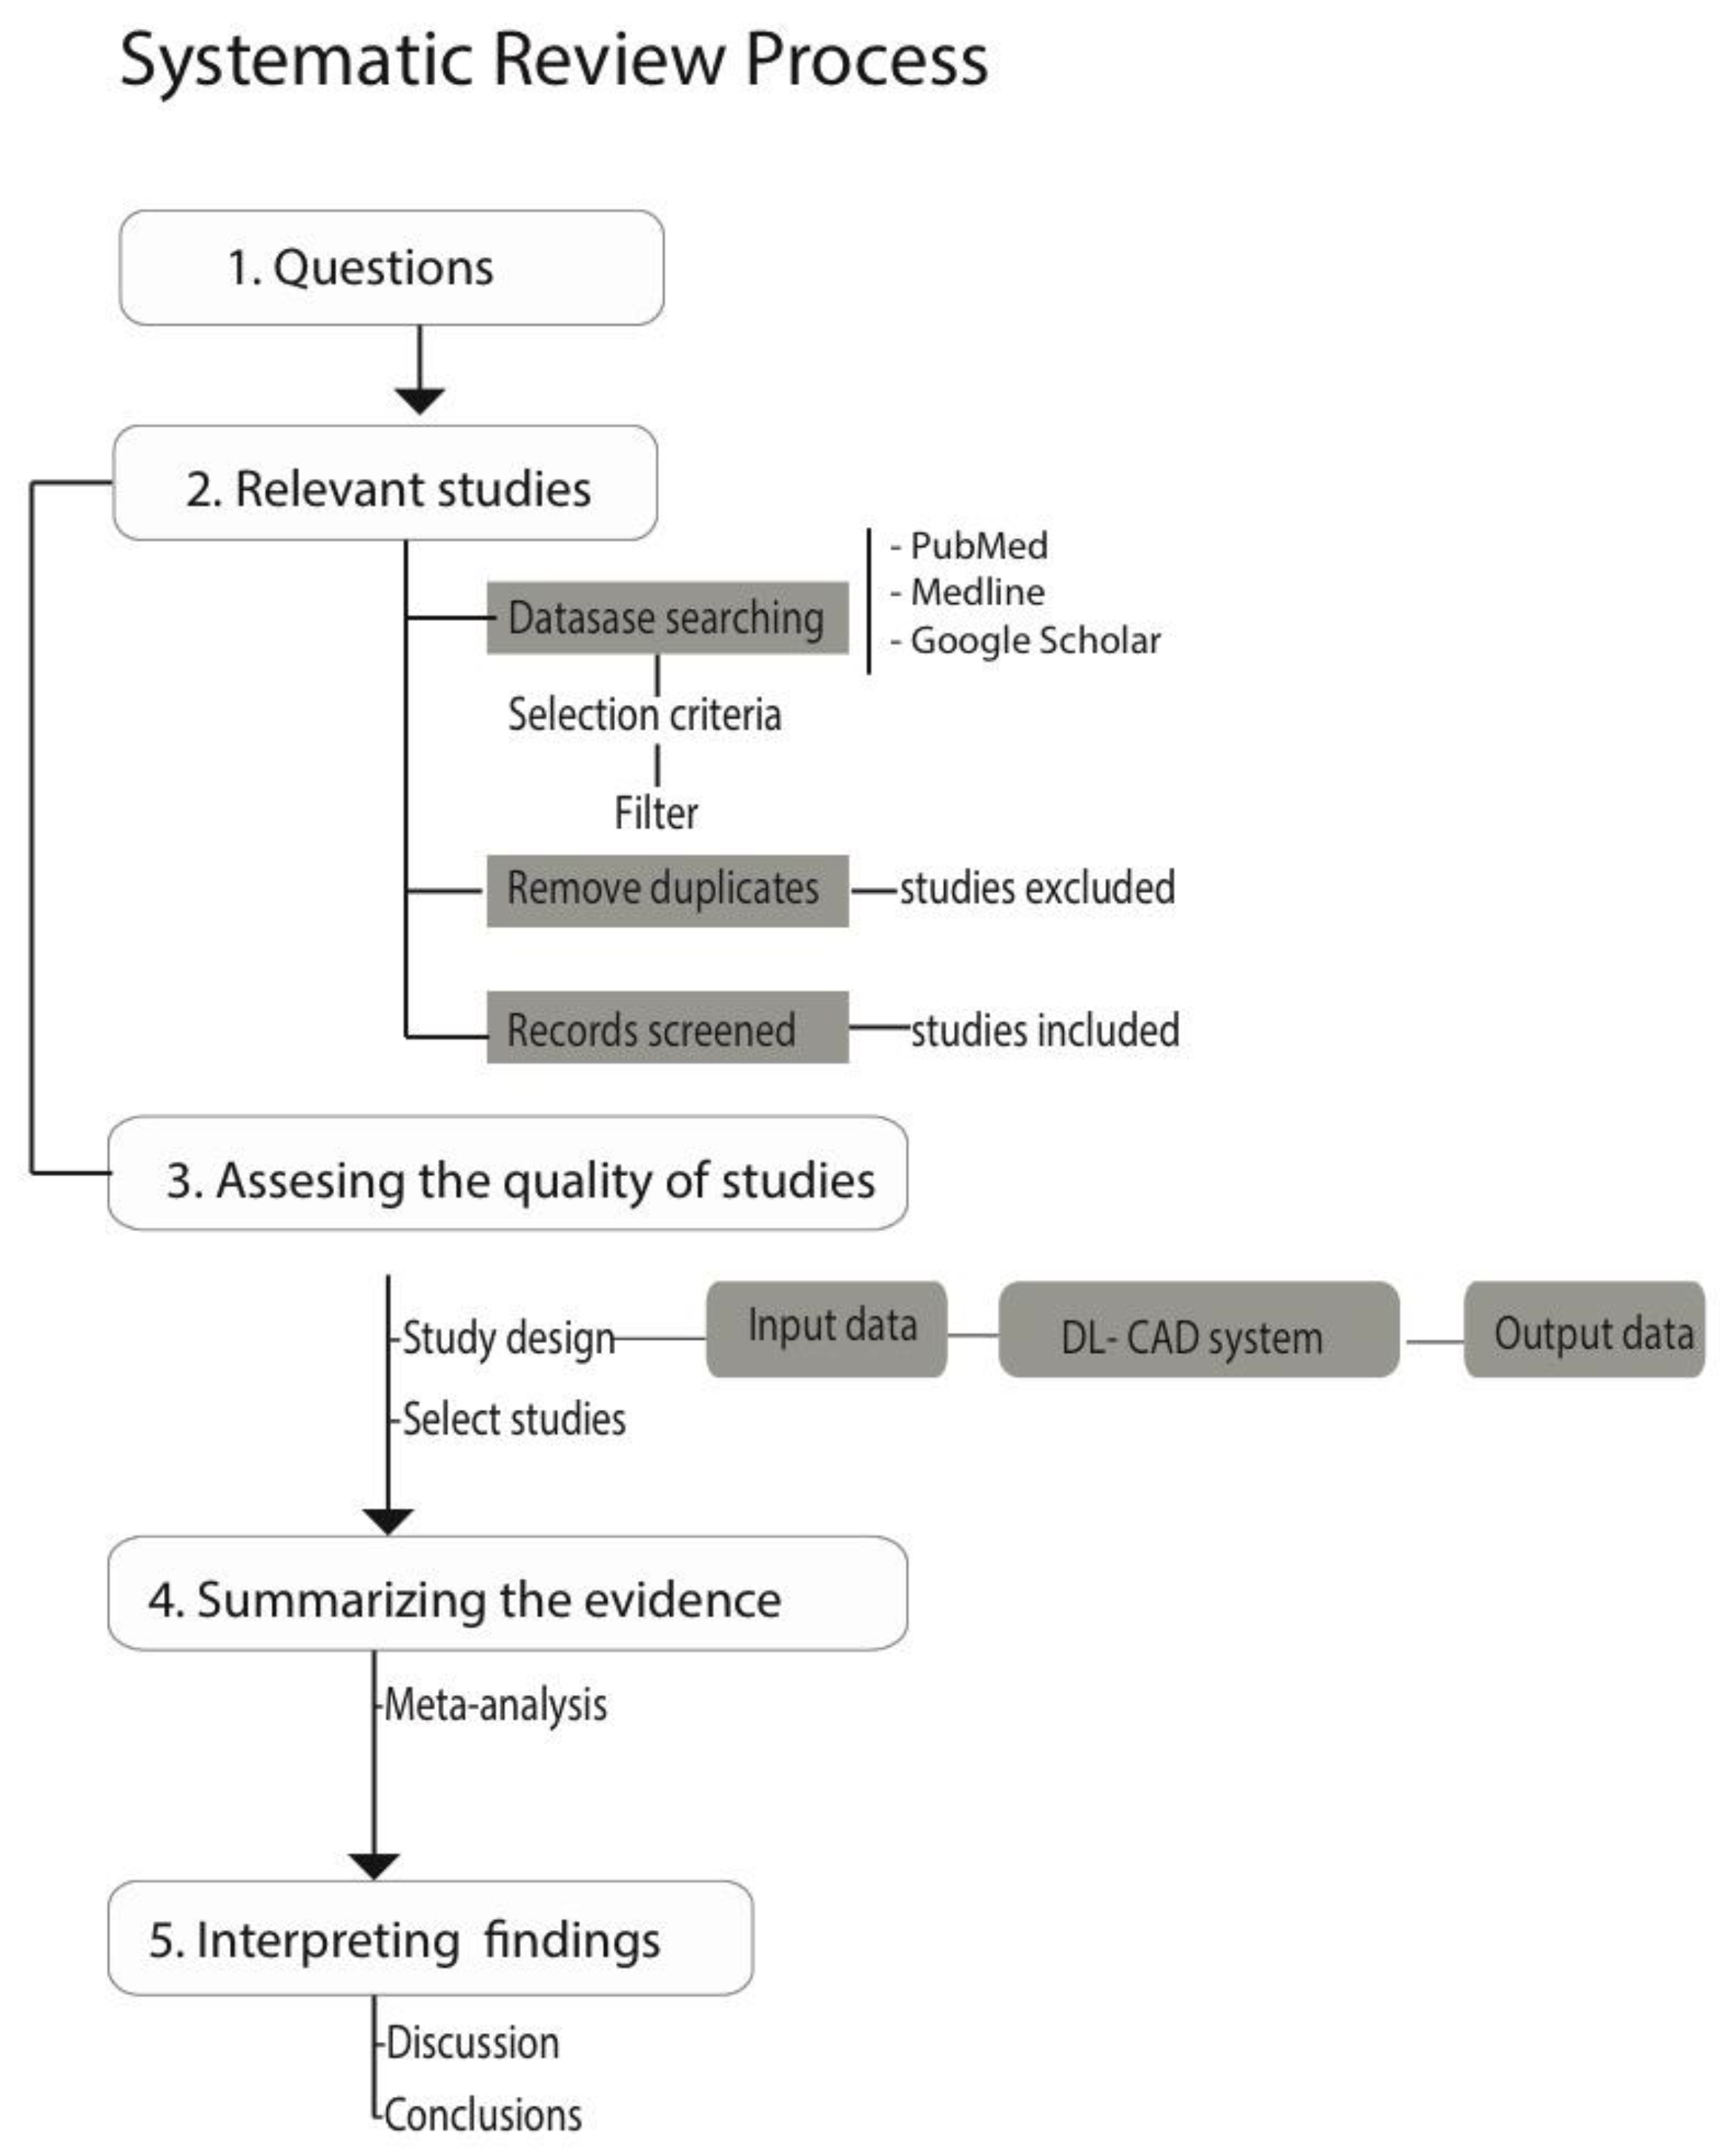
2.1. Flowchart of the Review
2.1.1. Inclusion Criteria
2.1.2. Exclusion Criteria
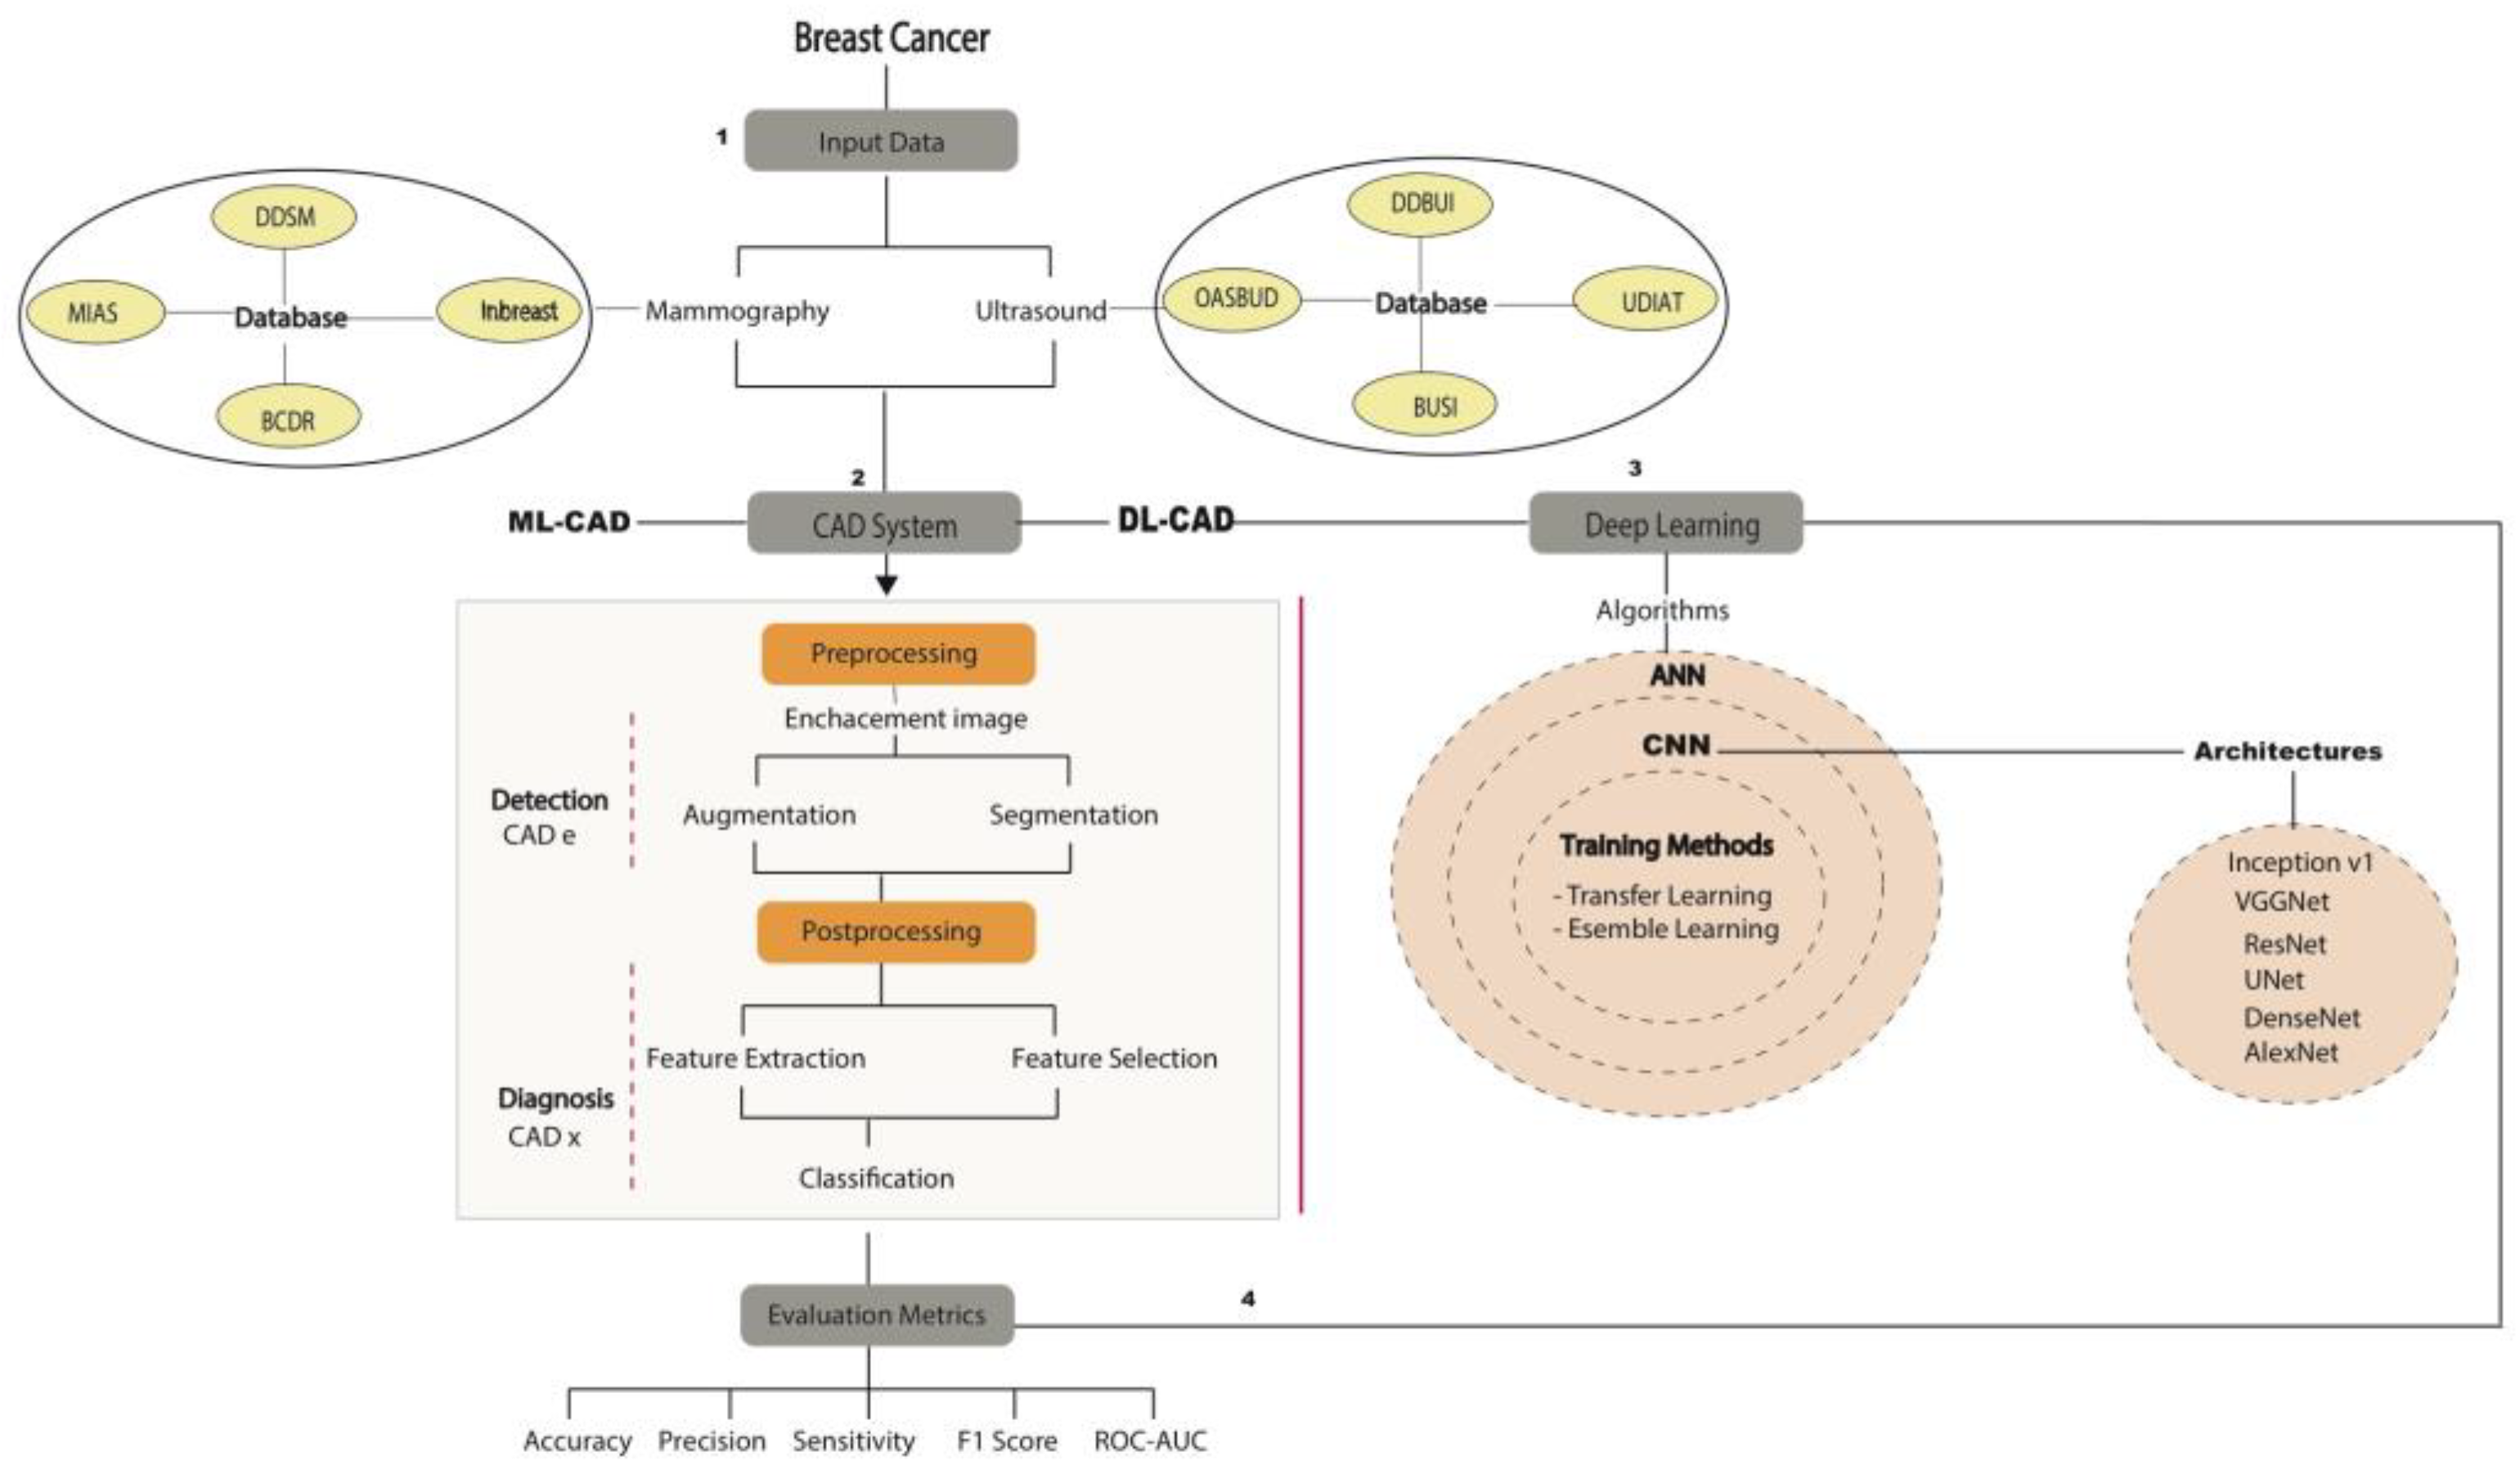
2.2. Study Design
2.2.1. Public Databases
2.2.2. CAD Focused on DM and US
2.2.3. Preprocessing
Image Enhancement
Image Augmentation
Image Segmentation
2.2.4. Postprocessing
Image Feature Extraction and Selection
2.2.5. Classification
Deep Learning Models
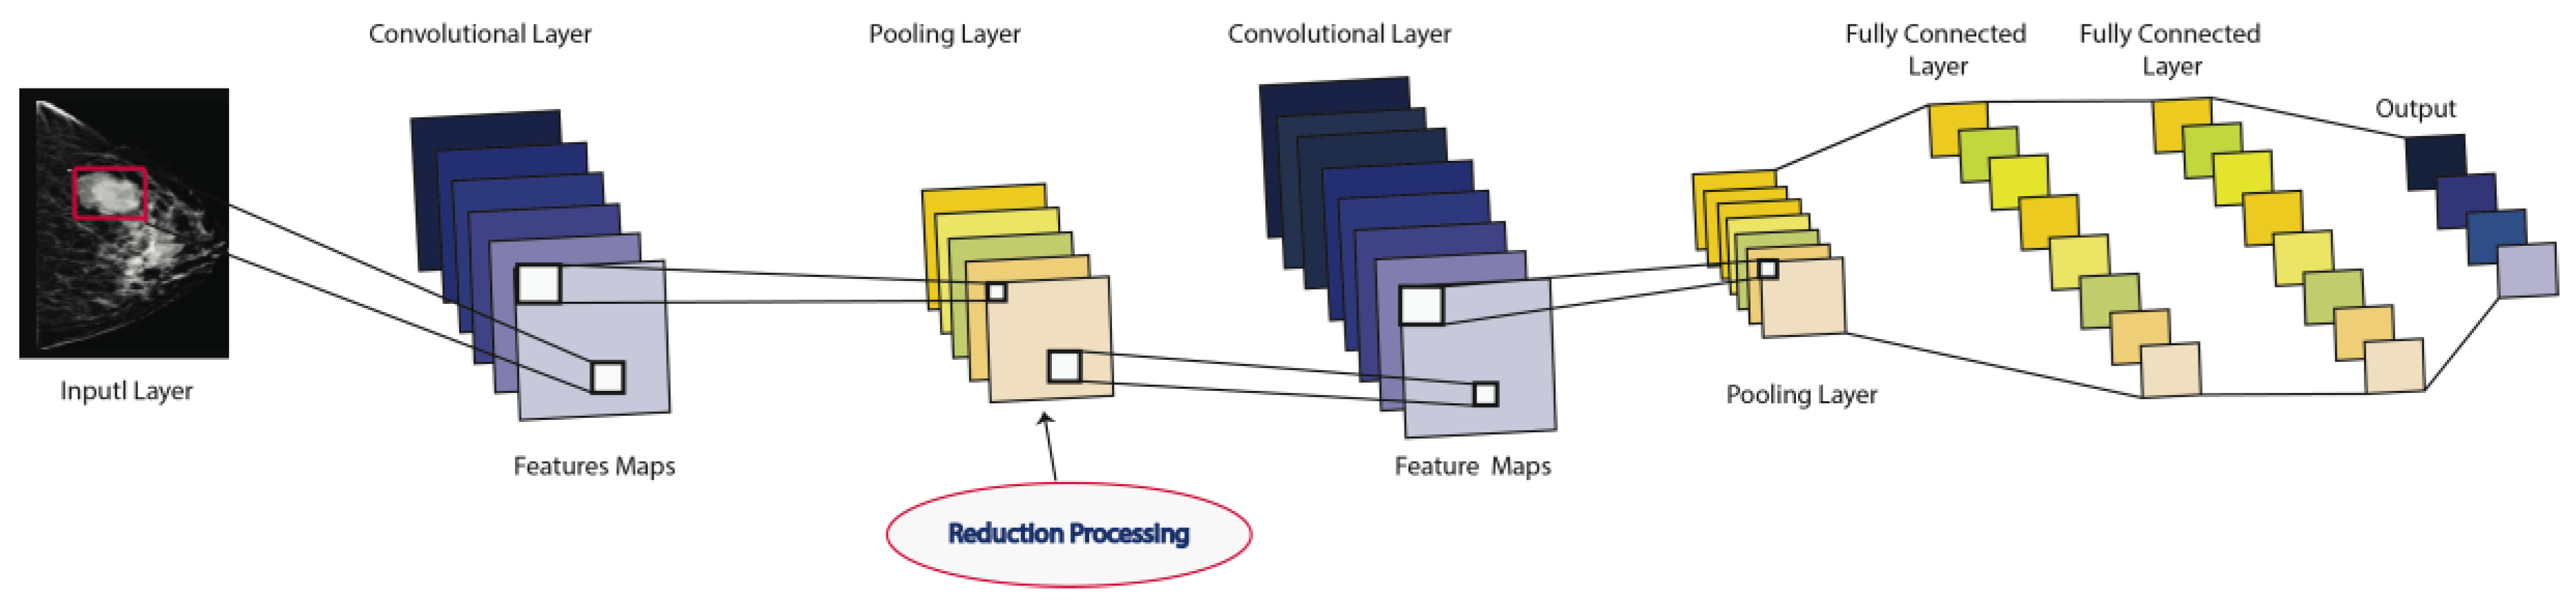
Convolutional Neural Networks
2.2.6. Evaluation Metrics
3. Results
3.1. CNN Architectures
3.2. Performance Metrics
4. Discussion and Conclusions
Author Contributions
Funding
Conflicts of Interest
Abbreviations
| ANN | artificial neural network |
| CADx | computer-aided diagnosis |
| CADe | computer-aided detection |
| CNN | convolutional neural network |
| DM | digital mammography |
| DL | deep learning |
| DNN | deep neural network |
| DL-CAD | deep learning CAD system |
| CC | craniocaudal |
| MC | microcalcifications |
| ML | machine learning |
| MLO | mediolateral oblique |
| ROI | region of interest |
| US | ultrasound |
| MLP | Muli-layer perceptron |
| DBT | digital breast tomosynthesis |
| MIL | multiple instances learning |
| CRF | conditional random forest |
| RPN | region proposal network |
| GAN | generative adversarial network |
| IoU | intersection over union |
| SDAE | stacked denoising auto-encoder |
| CBIS | Curated Breast Imaging Subset |
| YOLO | You Only Look Once |
| ERFNet | Efficient Residual Factorized Network |
| CLAHE | contrast-limited adaptive histogram equalization |
| PCA | principal component analysis |
| LDA | linear discriminant analysis |
| GLCM | grey-level co-occurrence matrix |
| RF | random forest |
| DBT | decision boundary features |
| SVM | support vector machine |
| NN | neural network |
| SOM | self-organizing map |
| KNN | K-nearest neighbor |
| BDT | binary decision tree |
| DBN | deep belief networks |
| WPT | wavelet packet transform |
References
- Bray, F.; Ferlay, J.; Soerjomataram, I.; Siegel, R.L.; Torre, L.A.; Jemal, A. Global cancer statistics. CA Cancer J. Clin. 2011, 68, 394–424. [Google Scholar] [CrossRef]
- Gao, F.; Chia, K.-S.; Ng, F.-C.; Ng, E.-H.; Machin, D. Interval cancers following breast cancer screening in Singaporean women. Int. J. Cancer 2002, 101, 475–479. [Google Scholar] [CrossRef] [PubMed]
- Munir, K.; Elahi, H.; Ayub, A.; Frezza, F.; Rizzi, A. Cancer Diagnosis Using Deep Learning: A Bibliographic Review. Cancers 2019, 11, 1235. [Google Scholar] [CrossRef]
- American Cancer Society. Breast Cancer Facts and Figures 2019; American Cancer Society: Atlanta, GA, USA, 2019. [Google Scholar]
- Nahid, A.-A.; Kong, Y. Involvement of Machine Learning for Breast Cancer Image Classification: A Survey. Comput. Math. Methods Med. 2017, 2017, 3781951. [Google Scholar] [CrossRef]
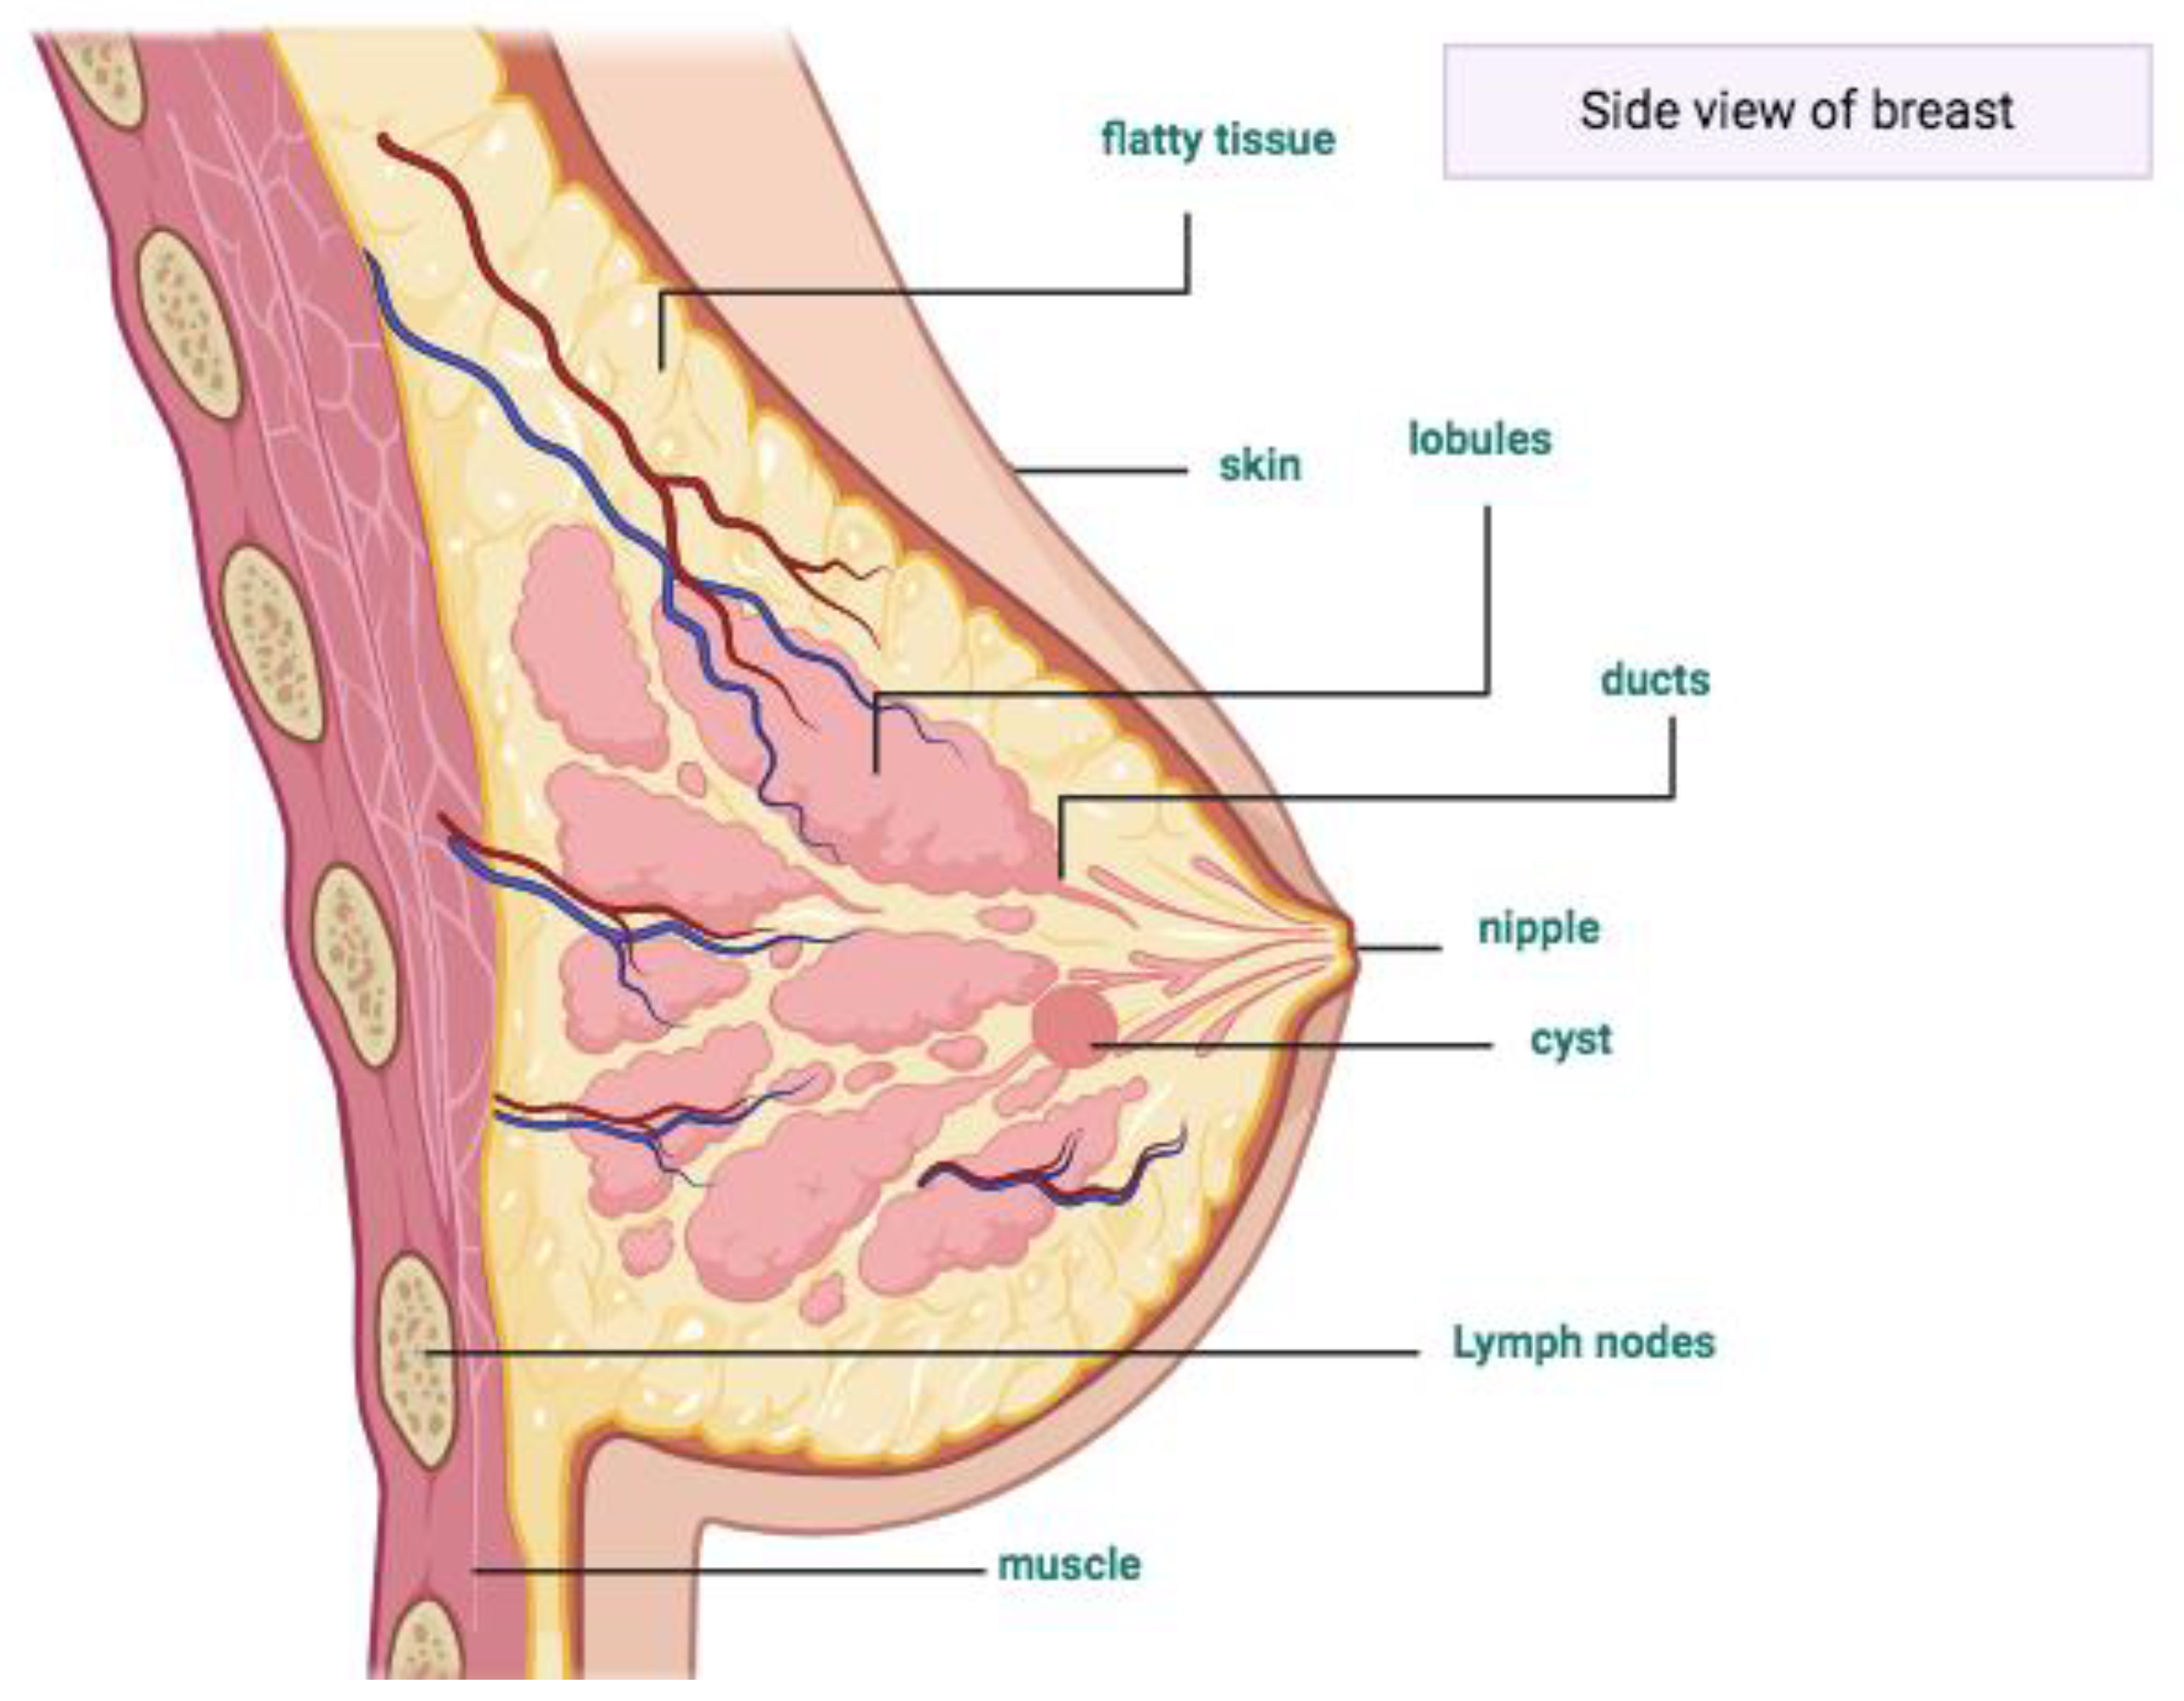
- Skandalakis, J.E. Embryology and anatomy of the breast. In Breast Augmentation; Springer: Berlin/Heidelberg, Germany, 2009; pp. 3–24. [Google Scholar]
- Dheeba, J.; Singh, N.A. Computer aided intelligent breast cancer detection: Second opinion for radiologists—A prospective study. In Computational Intelligence Applications in Modeling and Control; Springer: Cham, Switzerland, 2015; pp. 397–430. [Google Scholar]
- Ramadan, S.Z. Methods Used in Computer-Aided Diagnosis for Breast Cancer Detection Using Mammograms: A Review. J. Health Eng. 2020, 2020, 9162464. [Google Scholar] [CrossRef]
- Chan, H.-P.; Doi, K.; Vybrony, C.J.; Schmidt, R.A.; Metz, C.E.; Lam, K.L.; Ogura, T.; Wu, Y.; MacMahon, H. Improvement in Radiologists?? Detection of Clustered Microcalcifications on Mammograms. Investig. Radiol. 1990, 25, 1102–1110. [Google Scholar] [CrossRef]
- Olsen, O.; Gøtzsche, P.C. Cochrane review on screening for breast cancer with mammography. Lancet 2001, 358, 1340–1342. [Google Scholar] [CrossRef]
- Mann, R.M.; Kuhl, C.K.; Kinkel, K.; Boetes, C. Breast MRI: Guidelines from the European Society of Breast Imaging. Eur. Radiol. 2008, 18, 1307–1318. [Google Scholar] [CrossRef]
- Jalalian, A.; Mashohor, S.B.; Mahmud, H.R.; Saripan, M.I.B.; Ramli, A.R.B.; Karasfi, B. Computer-aided detection/diagnosis of breast cancer in mammography and ultrasound: A review. Clin. Imaging 2013, 37, 420–426. [Google Scholar] [CrossRef]
- Sarno, A.; Mettivier, G.; Russo, P. Dedicated breast computed tomography: Basic aspects. Med. Phys. 2015, 42, 2786–2804. [Google Scholar] [CrossRef]
- Njor, S.; Nyström, L.; Moss, S.; Paci, E.; Broeders, M.; Segnan, N.; Lynge, E. Breast Cancer Mortality in Mammographic Screening in Europe: A Review of Incidence-Based Mortality Studies. J. Med. Screen. 2012, 19, 33–41. [Google Scholar] [CrossRef] [PubMed]
- Morrell, S.; Taylor, R.; Roder, D.; Dobson, A. Mammography screening and breast cancer mortality in Australia: An aggregate cohort study. J. Med. Screen. 2012, 19, 26–34. [Google Scholar] [CrossRef] [PubMed]
- Marmot, M.; Altman, D.G.; Cameron, D.A.; Dewar, J.A.; Thompson, S.G.; Wilcox, M.; The Independent UK Panel on Breast Cancer Screening. The benefits and harms of breast cancer screening: An independent review. Br. J. Cancer 2013, 108, 2205–2240. [Google Scholar] [CrossRef] [PubMed]
- Liu, C.-Y.; Hsu, C.-Y.; Chou, Y.-H.; Chen, C.-M. A multi-scale tumor detection algorithm in whole breast sonography incorporating breast anatomy and tissue morphological information. In Proceedings of the 2014 IEEE Healthcare Innovation Conference (HIC), Seattle, WA, USA, 8–10 October 2014; pp. 193–196. [Google Scholar]
- Pisano, E.D.; Gatsonis, C.; Hendrick, E.; Yaffe, M.; Baum, J.K.; Acharyya, S.; Conant, E.F.; Fajardo, L.L.; Bassett, L.; D’Orsi, C.; et al. Diagnostic Performance of Digital versus Film Mammography for Breast-Cancer Screening. N. Engl. J. Med. 2005, 353, 1773–1783. [Google Scholar] [CrossRef] [PubMed]
- Carney, P.A.; Miglioretti, D.L.; Yankaskas, B.C.; Kerlikowske, K.; Rosenberg, R.; Rutter, C.M.; Geller, B.M.; Abraham, L.A.; Taplin, S.H.; Dignan, M.; et al. Individual and Combined Effects of Age, Breast Density, and Hormone Replacement Therapy Use on the Accuracy of Screening Mammography. Ann. Intern. Med. 2003, 138, 168–175. [Google Scholar] [CrossRef] [PubMed]
- Woodard, D.B.; Gelfand, A.E.; Barlow, W.E.; Elmore, J.G. Performance assessment for radiologists interpreting screening mammography. Stat. Med. 2007, 26, 1532–1551. [Google Scholar] [CrossRef]
- Cole, E.; Pisano, E.D.; Kistner, E.O.; Muller, K.E.; Brown, M.E.; Feig, S.A.; Jong, R.A.; Maidment, A.D.A.; Staiger, M.J.; Kuzmiak, C.M.; et al. Diagnostic Accuracy of Digital Mammography in Patients with Dense Breasts Who Underwent Problem-solving Mammography: Effects of Image Processing and Lesion Type1. Radiology 2003, 226, 153–160. [Google Scholar] [CrossRef]
- Boyd, N.F.; Guo, H.; Martin, L.J.; Sun, L.; Stone, J.; Fishell, E.; Jong, R.A.; Hislop, G.; Chiarelli, A.; Minkin, S.; et al. Mammographic Density and the Risk and Detection of Breast Cancer. N. Engl. J. Med. 2007, 356, 227–236. [Google Scholar] [CrossRef]
- E Bird, R.; Wallace, T.W.; Yankaskas, B.C. Analysis of cancers missed at screening mammography. Radiology 1992, 184, 613–617. [Google Scholar] [CrossRef]
- Kerlikowske, K.; Carney, P.A.; Geller, B.; Mandelson, M.T.; Taplin, S.; Malvin, K.; Ernster, V.; Urban, N.; Cutter, G.; Rosenberg, R.; et al. Performance of screening mammography among women with and without a first-degree relative with breast cancer. Ann. Intern. Med. 2000, 133, 855–863. [Google Scholar] [CrossRef]
- Ertosun, M.G.; Rubin, D.L. Probabilistic visual search for masses within mammography images using deep learning. In Proceedings of the 2015 IEEE International Conference on Bioinformatics and Biomedicine (BIBM), Washington, DC, USA, 9–12 November 2015; pp. 1310–1315. [Google Scholar]
- Nunes, F.L.S.; Schiabel, H.; Goes, C.E. Contrast Enhancement in Dense Breast Images to Aid Clustered Microcalcifications Detection. J. Digit. Imaging 2006, 20, 53–66. [Google Scholar] [CrossRef]
- Szegedy, C.; Vanhoucke, V.; Ioffe, S.; Shlens, J.; Wojna, Z. Rethinking the Inception Architecture for Computer Vision. In Proceedings of the 2016 IEEE Conference on Computer Vision and Pattern Recognition (CVPR), Las Vegas, NV, USA, 27–30 June 2016; pp. 2818–2826. [Google Scholar]
- Dinnes, J.; Moss, S.; Melia, J.; Blanks, R.; Song, F.; Kleijnen, J. Effectiveness and cost-effectiveness of double reading of mammograms in breast cancer screening: Findings of a systematic review. Breast 2001, 10, 455–463. [Google Scholar] [CrossRef] [PubMed]
- Robinson, P.J. Radiology’s Achilles’ heel: Error and variation in the interpretation of the Röntgen image. Br. J. Radiol. 1997, 70, 1085–1098. [Google Scholar]
- Rangayyan, R.M.; Ayres, F.J.; Desautels, J.L. A review of computer-aided diagnosis of breast cancer: Toward the detection of subtle signs. J. Frankl. Inst. 2007, 344, 312–348. [Google Scholar] [CrossRef]
- Jalalian, A.; Mashohor, S.; Mahmud, R.; Karasfi, B.; Saripan, M.I.B.; Ramli, A.R.B. Foundation and methodologies in computer-aided diagnosis systems for breast cancer detection. EXCLI J. 2017, 16, 113–137. [Google Scholar]
- Vyborny, C.J.; Giger, M.L.; Nishikawa, R.M. Computer-Aided Detection and Diagnosis of Breast Cancer. Radiol. Clin. N. Am. 2000, 38, 725–740. [Google Scholar] [CrossRef] [PubMed]
- Giger, M.L. Machine Learning in Medical Imaging. J. Am. Coll. Radiol. 2018, 15, 512–520. [Google Scholar] [CrossRef]
- Xu, Y.; Wang, Y.; Yuan, J.; Cheng, Q.; Wang, X.; Carson, P.L. Medical breast ultrasound image segmentation by machine learning. Ultrasonics 2019, 91, 1–9. [Google Scholar] [CrossRef]
- Shan, J.; Alam, S.K.; Garra, B.; Zhang, Y.; Ahmed, T. Computer-Aided Diagnosis for Breast Ultrasound Using Computerized BI-RADS Features and Machine Learning Methods. Ultrasound Med. Biol. 2016, 42, 980–988. [Google Scholar] [CrossRef]
- Zhang, Q.; Xiao, Y.; Dai, W.; Suo, J.; Wang, C.; Shi, J.; Zheng, H. Deep learning based classification of breast tumors with shear-wave elastography. Ultrasonics 2016, 72, 150–157. [Google Scholar] [CrossRef]
- Cheng, J.-Z.; Ni, D.; Chou, Y.-H.; Qin, J.; Tiu, C.-M.; Chang, Y.-C.; Huang, C.-S.; Shen, D.; Chen, C.-M. Computer-Aided Diagnosis with Deep Learning Architecture: Applications to Breast Lesions in US Images and Pulmonary Nodules in CT Scans. Sci. Rep. 2016, 6, 24454. [Google Scholar] [CrossRef] [PubMed]
- Shin, S.Y.; Lee, S.; Yun, I.D.; Kim, S.M.; Lee, K.M. Joint Weakly and Semi-Supervised Deep Learning for Localization and Classification of Masses in Breast Ultrasound Images. IEEE Trans. Med. Imaging 2018, 38, 762–774. [Google Scholar] [CrossRef]
- Wang, J.; Ding, H.; Bidgoli, F.A.; Zhou, B.; Iribarren, C.; Molloi, S.; Baldi, P. Detecting Cardiovascular Disease from Mammograms With Deep Learning. IEEE Trans. Med. Imaging 2017, 36, 1172–1181. [Google Scholar] [CrossRef] [PubMed]
- Dhungel, N.; Carneiro, G.; Bradley, A.P. Fully automated classification of mammograms using deep residual neural networks. In Proceedings of the 2017 IEEE 14th International Symposium on Biomedical Imaging (ISBI 2017), Melbourne, Australia, 18–21 April 2017; pp. 310–314. [Google Scholar]
- Kooi, T.; Litjens, G.J.S.; Van Ginneken, B.; Gubern-Mérida, A.; Sánchez, C.I.; Mann, R.; Heeten, A.D.; Karssemeijer, N. Large scale deep learning for computer aided detection of mammographic lesions. Med. Image Anal. 2017, 35, 303–312. [Google Scholar] [CrossRef]
- Debelee, T.G.; Schwenker, F.; Ibenthal, A.; Yohannes, D. Survey of deep learning in breast cancer image analysis. Evol. Syst. 2020, 11, 143–163. [Google Scholar] [CrossRef]
- Keen, J.D.; Keen, J.M.; Keen, J.E. Utilization of computer-aided detection for digital screening mammography in the United States, 2008 to 2016. J. Am. Coll. Radiol. 2018, 15, 44–48. [Google Scholar]
- Henriksen, E.L.; Carlsen, J.F.; Vejborg, I.; Nielsen, M.B.; A Lauridsen, C. The efficacy of using computer-aided detection (CAD) for detection of breast cancer in mammography screening: A systematic review. Acta Radiol. 2018, 60, 13–18. [Google Scholar] [CrossRef]
- Gao, Y.; Geras, K.J.; Lewin, A.A.; Moy, L. New Frontiers: An Update on Computer-Aided Diagnosis for Breast Imaging in the Age of Artificial Intelligence. Am. J. Roentgenol. 2019, 212, 300–307. [Google Scholar] [CrossRef]
- Pacilè, S.; Lopez, J.; Chone, P.; Bertinotti, T.; Grouin, J.M.; Fillard, P. Improving Breast Cancer Detection Accuracy of Mammography with the Concurrent Use of an Artificial Intelligence Tool. Radiol. Artif. Intell. 2020, 2, e190208. [Google Scholar]
- Huynh, B.Q.; Li, H.; Giger, M.L. Digital mammographic tumor classification using transfer learning from deep convolutional neural networks. J. Med. Imaging 2016, 3, 034501. [Google Scholar] [CrossRef]
- Yap, M.H.; Pons, G.; Marti, J.; Ganau, S.; Sentis, M.; Zwiggelaar, R.; Davison, A.K.; Marti, R. Automated Breast Ultrasound Lesions Detection Using Convolutional Neural Networks. IEEE J. Biomed. Health Inform. 2018, 22, 1218–1226. [Google Scholar] [CrossRef]
- Moon, W.K.; Lee, Y.-W.; Ke, H.-H.; Lee, S.H.; Huang, C.-S.; Chang, R.-F. Computer-aided diagnosis of breast ultrasound images using ensemble learning from convolutional neural networks. Comput. Methods Programs Biomed. 2020, 190, 105361. [Google Scholar] [CrossRef] [PubMed]
- Yap, M.H.; Goyal, M.; Osman, F.; Ahmad, E.; Martí, R.; Denton, E.; Juette, A.; Zwiggelaar, R. End-to-end breast ultrasound lesions recognition with a deep learning approach. In Medical Imaging 2018: Biomedical Applications in Molecular, Structural, and Functional Imaging; International Society for Optics and Photonics: Bellingham, WA, USA, 2018; Volume 10578, p. 1057819. [Google Scholar]
- Xu, B.; Wang, N.; Chen, T.; Li, M. Empirical evaluation of rectified activations in convolutional network. arXiv 2015, arXiv:1505.00853. [Google Scholar]
- Swiderski, B.; Kurek, J.; Osowski, S.; Kruk, M.; Barhoumi, W. Deep learning and non-negative matrix factorization in recognition of mammograms. In Proceedings of the Eighth International Conference on Graphic and Image Processing (ICGIP 2016), Tokyo, Japan, 29–31 October 2016; International Society for Optics and Photonics: Bellingham, WA, USA, 2017; Volume 10225, p. 102250B. [Google Scholar]
- Lecun, Y.; Bengio, Y.; Hinton, G. Deep learning. Nature 2015, 521, 436–444. [Google Scholar]
- Miotto, R.; Wang, F.; Wang, S.; Jiang, X.; Dudley, J.T. Deep learning for healthcare: Review, opportunities and challenges. Briefings Bioinform. 2018, 19, 1236–1246. [Google Scholar] [CrossRef]
- Shin, H.-C.; Roth, H.R.; Gao, M.; Lu, L.; Xu, Z.; Nogues, I.; Yao, J.; Mollura, D.; Summers, R.M. Deep Convolutional Neural Networks for Computer-Aided Detection: CNN Architectures, Dataset Characteristics and Transfer Learning. IEEE Trans. Med. Imaging 2016, 35, 1285–1298. [Google Scholar] [CrossRef]
- Lee, J.-G.; Jun, S.; Cho, Y.-W.; Lee, H.; Kim, G.B.; Seo, J.B.; Kim, N. Deep Learning in Medical Imaging: General Overview. Korean J. Radiol. 2017, 18, 570–584. [Google Scholar] [CrossRef]
- Suzuki, K. Overview of deep learning in medical imaging. Radiol. Phys. Technol. 2017, 10, 257–273. [Google Scholar] [CrossRef]
- Moradmand, H.; Setayeshi, S.; Karimian, A.R.; Sirous, M.; Akbari, M.E. Comparing the performance of image enhancement methods to detect microcalcification clusters in digital mammography. Iran. J. Cancer Prev. 2012, 5, 61. [Google Scholar]
- Moher, D.; Liberati, A.; Tetzlaff, J.; Altman, D.G. Preferred reporting items for systematic reviews and meta-analyses: The PRISMA statement. Int. J. Surg. 2010, 8, 336–341. [Google Scholar] [CrossRef]
- Khan, K.S.; Kunz, R.; Kleijnen, J.; Antes, G. Five steps to conducting a systematic review. J. R. Soc. Med. 2003, 96, 118–121. [Google Scholar] [PubMed]
- Suckling J, P. The mammographic image analysis society digital mammogram database. Digit. Mammo. 1994, 1069, 375–386. [Google Scholar]
- Han, S.; Kang, H.-K.; Jeong, J.-Y.; Park, M.-H.; Kim, W.; Bang, W.-C.; Seong, Y.-K. A deep learning framework for supporting the classification of breast lesions in ultrasound images. Phys. Med. Biol. 2017, 62, 7714–7728. [Google Scholar] [CrossRef] [PubMed]
- De Oliveira, J.E.; Deserno, T.M.; Araújo, A.D.A. Breast Lesions Classification applied to a reference database. In Proceedings of the 2nd International Conference, Hammanet, Tunisia, 29–31 October 2008; pp. 29–31. [Google Scholar]
- Moreira, I.C.; Amaral, I.; Domingues, I.; Cardoso, A.; Cardoso, M.J.; Cardoso, J.S. Inbreast: Toward a full-field digital mammographic database. Acad. Radiol. 2012, 19, 236–248. [Google Scholar] [PubMed]
- Abdelhafiz, D.; Yang, C.; Ammar, R.; Nabavi, S. Deep convolutional neural networks for mammography: Advances, challenges and applications. BMC Bioinform. 2019, 20, 281. [Google Scholar] [CrossRef]
- Byra, M.; Jarosik, P.; Szubert, A.; Galperin, M.; Ojeda-Fournier, H.; Olson, L.; O’Boyle, M.; Comstock, C.; Andre, M. Breast mass segmentation in ultrasound with selective kernel U-Net convolutional neural network. Biomed. Signal Process. Control. 2020, 61, 102027. [Google Scholar] [CrossRef]
- Jiao, Z.; Gao, X.; Wang, Y.; Li, J. A deep feature based framework for breast masses classification. Neurocomputing 2016, 197, 221–231. [Google Scholar] [CrossRef]
- Arevalo, J.; González, F.A.; Ramos-Pollán, R.; Oliveira, J.L.; Lopez, M.A.G. Representation learning for mammography mass lesion classification with convolutional neural networks. Comput. Methods Programs Biomed. 2016, 127, 248–257. [Google Scholar] [CrossRef]
- Peng, W.; Mayorga, R.; Hussein, E. An automated confirmatory system for analysis of mammograms. Comput. Methods Programs Biomed. 2016, 125, 134–144. [Google Scholar] [CrossRef]
- Dhabyani, W.; Gomaa, M.; Khaled, H.; Fahmy, A. Dataset of breast ultrasound images. Data Brief. 2020, 28, 104863. [Google Scholar] [CrossRef]
- Tian, J.-W.; Wang, Y.; Huang, J.-H.; Ning, C.-P.; Wang, H.-M.; Liu, Y.; Tang, X.-L. The Digital Database for Breast Ultrasound Image. In Proceedings of 11th Joint Conference on Information Sciences (JCIS); Atlantis Press: Amsterdam, The Netherlands, 2008. [Google Scholar]
- Piotrzkowska-Wróblewska, H.; Dobruch-Sobczak, K.; Byra, M.; Nowicki, A. Open access database of raw ultrasonic signals acquired from malignant and benign breast lesions. Med. Phys. 2017, 44, 6105–6109. [Google Scholar] [CrossRef] [PubMed]
- Deng, J.; Dong, W.; Socher, R.; Li, L.J.; Li, K.; Fei-Fei, L. Imagenet: A large-scale hierarchical image database. In Proceedings of the 2009 IEEE Conference on Computer Vision and Pattern Recognition, Miami, FL, USA, 20–25 June 2009; pp. 248–255. [Google Scholar]
- Fujita, H. AI-based computer-aided diagnosis (AI-CAD): The latest review to read first. Radiol. Phys. Technol. 2020, 13, 6–19. [Google Scholar] [CrossRef] [PubMed]
- Sengupta, S.; Singh, A.; Leopold, H.A.; Gulati, T.; Lakshminarayanan, V. Ophthalmic diagnosis using deep learning with fundus images—A critical review. Artif. Intell. Med. 2020, 102, 101758. [Google Scholar] [CrossRef]
- Shih, F.Y. Image Processing and Pattern Recognition: Fundamentals and Techniques; John Wiley & Sons: Hoboken, NJ, USA, 2010. [Google Scholar]
- Biltawi, M.; Al-Najdawi, N.I.J.A.D.; Tedmori, S.A.R.A. Mammogram enhancement and segmentation methods: Classification, analysis, and evaluation. In Proceedings of the 13th International Arab Conference on Information Technology, Zarqa, Jordan, 10–13 December 2012. [Google Scholar]
- Dabass, J.; Arora, S.; Vig, R.; Hanmandlu, M. Segmentation techniques for breast cancer imaging modalities—A review. In Proceedings of the 2019 9th International Conference on Cloud Computing, Data Science & Engineering (Confluence), Noida, India, 10–11 January 2019; pp. 658–663. [Google Scholar]
- Ganesan, K.; Acharya, U.R.; Chua, K.C.; Min, L.C.; Abraham, K.T. Pectoral muscle segmentation: A review. Comput. Methods Programs Biomed. 2013, 110, 48–57. [Google Scholar] [CrossRef]
- Huang, Q.; Luo, Y.; Zhang, Q. Breast ultrasound image segmentation: A survey. Int. J. Comput. Assist. Radiol. Surg. 2017, 12, 493–507. [Google Scholar] [CrossRef] [PubMed]
- Noble, J.A.; Boukerroui, D. Ultrasound image segmentation: A survey. IEEE Trans. Med. Imaging 2006, 25, 987–1010. [Google Scholar] [CrossRef]
- Kallergi, M.; Woods, K.; Clarke, L.P.; Qian, W.; Clark, R.A. Image segmentation in digital mammography: Comparison of local thresholding and region growing algorithms. Comput. Med. Imaging Graph. 1992, 16, 323–331. [Google Scholar] [CrossRef]
- Tsantis, S.; Dimitropoulos, N.; Cavouras, D.; Nikiforidis, G. A hybrid multi-scale model for thyroid nodule boundary detection on ultrasound images. Comput. Methods Programs Biomed. 2006, 84, 86–98. [Google Scholar] [CrossRef]
- Ilesanmi, A.E.; Idowu, O.P.; Makhanov, S.S. Multiscale superpixel method for segmentation of breast ultrasound. Comput. Biol. Med. 2020, 125, 103879. [Google Scholar] [CrossRef]
- Chen, D.; Chang, R.-F.; Kuo, W.-J.; Chen, M.-C.; Huang, Y.-L. Diagnosis of breast tumors with sonographic texture analysis using wavelet transform and neural networks. Ultrasound Med. Biol. 2002, 28, 1301–1310. [Google Scholar] [CrossRef]
- Cheng, H.D.; Shan, J.; Ju, W.; Guo, Y.; Zhang, L. Automated breast cancer detection and classification using ultrasound images: A survey. Pattern Recognit. 2010, 43, 299–317. [Google Scholar] [CrossRef]
- Hasan, H.; Tahir, N.M. Feature selection of breast cancer based on principal component analysis. In Proceedings of the 2010 6th International Colloquium on Signal Processing & Its Applications, Mallaca City, Malaysia, 21–23 May 2010; pp. 1–4. [Google Scholar]
- Chan, H.-P.; Wei, D.; A Helvie, M.; Sahiner, B.; Adler, D.D.; Goodsitt, M.M.; Petrick, N. Computer-aided classification of mammographic masses and normal tissue: Linear discriminant analysis in texture feature space. Phys. Med. Biol. 1995, 40, 857–876. [Google Scholar] [CrossRef] [PubMed]
- Maglogiannis, I.; Zafiropoulos, E.; Kyranoudis, C. Intelligent segmentation and classification of pigmented skin lesions in dermatological images. In Hellenic Conference on Artificial Intelligence; Springer: Berlin/Heidelberg, Germany, 2006; pp. 214–223. [Google Scholar]
- Jin, X.; Xu, A.; Bie, R.; Guo, P. Machine learning techniques and chi-square feature selection for cancer classification using SAGE gene expression profiles. In International Workshop on Data Mining for Biomedical Applications; Springer: Berlin/Heidelberg, Germany, 2006; pp. 106–115. [Google Scholar]
- Verma, K.; Singh, B.K.; Tripathi, P.; Thoke, A.S. Review of feature selection algorithms for breast cancer ultrasound image. In New Trends in Intelligent Information and Database Systems; Springer: Cham, Switzerland, 2015; pp. 23–32. [Google Scholar]
- Sikorski, J. Identification of malignant melanoma by wavelet analysis. In Proceedings of the Student/Faculty Research Day, CSIS, Pace University, New York, NY, USA, 7 May 2004. [Google Scholar]
- Chiem, A.; Al-Jumaily, A.; Khushaba, R.N. A novel hybrid system for skin lesion detection. In Proceedings of the 2007 3rd International Conference on Intelligent Sensors, Sensor Networks and Information, Melbourne, Australia, 3–6 December 2007; pp. 567–572. [Google Scholar]
- Tanaka, T.; Torii, S.; Kabuta, I.; Shimizu, K.; Tanaka, M. Pattern Classification of Nevus with Texture Analysis. IEEJ Trans. Electr. Electron. Eng. 2007, 3, 143–150. [Google Scholar] [CrossRef]
- Zhou, H.; Chen, M.; Rehg, J.M. Dermoscopic interest point detector and descriptor. In Proceedings of the 2009 IEEE International Symposium on Biomedical Imaging: From Nano to Macro, Boston, MA, USA, 28 June–1 July 2009; pp. 1318–1321. [Google Scholar]
- Singh, B.; Jain, V.K.; Singh, S. Mammogram Mass Classification Using Support Vector Machine with Texture, Shape Features and Hierarchical Centroid Method. J. Med. Imaging Health Informatics 2014, 4, 687–696. [Google Scholar] [CrossRef]
- Sonar, P.; Bhosle, U.; Choudhury, C. Mammography classification using modified hybrid SVM-KNN. In Proceedings of the 2017 International Conference on Signal Processing and Communication (ICSPC), Coimbatore, India, 28–29 July 2017; pp. 305–311. [Google Scholar]
- Pal, N.R.; Bhowmick, B.; Patel, S.K.; Pal, S.; Das, J. A multi-stage neural network aided system for detection of microcalcifications in digitized mammograms. Neurocomputing 2008, 71, 2625–2634. [Google Scholar] [CrossRef]
- Ayer, T.; Chen, Q.; Burnside, E.S. Artificial Neural Networks in Mammography Interpretation and Diagnostic Decision Making. Comput. Math. Methods Med. 2013, 2013, 832509. [Google Scholar] [CrossRef] [PubMed]
- Al-Hadidi, M.R.; Alarabeyyat, A.; Alhanahnah, M. Breast cancer detection using k-nearest neighbor machine learning algorithm. In Proceedings of the 2016 9th International Conference on Developments in eSystems Engineering (DeSE), Liverpool, UK, 31 August–2 September 2016; pp. 35–39. [Google Scholar]
- Sumbaly, R.; Vishnusri, N.; Jeyalatha, S. Diagnosis of Breast Cancer using Decision Tree Data Mining Technique. Int. J. Comput. Appl. 2014, 98, 16–24. [Google Scholar] [CrossRef]
- Landwehr, N.; Hall, M.A.; Frank, E. Logistic Model Trees. Mach. Learn. 2005, 59, 161–205. [Google Scholar] [CrossRef]
- Abdel-Zaher, A.M.; Eldeib, A.M. Breast cancer classification using deep belief networks. Expert Syst. Appl. 2016, 46, 139–144. [Google Scholar] [CrossRef]
- Nishikawa, R.M.; Giger, M.L.; Doi, K.; Metz, C.E.; Yin, F.-F.; Vyborny, C.J.; Schmidt, R.A. Effect of case selection on the performance of computer-aided detection schemes. Med. Phys. 1994, 21, 265–269. [Google Scholar] [CrossRef]
- Rodríguez-Ruiz, A.; Teuwen, J.; Chung, K.; Karssemeijer, N.; Chevalier, M.; Gubern-Merida, A.; Sechopoulos, I. Pectoral muscle segmentation in breast tomosynthesis with deep learning. In Medical Imaging 2018: Computer-Aided Diagnosis; International Society for Optics and Photonics: Bellingham, WA, USA, 2018; Volume 10575, p. 105752J. [Google Scholar]
- Guo, R.; Lu, G.; Qin, B.; Fei, B. Ultrasound Imaging Technologies for Breast Cancer Detection and Management: A Review. Ultrasound Med. Biol. 2018, 44, 37–70. [Google Scholar] [CrossRef] [PubMed]
- Cadena, L.; Castillo, D.; Zotin, A.; Diaz, P.; Cadena, F.; Cadena, G.; Jimenez, Y. Processing MRI Brain Image using OpenMP and Fast Filters for Noise Reduction. In Proceedings of the World Congress on Engineering and Computer Science 2019, San Francisco, CA, USA, 22–24 October 2019. [Google Scholar]
- Kang, C.-C.; Wang, W.-J.; Kang, C.-H. Image segmentation with complicated background by using seeded region growing. AEU—Int. J. Electron. Commun. 2012, 66, 767–771. [Google Scholar] [CrossRef]
- Prabusankarlal, K.M.; Thirumoorthy, P.; Manavalan, R. Computer Aided Breast Cancer Diagnosis Techniques in Ultrasound: A Survey. J. Med. Imaging Health Inform. 2014, 4, 331–349. [Google Scholar] [CrossRef]
- Abdallah, Y.M.Y.; Elgak, S.; Zain, H.; Rafiq, M.; Ebaid, E.A.; Elnaema, A.A. Breast cancer detection using image enhancement and segmentation algorithms. Biomed. Res. 2018, 29, 3732–3736. [Google Scholar] [CrossRef]
- Sheba, K.U.; Gladston Raj, S. Objective Quality Assessment of Image Enhancement Methods in Digital Mammography - A Comparative Study. Signal Image Process. Int. J. 2016, 7, 1–13. [Google Scholar] [CrossRef]
- George, M.J.; Sankar, S.P. Efficient preprocessing filters and mass segmentation techniques for mammogram images. In Proceedings of the 2017 IEEE International Conference on Circuits and Systems (ICCS), Thiruvananthapuram, India, 20–21 December 2017; pp. 408–413. [Google Scholar]
- Talha, M.; Sulong, G.B.; Jaffar, A. Preprocessing digital breast mammograms using adaptive weighted frost filter. Biomed. Res. 2016, 27, 1407–1412. [Google Scholar]
- Thitivirut, M.; Leekitviwat, J.; Pathomsathit, C.; Phasukkit, P. Image Enhancement by using Triple Filter and Histogram Equalization for Organ Segmentation. In Proceedings of the 2019 12th Biomedical Engineering International Conference (BMEiCON), Ubon Ratchathani, Thailand, 19–22 November 2019; pp. 1–5. [Google Scholar]
- Gandhi, K.R.; Karnan, M. Mammogram image enhancement and segmentation. In Proceedings of the IEEE International Conference on Computational Intelligence and Computing Research (ICCIC), Coimbatore, India, 28–29 December 2010; pp. 1–4. [Google Scholar]
- Pizer, S.M.; Amburn, E.P.; Austin, J.D.; Cromartie, R.; Geselowitz, A.; Greer, T.; Romeny, B.M.T.H.; Zimmerman, J.B.; Zuiderveld, K.K. Adaptive histogram equalization and its variations. Comput. Vision Graph. Image Process. 1987, 39, 355–368. [Google Scholar] [CrossRef]
- Pisano, E.D.; Zong, S.; Hemminger, B.M.; DeLuca, M.; Johnston, R.E.; Muller, K.; Braeuning, M.P.; Pizer, S.M. Contrast Limited Adaptive Histogram Equalization image processing to improve the detection of simulated spiculations in dense mammograms. J. Digit. Imaging 1998, 11, 193–200. [Google Scholar] [CrossRef]
- Wan, J.; Yin, H.; Chong, A.-X.; Liu, Z.-H. Progressive residual networks for image super-resolution. Appl. Intell. 2020, 50, 1620–1632. [Google Scholar] [CrossRef]
- Umehara, K.; Ota, J.; Ishida, T. Super-Resolution Imaging of Mammograms Based on the Super-Resolution Convolutional Neural Network. Open J. Med. Imaging 2017, 7, 180–195. [Google Scholar] [CrossRef]
- Dong, C.; Loy, C.C.; He, K.; Tang, X. Image Super-Resolution Using Deep Convolutional Networks. IEEE Trans. Pattern Anal. Mach. Intell. 2015, 38, 295–307. [Google Scholar] [CrossRef]
- Kim, J.; Lee, J.K.; Lee, K.M. Accurate image super-resolution using very deep convolutional networks. In Proceedings of the IEEE Conference on Computer Vision and Pattern Recognition, Las Vegas, NV, USA, 27–30 June 2016; pp. 1646–1654. [Google Scholar]
- Jiang, Y.; Li, J. Generative Adversarial Network for Image Super-Resolution Combining Texture Loss. Appl. Sci. 2020, 10, 1729. [Google Scholar] [CrossRef]
- Glasner, D.; Bagon, S.; Irani, M. Super-resolution from a single image. In Proceedings of the 2009 IEEE 12th International Conference on Computer Vision, Kyoto, Japan, 29 September–2 October 2009; pp. 349–356. [Google Scholar]
- Schultz, R.R.; Stevenson, R.L. A Bayesian approach to image expansion for improved definition. IEEE Trans. Image Process. 1994, 3, 233–242. [Google Scholar] [CrossRef]
- Gribbon, K.T.; Bailey, D.G. A novel approach to real-time bilinear interpolation. In Proceedings of the DELTA 2004 Second IEEE International Workshop on Electronic Design, Test and Applications, Perth, Australia, 28–30 January 2004; pp. 126–131. [Google Scholar]
- Zhang, L.; Wu, X. An edge-guided image interpolation algorithm via directional filtering and data fusion. IEEE Trans. Image Process. 2006, 15, 2226–2238. [Google Scholar] [CrossRef] [PubMed]
- Sun, C.; Shrivastava, A.; Singh, S.; Gupta, A. Revisiting unreasonable effectiveness of data in deep learning era. In Proceedings of the IEEE International Conference on Computer Vision, Venice, Italy, 22–29 October 2017; pp. 843–852. [Google Scholar]
- Shorten, C.; Khoshgoftaar, T.M. A survey on Image Data Augmentation for Deep Learning. J. Big Data 2019, 6, 60. [Google Scholar] [CrossRef]
- Weiss, K.; Khoshgoftaar, T.M.; Wang, D. A survey of transfer learning. J. Big Data 2016, 3, 9. [Google Scholar] [CrossRef]
- Shao, L.; Zhu, F.; Li, X. Transfer Learning for Visual Categorization: A Survey. IEEE Trans. Neural Networks Learn. Syst. 2015, 26, 1019–1034. [Google Scholar] [CrossRef]
- Zhong, Z.; Zheng, L.; Kang, G.; Li, S.; Yang, Y. Random Erasing Data Augmentation. In Proceedings of the AAAI Conference on Artificial Intelligence, New York, NY, USA, 7–12 February 2020; pp. 13001–13008. [Google Scholar]
- Mirza, M.; Osindero, S. Conditional Generative Adversarial Nets Mehdi. arXiv 2014, arXiv:1411.1784. [Google Scholar]
- Gatys, L.; Ecker, A.; Bethge, M. A Neural Algorithm of Artistic Style. J. Vis. 2016, 16, 326. [Google Scholar] [CrossRef]
- Mordang, J.-J.; Janssen, T.; Bria, A.; Kooi, T.; Gubern-Mérida, A.; Karssemeijer, N. Automatic Microcalcification Detection in Multi-vendor Mammography Using Convolutional Neural Networks. In Public-Key Cryptography—PKC 2018; Springer Science and Business Media LLC: New York, NY, USA, 2016; pp. 35–42. [Google Scholar]
- Akselrod-Ballin, A.; Karlinsky, L.; Alpert, S.; Hasoul, S.; Ben-Ari, R.; Barkan, E. A region based convolutional network for tumor detection and classification in breast mammography. In Deep Learning and Data Labeling for Medical Applications; Springer: Cham, Switzerland, 2016; pp. 197–205. [Google Scholar]
- Zhu, W.; Xie, X. Adversarial Deep Structural Networks for Mammographic Mass Segmentation. arXiv 2016, arXiv:1612.05970. [Google Scholar]
- Lévy, D.; Jain, A. Breast mass classification from mammograms using deep convolutional neural networks. arXiv 2016, arXiv:1612.00542. [Google Scholar]
- Sert, E.; Ertekin, S.; Halici, U. Ensemble of convolutional neural networks for classification of breast microcalcification from mammograms. In Proceedings of the 2017 39th Annual International Conference of the IEEE Engineering in Medicine and Biology Society (EMBC), Seogwipo, Korea, 11–15 July 2017; pp. 689–692. [Google Scholar]
- Dhungel, N.; Carneiro, G.; Bradley, A.P. The automated learning of deep features for breast mass classification from mammograms. In International Conference on Medical Image Computing and Computer-Assisted Intervention; Springer: Cham, Switzerland, 2016; pp. 106–114. [Google Scholar]
- Saeed, J.N. Survey of Ultrasonography Breast Cancer Image Segmentation Techniques. Acad. J. Nawroz Univ. 2020, 9, 1–14. [Google Scholar] [CrossRef]
- Gardezi, S.J.S.; ElAzab, A.; Lei, B.; Wang, T. Breast Cancer Detection and Diagnosis Using Mammographic Data: Systematic Review. J. Med. Internet Res. 2019, 21, e14464. [Google Scholar] [CrossRef] [PubMed]
- Gomez, W.; Rodriguez, A.; Pereira, W.C.A.; Infantosi, A.F.C. Feature selection and classifier performance in computer-aided diagnosis for breast ultrasound. In Proceedings of the 2013 10th International Conference and Expo on Emerging Technologies for a Smarter World (CEWIT), Melville, NY, USA, 21–22 October 2013; pp. 1–5. [Google Scholar]
- Dong, C.; Loy, C.C.; He, K.; Tang, X. Learning a deep convolutional network for image super-resolution. In European Conference on Computer Vision; Springer: Cham, Switzerland, 2014; pp. 184–199. [Google Scholar]
- Lotter, W.; Sorensen, G.; Cox, D. A multi-scale CNN and curriculum learning strategy for mammogram classification. In Deep Learning in Medical Image Analysis and Multimodal Learning for Clinical Decision Support; Springer: Cham, Switzerland, 2017; pp. 169–177. [Google Scholar]
- Al-Masni, M.A.; Al-Antari, M.A.; Park, J.-M.; Gi, G.; Kim, T.-S.; Rivera, P.; Valarezo, E.; Choi, M.-T.; Han, S.-M. Simultaneous detection and classification of breast masses in digital mammograms via a deep learning YOLO-based CAD system. Comput. Methods Programs Biomed. 2018, 157, 85–94. [Google Scholar] [CrossRef]
- Badrinarayanan, V.; Kendall, A.; Cipolla, R. SegNet: A Deep Convolutional Encoder-Decoder Architecture for Image Segmentation. IEEE Trans. Pattern Anal. Mach. Intell. 2017, 39, 2481–2495. [Google Scholar] [CrossRef]
- Almajalid, R.; Shan, J.; Du, Y.; Zhang, M. Development of a deep-learning-based method for breast ultrasound image segmentation. In Proceedings of the 2018 17th IEEE International Conference on Machine Learning and Applications (ICMLA), Orlando, FL, USA, 17–20 December 2018; pp. 1103–1108. [Google Scholar]
- Ronneberger, O.; Fischer, P.; Brox, T. U-net: Convolutional networks for biomedical image segmentation. In Proceedings of the Lecture Notes in Computer Science; including subseries Lecture Notes in Artificial Intelligence and Lecture Notes in Bioinformatics; Springer: Berlin/Heidelberg, Germany, 2015. [Google Scholar]
- Kim, T.; Cha, M.; Kim, H.; Lee, J.K.; Kim, J. Learning to discover cross-domain relations with generative adversarial networks. arXiv 2017, arXiv:1703.05192. [Google Scholar]
- Romera, E.; Alvarez, J.M.; Bergasa, L.M.; Arroyo, R. ERFNet: Efficient Residual Factorized ConvNet for Real-Time Semantic Segmentation. IEEE Trans. Intell. Transp. Syst. 2018, 19, 263–272. [Google Scholar] [CrossRef]
- Lee, C.; Landgrebe, D. Feature extraction based on decision boundaries. IEEE Trans. Pattern Anal. Mach. Intell. 1993, 15, 388–400. [Google Scholar] [CrossRef]
- Cao, Z.; Duan, L.; Yang, G.; Yue, T.; Chen, Q. An experimental study on breast lesion detection and classification from ultrasound images using deep learning architectures. BMC Med. Imaging 2019, 19, 51. [Google Scholar] [CrossRef]
- Chiao, J.-Y.; Chen, K.-Y.; Liao, K.Y.-K.; Hsieh, P.-H.; Zhang, G.; Huang, T.-C. Detection and classification the breast tumors using mask R-CNN on sonograms. Medicine 2019, 98, e15200. [Google Scholar] [CrossRef]
- Dhungel, N.; Carneiro, G.; Bradley, A.P. Automated Mass Detection in Mammograms Using Cascaded Deep Learning and Random Forests. In Proceedings of the 2015 International Conference on Digital Image Computing: Techniques and Applications (DICTA), Adelaide, Australia, 23–25 November 2015; pp. 1–8. [Google Scholar]
- Hu, F.; Xia, G.-S.; Hu, J.; Zhang, L. Transferring Deep Convolutional Neural Networks for the Scene Classification of High-Resolution Remote Sensing Imagery. Remote Sens. 2015, 7, 14680–14707. [Google Scholar] [CrossRef]
- Zhu, W.; Lou, Q.; Vang, Y.S.; Xie, X. Deep multi-instance networks with sparse label assignment for whole mammogram classification. In International Conference on Medical Image Computing and Computer-Assisted Intervention; Springer: Cham, Switzerland, 2017; pp. 603–611. [Google Scholar]
- Kooi, T.; Gubern-Merida, A.; Mordang, J.-J.; Mann, R.; Pijnappel, R.; Schuur, K.; Heeten, A.D.; Karssemeijer, N. A comparison between a deep convolutional neural network and radiologists for classifying regions of interest in mammography. In International Workshop on Breast Imaging; Springer: Cham, Switzerland, 2016; pp. 51–56. [Google Scholar]
- Kooi, T.; Van Ginneken, B.; Karssemeijer, N.; Heeten, A.D. Discriminating solitary cysts from soft tissue lesions in mammography using a pretrained deep convolutional neural network. Med. Phys. 2017, 44, 1017–1027. [Google Scholar] [CrossRef] [PubMed]
- Chan, H.-P.; Lo, S.-C.B.; Sahiner, B.; Lam, K.L.; Helvie, M.A. Computer-aided detection of mammographic microcalcifications: Pattern recognition with an artificial neural network. Med. Phys. 1995, 22, 1555–1567. [Google Scholar] [CrossRef] [PubMed]
- Valvano, G.; Della Latta, D.; Martini, N.; Santini, G.; Gori, A.; Iacconi, C.; Ripoli, A.; Landini, L.; Chiappino, D.; Iacconi, C. Evaluation of a Deep Convolutional Neural Network method for the segmentation of breast microcalcifications in Mammography Imaging. In Precision Medicine Powered by pHealth and Connected Health; Springer Science and Business Media LLC: New York, NY, USA, 2017; Volume 65, pp. 438–441. [Google Scholar]
- Carneiro, G.; Nascimento, J.; Bradley, A.P. Unregistered multiview mammogram analysis with pre-trained deep learning models. In International Conference on Medical Image Computing and Computer-Assisted Intervention; Springer: Cham, Switzerland, 2015; pp. 652–660. [Google Scholar]
- Carneiro, G.; Nascimento, J.; Bradley, A.P. Automated Analysis of Unregistered Multi-View Mammograms With Deep Learning. IEEE Trans. Med. Imaging 2017, 36, 2355–2365. [Google Scholar] [CrossRef] [PubMed]
- LeCun, Y.; Bottou, L.; Bengio, Y.; Haffner, P. Gradient-based learning applied to document recognition. Proc. IEEE 1998, 86, 2278–2324. [Google Scholar]
- Huynh, B.; Drukker, K.; Giger, M. MO-DE-207B-06: Computer-Aided Diagnosis of Breast Ultrasound Images Using Transfer Learning From Deep Convolutional Neural Networks. Med. Phys. 2016, 43, 3705. [Google Scholar] [CrossRef]
- Singh, V.K.; Rashwan, H.A.; Abdel-Nasser, M.; Sarker, M.; Kamal, M.; Akram, F.; Pandey, N.; Romani, S.; Puig, D. An Efficient Solution for Breast Tumor Segmentation and Classification in Ultrasound Images using Deep Adversarial Learning. arXiv 2019, arXiv:1907.00887. [Google Scholar]
- Long, J.; Shelhamer, E.; Darrell, T. Fully convolutional networks for semantic segmentation. In Proceedings of the IEEE Conference on Computer Vision and Pattern Recognition, Boston, MA, USA, 7–12 June 2015; pp. 3431–3440. [Google Scholar]
- Liu, Y.; Yao, X. Ensemble learning via negative correlation. Neural Networks 1999, 12, 1399–1404. [Google Scholar] [CrossRef]
- Ragab, D.A.; Sharkas, M.; Marshall, S.; Ren, J. Breast cancer detection using deep convolutional neural networks and support vector machines. PeerJ 2019, 7, e6201. [Google Scholar] [CrossRef]
- Krizhevsky, A.; Sutskever, I.; Hinton, G.E. Imagenet classification with deep convolutional neural networks. In Proceedings of the Advances in Neural Information Processing Systems, Lake Tahoe, NV, USA, 3–6 December 2012; pp. 1097–1105. [Google Scholar]
- Simonyan, K.; Zisserman, A. Very deep convolutional networks for large-scale image recognition. arXiv 2014, arXiv:1409.1556. [Google Scholar]
- He, K.; Zhang, X.; Ren, S.; Sun, J. Deep Residual Learning for Image Recognition. arXiv 2015, arXiv:1512.03385. [Google Scholar]
- Huang, G.; Liu, Z.; van der Maaten, L.; Weinberger, K.Q. Densely Connected Convolutional Networks. In Proceedings of the IEEE Conference on Computer Vision and Pattern Recognition, Honolulu, HI, USA, 21–26 July 2017; Volume 2017, pp. 2261–2269. [Google Scholar]
- Russakovsky, O.; Deng, J.; Su, H.; Krause, J.; Satheesh, S.; Ma, S.; Huang, Z.; Karpathy, A.; Khosla, A.; Bernstein, M.; et al. ImageNet Large Scale Visual Recognition Challenge. Int. J. Comput. Vis. 2015, 115, 211–252. [Google Scholar] [CrossRef]
- Samala, R.K.; Chan, H.-P.; Hadjiiski, L.; Helvie, M.A.; Wei, J.; Cha, K. Mass detection in digital breast tomosynthesis: Deep convolutional neural network with transfer learning from mammography. Med. Phys. 2016, 43, 6654–6666. [Google Scholar] [CrossRef] [PubMed]
- Das, K.; Conjeti, S.; Roy, A.G.; Chatterjee, J.; Sheet, D. Multiple instance learning of deep convolutional neural networks for breast histopathology whole slide classification. In Proceedings of the 2018 IEEE 15th International Symposium on Biomedical Imaging (ISBI 2018), Washington, DC, USA, 4–7 April 2018; pp. 578–581. [Google Scholar]
- Geras, K.J.; Wolfson, S.; Shen, Y.; Wu, N.; Kim, S.; Kim, E.; Heacock, L.; Parikh, U.; Moy, L.; Cho, K. High-resolution breast cancer screening with multi-view deep convolutional neural networks. arXiv 2017, arXiv:1703.07047. [Google Scholar]
- Rumelhart, D.E.; Hinton, G.E.; Williams, R.J. Learning Internal Representations by Error Propagation. In Parallel Distributed Processing: Explorations in the Microstructure of Cognition; MIT Press: Cambridge, MA, USA, 1985. [Google Scholar]
- Dhungel, N.; Carneiro, G.; Bradley, A.P. A deep learning approach for the analysis of masses in mammograms with minimal user intervention. Med. Image Anal. 2017, 37, 114–128. [Google Scholar] [CrossRef]
- Rodrigues, P.S. Breast Ultrasound Image. Mendeley Data, 1. 2017. Available online: https://data.mendeley.com/datasets/wmy84gzngw/1 (accessed on 8 October 2020).
- Duggento, A.; Aiello, M.; Cavaliere, C.; Cascella, G.L.; Cascella, D.; Conte, G.; Guerrisi, M.; Toschi, N. An Ad Hoc Random Initialization Deep Neural Network Architecture for Discriminating Malignant Breast Cancer Lesions in Mammographic Images. Contrast Media Mol. Imaging 2019, 2019, 5982834. [Google Scholar] [CrossRef]
- Chougrad, H.; Zouaki, H.; Alheyane, O. Deep Convolutional Neural Networks for breast cancer screening. Comput. Methods Programs Biomed. 2018, 157, 19–30. [Google Scholar] [CrossRef]
- Byra, M.; Sznajder, T.; Korzinek, D.; Piotrzkowska-Wroblewska, H.; Dobruch-Sobczak, K.; Nowicki, A.; Marasek, K. Impact of Ultrasound Image Reconstruction Method on Breast Lesion Classification with Deep Learning. In Public-Key Cryptography—PKC 2018; Springer International Publishing: Cham, Switzerland, 2019; pp. 41–52. [Google Scholar]
- Dheeba, J.; Singh, N.A.; Selvi, S.T. Computer-aided detection of breast cancer on mammograms: A swarm intelligence optimized wavelet neural network approach. J. Biomed. Inform. 2014, 49, 45–52. [Google Scholar] [CrossRef]
- Trivizakis, E.; Ioannidis, G.S.; Melissianos, V.D.; Papadakis, G.Z.; Tsatsakis, A.; Spandidos, D.A.; Marias, K. A novel deep learning architecture outperforming ’off‑the‑shelf’ transfer learning and feature‑based methods in the automated assessment of mammographic breast density. Oncol. Rep. 2019, 42, 2009–2015. [Google Scholar] [CrossRef]
- Samala, R.K.; Chan, H.-P.; Hadjiiski, L.M.; Helvie, M.A.; Richter, C.; Cha, K.H. Cross-domain and multi-task transfer learning of deep convolutional neural network for breast cancer diagnosis in digital breast tomosynthesis. In Medical Imaging 2018: Computer-Aided Diagnosis; International Society for Optics and Photonics: Bellingham, WA, USA, 2018; Volume 10575, p. 105750Q. [Google Scholar]
- Jadoon, M.M.; Zhang, Q.; Haq, I.U.; Butt, S.; Jadoon, A. Three-Class Mammogram Classification Based on Descriptive CNN Features. BioMed. Res. Int. 2017, 2017, 1–11. [Google Scholar] [CrossRef]
- Ahmed, A.H.; Salem, M.A.-M. Mammogram-Based cancer detection using deep convolutional neural networks. In Proceedings of the 2018 13th International Conference on Computer Engineering and Systems (ICCES), Cairo, Egypt, 18–19 December 2018; pp. 694–699. [Google Scholar]
- Gu, P.; Lee, W.-M.; Roubidoux, M.A.; Yuan, J.; Wang, X.; Carson, P.L. Automated 3D ultrasound image segmentation to aid breast cancer image interpretation. Ultrasonics 2016, 65, 51–58. [Google Scholar] [CrossRef] [PubMed]
- Singh, B.K.; Verma, K.; Thoke, A.S. Fuzzy cluster based neural network classifier for classifying breast tumors in ultrasound images. Expert Syst. Appl. 2016, 66, 114–123. [Google Scholar] [CrossRef]
- Shi, J.; Zhou, S.; Liu, X.; Zhang, Q.; Lu, M.; Wang, T. Stacked deep polynomial network based representation learning for tumor classification with small ultrasound image dataset. Neurocomputing 2016, 194, 87–94. [Google Scholar] [CrossRef]
- Liu, J.; Zarshenas, A.; Wei, Z.; Yang, L.; Fajardo, L.; Suzuki, K.; Qadir, A. Radiation dose reduction in digital breast tomosynthesis (DBT) by means of deep-learning-based supervised image processing. In Medical Imaging 2018: Image Processing; International Society for Optics and Photonics: Bellingham, WA, USA, 2018; Volume 10574, p. 105740F. [Google Scholar]
- Zou, L.; Yu, S.; Meng, T.; Zhang, Z.; Liang, X.; Xie, Y. A Technical Review of Convolutional Neural Network-Based Mammographic Breast Cancer Diagnosis. Comput. Math. Methods Med. 2019, 2019, 6509357. [Google Scholar] [CrossRef] [PubMed]


| Type | Database | Annotations | Link | Author |
|---|---|---|---|---|
| Mammograms | DDSM | 2620 patients including mediolateral oblique (MLO) and craniocaudal (CC) images for classification. | http://www.eng.usf.edu/cvprg/Mammography/Database.html | Jiao et al. [67] |
| BCDR | 736 biopsy prove lesion of 344 patients, including CC and MLO images for classification. | https://bcdr.eu/ | Arevalo et al. [68] | |
| INbreast | 419 cases, including CC and MLO images of 115 patients, for detection and diagnosis. | http://medicalresearch.inescporto.pt/breastresearch/index.php/Get_INbreast_Database | IMoreira et al. [64] | |
| Mini-MIAS | 322 digitized MLO images of 161 patients for segmentation, detection, and classification. | http://peipa.essex.ac.uk/info/mias.html | Peng et al. [69] | |
| Ultrasound | BUSI | The dataset consists of 600 female patients. The 780 images include 133 normal images without masses, 437 images with cancer masses, and 210 images with benign masses. This set is utilized for classification, detection, and segmentation. | https://scholar.cu.edu.eg/?q=afahmy/pages/dataset | Dhabyani et al. [70] |
| DDBUI | 285 cases and 1132 images in total for classification. | https://www.atlantis-press.com/proceedings/jcis2008/1735 | Tian et al. [71] | |
| Dataset A | Private dataset with 306 (60 malignant and 246 benign) images, which are utilized for detection. | goo.gl/SJmoti | Yap et al. [48] | |
| Dataset B | Private dataset with 163 (53 malignant and 110 benign) images. | Byra et al. [66] | ||
| SNUH | Private dataset with a total of 1225 patients with 1687 tumors. This study includes biopsy diagnosis. | Moon et al. [49] | ||
| OASBUD | 52 malignant and 48 benign masses, which are utilized in image processing algorithms. | http://bluebox.ippt.gov.pl/~hpiotrzk | Piotrzkowska et al. [72] | |
| ImageNet | 882 US images (678 benign and 204 malignant lesions), which are utilized in object recognition, image classification, and automatic object clustering. | http://www.image-net.org/ | Deng et al. [73] |
| Reference | Models | Description | Application |
|---|---|---|---|
| [76,77] | Pixel-based, which is based on the curvature of the edge and clustering [3,78]: conventional (CLAHE), region-based, feature-based (wavelet), and fuzzy. | Pectoral removal techniques are not sufficient to provide accurate results. Thereby, intensity-based methods, line detection, statistical techniques, wavelet methods, and the active contour technique have also been tried for segmenting this area. Its accuracy varies from 84% to 99%, where the active contour technique reached the highest value of 99%, followed by the wavelet method with 93% [79]. Enchancement techniques are divided into three categories: spatial, frequency domain, and a mixture of these two. These categories can be classified into four models. The region-based method requires a seed point and it is time-consuming. | Preprocessing |
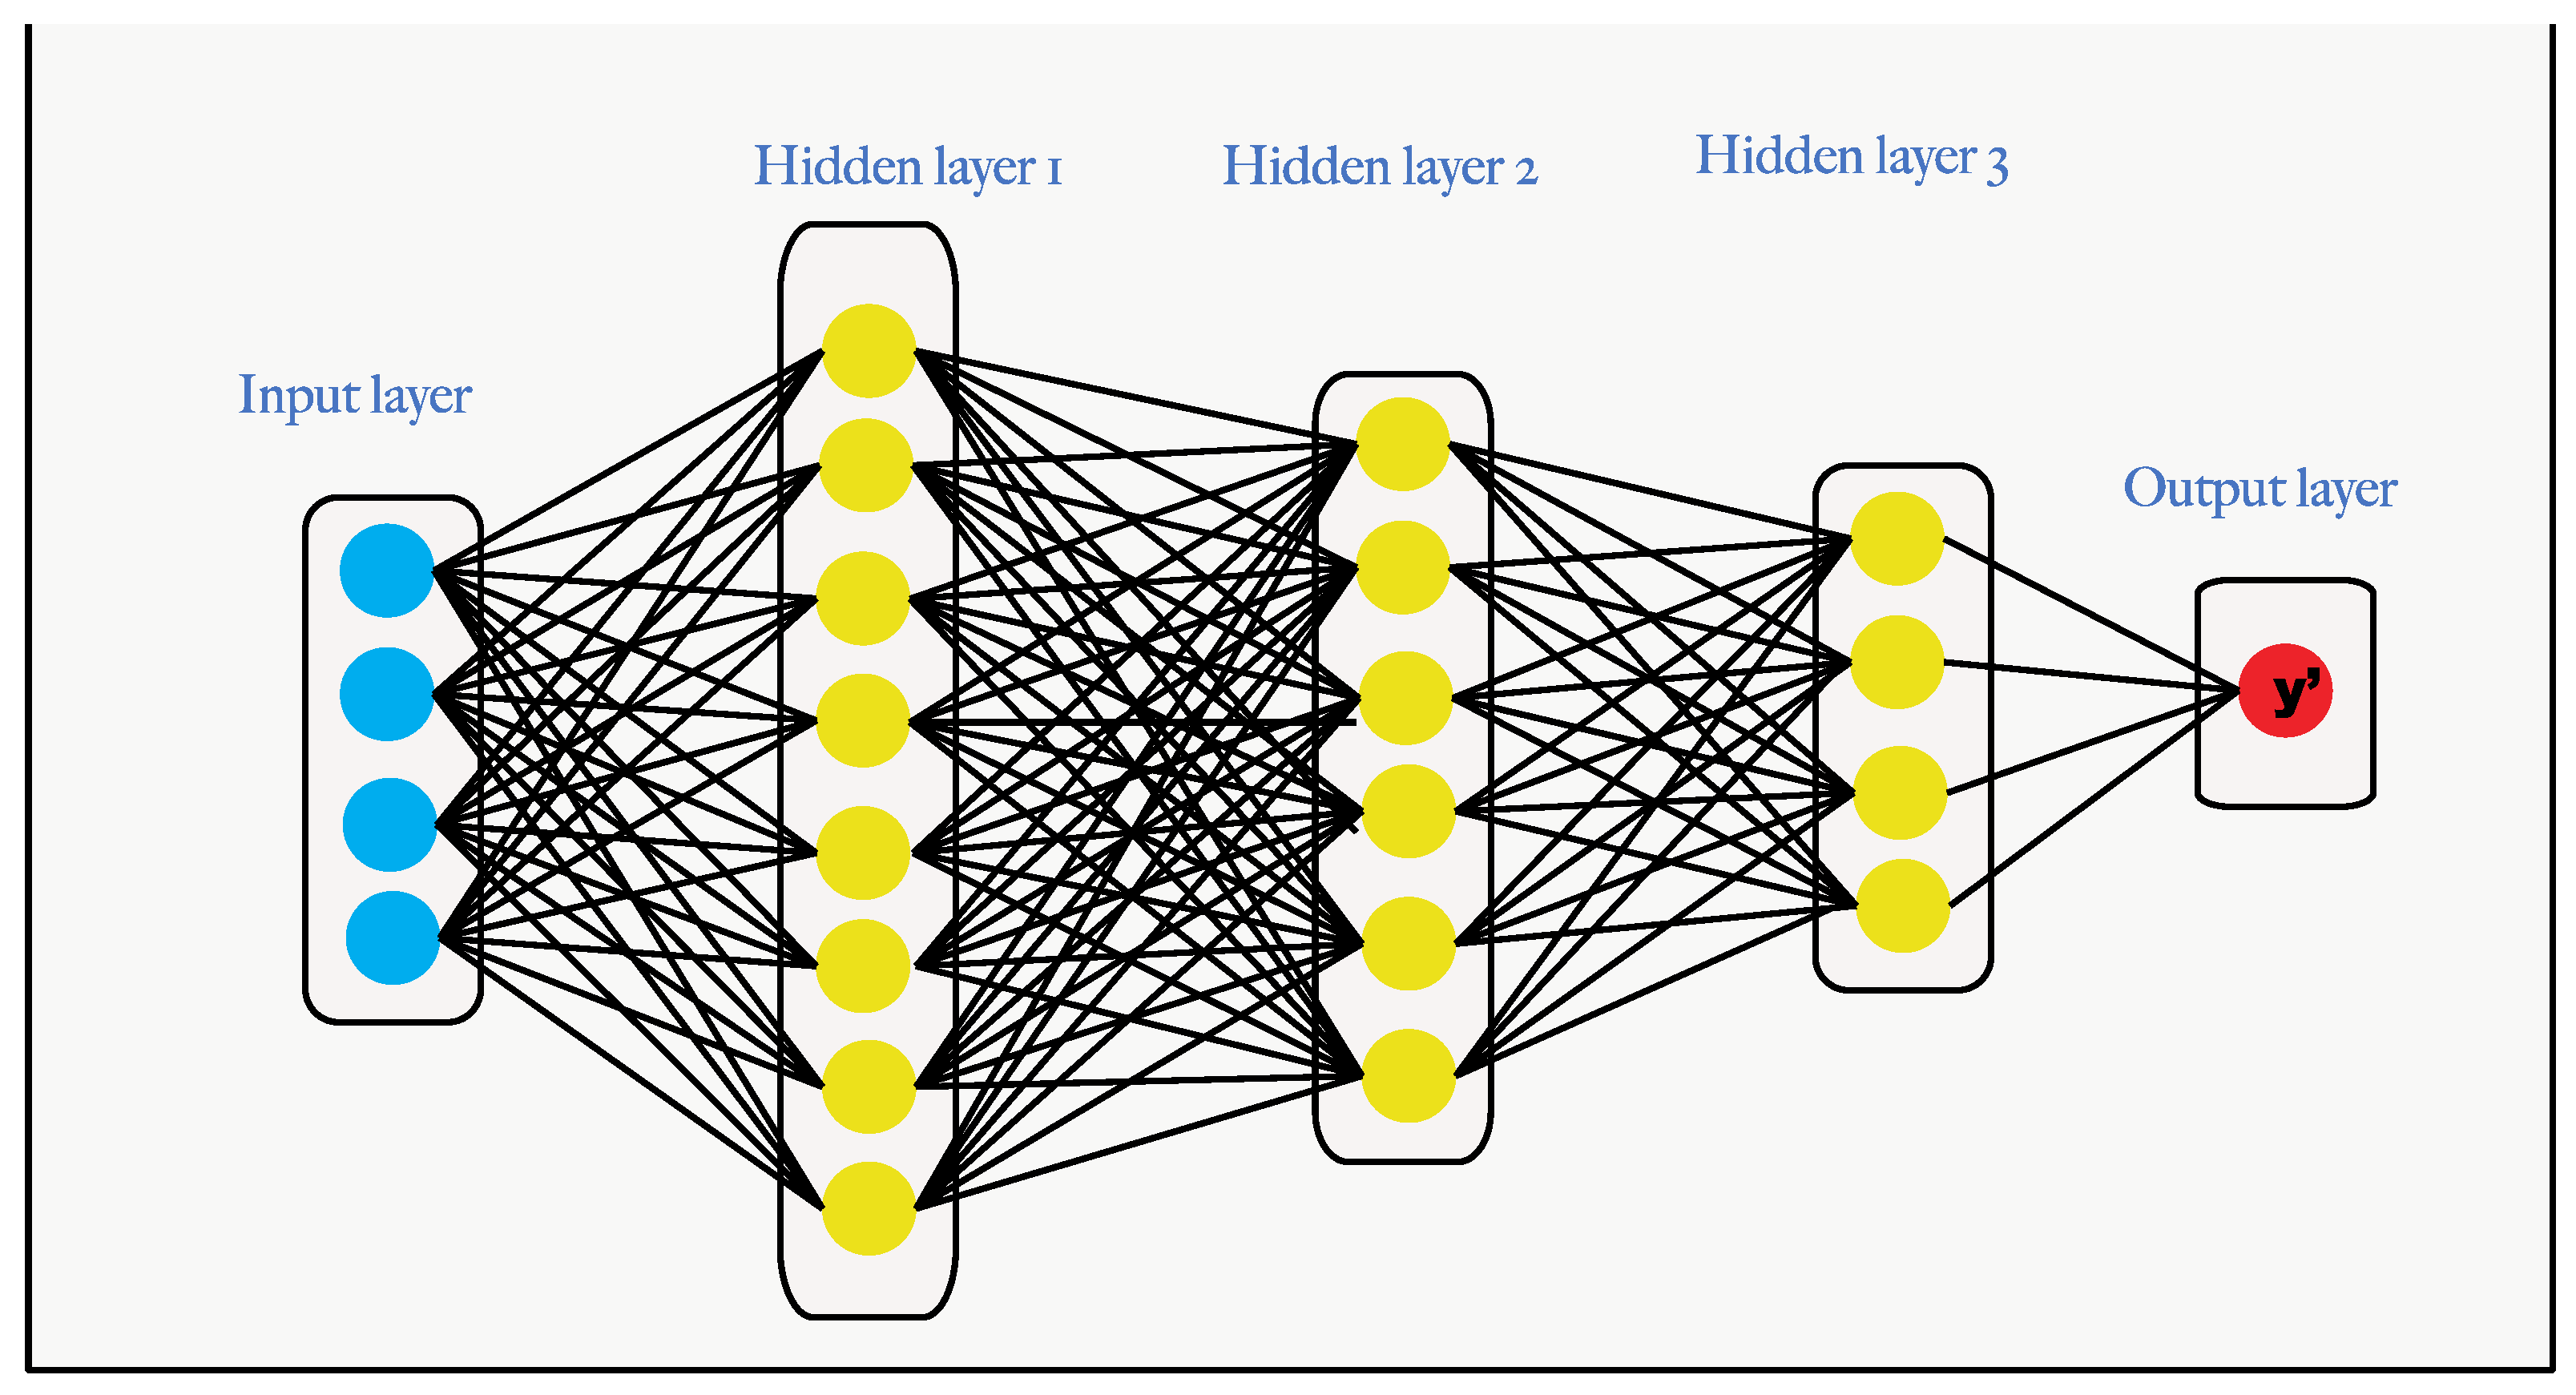
| [80,81] | Local thresholding and region-growing [82]; edge detection, template matching [12,83], and a multiscale technique [84]; NN [85]. | The thresholding method shows greater stability but is dependent on the parameter selection. Furthermore, is not sufficient for segmenting fatty tissue in a DM because its images contain noise and have low contrast and intensity. The region-growing method is well-known in micro-calcification detection and uses pixel properties for segmenting fatty tissue. Edge detection utilizes the wavelet transform in a multiscale structure to represent signals and variations in US images. Template matching requires a comparison with a given image (ROI) with a template image to measure the similarity between both. Finally, an NN utilizes a multi-layered perceptron with a hidden layer for extracting the contours of tumors automatically; nevertheless, training an NN is time-consuming. | Segmentation |
| [86] | PCA [87], LDA [88], and GLCM [89]. | Feature selection methods: wrapper and filter (chi-square [90]). The most well-known feature extraction techniques are PCA, LDA, GLCM, gain ratio, recursive feature [91], RF, WPT [92,93], Fourier power spectrum [94], Gaussian [95] and DBT [29]. PCA feature extraction techniques are better at reducing the high-dimensional correlated features into low dimensional features [87]. | Feature Selection and extraction |
| [12,33] | SVM [96,97] and ANN [98,99]. | SVM is useful in DM classification because these are highly overlapping and nonlinear in their feature space. It minimizes the generalization error during the process of testing data and is much more accurate and computational efficient because of the reduced number of parameters. ANN: Backpropagation, SOM, and hierarchical ANN. The performance of back-propagation is better than that of linear classifiers. However, the training process is stochastic and unrepeatable, even with the same data and initial conditions. Prone to overfitting due to the complexity of the model structure. Finally, advantages and disadvantages from other classifiers have been previously discussed in several studies: KNN [100], BDT [101], simple logistic classifier [102], and DBN [103] | Classification |
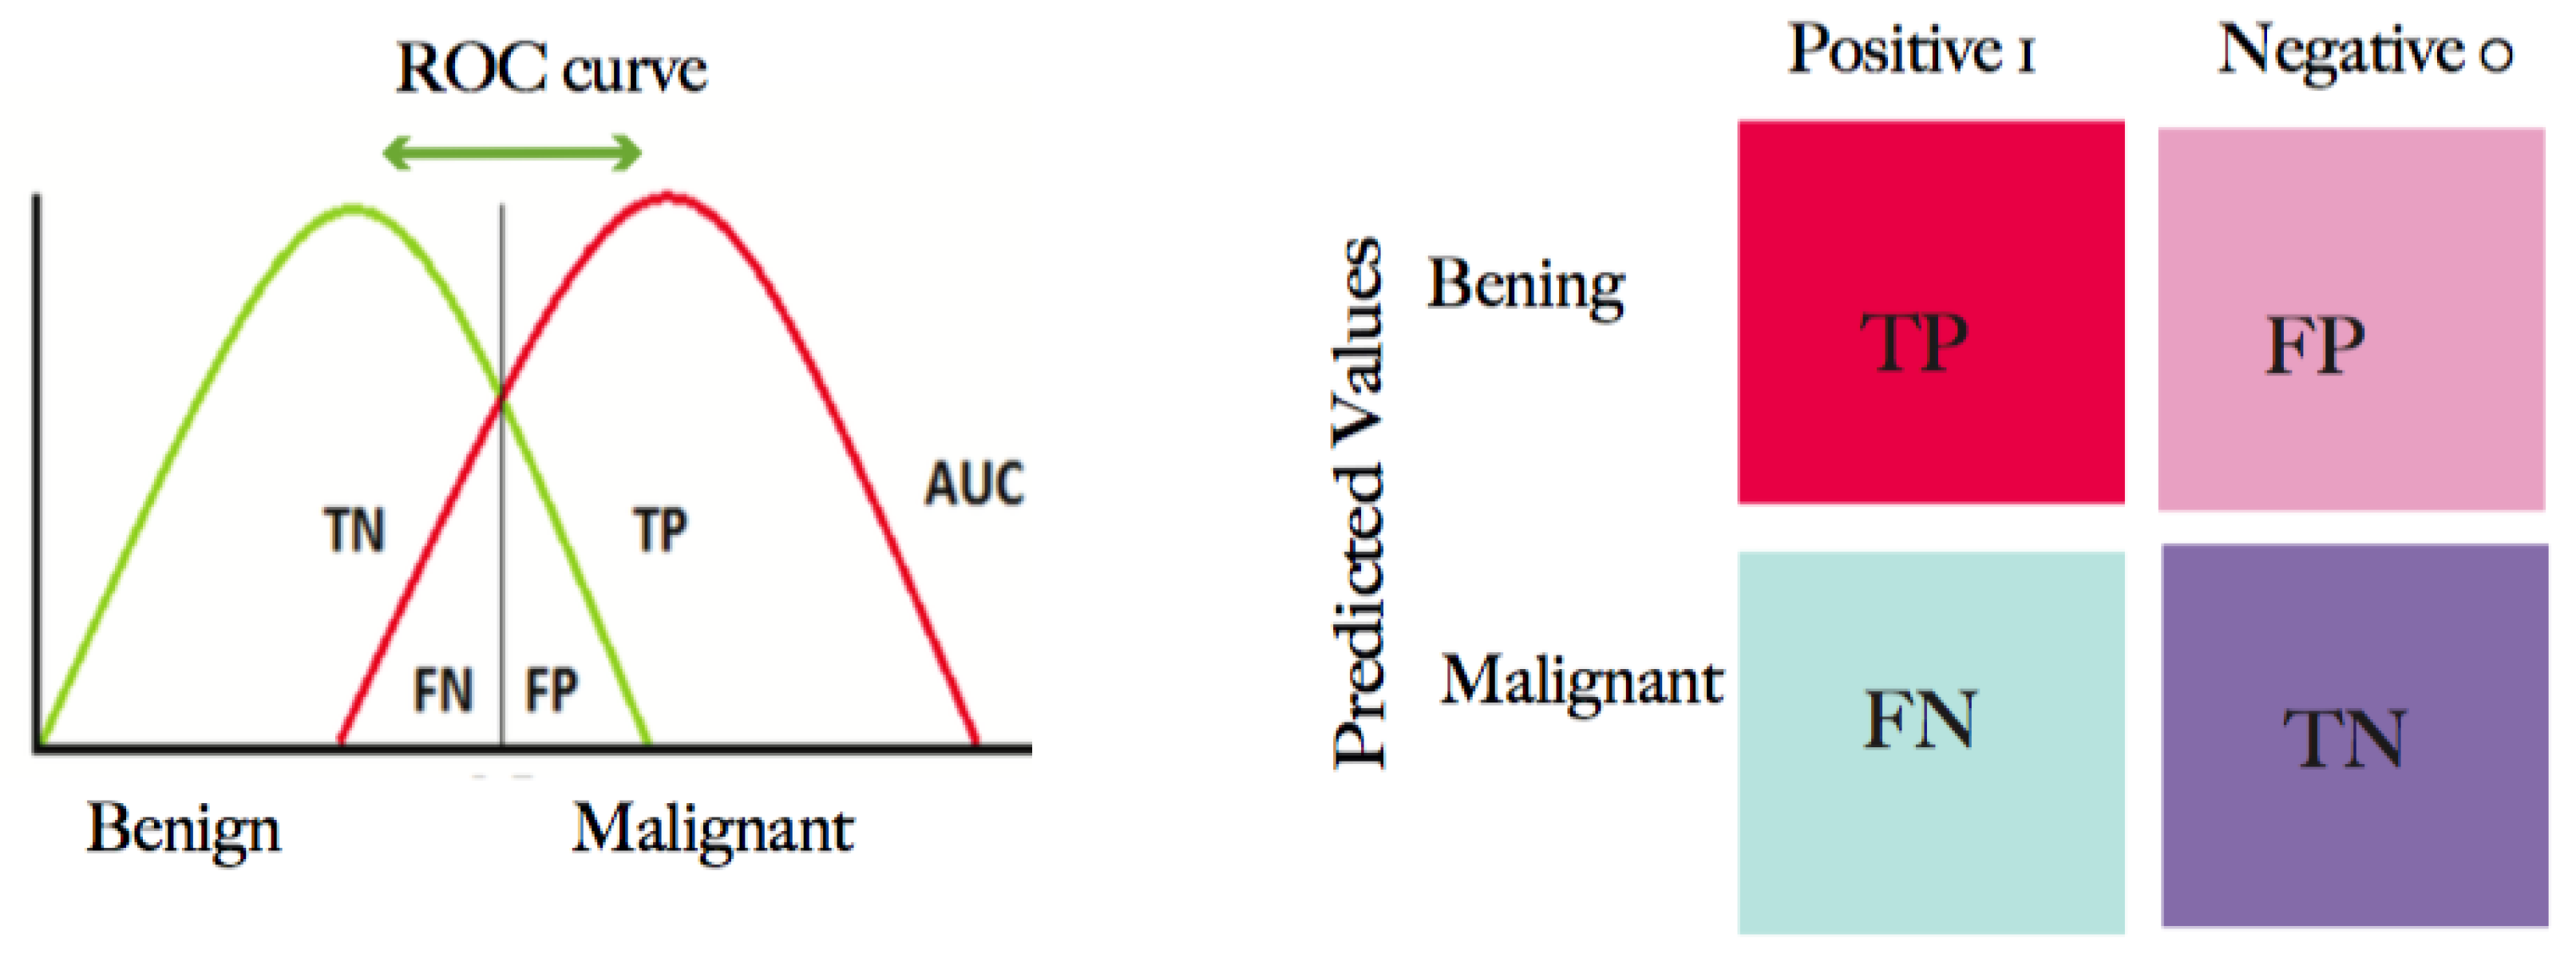
| Classes | Predicted Classes | Equation | |
|---|---|---|---|
| C1 | C2 | ||
| C1 (Benign) | TP | FN | |
| C2 (Malignant) | FP | TN | |
| Model | Equation |
|---|---|
| Accuracy | |
| Sensitivity | |
| Specificity | |
| Precision | |
| F1 Score | |
| MCC |
| Reference | Model | Description | Training Method | Application |
|---|---|---|---|---|
| Krizhevsky et al. [169] | AlexNet | A deep CNN evaluated using the Imagenet [65] LSVRC-2010 dataset [173], with top-1 and top-5 error rates of 37.5% and 17.0%, respectively. This achieved a top-5 test error rate of 15.3% compared to 26.2% (ImageNet Large-Scale Visual Recognition Challenge (ILSVRC) 2012). | Dropout model | Classification |
| Samala et al. [174] | DL-CNN | CAD system for masses in DBT volume, which is trained using transfer learning. The best AUC obtained was 0.933 and the improvement was statistically significant (p < 0.05). | CNN architecture | Detection tomosynthesis from DM |
| Simoyan et al. [170] | VGG-VD | The very deep (VD)-CNN models (VGG-VD16 and VGG-VD19 [158]) were evaluated in ILSVRC 2014 (ImageNet). | Deep ConvNet architecture | Classification |
| He et al. [171] | ResNet | An ensemble of these residual nets achieved a 3.57% error on the ImageNet (ILSVRC 2015) test set. | ResNet with a depth of up to 152 layers 8× deeper | Classification |
| Huang et al. [172] | DenseNet | DenseNet was proposed to reduce the vanishing gradient problem, to reduce the number of parameters, and to strengthen the feature propagation. | ImageNet with a CNN | Object recognition |
| Szegedy et al. [27] | Inception v5 | A deep CNN was evaluated in ILSVRC 2014. | Deep-CNN | Classification and detection |
| Das et al. [175] | VGGNet | BreakHist dataset with 58 malignant and 24 benign cases was evaluated with a deep CNN. The best accuracy percentage was reached with 100× (89.06%). | MIL architecture | Histopathology |
| Cao et al. [152] | Deep CNN | Private dataset that contains 577 benign and 464 malignant cases. | Detection: Fast R-CNN, Faster R-CNN, YOLOv3, and SSD; Classification: AlexNet, VGG, ResNet, GoogleNet, ZFNet, and Densenet | US lesion detection and classification |
| Chiao et al. [153] | Deep CNN | Private US imaging dataset that contains 307 images with 107 benign and 129 malignant cases. | Mask R-CNN with ROI alignment; based on a faster R-CNN using an RPN to extract features | Sonogram lesion detection and classification |
| Yap et al. [48] | LeNet, UNet, deep CNN | This work studies the performance of CNNs in breast US detection using two private datasets A and B. | LeNet [163], U-Net [148], and transfer learning [176] | US breast lesion detection |
| Geras, K. et al. [176] | Multi-view DL-CNN | INbreast [77] and DDSM [58] databases were used; the model achieved an AUC of 0.68%. | The CNN is jointly trained using stochastic gradient descent with backpropagation [175,176] and data augmentation via random cropping [168,177] | High-resolution, augmentation, and DM classification |
| Han et al. [62] | GoogleNet with ensemble learning | Dataset contains a total of 7408 US breast images, with 657 used as the training set and 829 as the test set. The accuracy reached was 90.21%. | The CNN was trained with 10-fold cross-validation. Data augmentation was carrying out with the Caffe method | Data augmentation, detection, and classification of breast lesions in US |
| Dhungel et al. [178] | LeNet for CNN models in cascade R-CNN | INbreast dataset was used, with 115 cases and 410 images from MLO and CC views. The results showed that the DL-CAD system is able to detect 90% of masses, with a segmentation accuracy of 85% and the classification reached a sensitivity of 0.98 and a specificity of 0.7. | DL detection: Fast R-CNN, multiscale-DBN, and random forest; DL segmentation: CRF; DL classification: regression method. | Detection, segmentation, and classification of masses in DM |
| Singh et al. [165] | GAN | The Mendeley database [179] was used, which contains 150 malignant and 100 benign tumors. The performance metrics achieved scores of dice = 93.76% and IoU = 88.82%. | Segmentation with GAN learning. | Segmentation and classification of US images |
| Cheng, J. Z. [37] | SDAE based CADx | The method was carried out on a private database, with 520 breast sonograms (275 benign and 245 malignant lesions). The AUC performance reached 0.80%. | An SDAE (OverFeat) model was used to classify with the ensemble method. | Breast lesion/nodules diagnosis and classification of US images |
| Reference | Database | Deep CNN Model | Acc (%) | Sen (%) | Spec (%) | Precision (%) | F1 Score (%) | AUC (%) |
|---|---|---|---|---|---|---|---|---|
| Al-Masni et al. [145] | DDSM with 600 DM. | CNN YOLO5: Fold cross-validation in both datasets; mass classification | 99 | 93.20 | 78 | - | - | 87.74 |
| DDSM augmentation with 2.400 | Mass detection | 97 | 100 | 94 | - | - | 96.45 | |
| Ragab et al. [168] | DDSM with 2620 cases | Deep-CNN-based linear SVM using ROI manually | 79 | 76.3 | 82.2 | 85 | 80 | 88 |
| CBIS- DDSM with 1644 cases | ROI threshold | 80.5 | 77.4 | 84.2 | 86 | 81.5 | 88 | |
| SVM-based medium Gaussian | 87.2 | 86.2 | 87.7 | 88 | 87.1 | 94 | ||
| Duggento et al. [180] | CBIS-DDSM | Deep CNN | 71 | 84.4 | 62.4 | - | - | 77 |
| Chougrad et al. [181] | BCDR | Inceptionv3 | 96.67 | - | - | - | - | 96 |
| DDSM | 97.35 | - | - | - | - | 98 | ||
| INbreast | 95.50 | - | - | - | - | 97 | ||
| MIAS | 98.23 | - | - | -- | 99 |
| Reference | Database | Deep CNN Model | Acc (%) | Sen (%) | Spec (%) | Precision (%) | F1 Score (%) | AUC (%) |
|---|---|---|---|---|---|---|---|---|
| Moon et al. [49] | BUSI SNUH | VGGNet-like | 84.57 | 73.65 | 93.12 | 89.34 | 80.74 | 91.98 |
| VGGNet 16 | 84.57 | 73.64 | 93.12 | 89.34 | 80.74 | 93.22 | ||
| ResNet 18 | 81.60 | 86.49 | 77.77 | 75.29 | 80.50 | 91.85 | ||
| ResNet 50 | 81.60 | 75.68 | 86.24 | 81.16 | 78.32 | 88.83 | ||
| ResNet 101 | 84.57 | 75,00 | 92.06 | 88.10 | 81.02 | 91.04 | ||
| DenseNet 40 | 85.46 | 79.05 | 90.48 | 86.67 | 82.69 | 93.52 | ||
| DenseNet 12 | 86.35 | 77.70 | 93.12 | 89.84 | 83.33 | 92.48 | ||
| DenseNet 161 | 83.09 | 69.59 | 93.65 | 89.57 | 78.33 | 89.18 | ||
| Byra et al. [66,182] | ImageNet | VGG19 | 88.7 | 0.848 | 0.897 | - | - | 93.6 |
| UDIAT | 84 | 0.851 | 0.834 | - | - | 89.3 | ||
| OASBUD [150] | 83 | 0.807 | 0.854 | - | - | 88.1 | ||
| Cao et al. [152] | Private dataset consisting of 579 benign and 464 malignant cases | Single Shot Detector (SSD)300 + ZFNet YOLO SSD300 + VGG16 | 96.89 | 67.23 | - | - | 79.38 | - |
| 96.81 | 65.83 | - | - | 78.37 | - | |||
| 96.42 | 66.70 | - | - | 78.85 | - | |||
| Han et al. [62] | Private database with a total of 7408 US images with 4254 benign and 3154 malignant lesions | CNN-based GoogleNet | 91.23 | 84.29 | 96.07 | - | 91 | |
| Shan et al. [35] | Private database containing 283 breast US images (133 cases are benign and 150 cases are malignant) | ANN | 78.1 | 78 | 78.2 | - | - | 82.3 |
| Reference | Application | Method | Dataset | Acc (%) | Sen (%) | Spec (%) | AUC (%) | Error (%) |
|---|---|---|---|---|---|---|---|---|
| Dheeba [183] | DM classification | ML wavelet neural network | Private database consisting of 216 multiview CC and MLO images. | 93.67 | 94.16 | 92.10 | 96.85 | 96.85 |
| Trivizakis et al. [184] | DM classification | ML with transfer learning and features based on ImageNet and CNN architecture | Mini MIAS and DDSM | 79.3 | - | - | 84.2 | - |
| 74.8 | - | - | 78.00 | - | ||||
| Samala et al. [185] | DM classification | Multitask transfer learning by a Deep CNN | ImageNet | 90 | - | - | 82 | - |
| Jadoon et al. [186] | DM extraction and classification | CNN + wavelet CNN + SVM | IRMA, DDSM, and MIAS | 81.83 | - | - | 83.1 | 15.43 |
| 83.74 | - | - | 83.9 | 17.46 | ||||
| Debelee et al. [42] | DM extraction | CNN + SVM | MIAS | 97.46 | 96.26 | 100 | - | - |
| DDSM | 99 | 99.48 | 98.16 | - | - | |||
| MIAS | 87.64 | 96.65 | 75.73 | - | - | |||
| MLP | DDSM | 97 | 97.40 | 96.26 | - | - | ||
| MIAS | 91.11 | 86.66 | 100 | - | - | |||
| KNN + SVM | DDSM | 97.18 | 100 | 95.65 | - | - | ||
| Ahmed et al. [187] | DM detection | Deep CNN with five–fold cross-validation | INbreast | 80.10 | 80 | - | 78 | - |
| Xu et al. [51] | US image segmentation | Deep CNN | Private 3D breast US | 90.13 | 88.88 | - | - | - |
| Shan et al. [35] | US image segmentation | ML decision tree | Private breast US consisting of 283 images, where 133 cases are benign and 150 cases are malignant | 77.7 | 74.0 | 82.0 | 80 | - |
| ANN | 78.1 | 78.0 | 78.2 | 82 | - | |||
| Random forest | 78.5 | 75.3 | 82 | 82 | - | |||
| SVM | 77.7 | 77.3 | 78.2 | 84 | - | |||
| Gu et al. [188] | 3D US image segmentation | Preprocessing: morphological reconstruction; segmentation: region-based approach | Private database with 21 cases, with masses prior to biopsy | 85.7 | - | - | - | - |
| Zhang et al. [36] | US image feature extraction and classification | DL architecture | The private dataset consisting of 227 elastography images, with 135 benign tumors and 92 malignant tumors | 93.4 | 88.6 | 97.1 | 94.7 | - |
| Almajalid et al. [147] | US image segmentation | DL-CNN architecture U-net | The private dataset containing 221 BUS images | 82.52 | 78.66 | 18.59 | - | - |
| Singh et al. [189] | US image classification | ML fuzzy c-means and backpropagation ANN | 178 breast US containing 88 benign and 90 malignant cases | 95.86 | 95.14 | 96.58 | 95.85 | - |
| Cheng et al. [37] | US (sonogram) classification | DL-SDAE | 520 breast US (275 benign and 245 malignant lesions) | 82.4 | 78.7 | 85.7 | 89.6 | _ |
| Shi, et al. [190] | US image classification | Deep polynomial network | A total of 200 pathology-proven breast US images | 92.40 | 92.67 | 91.36 | - | - |
Publisher’s Note: MDPI stays neutral with regard to jurisdictional claims in published maps and institutional affiliations. |
© 2020 by the authors. Licensee MDPI, Basel, Switzerland. This article is an open access article distributed under the terms and conditions of the Creative Commons Attribution (CC BY) license (http://creativecommons.org/licenses/by/4.0/).
Share and Cite
Jiménez-Gaona, Y.; Rodríguez-Álvarez, M.J.; Lakshminarayanan, V. Deep-Learning-Based Computer-Aided Systems for Breast Cancer Imaging: A Critical Review. Appl. Sci. 2020, 10, 8298. https://doi.org/10.3390/app10228298
Jiménez-Gaona Y, Rodríguez-Álvarez MJ, Lakshminarayanan V. Deep-Learning-Based Computer-Aided Systems for Breast Cancer Imaging: A Critical Review. Applied Sciences. 2020; 10(22):8298. https://doi.org/10.3390/app10228298
Chicago/Turabian StyleJiménez-Gaona, Yuliana, María José Rodríguez-Álvarez, and Vasudevan Lakshminarayanan. 2020. "Deep-Learning-Based Computer-Aided Systems for Breast Cancer Imaging: A Critical Review" Applied Sciences 10, no. 22: 8298. https://doi.org/10.3390/app10228298
APA StyleJiménez-Gaona, Y., Rodríguez-Álvarez, M. J., & Lakshminarayanan, V. (2020). Deep-Learning-Based Computer-Aided Systems for Breast Cancer Imaging: A Critical Review. Applied Sciences, 10(22), 8298. https://doi.org/10.3390/app10228298