MEMS Vibrational Power Generator for Bridge Slab and Pier Health Monitoring


Abstract
1. Introduction
1.1. Management of Aging Structures
1.2. Deterioration of Bridge Structure Components
1.3. Development of Sensors with MEMS Technologies
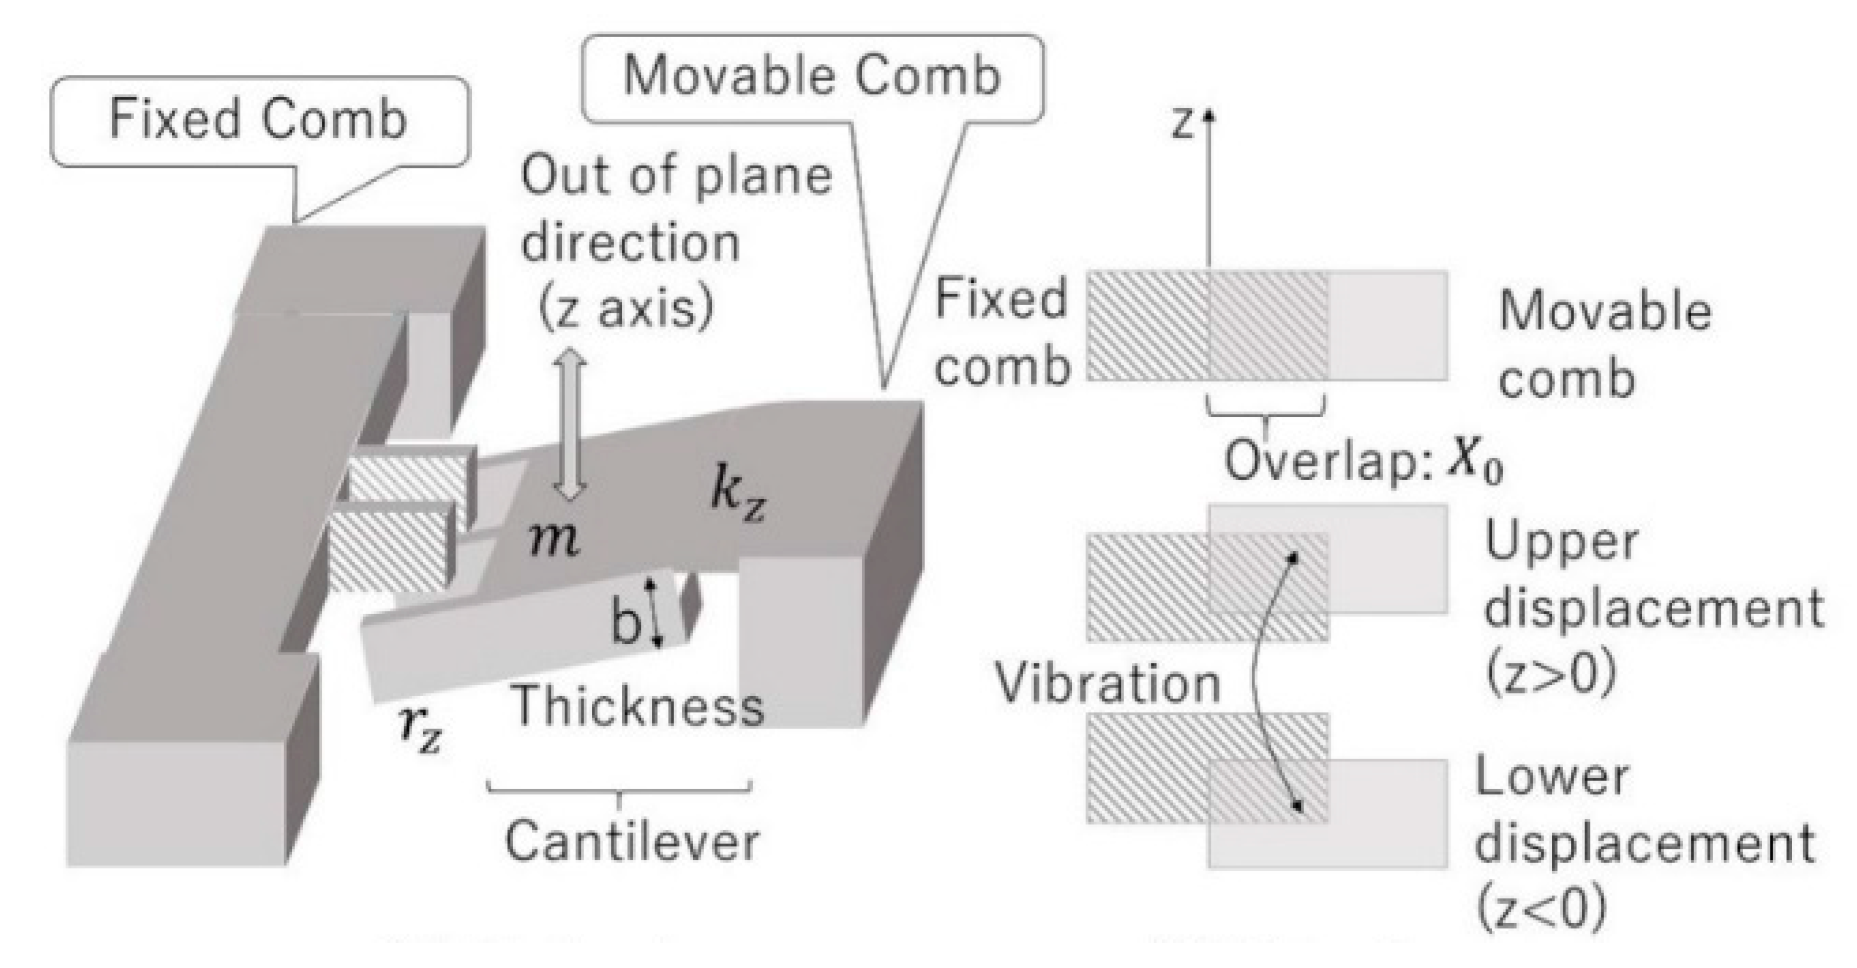
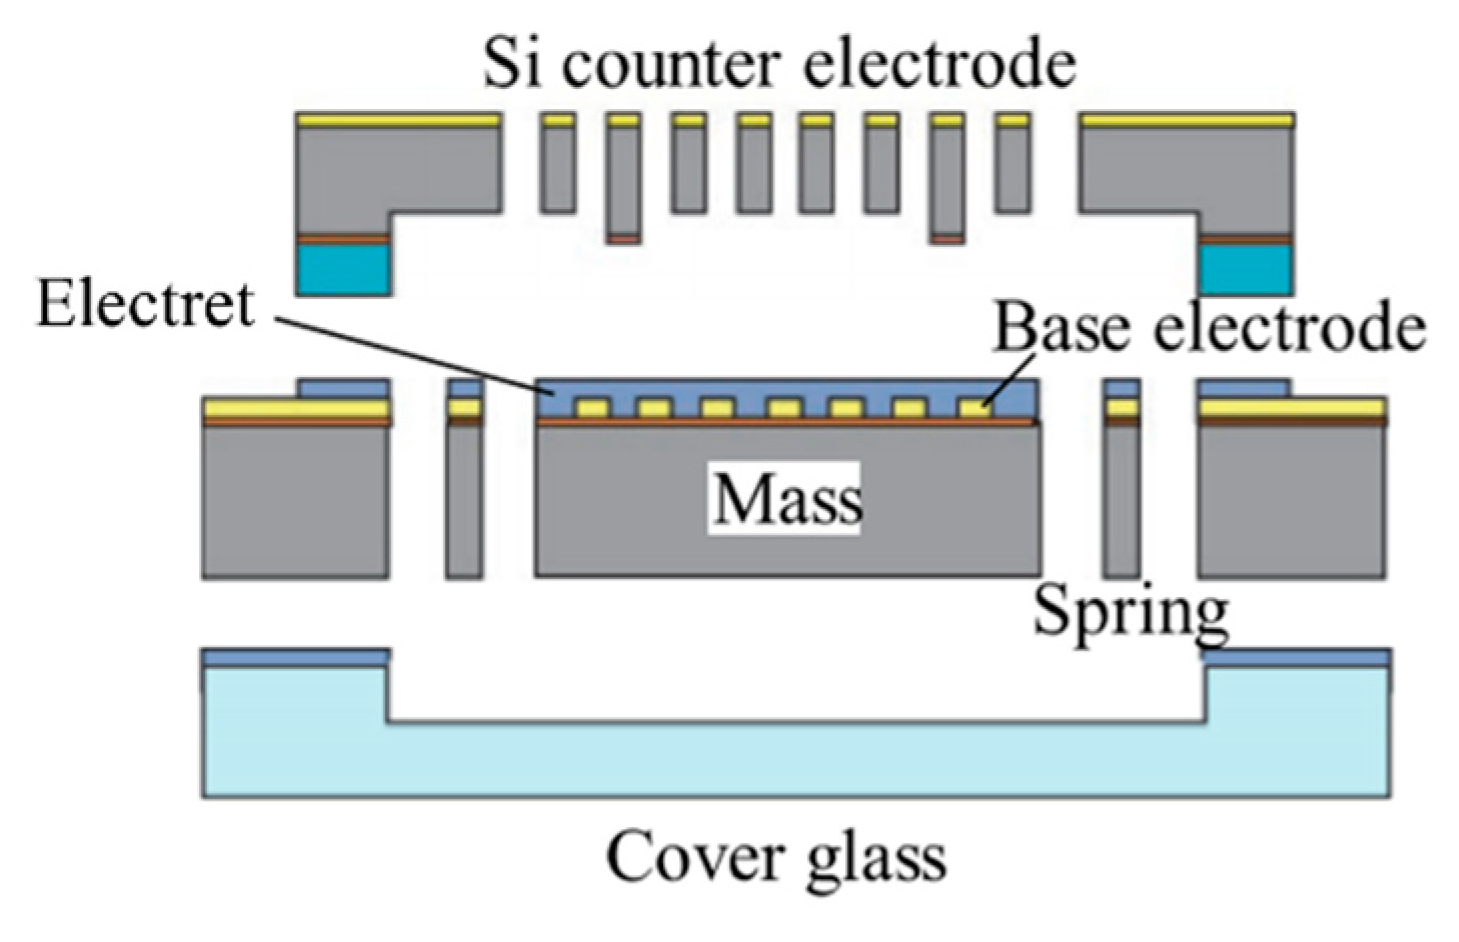
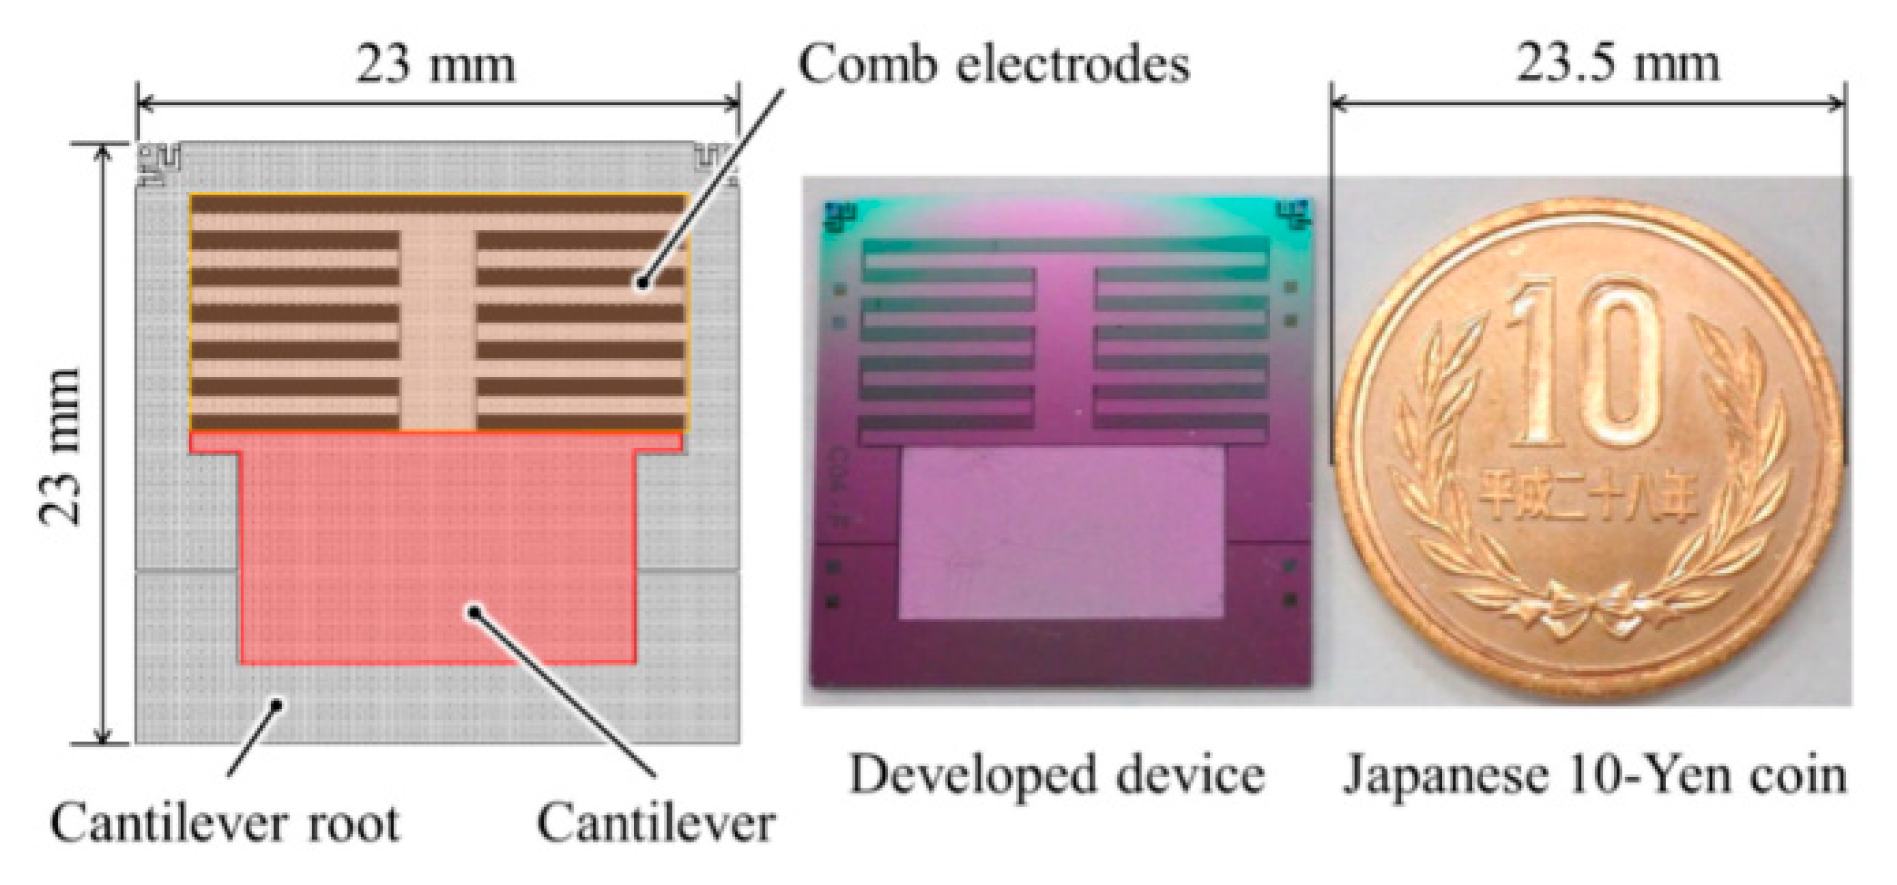
1.4. MEMS Vibrational Power Generator
1.5. Objective
2. Finite Element Analysis for Bridge Structures with Damage and Deterioration
2.1. Outline of Eigen-Modal Analysis
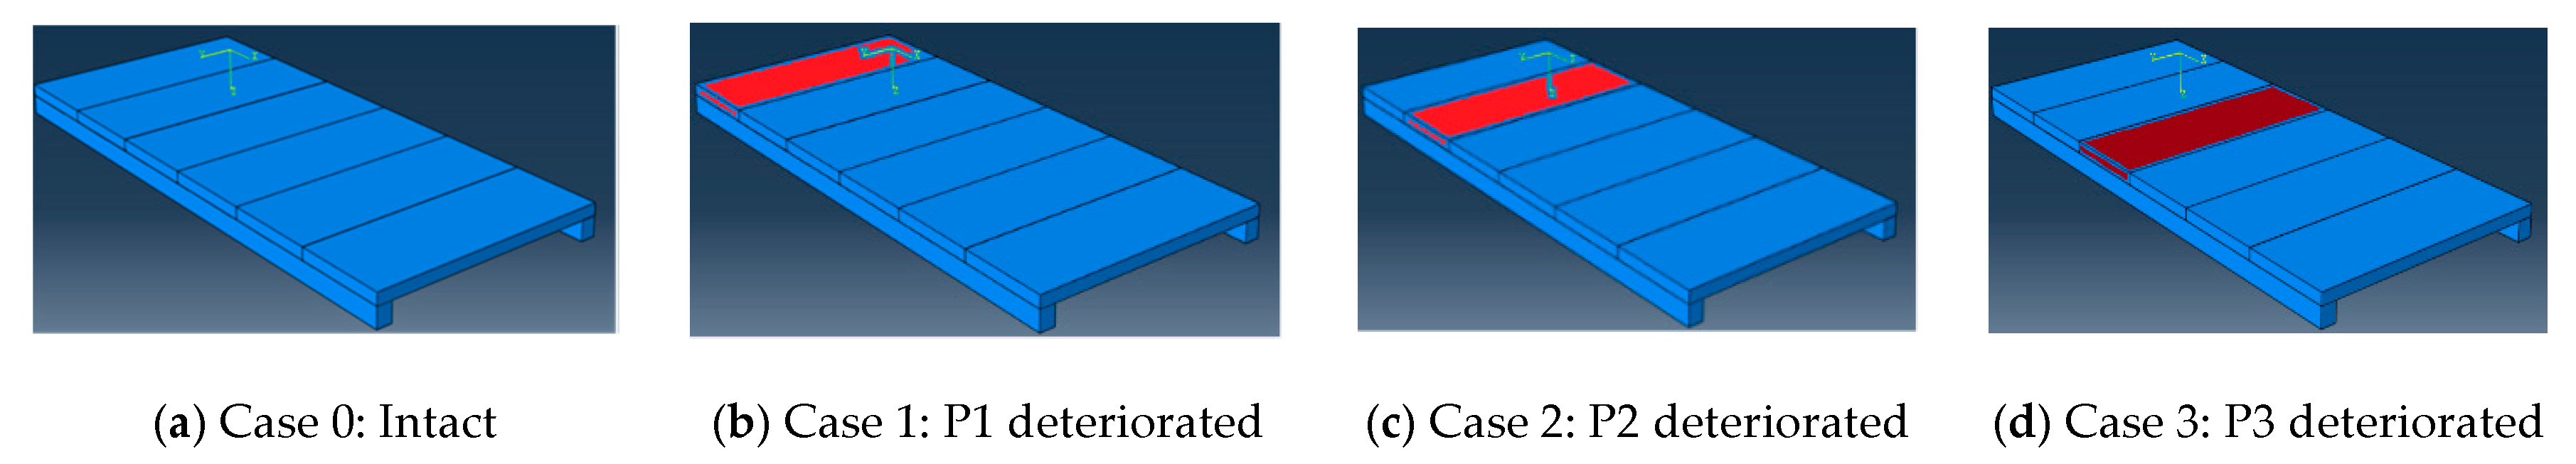
2.2. Slab Model with Concrete Material Deterioration
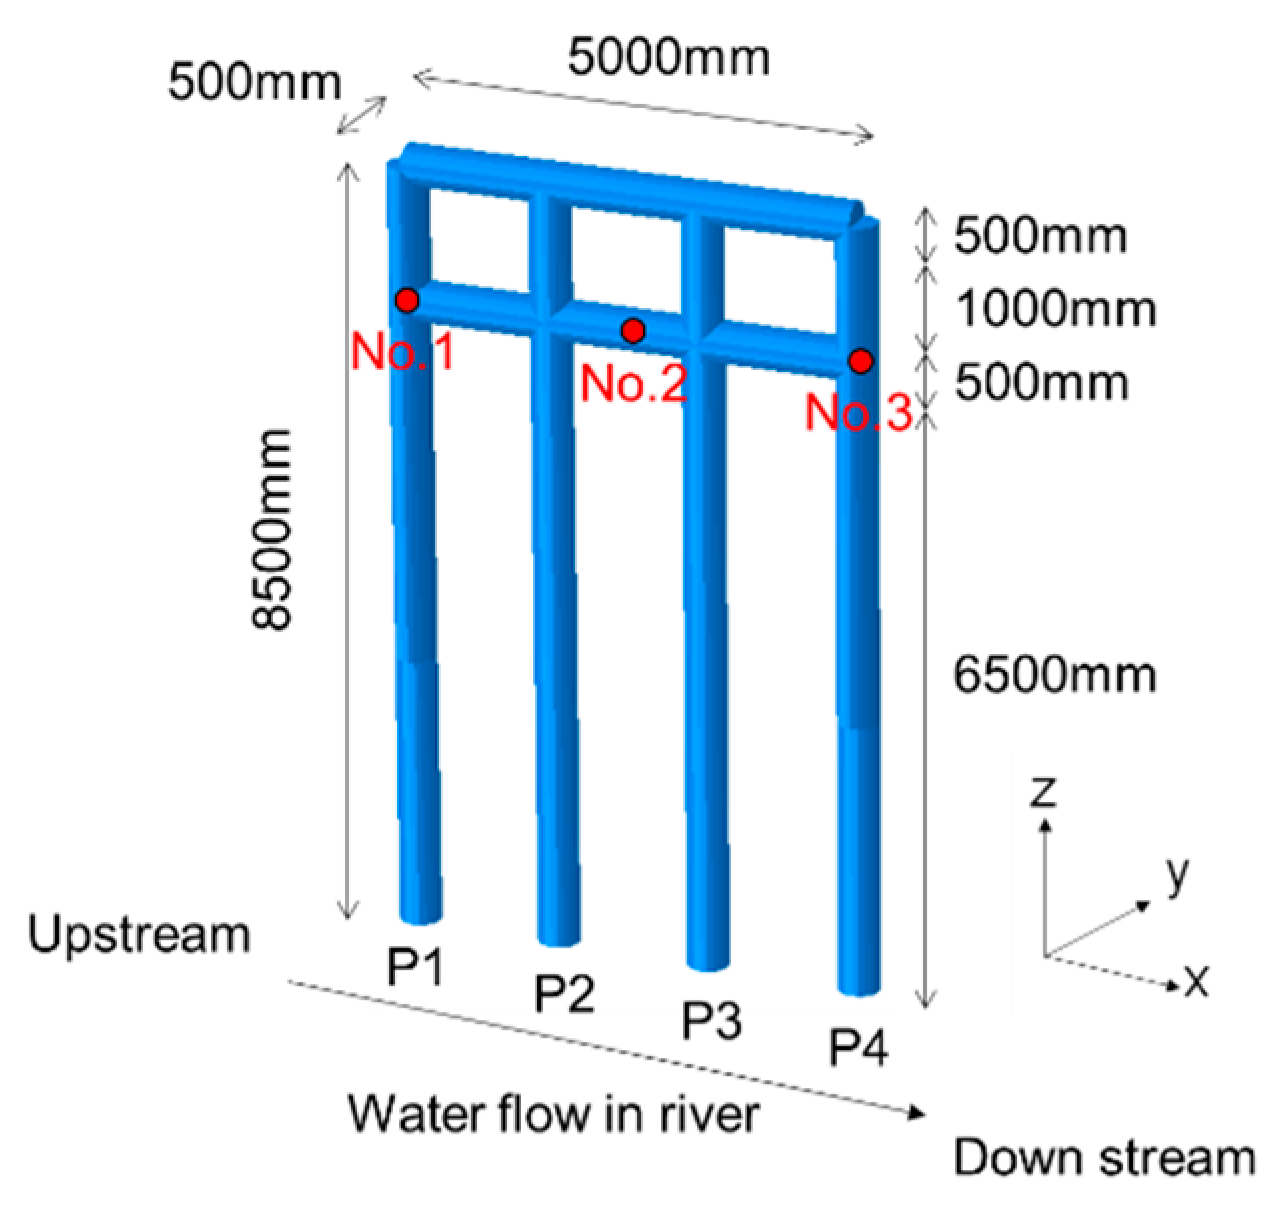
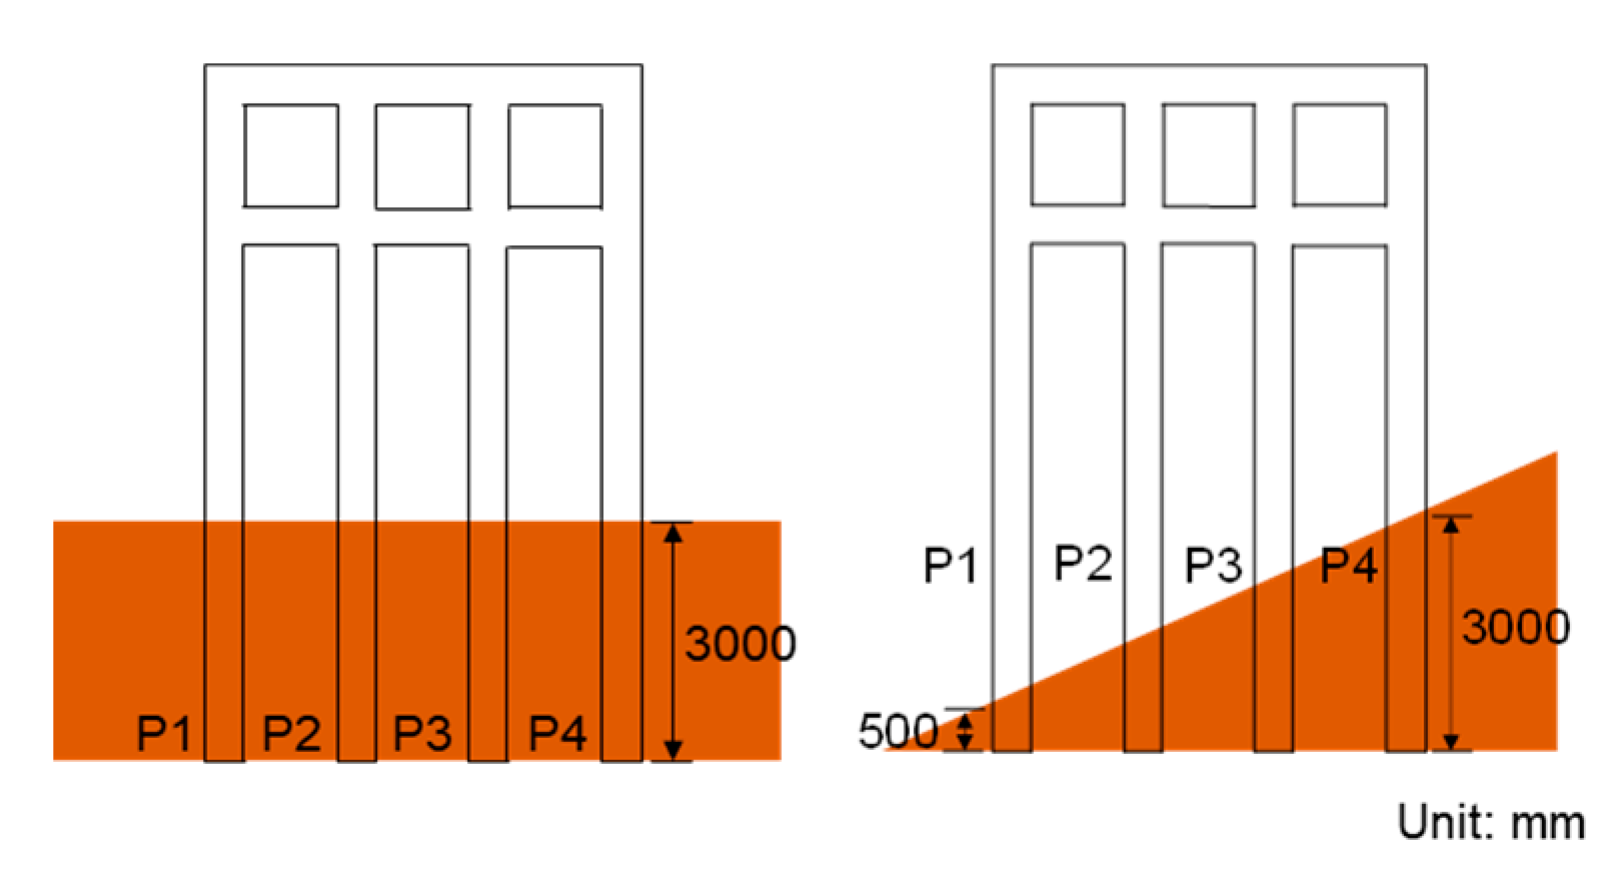
2.3. Pier Model with Scour
2.4. Eigenvalue Analysis Results
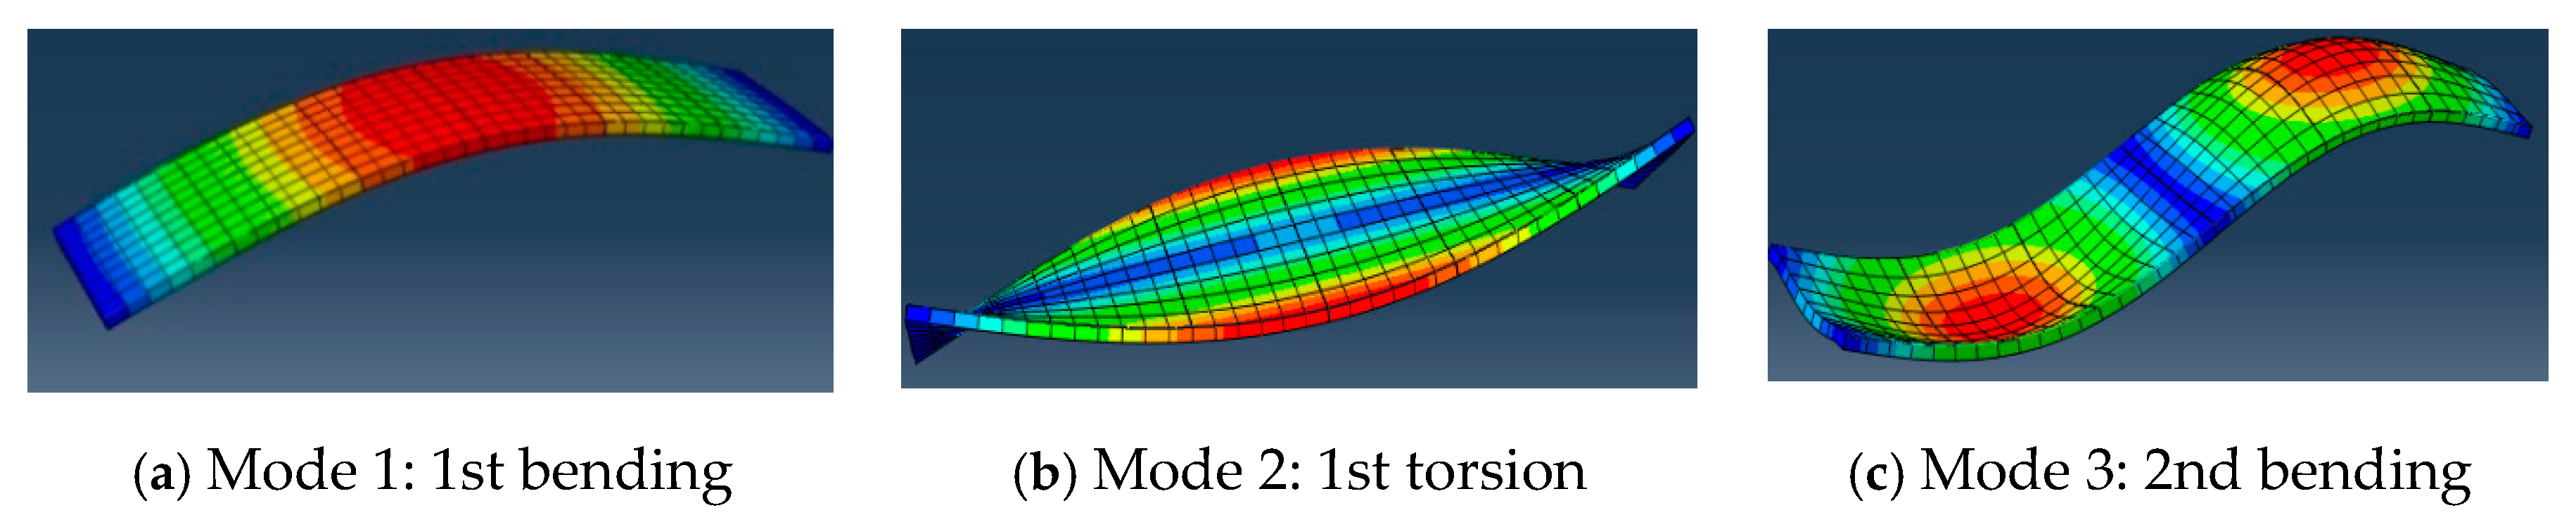
2.4.1. Slab Model
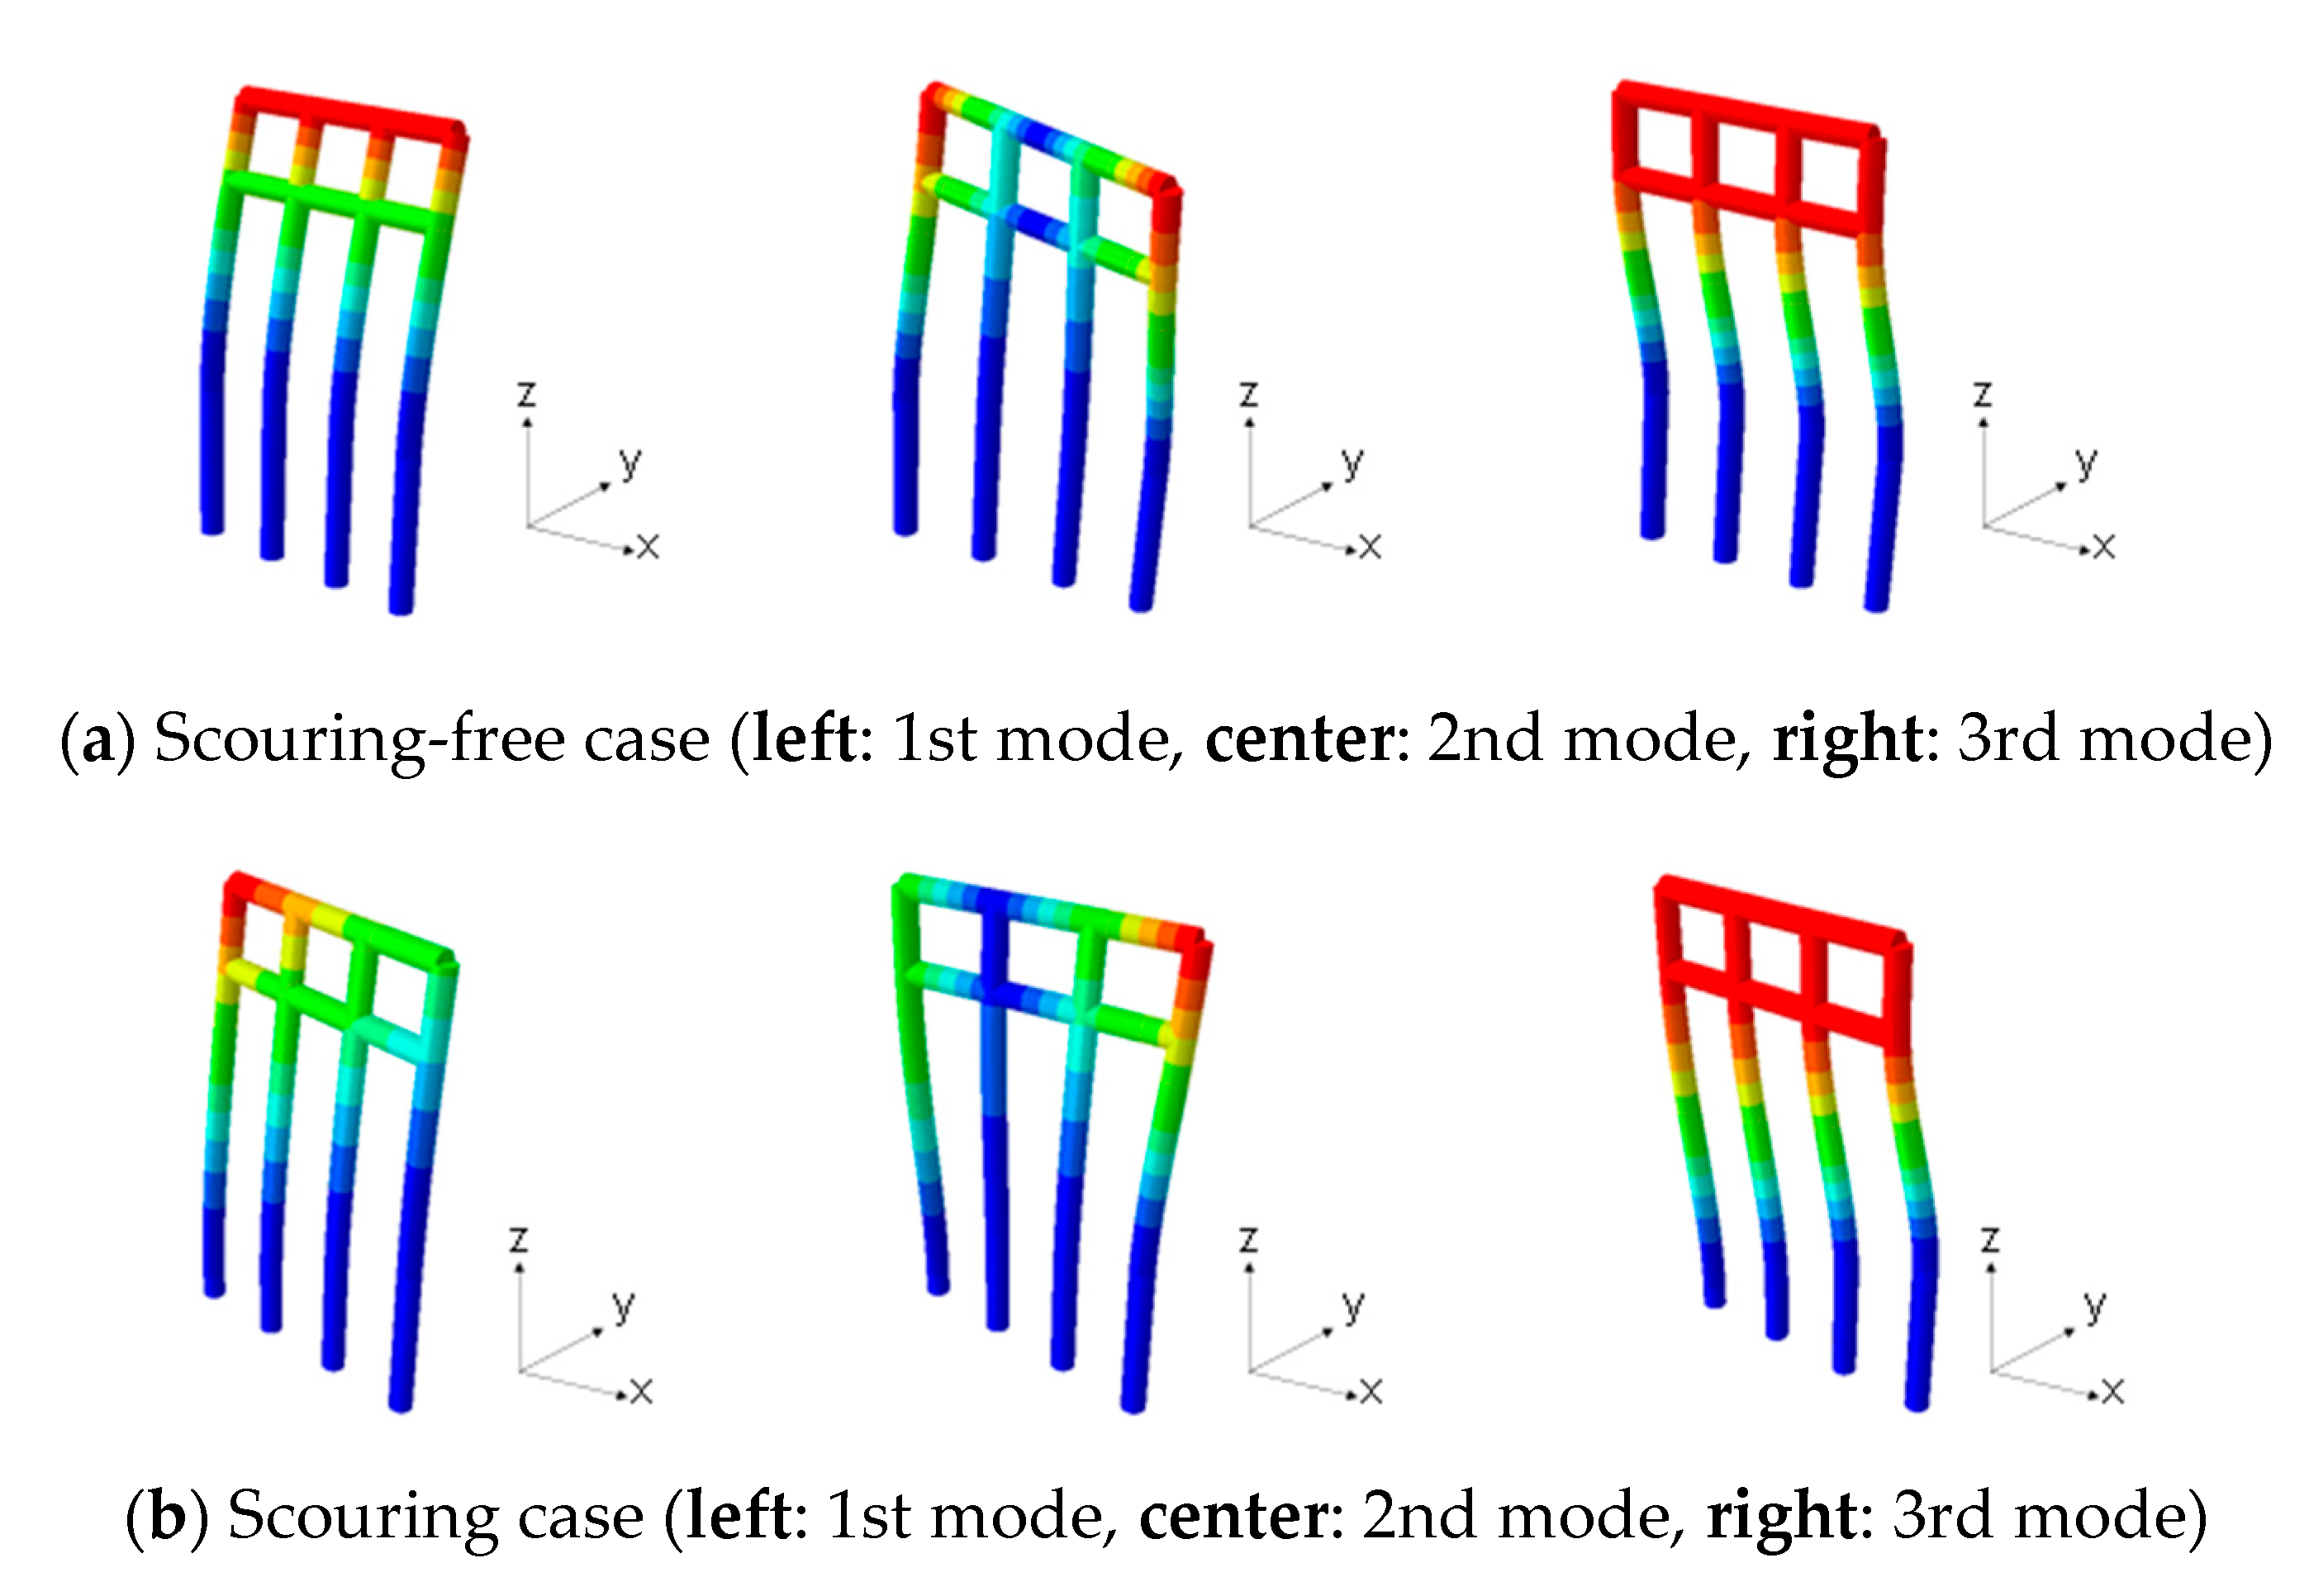
2.4.2. Pier Model
3. Application of MEMS Vibrational Power Generator for Detecting Damage and Deterioration in Bridge Structures
3.1. Numerical Results on Power Generation
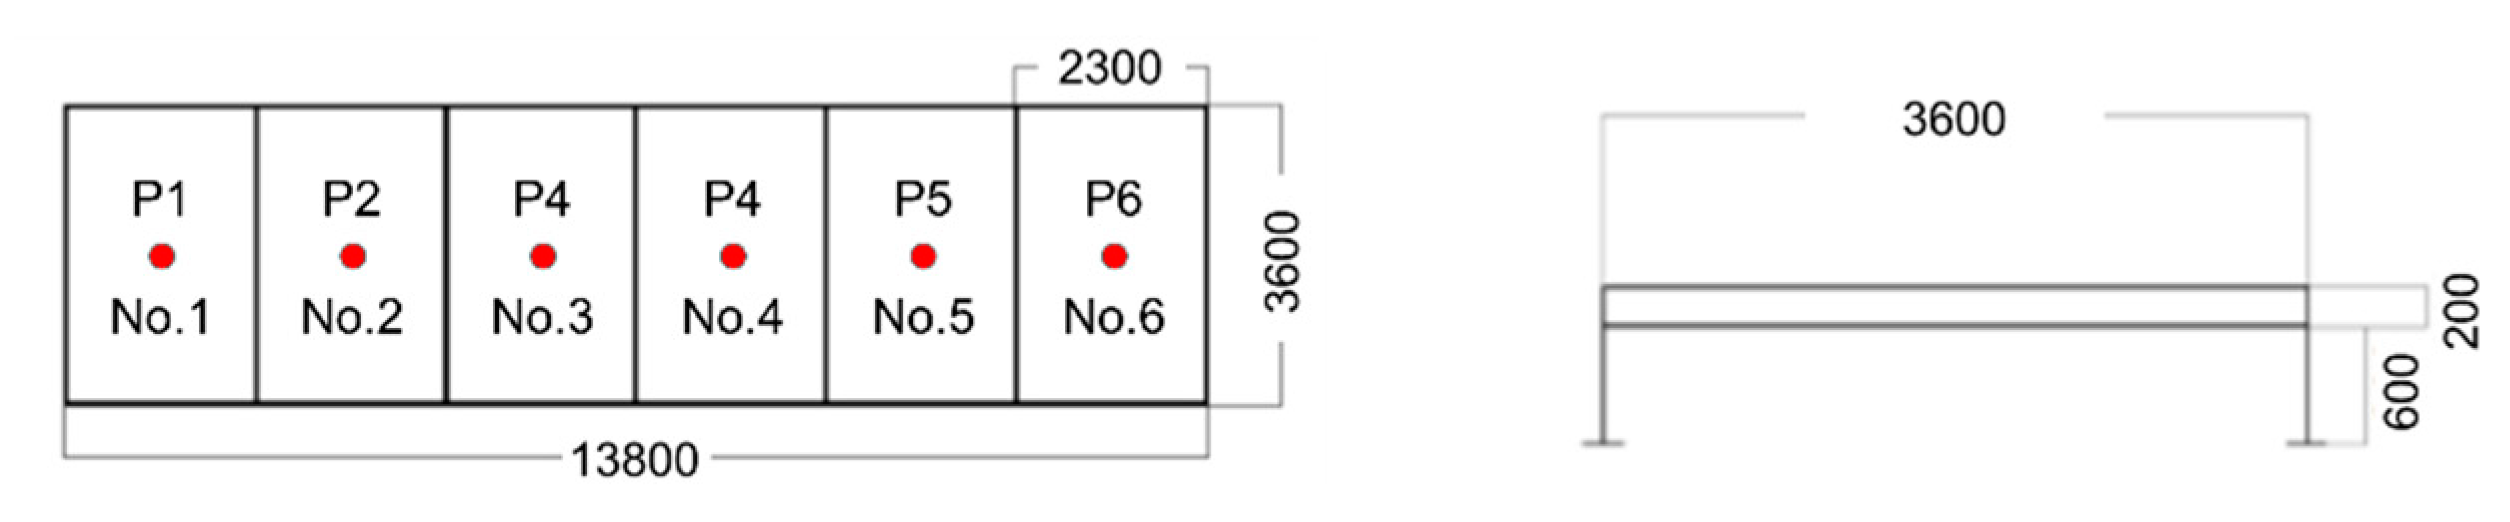
3.2. MEH Power Generation in Slab Models
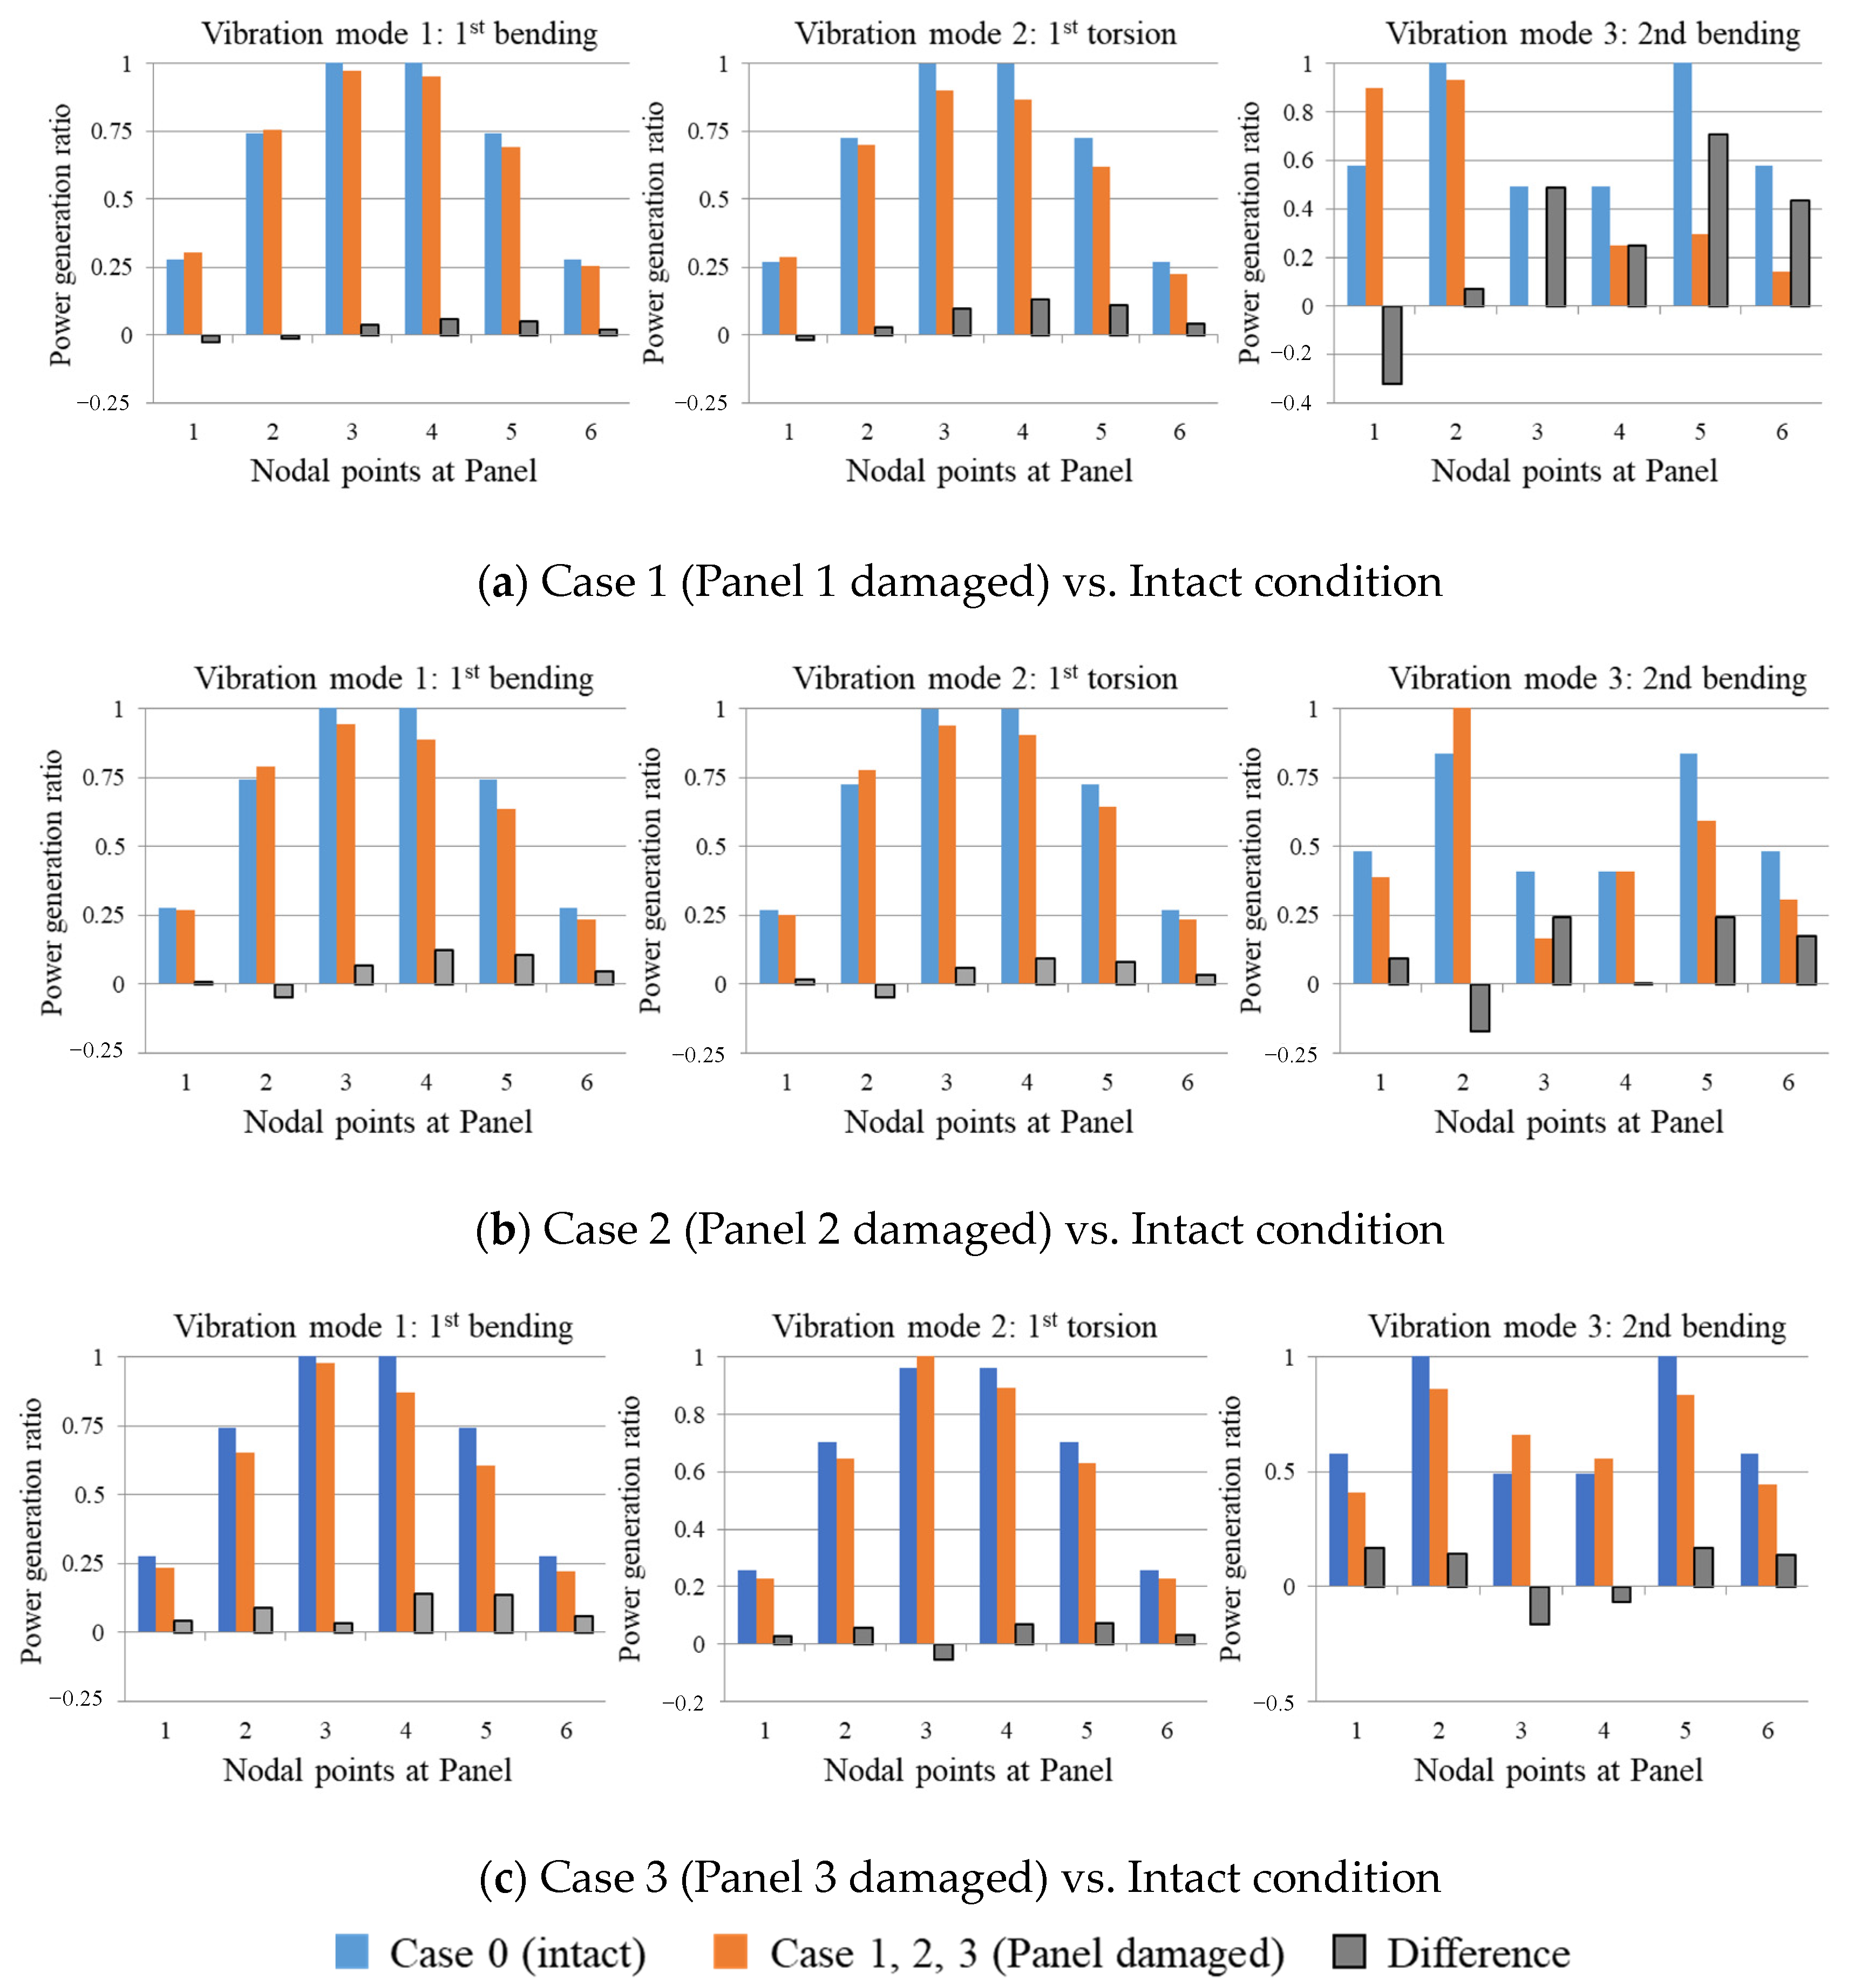
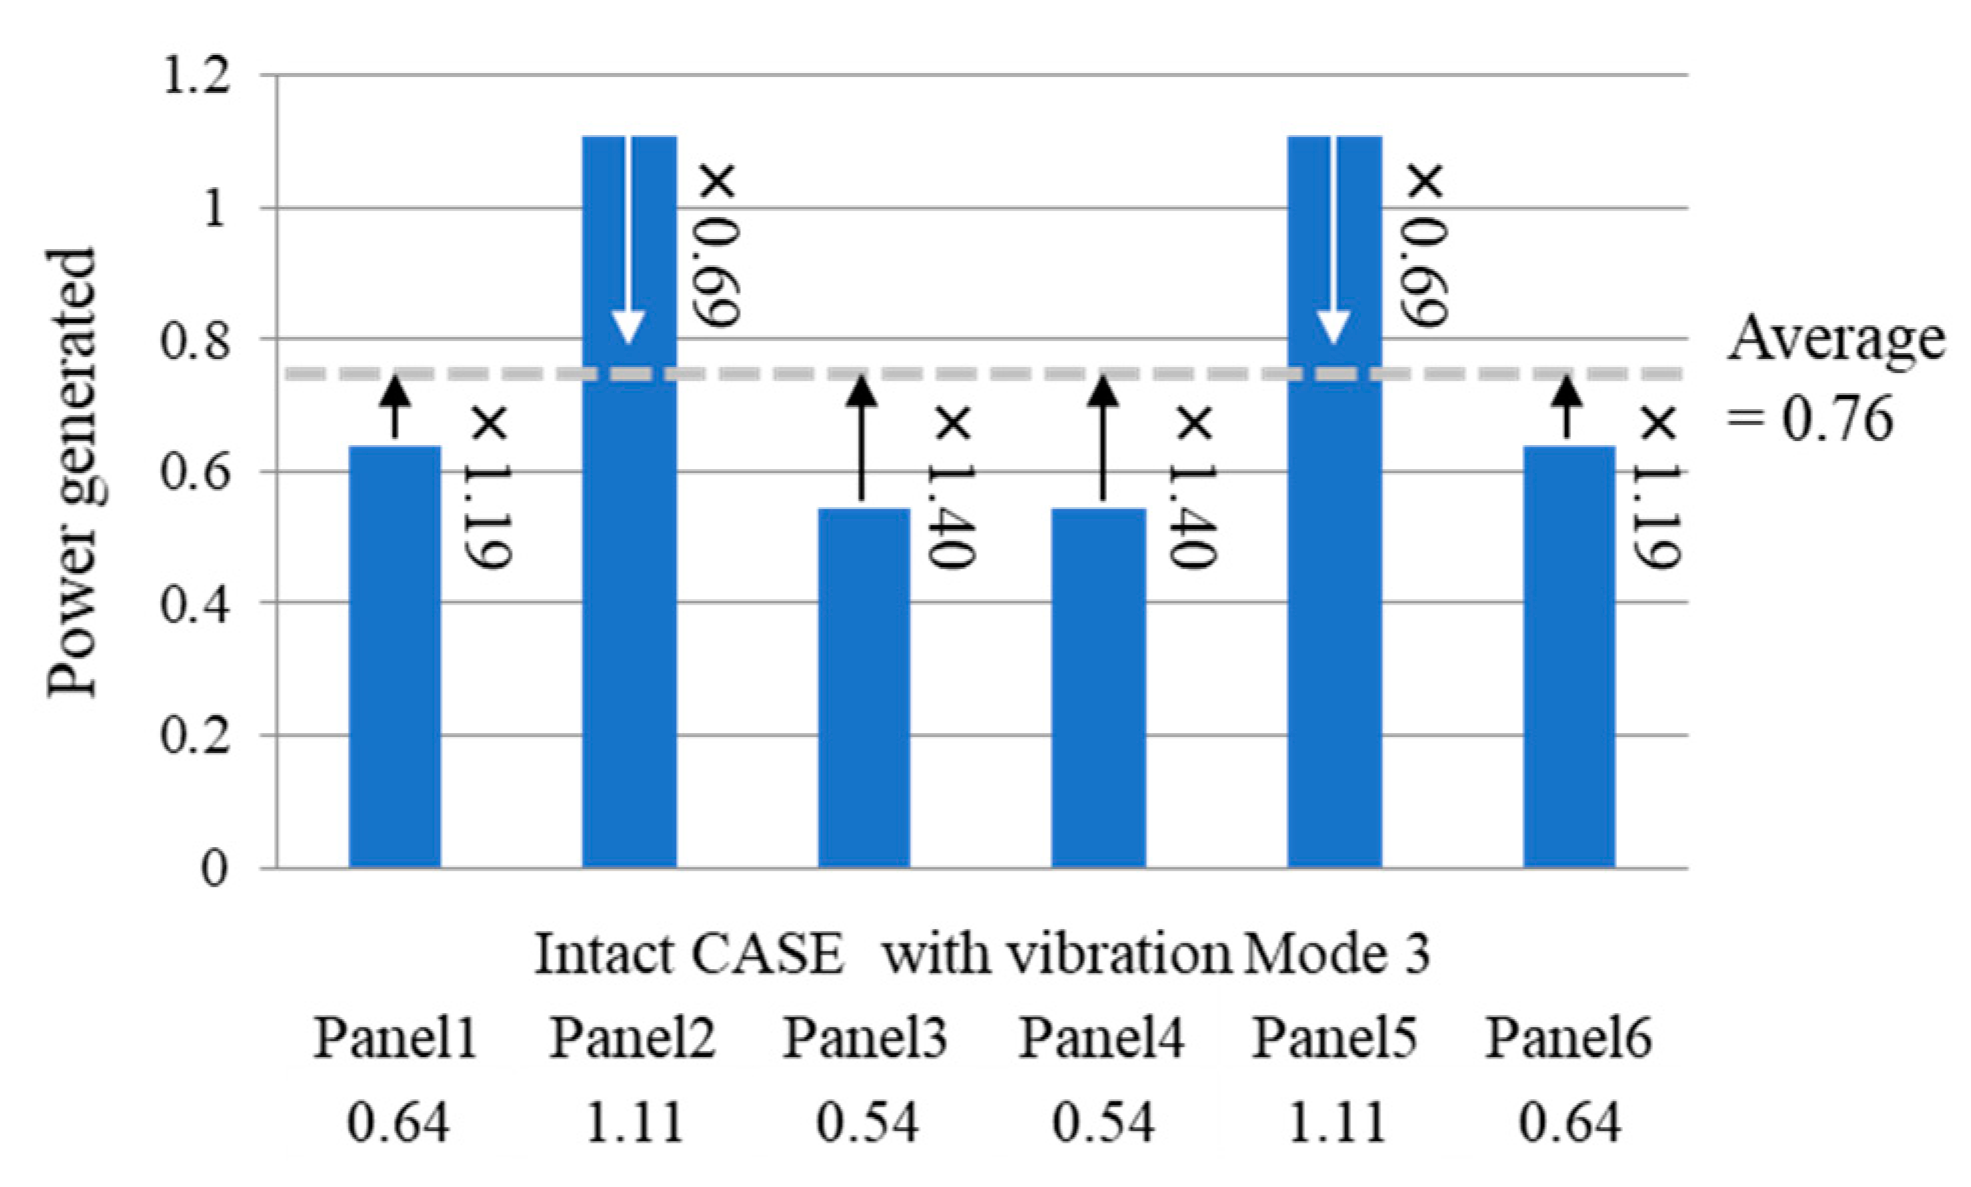
3.3. Detecting Slab Deterioration Using Vibration-Based MEH
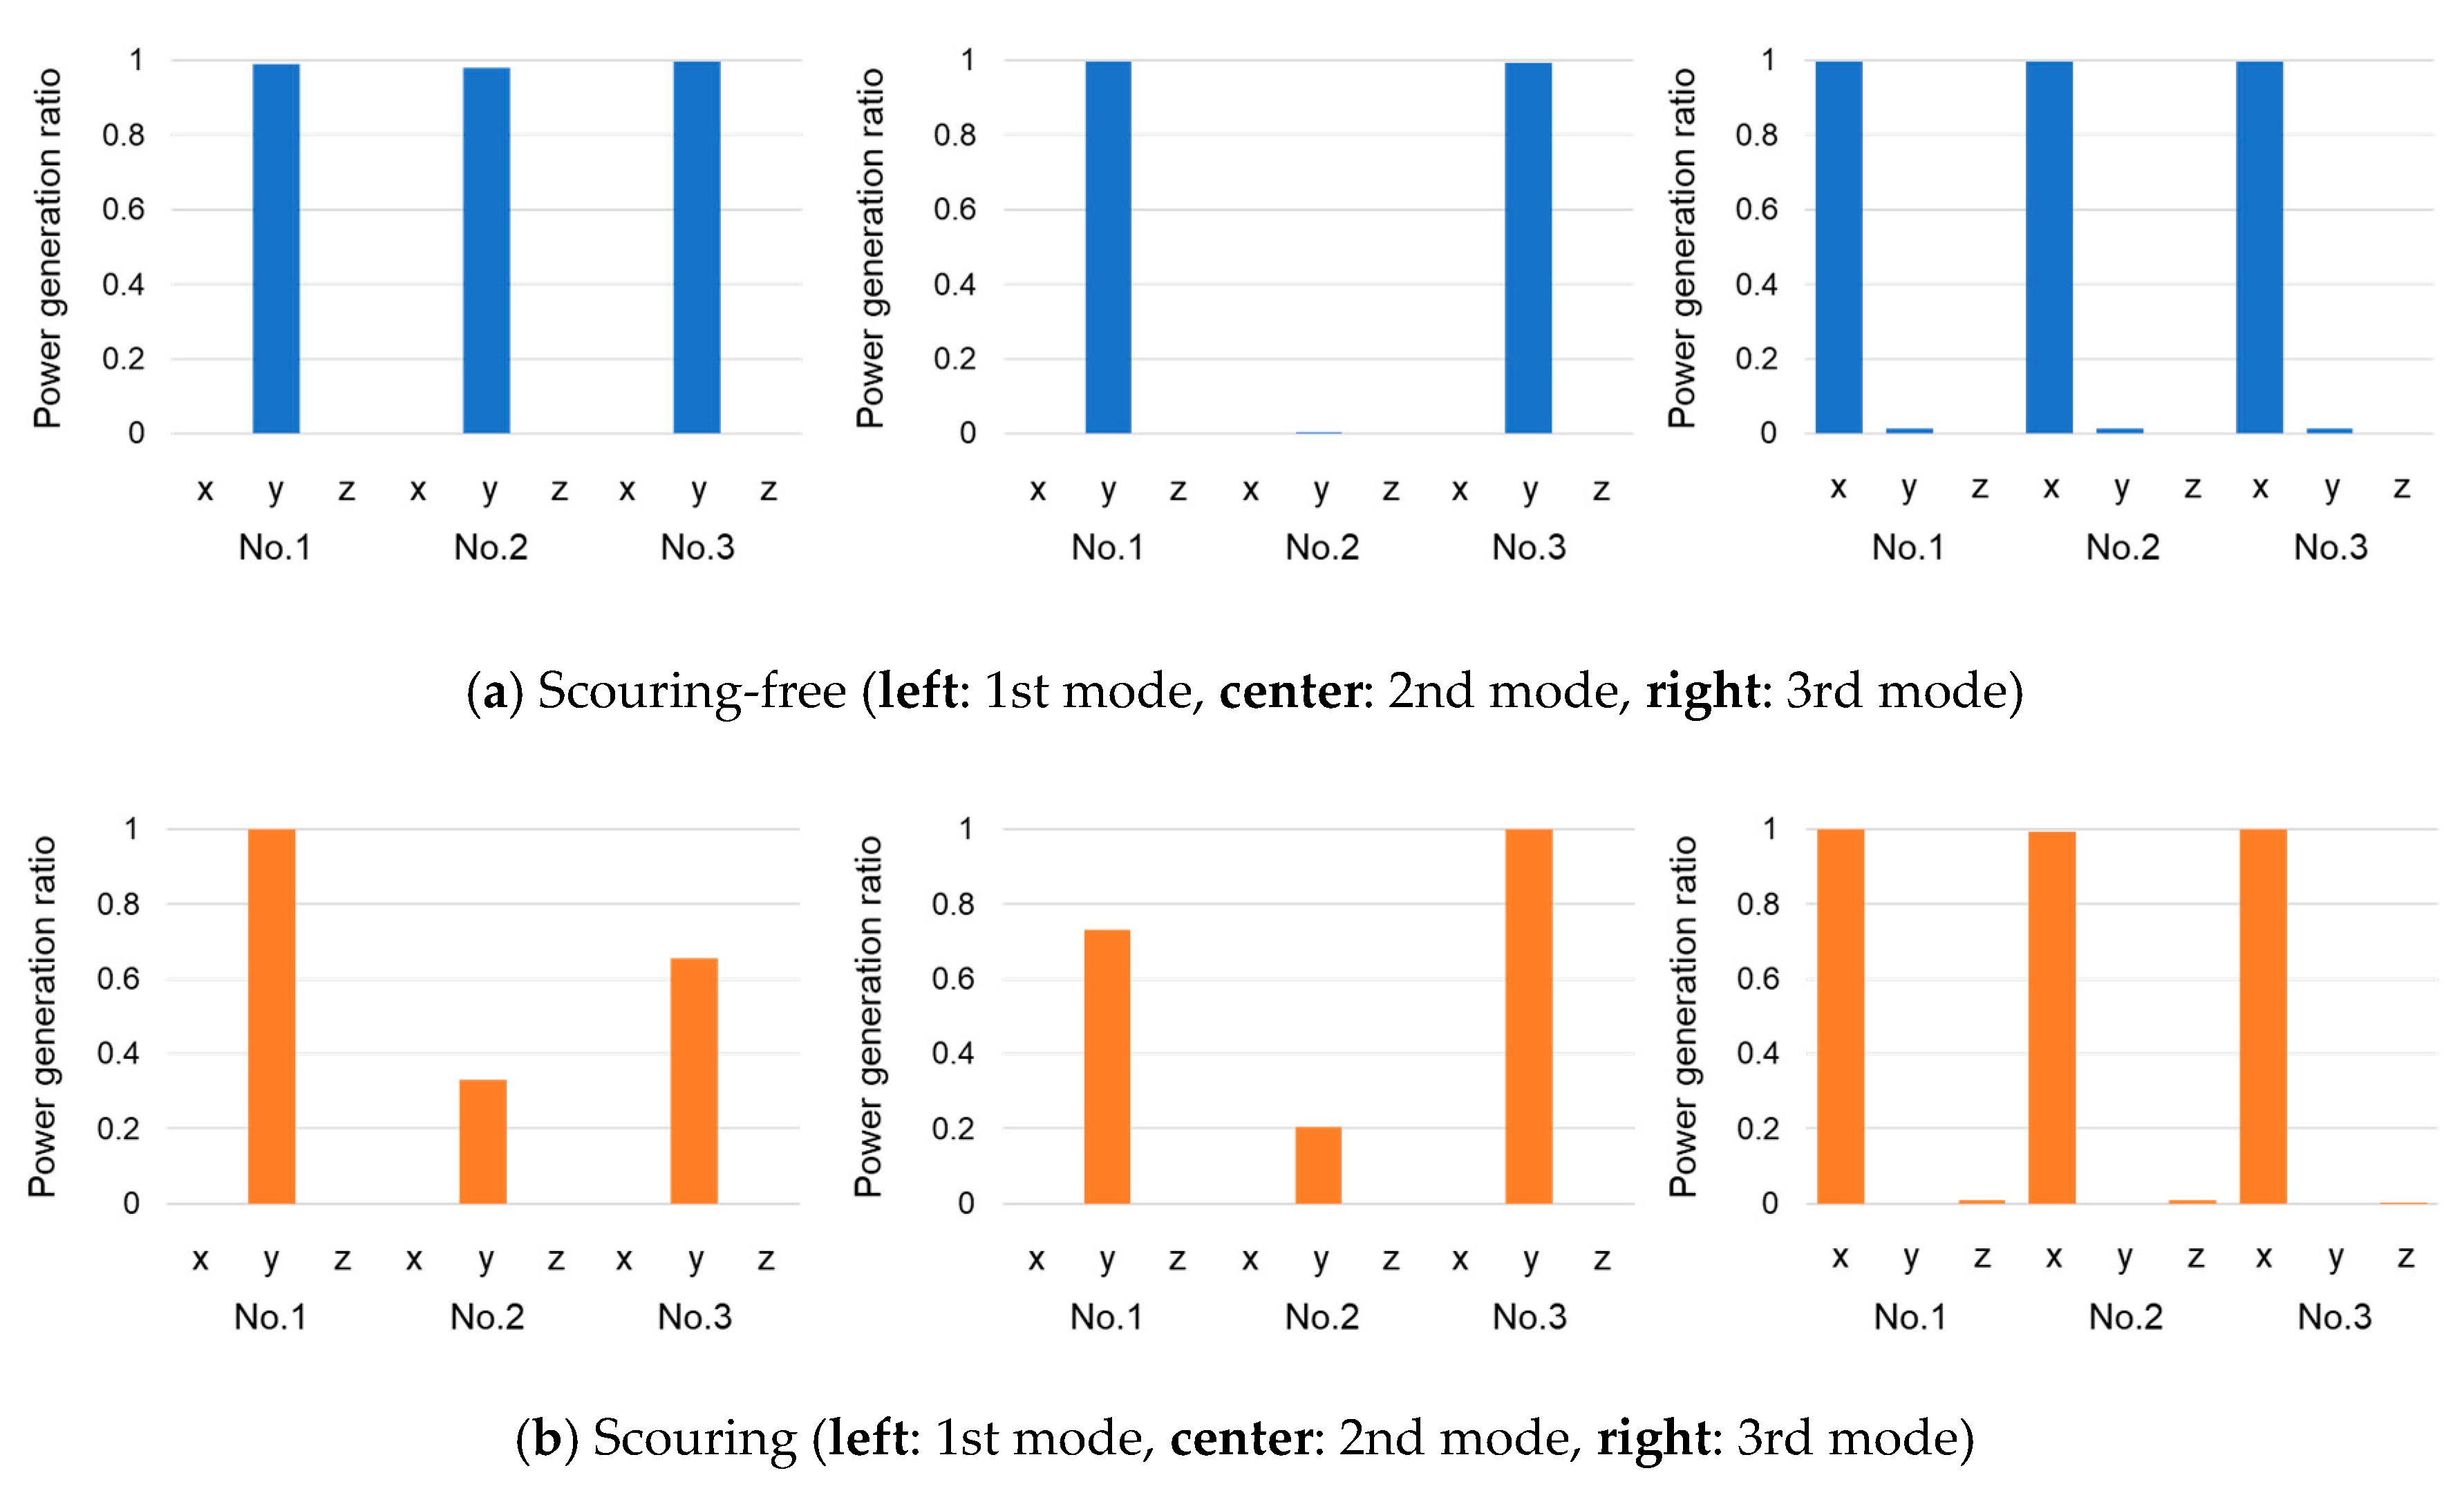
3.4. MEH Power Generation in Pier Models
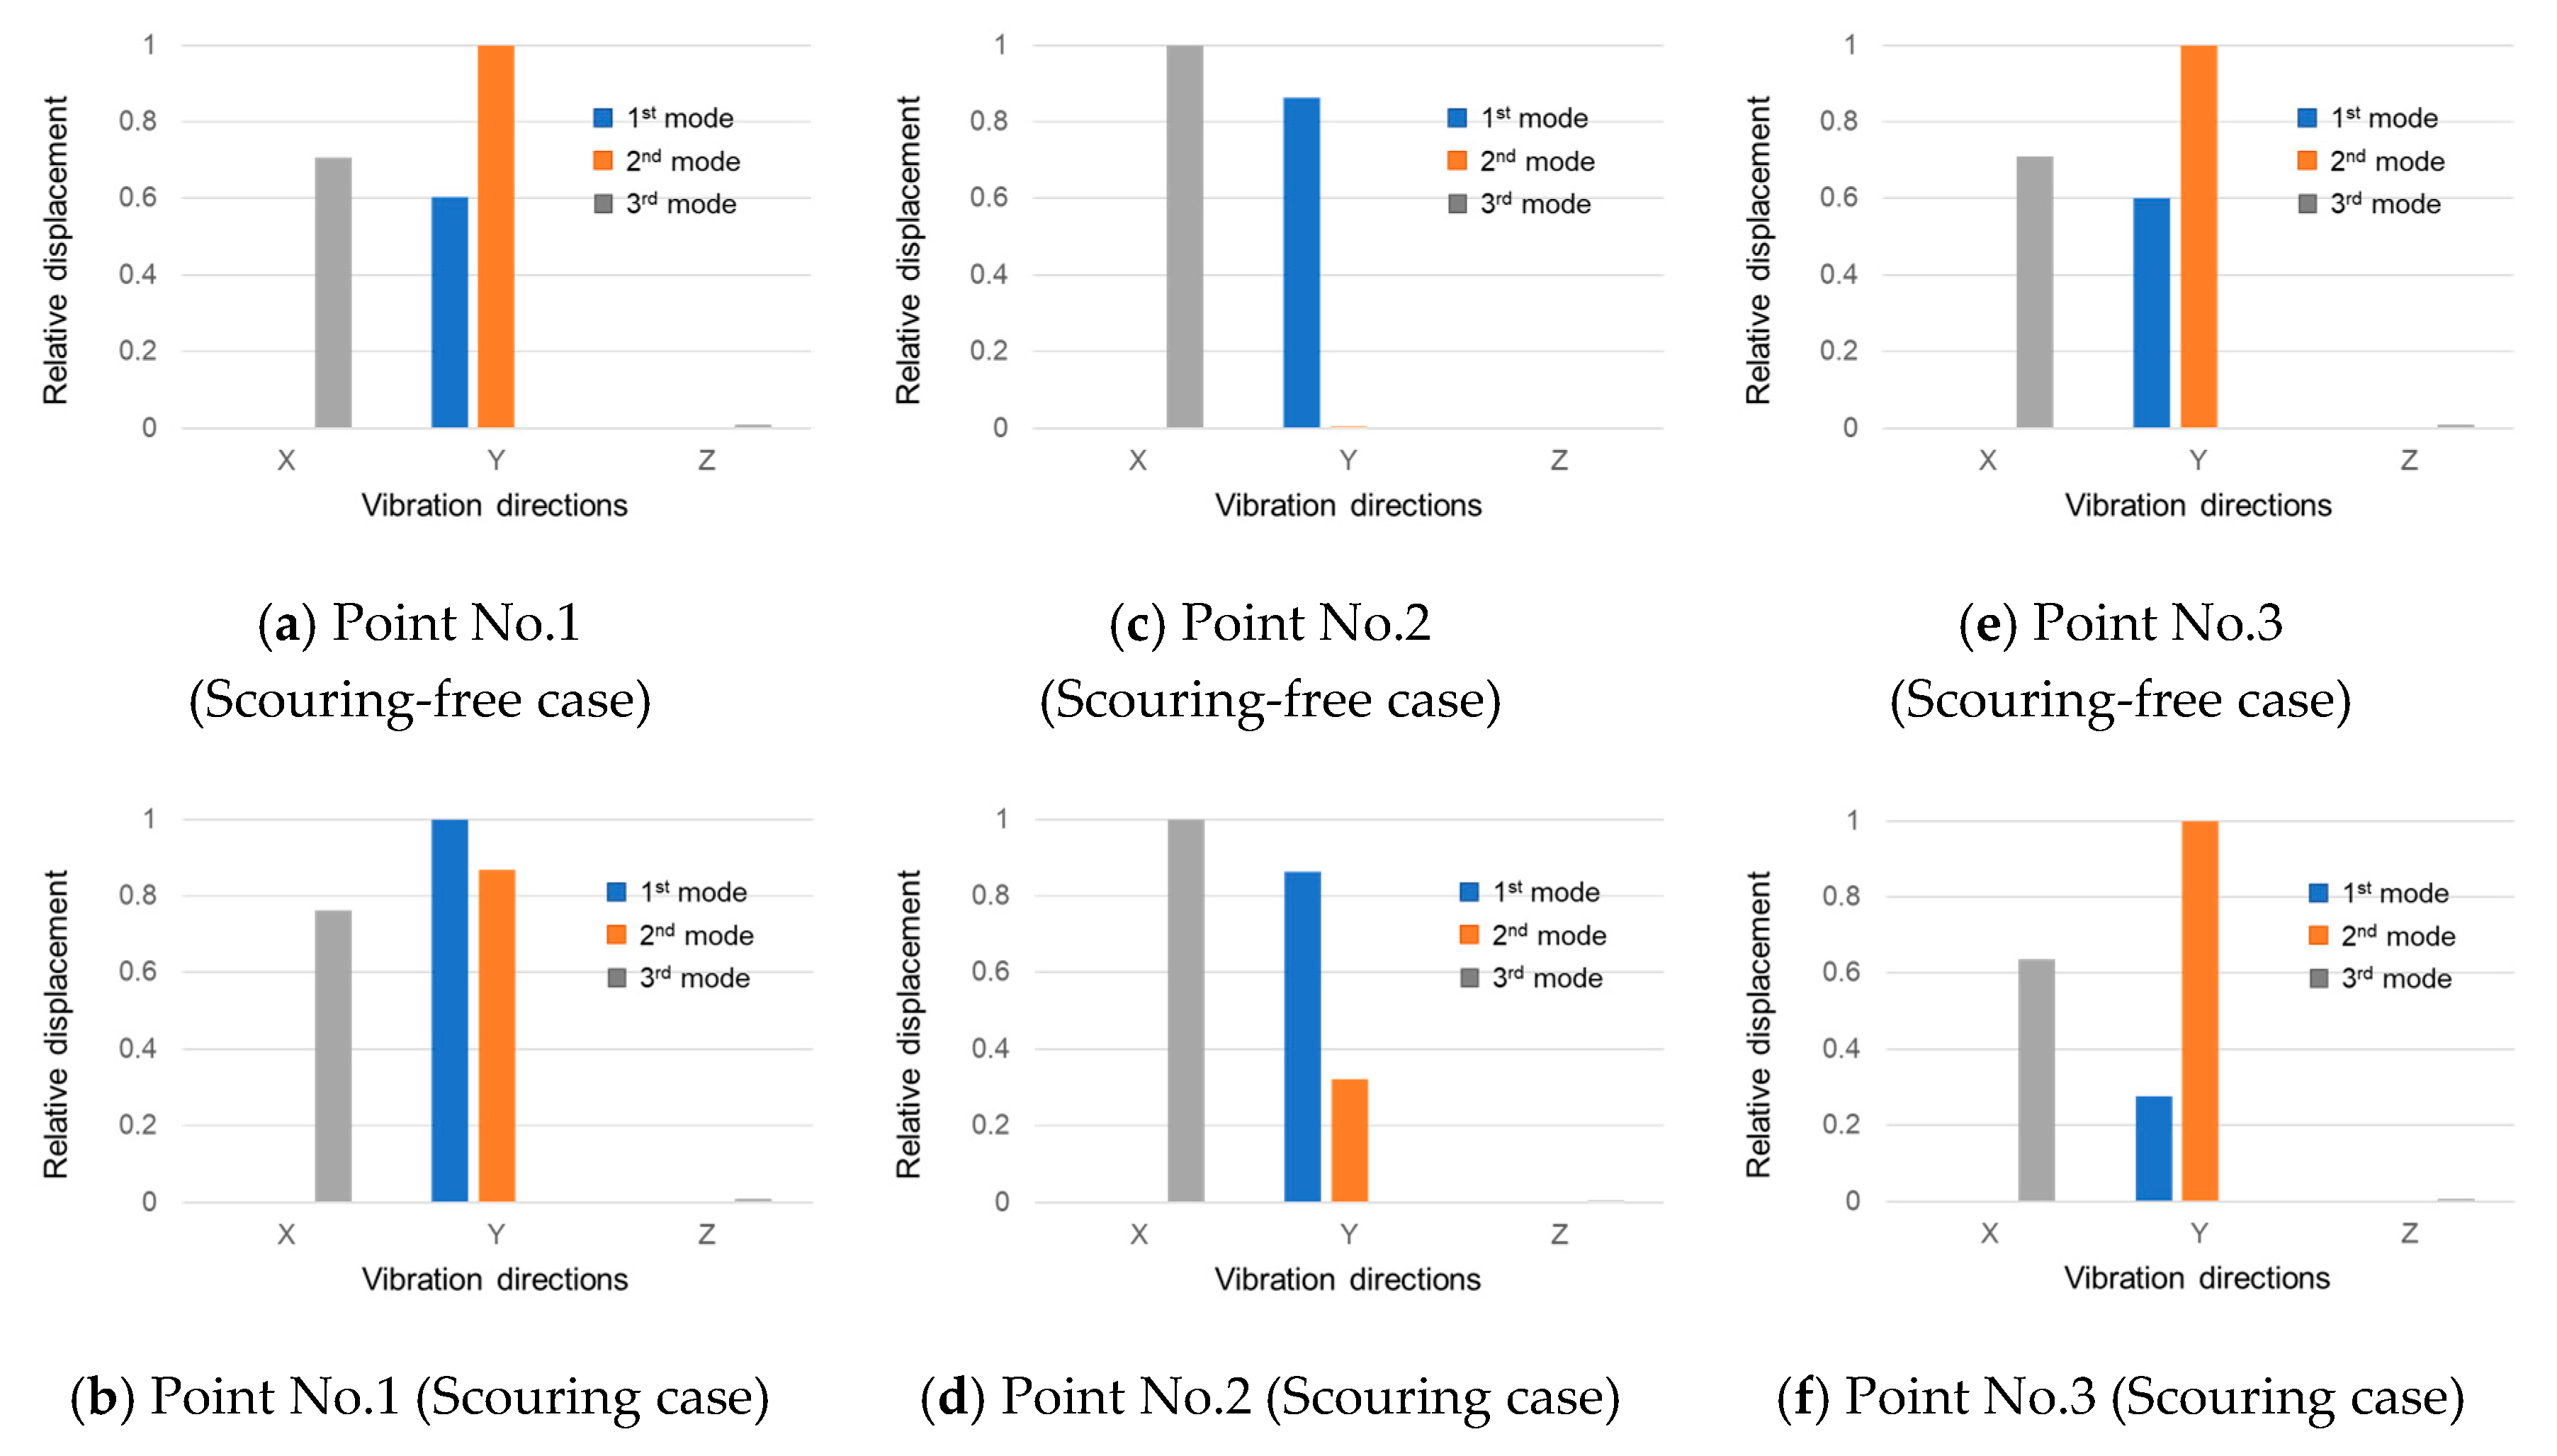
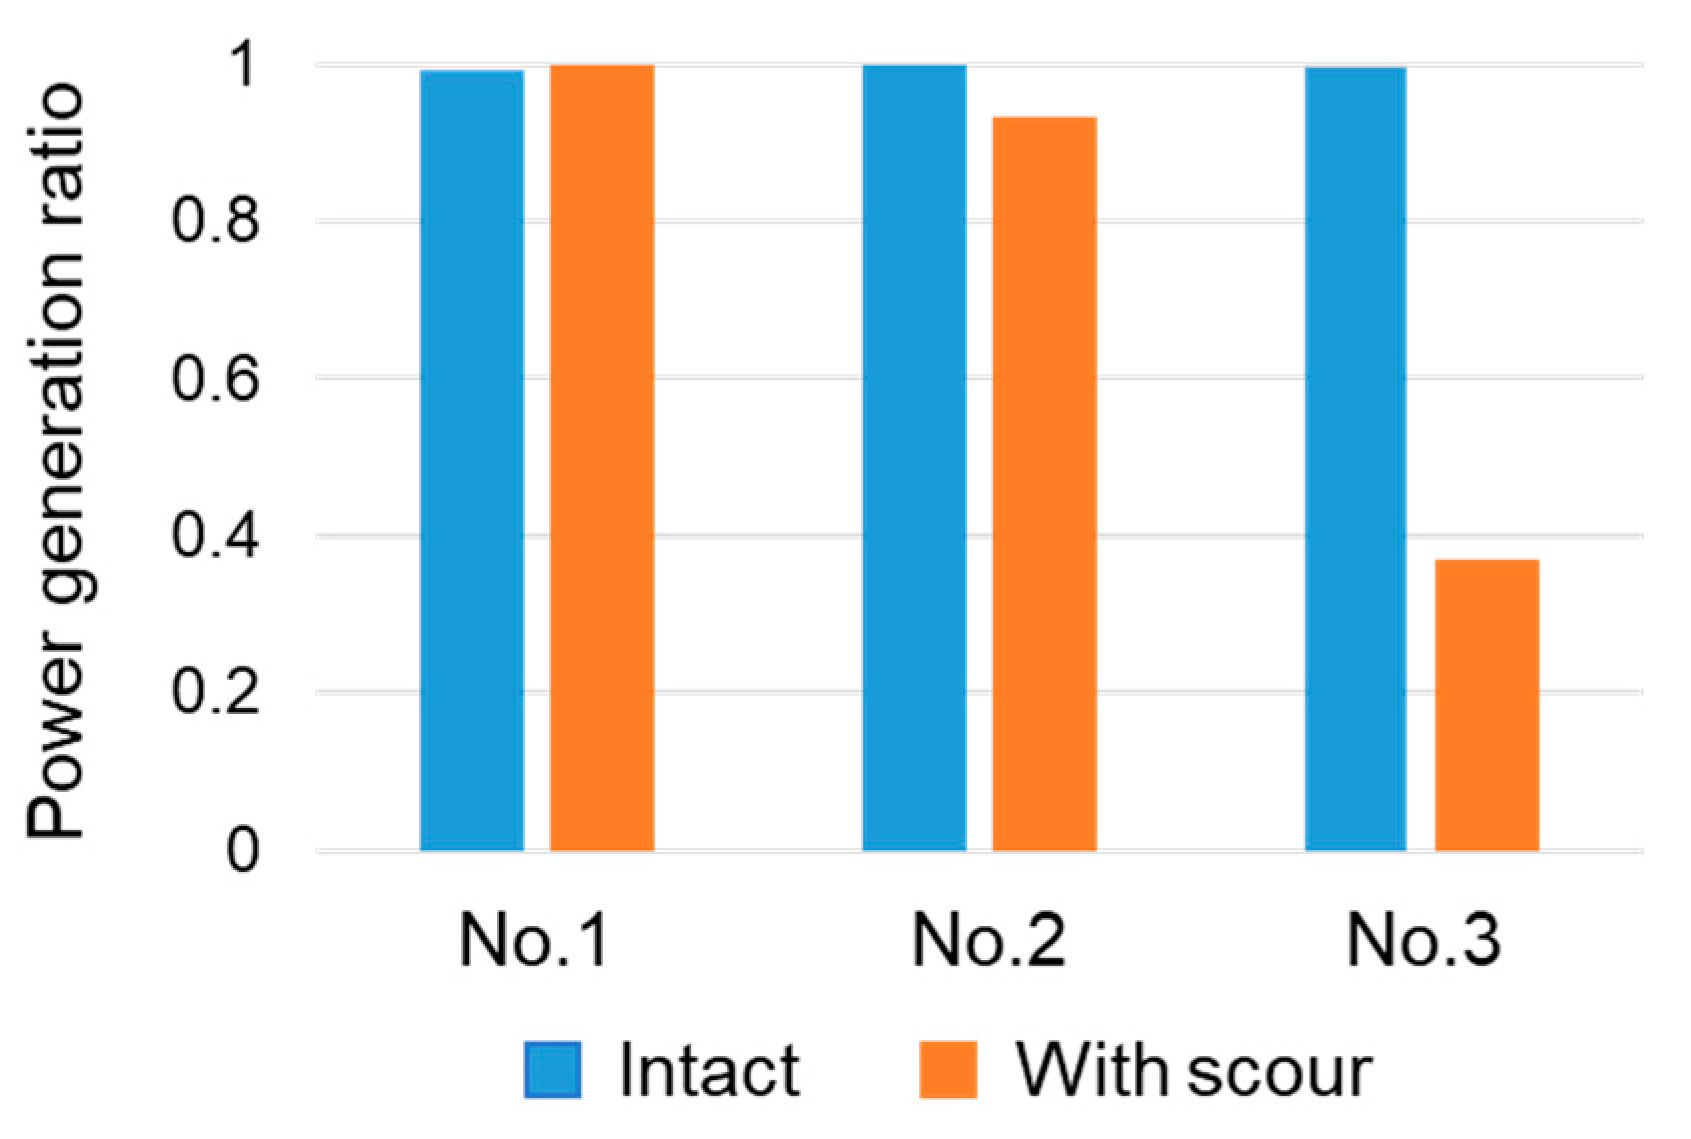
3.5. Detecting Pier Scour by Vibration-Based MEH
4. Conclusions
Author Contributions
Funding
Conflicts of Interest
References
- Ministry of Land, Infrastructure, Transport and Tourism, Japan, Road Bureau. Roads in Japan. 2018. Available online: http://210.248.150.32/road/road_e/pdf/ROAD2018web.pdf (accessed on 14 October 2020).
- Wang, H.; Hung, J.-J. Case study on foundation aberration of a river-crossing bridge in Taiwan. Jpn. Geotech. Soc. Spéc. Publ. 2016, 2, 1469–1473. [Google Scholar] [CrossRef]
- Barbetta, S.; Camici, S.; Moramarco, T. A reappraisal of bridge piers scour vulnerability: A case study in the Upper Tiber River basin (central Italy). J. Flood Risk Manag. 2015, 10, 283–300. [Google Scholar] [CrossRef]
- Zhang, J.; Peng, H.; Cai, C. Field Study of Overload Behavior of an Existing Reinforced Concrete Bridge under Simulated Vehicle Loads. J. Bridg. Eng. 2011, 16, 226–237. [Google Scholar] [CrossRef]
- Fujiyama, C.; Maekawa, K. A Computational Simulation for the Damage Mechanism of Steel-Concrete Composite Slabs under High Cycle Fatigue Loads. J. Adv. Concr. Technol. 2011, 9, 193–204. [Google Scholar] [CrossRef]
- Fathalla, E.; Tanaka, Y.; Maekawa, K. Effect of Crack Orientation on Fatigue Life of Reinforced Concrete Bridge Decks. Appl. Sci. 2019, 9, 1644. [Google Scholar] [CrossRef]
- Toutlemonde, F.; Ranc, G. Fatigue tests of cracked reinforced concrete slabs for estimating the service life of composite bridge decks. Rev. Française Génie Civ. 2001, 5, 483–494. [Google Scholar] [CrossRef]
- Chiew, Y.-M. Local Scour and Riprap Stability at Bridge Piers in a Degrading Channel. J. Hydraul. Eng. 2004, 130, 218–226. [Google Scholar] [CrossRef]
- Xiong, W.; Cai, C.; Kong, B.; Zhang, X.; Tang, P. Bridge Scour Identification and Field Application Based on Ambient Vibration Measurements of Superstructures. J. Mar. Sci. Eng. 2019, 7, 121. [Google Scholar] [CrossRef]
- Akbari, R.; Maadani, S.; Abedi, A.; Maalek, S. The effects of scour depth and riverbed condition on the natural frequencies of integral abutment bridges. Struct. Monit. Maint. 2019, 6, 85–101. [Google Scholar]
- Boujia, N.; Schmidt, F.; Chevalier, C.; Siegert, D.; Van Bang, D.P. Effect of Scour on the Natural Frequency Responses of Bridge Piers: Development of a Scour Depth Sensor. Infrastructures 2019, 4, 21. [Google Scholar] [CrossRef]
- Farahani, R.V.; Penumadu, D. Damage identification of a full-scale five-girder bridge using time-series analysis of vibration data. Eng. Struct. 2016, 115, 129–139. [Google Scholar] [CrossRef]
- Fisher, M.; Atamturktur, S.; Khan, A. A novel vibration-based monitoring technique for bridge pier and abutment scour. Struct. Health Monit. 2013, 12, 114–125. [Google Scholar] [CrossRef]
- Lin, Y.; Lai, J.-S.; Chang, K.; Chang, W.; Lee, F.; Tan, Y.-C. Using mems sensors in the bridge scour monitoring system. J. Chin. Inst. Eng. 2010, 33, 25–35. [Google Scholar] [CrossRef]
- Keyaki, T.; Suzuki, O.; Uemura, S. 2B13 Development of a new scour detector that enables monitoring of pier soundness (Condition Monitoring-Vehicle). In Proceedings of the International Symposium on Seed-up and Service Technology for Railway and Maglev Systems: STECH, Chiba, Japan, 10–13 November 2015; Volume 2015, pp. 2B13-1–2B13-9. [Google Scholar]
- Bryzek, J. Emergence of Trillion Sensors Movement. IEEE MEMS. 2014. Available online: https://site.ieee.org/scv-mems/files/2014/01/TSensors-1-22-14_final.pdf (accessed on 15 October 2020).
- Kaminaga, M. Trillion Sensors and MEMS. Sens. Mater. 2018, 30, 723–731. [Google Scholar]
- Roundy, S.; Wright, P.K.; Rabaey, J.M. Energy Scavenging for Wireless Sensor Networks with Special Focus on Vibrations; Springer: Norwell, MA, USA, 2004. [Google Scholar]
- Saha, C.; O’Donnell, T.; Loder, H.; Beeby, S.; Tudor, J. Optimization of an Electromagnetic Energy Harvesting Device. IEEE Trans. Magn. 2006, 42, 3509–3511. [Google Scholar] [CrossRef]
- Suzuki, Y. Recent progress in MEMS electret generator for energy harvesting. IEEJ Trans. Electr. Electron. Eng. 2011, 6, 101–111. [Google Scholar] [CrossRef]
- Glynne-Jones, P.; Beeby, S.; White, N. Towards a piezoelectric vibration-powered microgenerator. IEE Proc. Sci. Meas. Technol. 2001, 148, 68. [Google Scholar] [CrossRef]
- Koga, H.; Mitsuya, H.; Honma, H.; Fujita, H.; Toshiyoshi, H.; Hashiguchi, G. Development of a Cantilever-Type Electrostic Energy Harvester and its Charging Characteristics on a Highway Viaduct. Micromachines 2017, 8, 293. [Google Scholar] [CrossRef] [PubMed]


| n: number of comb electrode | 500 |
| ε0 [F/m]: permittivity of vacuum | 2.13 × 10⁻¹⁵ |
| b [m]: thickness of comb electrode | 3.00 × 10⁻⁴ |
| E [V]: charged voltage | 400 |
| d [m]: gap between the fixed and the movable comb electrodes | 1.60 × 10⁻⁴ |
| Materials | Young’s Modulus [GPa] | Poisson’s Ratio | Density [kg/m3] |
|---|---|---|---|
| Intact concrete (Panel) | 30 | 0.2 | 2450 |
| Steel (I shape girder) | 210 | 0.3 | 7850 |
| Deteriorated concrete (Panel) | 7.5 | 0.2 | 2450 |
| Vibration Mode | Case 0 (Intact) | Case 1 | Case 2 | Case 3 |
|---|---|---|---|---|
| Mode 1: 1st bending | 5.98 | 5.79 | 5.49 | 5.25 |
| Mode 2: 1st torsion | 11.46 | 10.44 | 10.67 | 10.83 |
| Mode 3: 2nd bending | 19.90 | 14.94 | 16.82 | 17.80 |
| Vibration Mode | Scouring Free | Scouring |
|---|---|---|
| 1st | 4.59 | 3.05 |
| 2nd | 8.40 | 6.62 |
| 3rd | 9.90 | 7.14 |
| Panel #1 | Panel #2 | Panel #3 | Panel #4 | Panel #5 | Panel #6 | |
|---|---|---|---|---|---|---|
| Power Generation Index Pi | 1.19 | 0.69 | 1.40 | 1.40 | 0.69 | 1.19 |
| Case1 (generated power) | 0.99 | 1.03 | 0.01 | 0.27 | 0.33 | 0.16 |
| Case 1∗PI (modified) | 1.18 | 0.71 | 0.01 | 0.38 | 0.22 | 0.19 |
| Case2 (generated power) | 0.51 | 1.33 | 0.22 | 0.54 | 0.79 | 0.41 |
| Case 2∗PI (modified) | 0.61 | 0.92 | 0.31 | 0.76 | 0.54 | 0.48 |
| Case3 (generated power) | 0.45 | 0.95 | 0.73 | 0.61 | 0.92 | 0.49 |
| Case 3∗PI (modified) | 0.54 | 0.65 | 1.02 | 0.86 | 0.63 | 0.58 |
Publisher’s Note: MDPI stays neutral with regard to jurisdictional claims in published maps and institutional affiliations. |
© 2020 by the authors. Licensee MDPI, Basel, Switzerland. This article is an open access article distributed under the terms and conditions of the Creative Commons Attribution (CC BY) license (http://creativecommons.org/licenses/by/4.0/).
Share and Cite
Hashimoto, K.; Shiotani, T.; Mitsuya, H.; Chang, K.-C. MEMS Vibrational Power Generator for Bridge Slab and Pier Health Monitoring. Appl. Sci. 2020, 10, 8258. https://doi.org/10.3390/app10228258
Hashimoto K, Shiotani T, Mitsuya H, Chang K-C. MEMS Vibrational Power Generator for Bridge Slab and Pier Health Monitoring. Applied Sciences. 2020; 10(22):8258. https://doi.org/10.3390/app10228258
Chicago/Turabian StyleHashimoto, Katsufumi, Tomoki Shiotani, Hiroyuki Mitsuya, and Kai-Chun Chang. 2020. "MEMS Vibrational Power Generator for Bridge Slab and Pier Health Monitoring" Applied Sciences 10, no. 22: 8258. https://doi.org/10.3390/app10228258
APA StyleHashimoto, K., Shiotani, T., Mitsuya, H., & Chang, K.-C. (2020). MEMS Vibrational Power Generator for Bridge Slab and Pier Health Monitoring. Applied Sciences, 10(22), 8258. https://doi.org/10.3390/app10228258