Abstract
Effective and accurate diagnosis of engine health is key to ensuring the safe operation of engines. Inlet distortion is due to the flow or the pressure variations. In the paper, an acoustic emission (AE) online monitoring technique, which has a faster response time compared with the ordinary vibration monitoring technique, is used to study the inlet distortion of an engine. The results show that with the deterioration of the inlet distortion, the characteristic parameters of AE signals clearly evolve in three stages. Stage I: when the inlet distortion J ≤ 30%, the characteristic parameters of the AE signal increase as J increases and the amplitude saturates at J = 23%, faster than the other three parameters (the strength, the root mean square (RMS), and the average signal level (ASL)). Stage II: when the inlet distortion 30% < J ≤ 43.64%, all the parameters saturate with only slight fluctuations as J increases and the engine works in an unstable statue. Stage III: when the inlet distortion J > 43.64%, the engine is prone to surge. Furthermore, an intelligent recognition method of the engine inlet distortion based on a unit parameter entropy and the back propagation (BP) neural network is constructed. The recognition accuracy is as high as 97.5%, and this method provides a new approach for engine health management.
1. Introduction
An engine typically encounters extreme environments which will result in the inlet distortion of the engine [1]. The inlet distortion, which caused the high-cycle fatigue of turbomachinery components, is the main reason for the disfunction of the engine’s components. When a mild inlet distortion occurs, the vibration of the compressor becomes abnormal, reducing the efficiency of flight propulsion. Whereas when a severe inlet distortion occurs, there will be unrecoverable damage to the engine [2,3]. This can even surge the compressor, leading to a shutdown of the engine, affecting the safety of the engine. Therefore, it is important to research the inlet distortion of the engine.
From the mid-20th century, a great number of studies have been conducted on the inlet distortion of the engine throughout the world. Reid [4] discovered that during the approaching of the designed speed of the compressor, the loss of surge pressure ratio, due to inlet flow mal distribution, was mainly dependent on the circumferential variation of inlet total pressure. James [5] measured the blade response to an inlet total pressure distortion in an integral blade disk. The variations of measured stress were found to be significantly affected by unsteady aerodynamic coupling. Zachos [6] demonstrated the feasibility of using the stereo particle image velocimetry techniques for determining the flow field at the exit of convoluted intakes with a spatial resolution higher than the typical pressure measurements. Hu and Zhao [7] developed a computational approach to assess the effect of the inlet distortion on the stability of a large bypass ratio turbofan engine. However, all the above researches were carried out based on some fundamental analysis. The accuracy of the experimental models and the results need further verification.
The traditional nondestructive monitoring methods of engine mainly include the vibration monitoring technique, the electrostatic monitoring technique, and the oil monitoring technique [8,9,10,11]. Although these monitoring methods can meet the requirements of health monitoring to a certain extent, some serious limitations still exist. For instance, the vibration monitoring technique is limited to the structure of the engine. The optimal sensor placement in different systems is a great challenge. Furthermore, the signal picked up by the vibration sensor reflects the overall engine’s vibration but not specific components’ vibration. Therefore, it is difficult to locate the fault [12]. Furthermore, the electrostatic monitoring technique is only sensitive in monitoring gas path faults, while the oil monitoring technique has a delay for the identification of the early faults, which can easily miss the appropriate time of diagnosing [13].
The acoustic emission (AE) monitoring technique is a widely used nondestructive monitoring method that can identify and locate various types of faults [14,15], reducing the daily maintenance workload of engines, improving the engine’s efficiency. It shows an excellent performance in comparison with other traditional methods. In the field of aviation, some studies undertook the AE monitoring technique on the fatigue components of an engine, such as the main body, the horizontal tail, the landing gear, and the turbine blades [16,17,18,19,20]. However, the application of the AE technique on the inlet distortion of the engine remains blank. This paper applies the AE technique to explore the inlet distortion of the engine, and the study proves that the AE technique is an effective method in monitoring the status of the engine. It can precisely identify the inlet distortion of the engine through an intelligent method based on a unit parameter entropy and the BP neural network.
2. Theory of the Entropy and BP Neural Network
The entropy is a state parameter that reflects the uncertainty of the evaluated system. It has been widely used to evaluate the uncertainty of the information carried by the system since Shannon proposed the concept of information entropy [21]:
where is the probability for each subsystem and b = 2. The more unified the distribution of is, the greater the value of the entropy and the higher the uncertainty of the system are. Analogous to the information entropy, this paper introduces a unit parameter entropy to evaluate the distribution of the AE parameters in a certain status of the engine. Its definition and calculation formula are shown below.
2.1. Unit Parameter Entropy
Assuming that there are data volumes of a certain parameter, these data are normalized and arranged in ascending order of with the range of . The data are then divided into m intervals, each containing n data, .
The ratio of the length of each interval to the total length of the interval is:
where is the number of intervals.
The parameter entropy over these intervals is defined as:
Equation (4) mainly reflects the distribution of parameters in an interval. However, the length of the parameter interval was not taken into consideration. To eliminate this effect, it is needed to define the unit parameter entropy as Equation (4) divided by the length of the parameter interval.
Equation (5) mainly reflects the distribution of parameters in a unit interval, and the greater the unit parameter entropy value is, the more uniform the distribution of the value of this parameter along with the unit interval is. This indicates that this kind of parameter is more accurate to identify the health status of the engine. Therefore, Equation (5) can be used to evaluate the ability of each AE parameter to identify the inlet distortion of the engine.
2.2. BP Neural Network
The BP neural network is a multilayer feed-forward intelligent processing algorithm that is designed by mimicking the operational relationship between the human brain neurons. It conducts rigorous training through multi-level neurons and stops when the data converged, within the acceptable error range. Otherwise, this algorithm will keep altering its weights and thresholds until it meets the requirements [22,23,24].
As shown in Figure 1, the BP neural network consists of one input layer, one output layer, and hidden layers, and there is a data set of input corresponding to a data set of output .
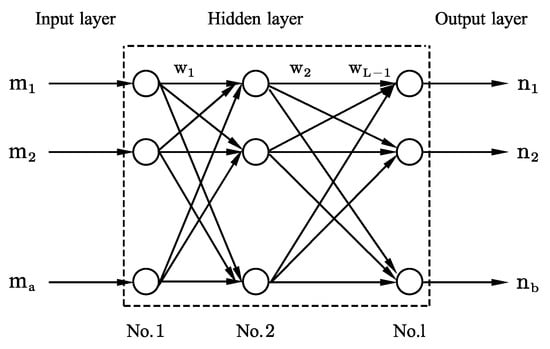
Figure 1.
A schematic of the BP neural network.
Suppose the x inputs correspond to the y outputs, and the output of the α neurons on the layer is
where is the algorithm of the neuron and is the connection weight between the neuron of layer and the neuron of layer . is the output of the neurons in the layer .
The square error function is used to assess whether the network error exceeds the allowable error.
where and are the calculate output and the actual output of the neurons in the y data. If is less than the preset error amount, the learning process of the BP neural network is completed.
3. Experiments
3.1. Inlet Distortion Experiment
In this study, an engine was used to simulate the disfunction of inlet distortion, and the AE monitoring technique was employed to identify the impact of inlet distortion on the stability of the engine. Figure 2 shows a schematic representation of the experiment. With the arrangement of two mobile spoilers in front of the engine to block the inlet through its horizontal motion, a large number of turbulent flows were generated to simulate the process of inlet distortion. The AE sensors were located on the engine casing to collect the AE signals generated by the faults. By applying the AE monitoring technique, it would be feasible to continuously monitor and identify the simulated faults.
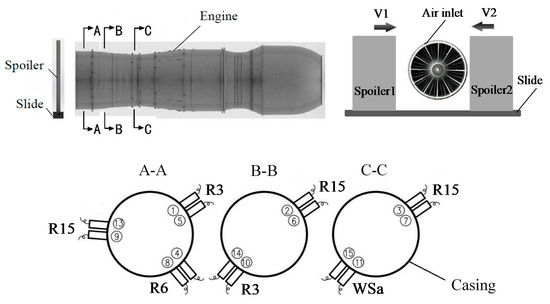
Figure 2.
Schematically representation of testing the inlet distortion.
Four types of sensors, R3, R6, R15, and WSa, are selected in this paper. Their characteristic parameters are shown in Table 1. Each measurement point was equipped with 2 sensors, and a total of 14 sensors were arranged on the casing. During this experiment, the sample rate was 1 MHz, and the hit length was 2 KHz. Threshold for AE detection is 38 dB for R1, R2, R3, R4, R9, R10, and R11and 38 dB for R5, R6, R7, R8, R13, and R14. Accordingly, with setting the relevant parameters of the AE monitoring technique appropriately, efficient identification of the inlet distortion is applicable.

Table 1.
Characteristic parameters of sensors.
Figure 3 shows the flowchart of an experiment performed to study inlet distortion of the engine.
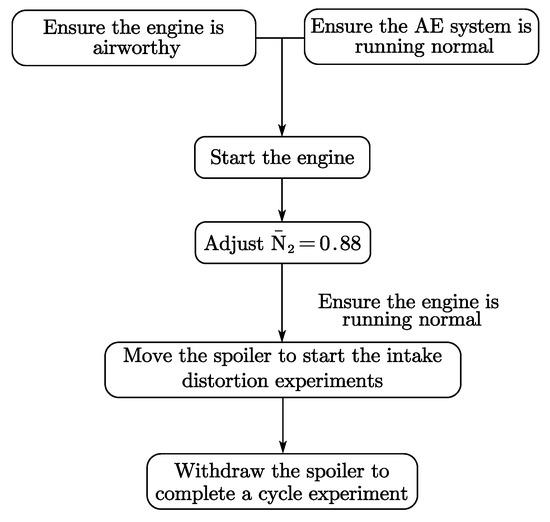
Figure 3.
The flowchart of an experiment conducted to study inlet distortion based on the acoustic emission (AE) technique.
In Figure 3, is the actual speed of the engine divided by 10,000. The engine would be started until all the technical indicators of engine satisfy the requirements of airworthiness [25,26] and the AE technique was normally running. Then, the speed of the engine was controlled at 8976 rpm after warming up the engine. Next, the Spoiler1 was moved to start the inlet distortion experiments at a speed of V1 = 40 mm/s, and the Spoiler2 remained stationary. According to the parallel compressor model, the inlet distortion is defined as:
where and are the areas where the inlet was blocked by Spoiler1 and Spoiler2, respectively, and is the total area of the inlet, as shown in Figure 4.
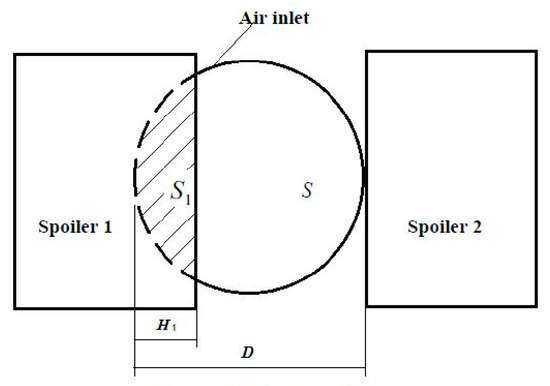
Figure 4.
Inlet distortion diagram.
Hence:
where is the moving distance of the Spoiler1, is the diameter of the engine inlet, and is an independent variable.
Entering Equations (9)–(11) into Equation (8) yields Equation (12):
where is one of the important parameters to characterize the degree of the inlet distortion [27]. Eventually, when reaches 45%, i.e., reaches 43.64%, the spoiler1 will stop moving. Then, the spoiler1 will be withdrawn, and the engine will stop operating to stop the experiment.
3.2. Monitoring Technique
The AE monitoring technique consists of four parts: the sensors, the pre-amplifiers, the data acquisition device, and the data analysis system. Figure 5 shows the principle of the AE monitoring technique [28,29]. The elastic waves emitted from the AE sources eventually transmitted from inside to the surface of the material, causing surface displacements that can be detected with AE sensors. The elastic waves are translated into electrical signals through the AE sensors. Then, they are acquired by the data acquisition device after being processed by the pre-amplifiers. Finally, the signal is analyzed by the data analysis system [30,31,32,33,34].
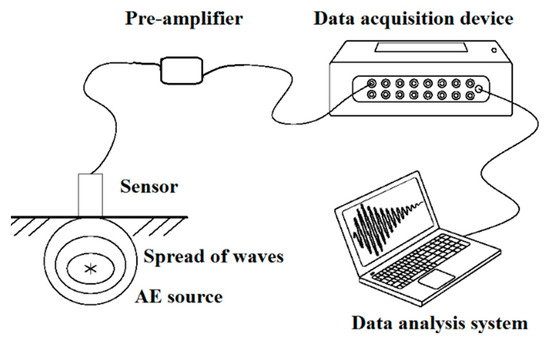
Figure 5.
Principle of the AE technique.
4. Results and Discussion
4.1. Parametric Analysis
The parametric analysis method, currently the most commonly used method for analysis of the AE signals, utilizes the characteristics of multiple simplified waveforms to characterize the AE signals. This method has proved that many engineering problems can be solved effectively after decades of research [35]. Based on this method, it is clear to identify the health status of the engine through the AE parameters, such as the amplitude, the signal strength, the RMS, and the average signal level (ASL).
Table 2 lists the variations of the amplitude, the signal strength, the RMS, and the ASL as varies from 0 to 43.64%. As we can see, the parameters of the AE signal increased with the uniform increase of distortion range in real-time.

Table 2.
Variations dependency of the parameters of the AE method on .
For a more intuitive description of the relationship between the AE parameters and the , the line chart of the amplitude, the signal strength, the RMS, and the ASL relative to the change of are plotted in Figure 6. The variations of the AE parameters can be divided into three stages of I, II, and III. In stage I, the AE parameters initially did not show a clear upward trend until reached 10%. With the increase of , the parameters increased rapidly and reached the maximum value when was about 30%. There is an exponential relationship between the AE parameters and . In stage II, the AE parameters did not increase with the increase of , while a slight fluctuation phenomenon occurred. In stage III, as continuously increased above 43.64%, the engine tended to surge, which should be strictly avoided.
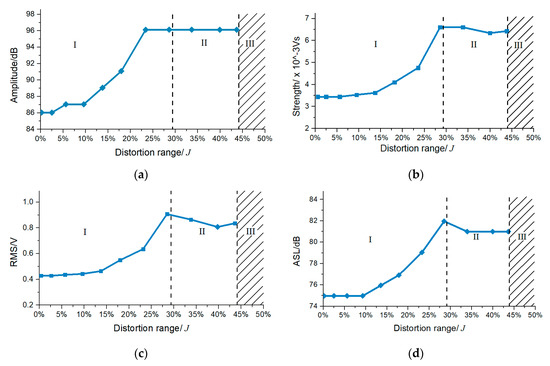
Figure 6.
Variation of parameters of AE with : (a) amplitude-; (b) signal strength-; (c) RMS-; and (d) average signal level (ASL)-.
In the same experiment, the vibration monitoring technique was tested to study the inlet distortion of the engine as well. Figure 7 shows the relationship between the parameters of the vibration monitoring technique (taking the valid values as an example) and . When reached 14%, the parameter of vibration monitoring technique begins to show a clear upward trend, lagging behind the response of the AE monitoring technique, demonstrating that the AE technique is more sensitive to the identification of inlet distortion.
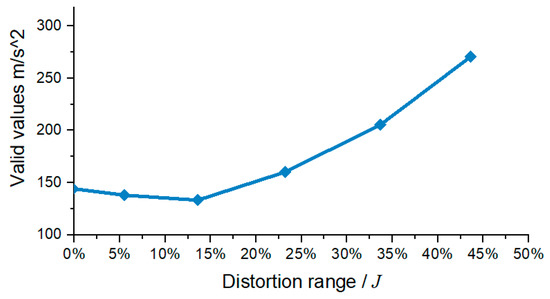
Figure 7.
Variation of the parameter of vibration monitoring technique change with .
To avoid serious inlet distortion, the engine was strictly forbidden to operate in stages II and III. Therefore, it is of significance to identify the as soon as possible before entering stage II and III. Additionally, the AE monitoring technique is more sensitive to identify the inlet distortion of the engine in comparison with the vibration monitoring technique.
4.2. Analysis of Time and Frequency Domain
To figure out the effect of inlet distortion of the engine in essence clearly, it is necessary to analyze the signal in the time and frequency domain. Figure 8a shows the AE signal measured during the normal status of the engine (), and the corresponding frequency-domain waveform is shown in Figure 8b. Figure 9a shows the typical AE signal measured during the inlet distorted status of the engine (), and the corresponding frequency-domain waveform is shown in Figure 9b.

Figure 8.
Time-domain and frequency-domain waveform of the normal status of the engine.

Figure 9.
Time-domain and frequency-domain waveform of the inlet distorted status of the engine.
By comparing the time-domain waveform between the normal and distorted signals, it can be seen that the signals are both continuous-type signals and the amplitude of the distorted signal exceeds largely over the normal signal. By comparing the frequency-domain waveform between the normal and distorted signals, it can be seen that the energy lies mainly in the frequency band in the range of 50–250 kHz, and the most obvious frequency component is 150 kHz, followed by 100 kHz. Meanwhile, the proportion of the 100 kHz frequency component in the distorted signal is significantly higher than that in the normal signal. From the time-domain waveform and frequency-domain waveform, it can be seen comprehensively that there are certain differences between the normal signal and the distorted signal. However, there are also some overlaps in the main frequency, which will affect the signal identification.
4.3. Intelligent Analysis Based on a Unit Parameter Entropy and the BP Neural Network
The measured signal requires further analysis to accurately identify the health state of the engine. The BP neural network is an intelligent method with a function of multi-layer feed-forward, identifying the signal through its logic operations. It is very important for the BP neural network to ensure the effectiveness of the input parameters.
Based on the characteristics of the AE signals, 12 kinds of AE parameters were selected initially in this paper, including the amplitude, the RMS, the signal strength, the initial frequency, and the eight frequency bands’ energy after the signal was decomposed by the three-layer wavelet packet. Based on Equation (6), the unit parameter entropy of the 12 AE parameters was calculated, with the results shown in Table 2.
From Table 3, it can be seen that the value of the unit parameter entropy of the initial frequency, Energy 1, Energy 3, Energy 5, Energy 7, and Energy 8 are smaller than the rest of the parameters. This indicates that the parameters with a smaller value are unevenly distributed over the length of the unit interval with large fluctuations, which are not suitable for input into the BP neural network. The value of the unit parameter entropy of the remaining parameters is larger, indicating that the parameter distribution is more uniform in the unit interval. Therefore, the amplitude, the RMS, the signal strength, Energy 2, Energy 4, and Energy 6 are selected as the input parameters and imported into the BP neural network for intelligent analysis.

Table 3.
Unit parameter entropy of 12 AE parameters.
Sixty sets of input parameters were selected for the normal state of the engine and the inlet distortion state of the engineer, respectively. Forty sets of data were randomly selected as training samples to be imported into the BP neural network. The remaining 20 sets of data were used as test samples to test the training effect of the BP neural network. To verify the validity of the unit parameter entropy, the excluded parameters and the selected parameters were imported into the BP neural network, respectively, for comparative analysis. The results are shown in Table 4 and Table 5.

Table 4.
The identification result for parameters excluded via unit parameter entropy.

Table 5.
The identification result for parameters selected via unit parameter entropy.
From Table 4 and Table 5, it can be concluded that the total accuracy for identifying the engine’s operating status through the AE parameters that are selected by the unit parameter entropy method is up to 97.5%, which is higher than that of the AE parameters excluded by the unit parameter entropy. This result proves that the unit parameter entropy method is an effective method to evaluate the effectiveness of the AE parameters in identifying the engine’s operating status.
5. Conclusions
In this paper, the AE monitoring technique was used to monitor the inlet distortion experiment of an engine. According to the results, the following conclusions can be drawn:
- The AE parameters, such as the amplitude, the signal strength, the RMS, and the ASL could efficiently identify the degree of the inlet distortion of the engine. With the continuous deterioration of the inlet distortion, the AE parameters showed variations in three stages. In stage I, the AE parameters showed a typical exponential growth with the increase of the degree of the inlet distortion. In stage II, the variation of the AE parameters saturated with a slight fluctuation phenomenon with the increase of the degree of the inlet distortion. In stage III, as the degree of the inlet distortion increases continuously, the engine enters the surge zone.
- The AE monitoring technique is more sensitive in comparison with the vibration monitoring technique in terms of identifying the inlet distortion, representing accordingly a new approach for the health monitoring of the engine.
- This paper proposes an intelligent method based on the unit parameter entropy to evaluate the effectiveness of the parameters to identify the status of the engine. Experiments have shown that the parameters selected by this method are significantly better than the excluded parameters for the identification of the status of the engine. The result proves the effectiveness of this method and provides a theoretical basis for the establishment of an intelligent identification system of the engine.
Author Contributions
G.Y. conceived and designed the experiments; J.H. and S.Z. performed the experiments; J.H., S.Z., A.X. and C.H. analyzed the data under the supervision of G.Y.; G.Y. contributed reagents/materials/analysis tools; J.H. and S.Z. wrote the paper under the supervision of G.Y. All authors have read and agreed to the published version of the manuscript.
Funding
This work is partially supported by the National Natural Science Foundation of China (Grant No. 51575035).
Conflicts of Interest
The authors declare no conflict of interest.
References
- Du, S.F.; Lu, S. Investigation of Blade Vibration Induced by Inlet Distortion in an Aeroengine. Aeroengine 2003, 29, 30–34. [Google Scholar]
- Walsh, P.P.; Fletcher, P. Gas Turbine Performance, 2nd ed.; Blackwell Publishing: Oxford, UK, 2004; pp. 170–172. [Google Scholar]
- You, T.C.; Teng, J.; Zhen, X.G. Review of aero-engine temperature distortion research. J. Nanjing Univ. Aeronaut. Astronaut. 2017, 49, 283–300. [Google Scholar]
- Reid, C. The Response of Axial Flow Compressors to Intake Flow Distortion. In Proceedings of the ASME 1969 Gas Turbine Conference and Products Show, Cleveland, OH, USA, 9–13 March 1969. [Google Scholar]
- James, A.K.; Douglas, C.R.; Sanford, F. Aerodynamic effects on blade vibratory stress variations. J. Propuls. Power 1999, 15, 675–680. [Google Scholar]
- Zachos, P.; Macmanus, D.G.; Chiereghin, N. Flow distortion measurements in convoluted aero engine airs. AIAA J. 2016, 54, 2819–2832. [Google Scholar] [CrossRef]
- Hu, J.; Zhao, Y.; Ding, N. Investigation of Influence of Inlet Distortion on High Bypass Ratio Turbofan Engine Stability. Aeroengine 2013, 39, 6–12. [Google Scholar]
- Lakshmi, M.R.V.; Mondal, A.K.; Jadhav, C.K.; Dutta, B.V.R.; Sreedhar, S. Overview of NDT methods applied on an aero engine turbine rotor blade. Insight Non-Destr. Test. Cond. Monit. 2013, 55, 482–486. [Google Scholar] [CrossRef]
- Li, C.; Sun, J.; Guan, T.; Jiang, H.; Liu, P. Feature Extraction Method for Aero-Engine Gas Path Electrostatic Monitoring Signal. J. Ordnance Equip. Eng. 2017, 38, 112–116. [Google Scholar]
- Zhang, Y.; Li, W.; Zhu, Q. Research on Wear Status and Wear Prediction for a Type of Turbo-shaft Aviation Engine. Lubr. Eng. 2008, 33, 71–73. [Google Scholar]
- Yin, Y.; Cai, J.; Zuo, H.; Mao, H.; Fu, Y.; Yan, H. Experimental investigation on electrostatic monitoring technology for civil turbofan engine. J. Vibroengineering 2017, 19, 967–987. [Google Scholar]
- Sun, H.D.; Fu, Q. Research on Vibration Monitoring of Aero-engine. Mech. Des. Manuf. 2007, 2007, 127–129. [Google Scholar]
- Tan, C.K.; Irving, P.; Mba, D. Diagnostics and prognostics with acoustic emission, vibration and spectrometric oil analysis for spur gears—A comparative study. Insight Non-Destr. Test. Cond. Monit. 2005, 47, 478–480. [Google Scholar] [CrossRef]
- Li, X. Damage Identification Method of Offshore Platforms by Ambiguity Function Integrated Correlation Coefficient of the Acoustic Emission Signals. J. Mech. Eng. 2014, 50, 1–9. [Google Scholar] [CrossRef]
- Shen, G.T. Acoustic Emission Technology and Application; Science Press: Beijng, China, 2015. [Google Scholar]
- Cui, J.G.; Li, M.; Chen, X.C.; Lv, R.; Qiu, T.; Sui, F.C.; Xu, C.J.; Fan, J. Health monitoring of airplane key components based on acoustic emission. Chin. J. Sci. Instrum. 2008, 29, 2126–2129. [Google Scholar]
- Ser’eznov, A.N.; Stepanova, L.N.; Lebedev, E.Y.; Kabanov, S.I. Use of microprocessor acoustic emission systems during aircraft endurance testing. Russ. J. Nondestruct. Test. 2013, 49, 458–464. [Google Scholar] [CrossRef]
- Zhao, Y.; Hou, X.Y.; Guo, J.H. Experimental study on transmission characteristics of acoustic emission signal caused by hypervelocity impact on manned spacecraft with stiffened panel. ACTA Acust. 2017, 42, 281–289. [Google Scholar]
- Wang, B.Y.; Gong, R.S.; Wu, G.H. The Application of Acoustic Emission Technology in Aircraft Main Landing Gear Fatigue Test. Nondestruct. Test. 2011, 33, 22–25. [Google Scholar]
- Geng, R. Evaluation of calendar damage of aircraft main structures using modal acoustic emission. Chin. J. Mech. Eng. 2003, 39, 128–132. [Google Scholar] [CrossRef]
- Shannon, E.C. A mathematical theory of communication. Bell Syst. Tech. J. 1948, 27, 379–423. [Google Scholar] [CrossRef]
- Wang, J.J.; Shi, P.; Jiang, P.; Hu, J.W.; Qu, S.M.; Chen, X.Y.; Chen, Y.B.; Dai, Y.Q.; Xiao, Z.W. Application of BP Neural Network Algorithm in Traditional Hydrological Model for Flood Forecasting. Water 2017, 9, 48. [Google Scholar] [CrossRef]
- Jiang, G.W.; Luo, M.Z.; Bai, K.Q.; Chen, S.X. A Precise Positioning Method for a Puncture Robot Based on a PSO-Optimized BP Neural Network Algorithm. Appl. Sci. 2017, 7, 969. [Google Scholar] [CrossRef]
- Zhi, W.; Ai, Y.; Sha, Y. Research on fault diagnosis technology of whole body vibration of aero-engine based on BP neural network. Chin. J. Sci. Instrum. 2007, 28, 168–171. [Google Scholar]
- Guo, J.; Bai, K. Research on Airworthiness Management System about Military Aircraft Development. Procedia Eng. 2011, 17, 375–381. [Google Scholar]
- Jiao, J. Airworthiness Study for Military Aircraft Development. Aviat. Maint. Eng. 2011, 3, 81–83. [Google Scholar]
- Li, Z.P.; Wang, M.G. Airworthiness certification method for aeroengine on stall and surge with inlet distortion. Acta Aeronaut. Astronaut. 2015, 36, 2947–2957. [Google Scholar]
- Qi, G. Wavelet-based AE characterization of composite materials. NDT e Int. 2000, 33, 133–144. [Google Scholar] [CrossRef]
- Zhang, X.M.; He, Y.Y.; He, R.J.; Chu, F.L. Parameters optimization of continuous wavelet transform and its application in acoustic emission signal analysis of rolling bearing. Chin. J. Mech. Eng. 2007, 20, 104–108. [Google Scholar] [CrossRef]
- Barile, C.; Casavola, C.; Pappalettera, G.; Pappalettere, C.; Vimalathithan, P.K. Damage characterization in composite materials using acoustic emission signal-based and parameter-based data. Compos. Part B Eng. 2019, 178, 107469. [Google Scholar] [CrossRef]
- Aggrlis, D.G.; Barkoula, N.-M.; Matikas, A.S.; Paipetis, A.S. Acoustic structural health monitoring of composite materials: Damage identification and evaluation in cross ply laminates using acoustic emission and ultrasonics. Compos. Sci. Technol. 2012, 72, 1127–1133. [Google Scholar] [CrossRef]
- Barile, C.; Casavola, C.; Pappalettera, G.; Vimalathithan, P.K. Application of different acoustic emission descriptors in damage assessment of fiber reinforced plastics: A comprehensive review. Eng. Fract. Mech. 2020, 235, 107083. [Google Scholar] [CrossRef]
- Barile, C.; Casavola, C.; Pappalettera, G.; Vimalathithan, P.K. Acoustic emission descriptors for the mechanical behavior of selective laser melted samples: An innovative approach. Mech. Mater. 2020, 148, 103448. [Google Scholar] [CrossRef]
- Kharrat, M.; Ramasso, E.; Placet, V.; Boubakar, M.L. A signal processing approach for enhanced Acoustic Emission data analysis in high activity systems: Application to organic matrix composites. Mech. Syst. Signal Process. 2016, 70–71, 1038–1055. [Google Scholar] [CrossRef]
- Shen, G.T.; Gong, R.S.; Liu, S.F. Parameter Analysis of Acoustic Emission Signals. Nondestruct. Test. 2002, 24, 72–77. [Google Scholar]
Publisher’s Note: MDPI stays neutral with regard to jurisdictional claims in published maps and institutional affiliations. |
© 2020 by the authors. Licensee MDPI, Basel, Switzerland. This article is an open access article distributed under the terms and conditions of the Creative Commons Attribution (CC BY) license (http://creativecommons.org/licenses/by/4.0/).