Method for Characterization of a Multirotor UAV Electric Propulsion System


Abstract
1. Introduction
2. Preliminary Description of a Multirotor UAV
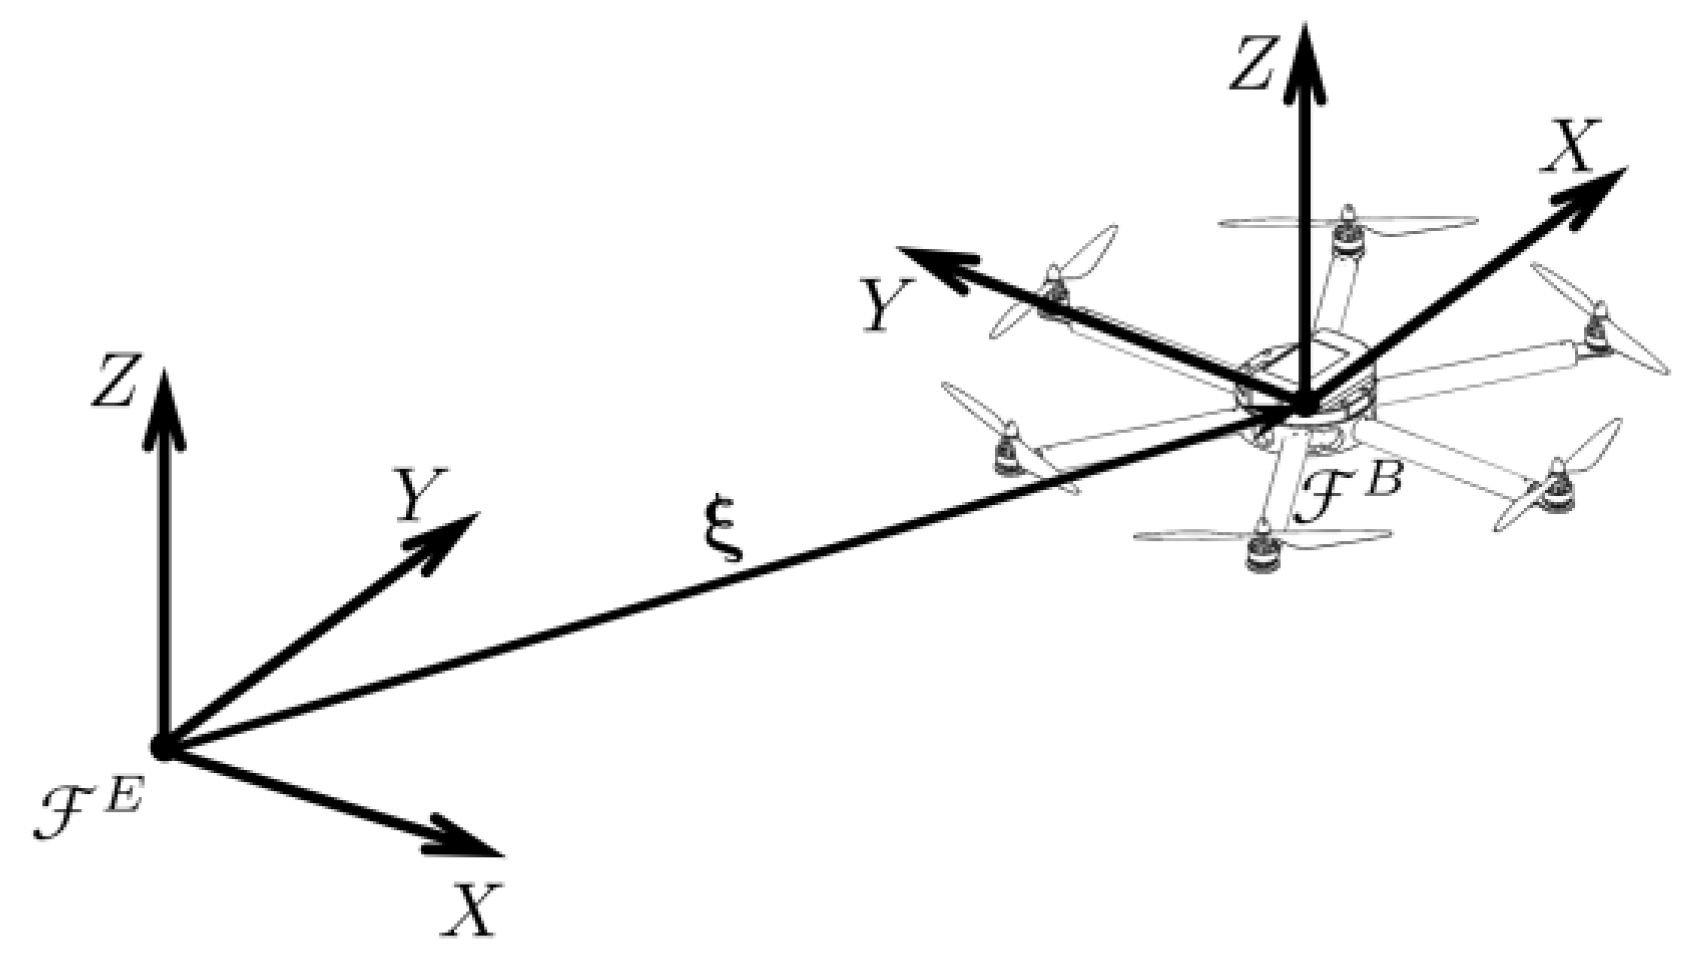
2.1. Multirotor UAV Dynamics
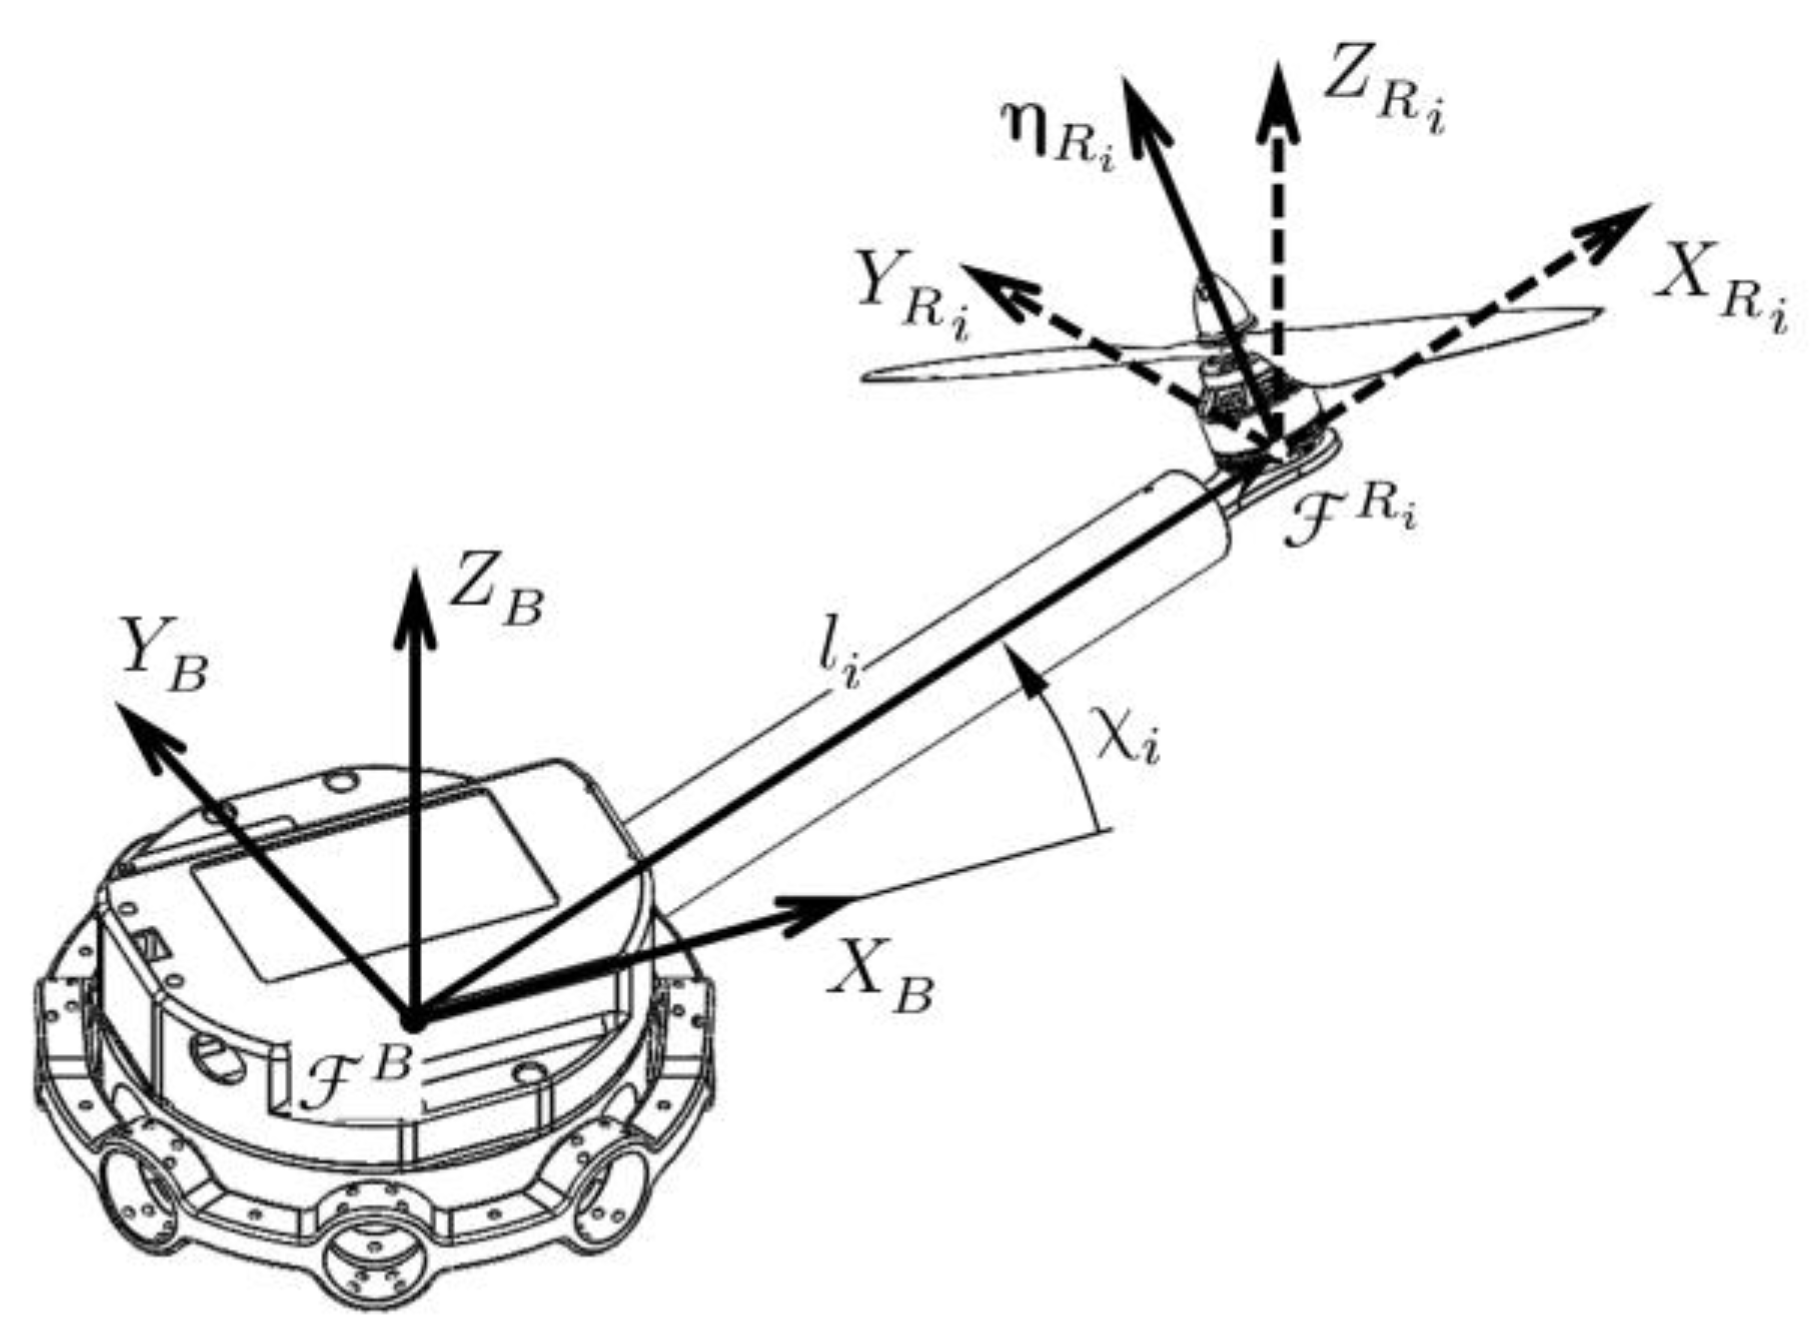
2.2. Multirotor UAV Propulsion System
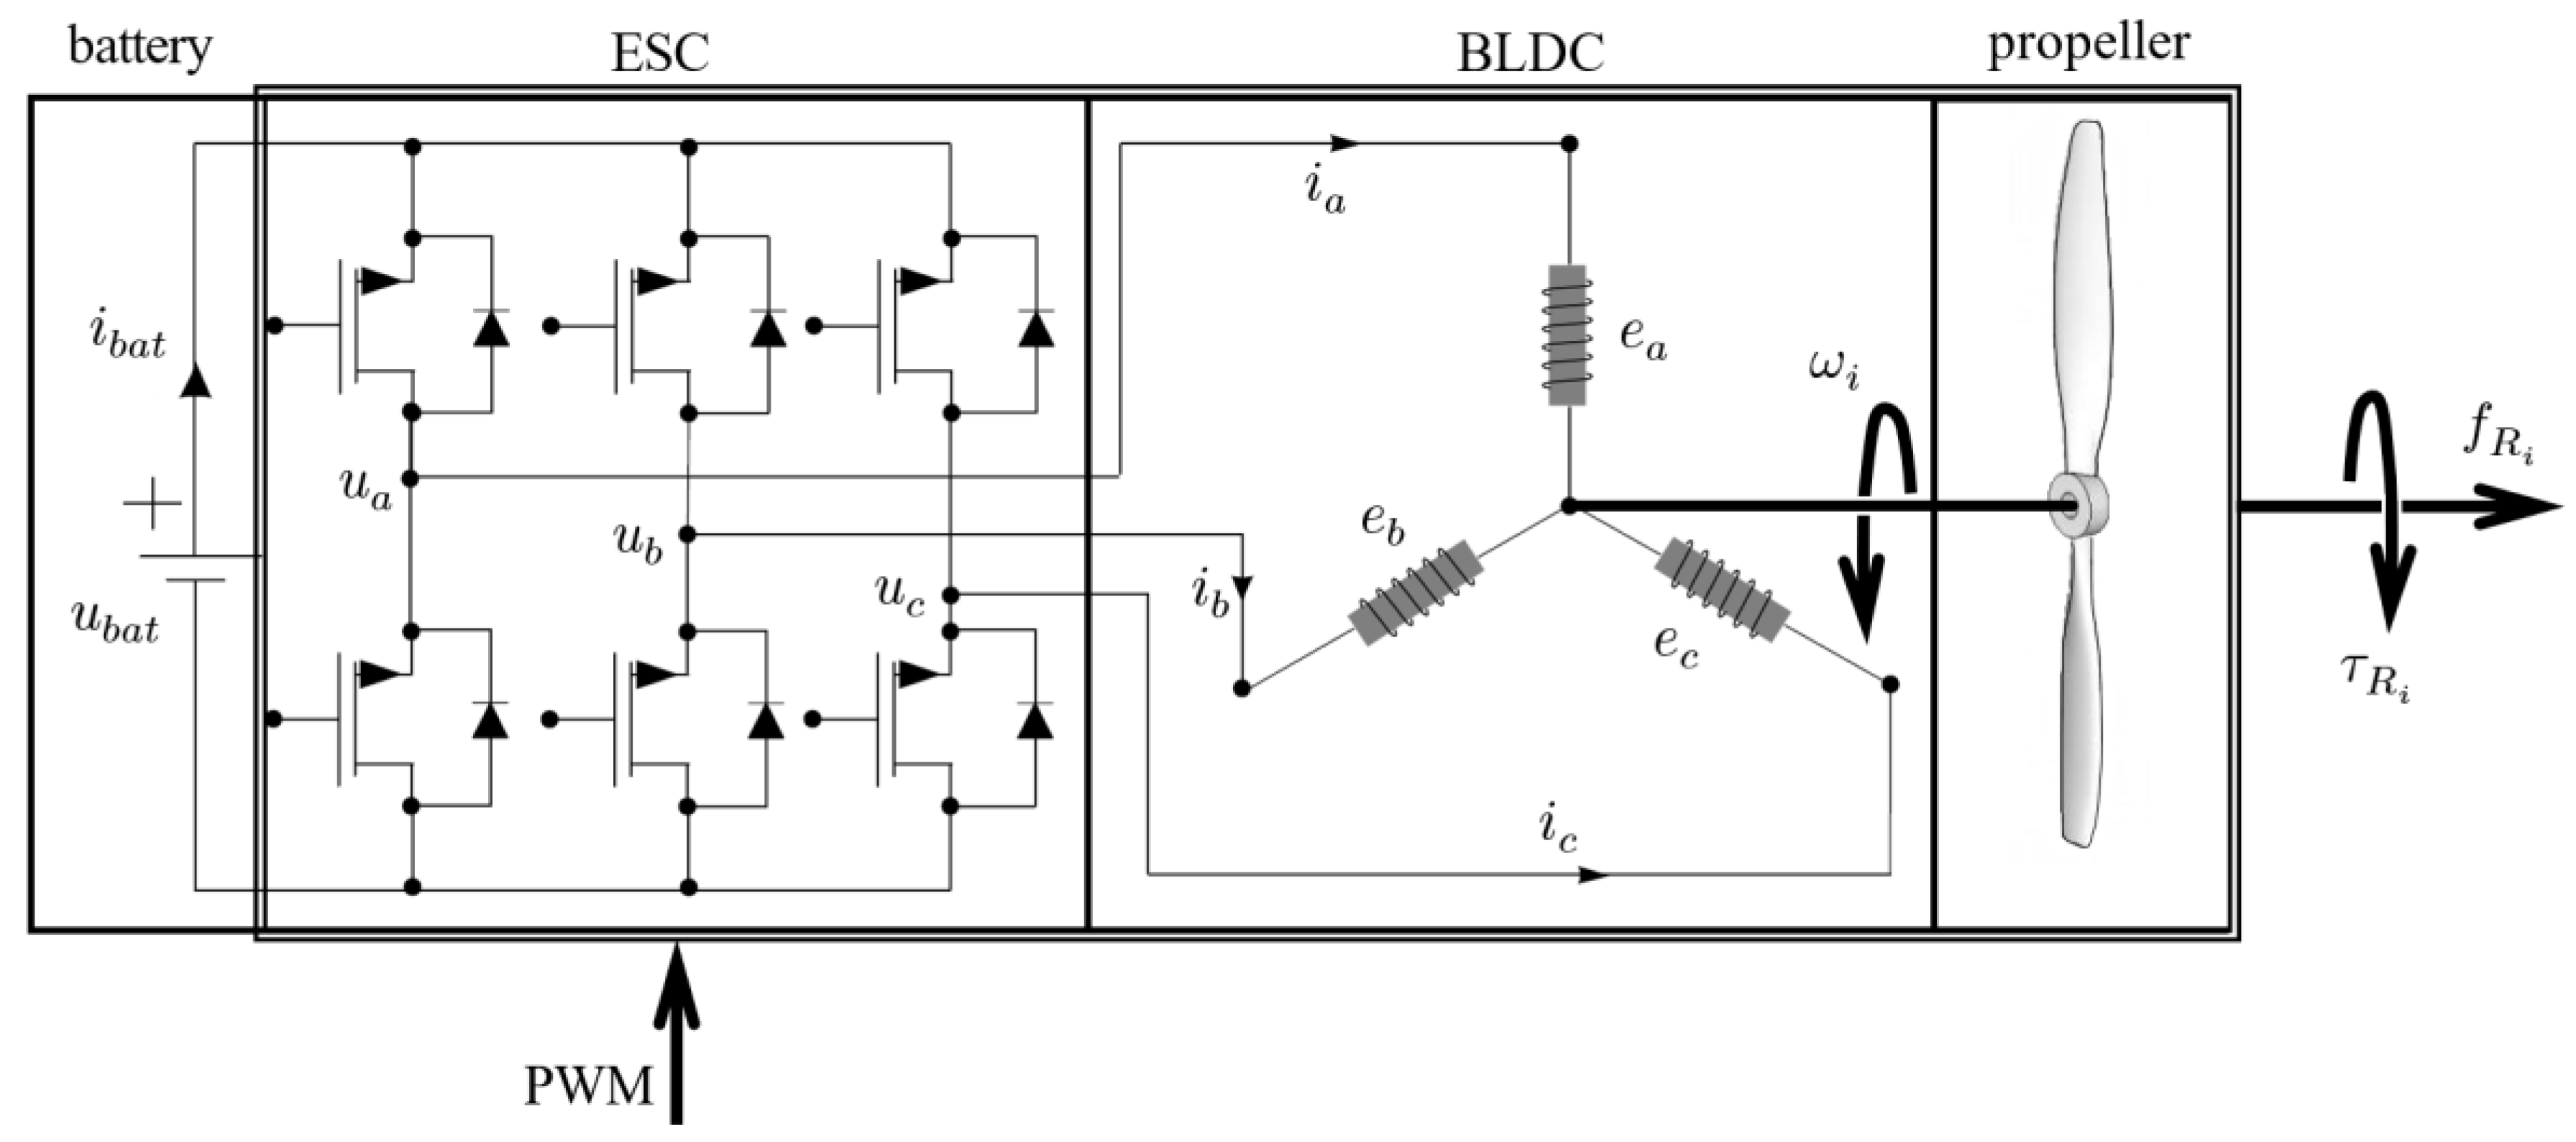
2.3. EPU Components
2.3.1. Fixed Pitch Propeller
2.3.2. BLDC Motor
2.3.3. ESC
3. EPU Parameters Identification Procedure
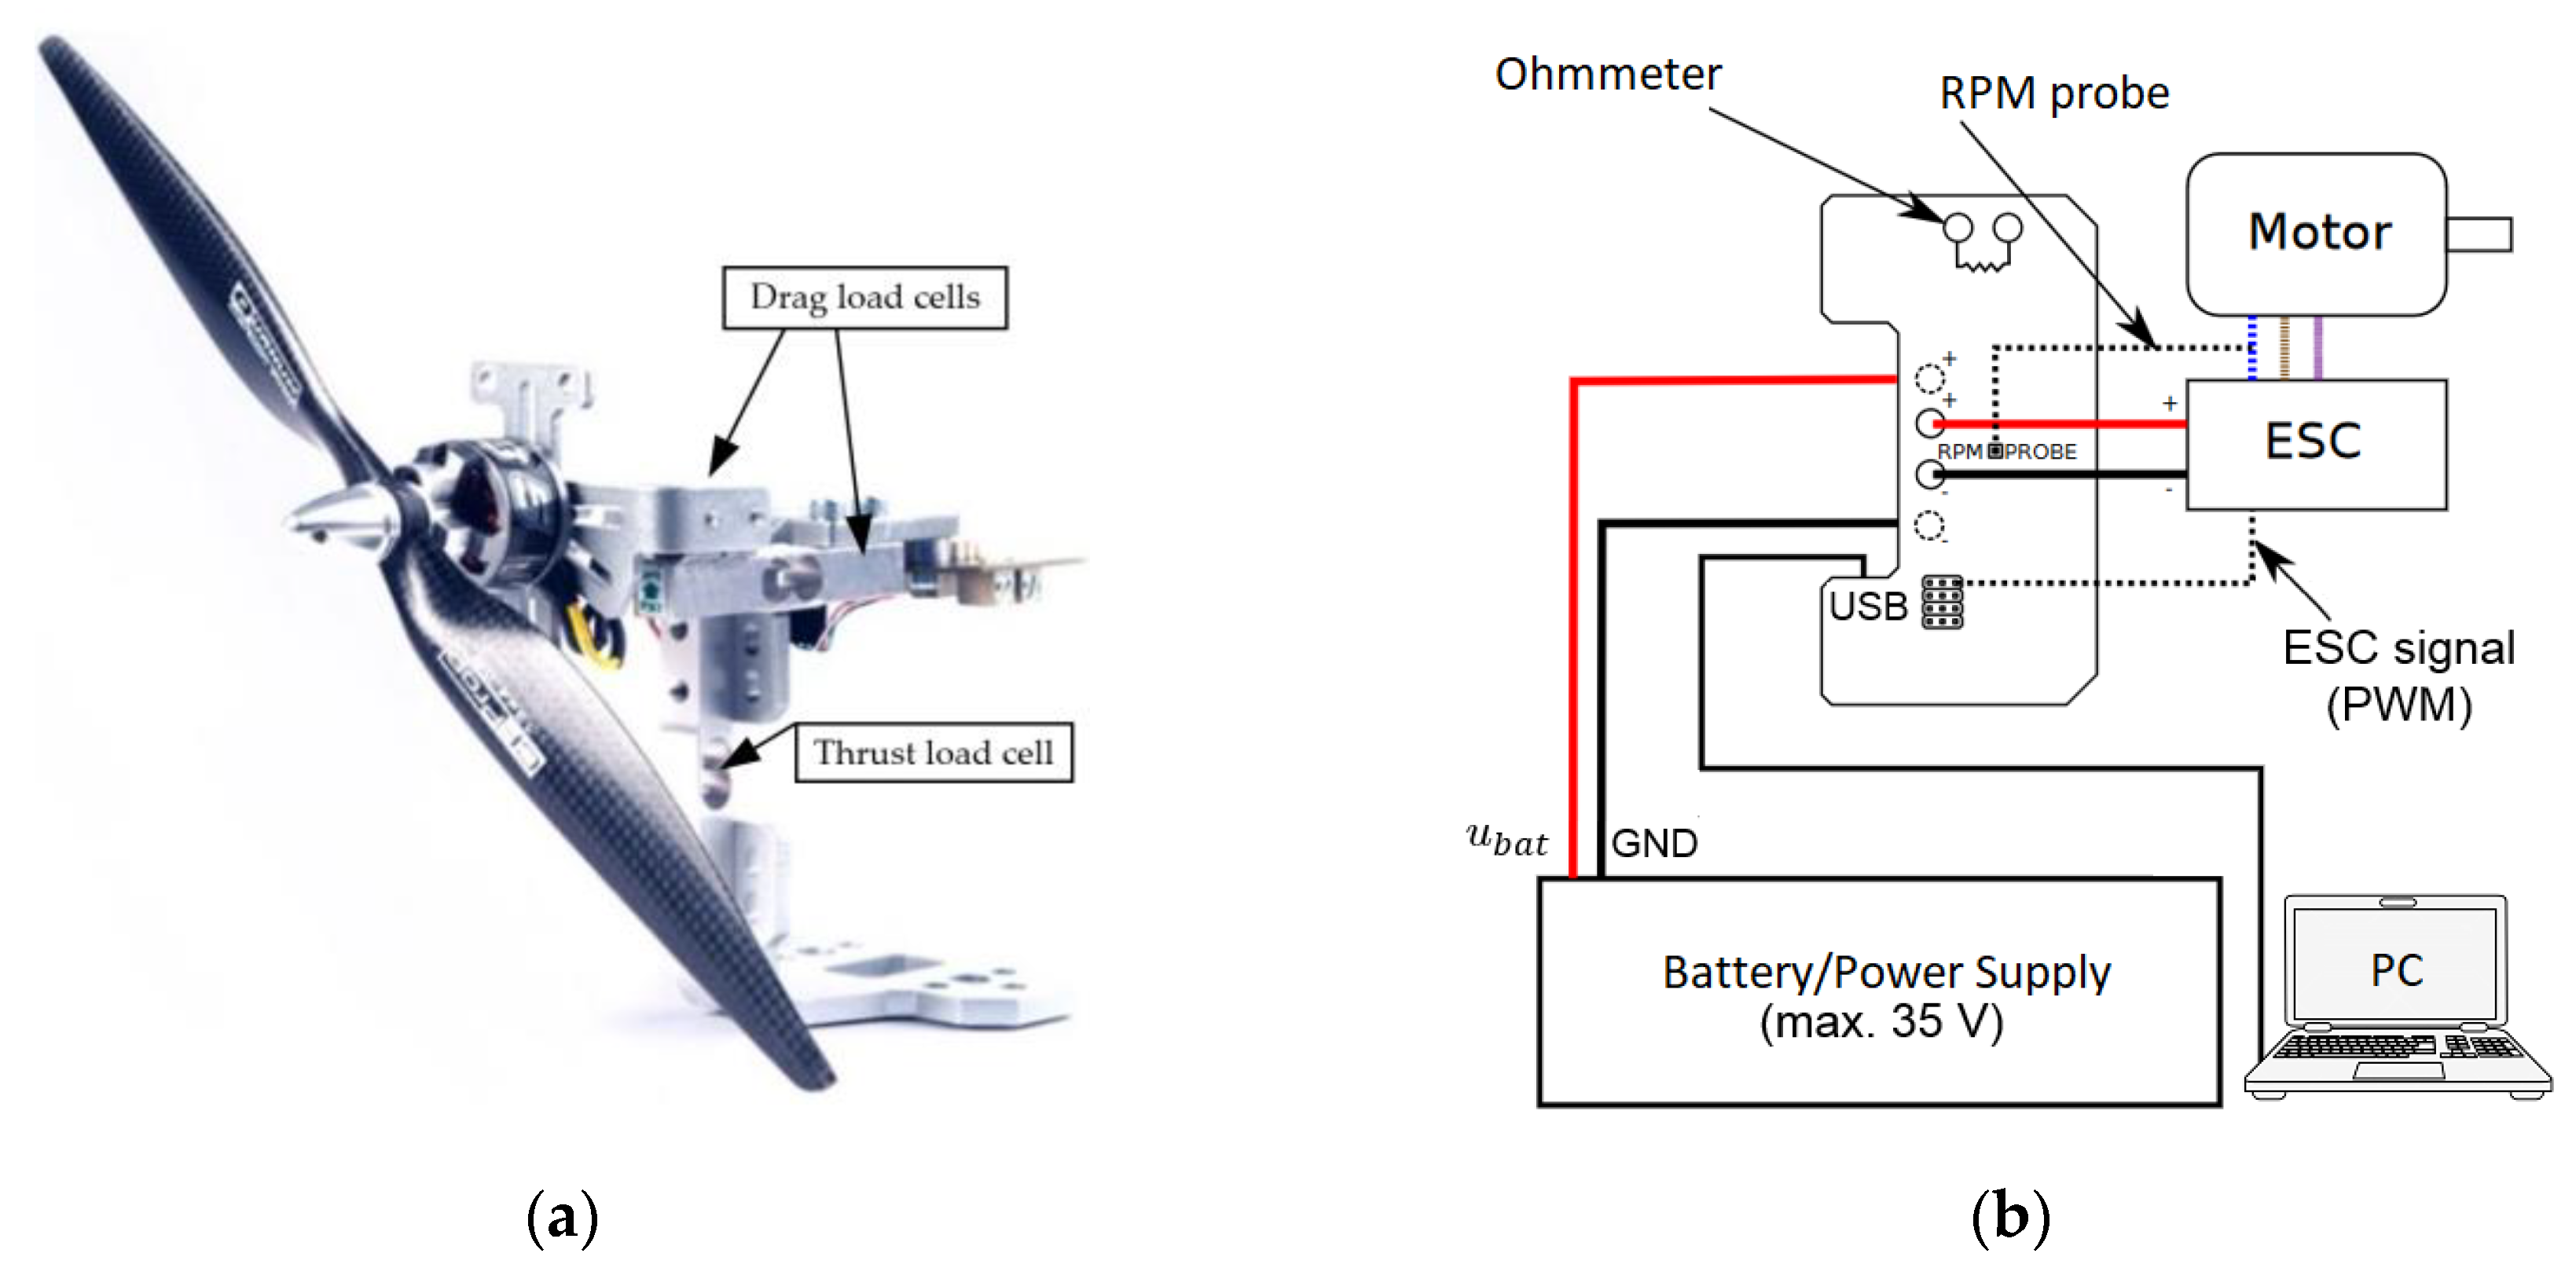
3.1. Experimental Setup
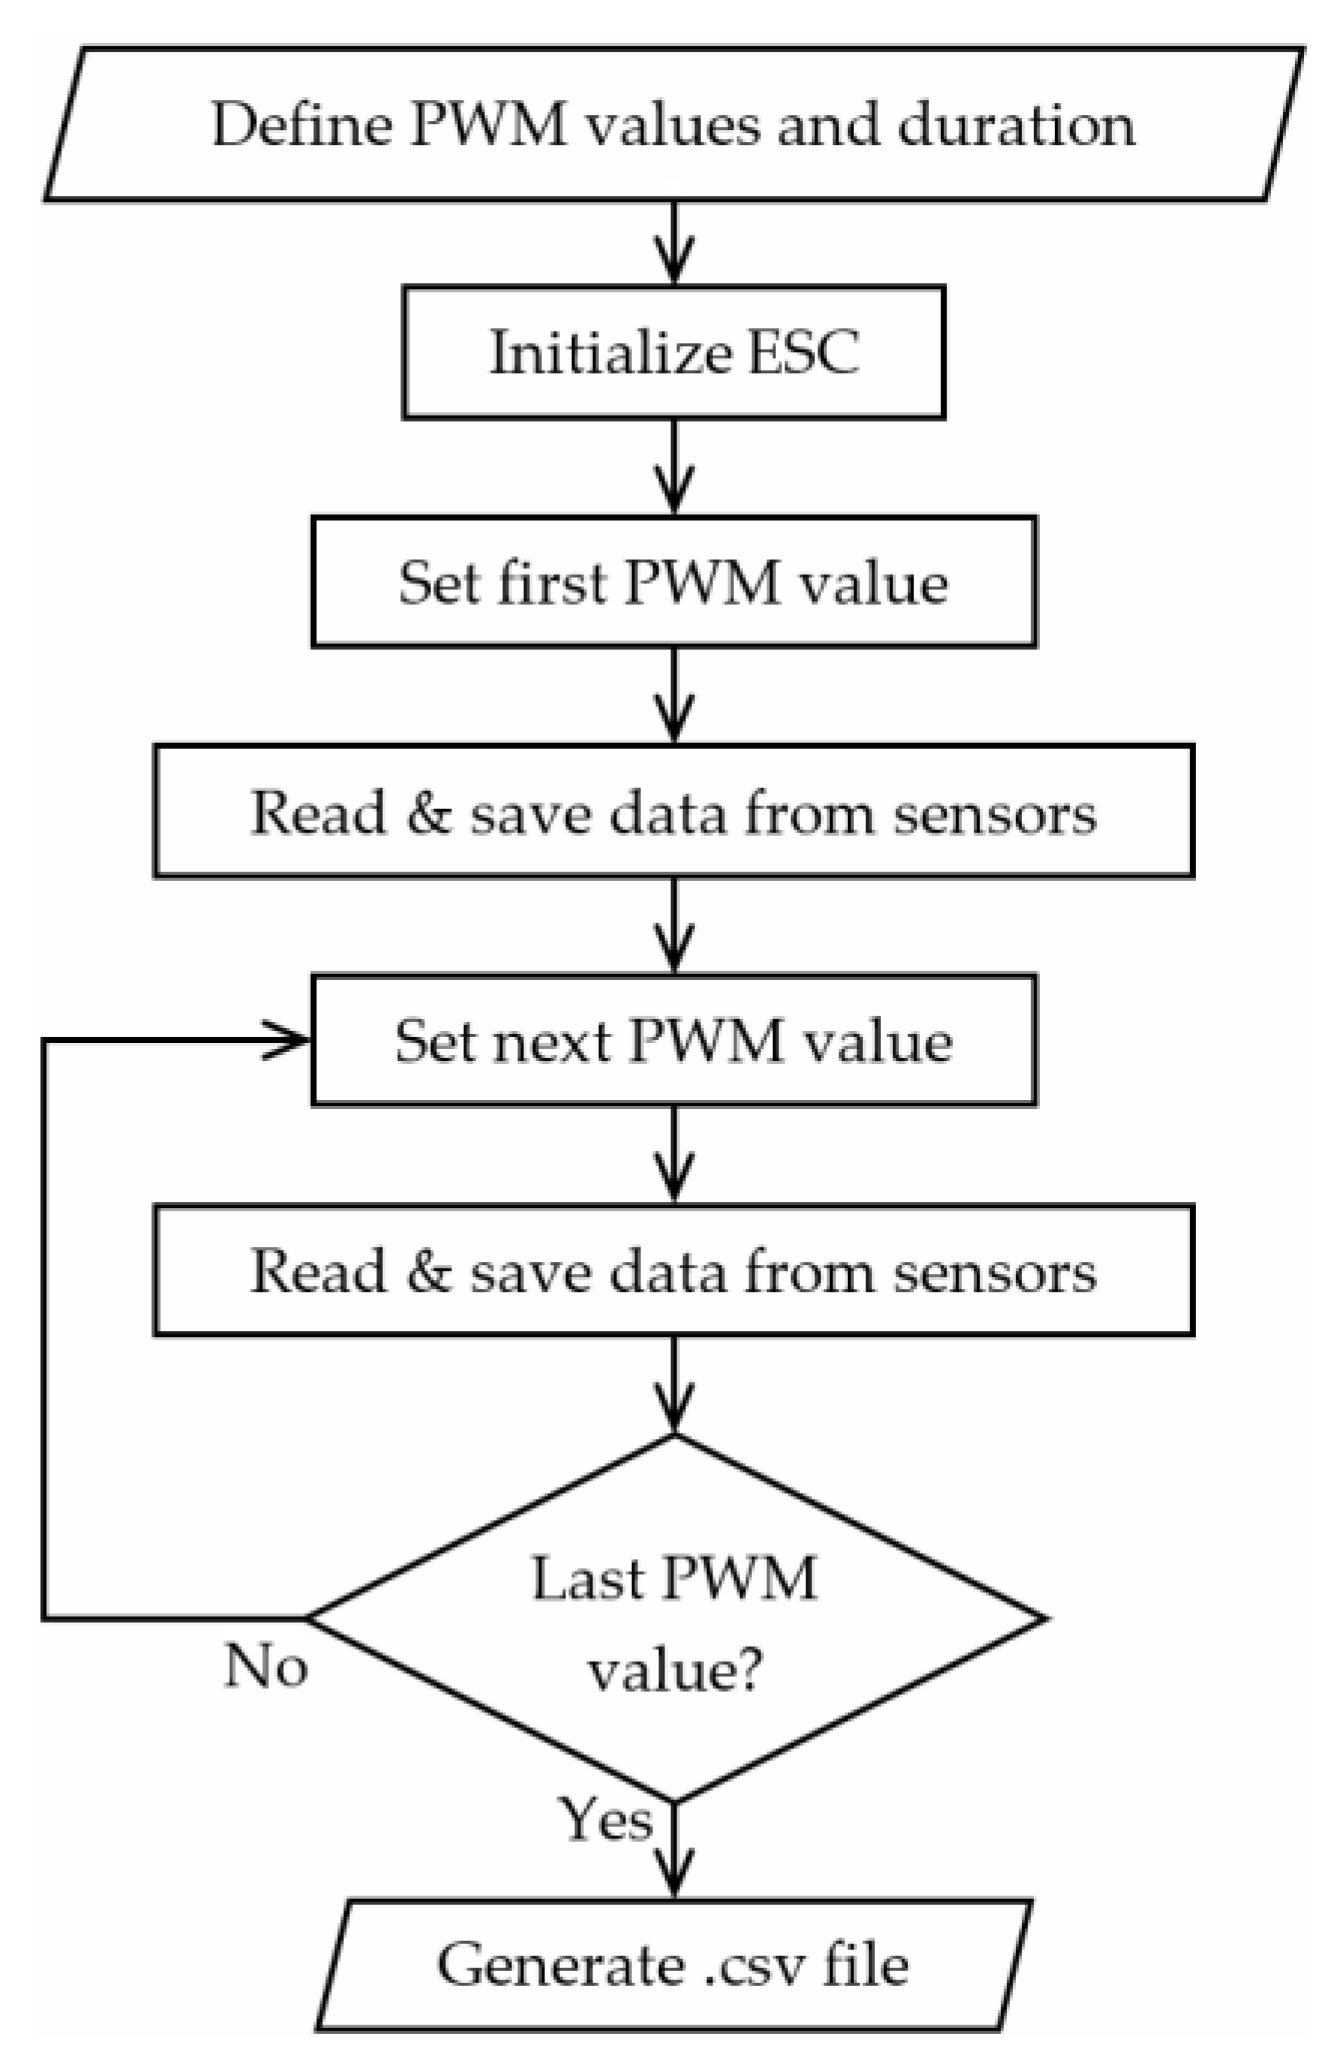
3.2. Data Acquisition
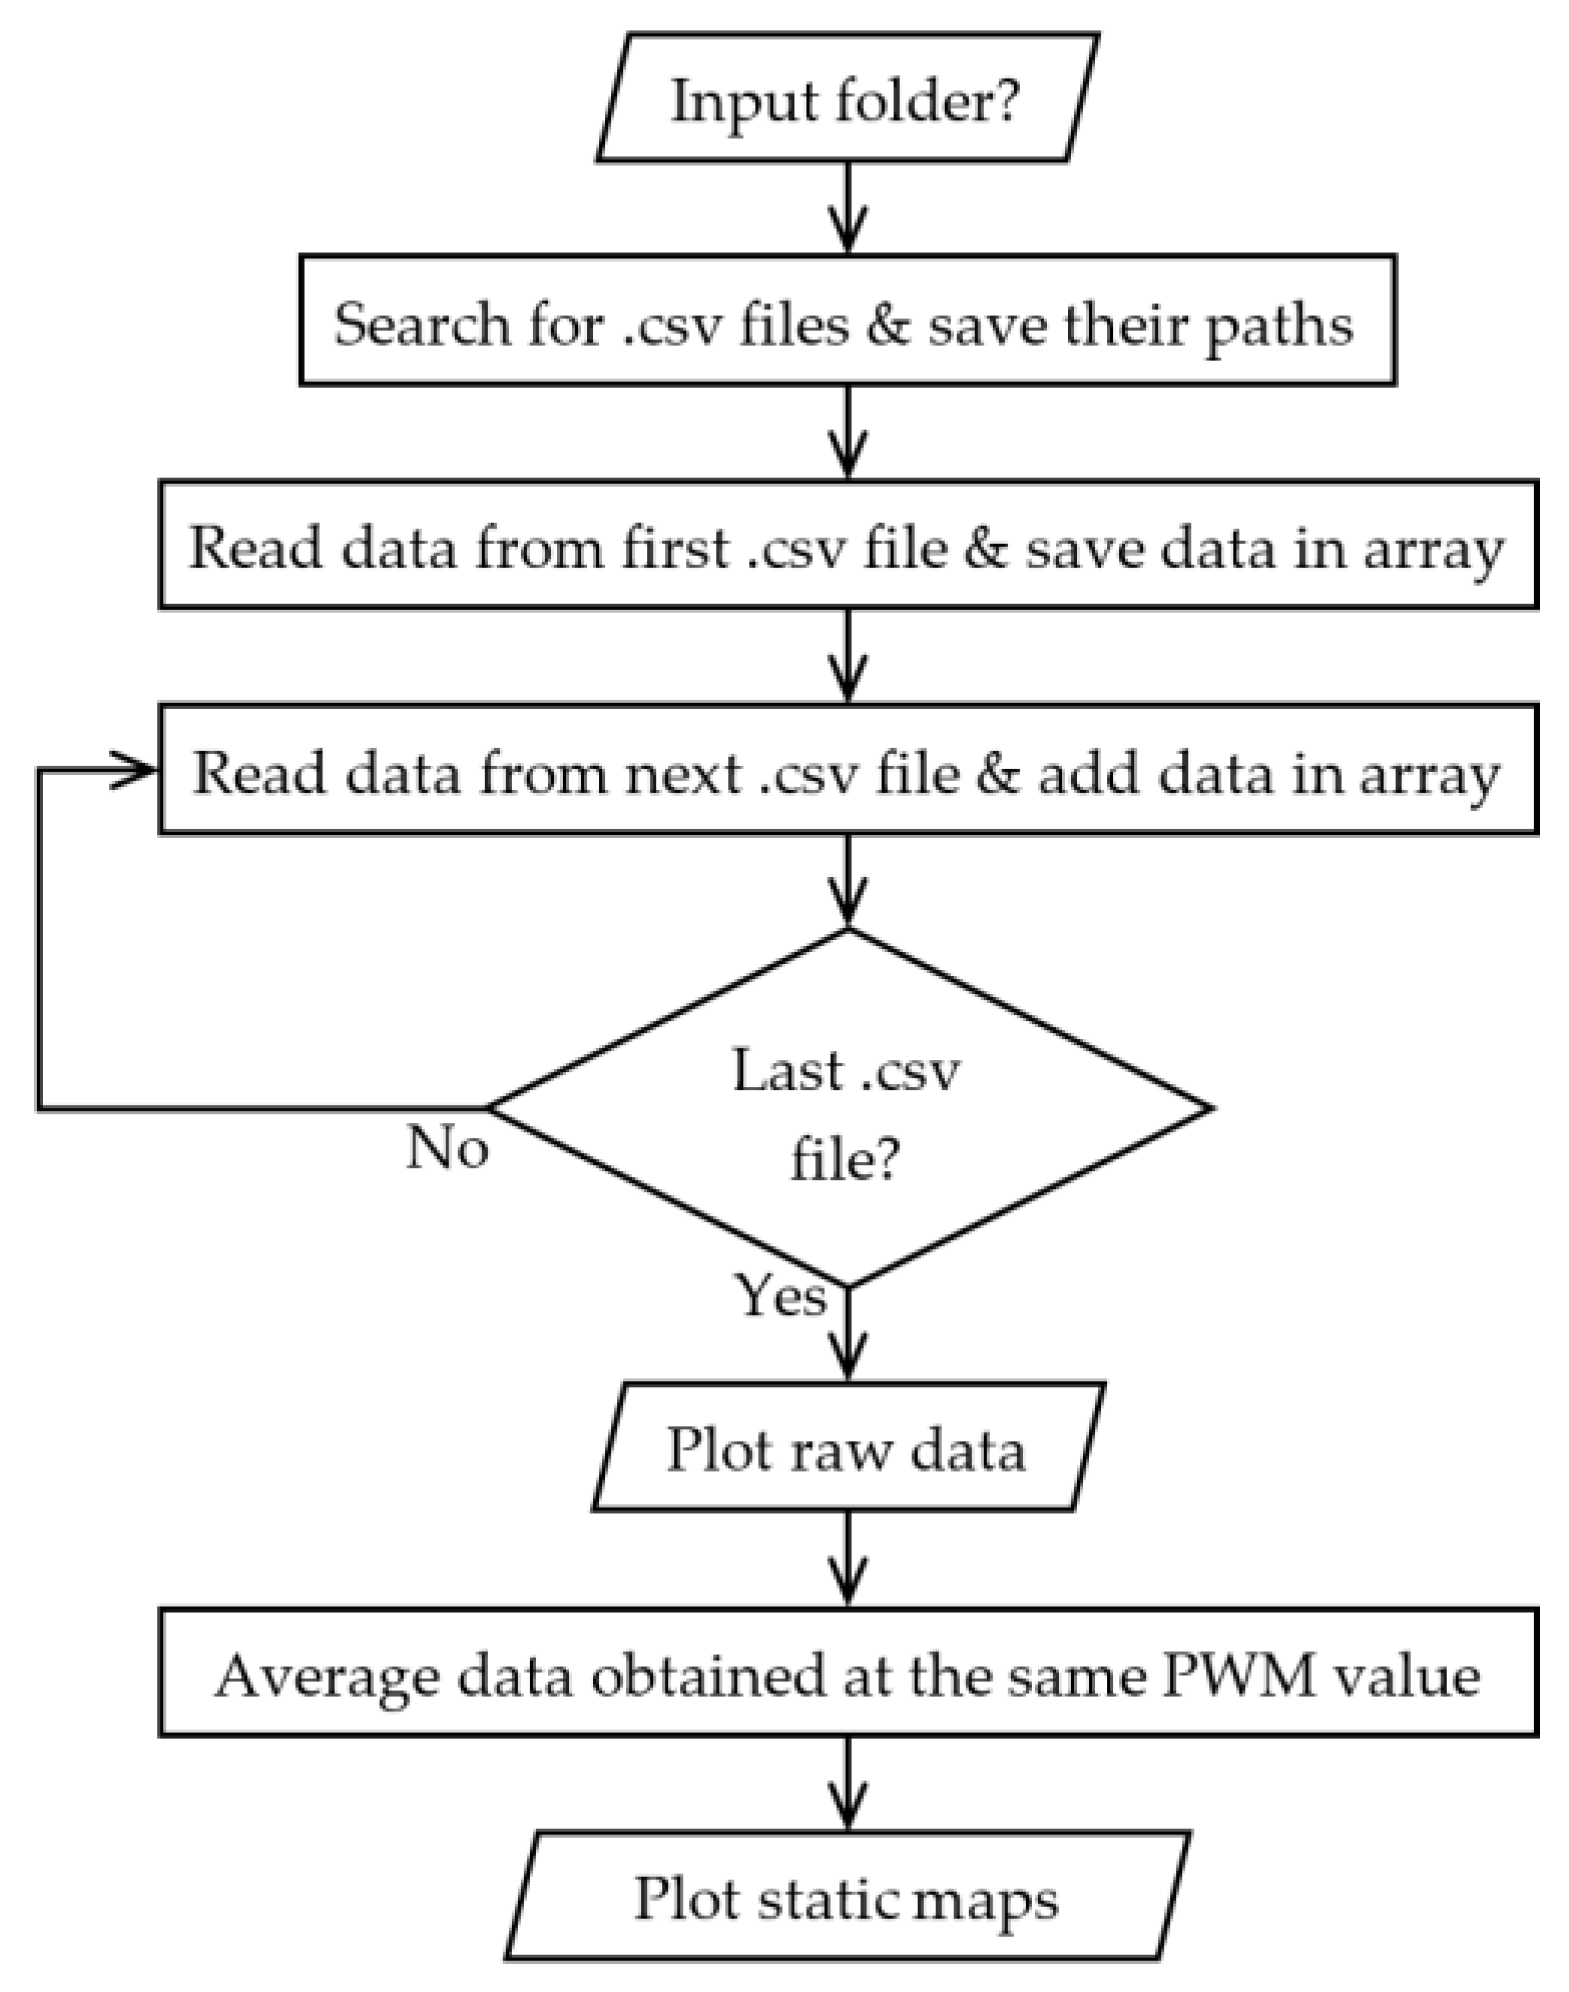
3.3. Identification Procedure
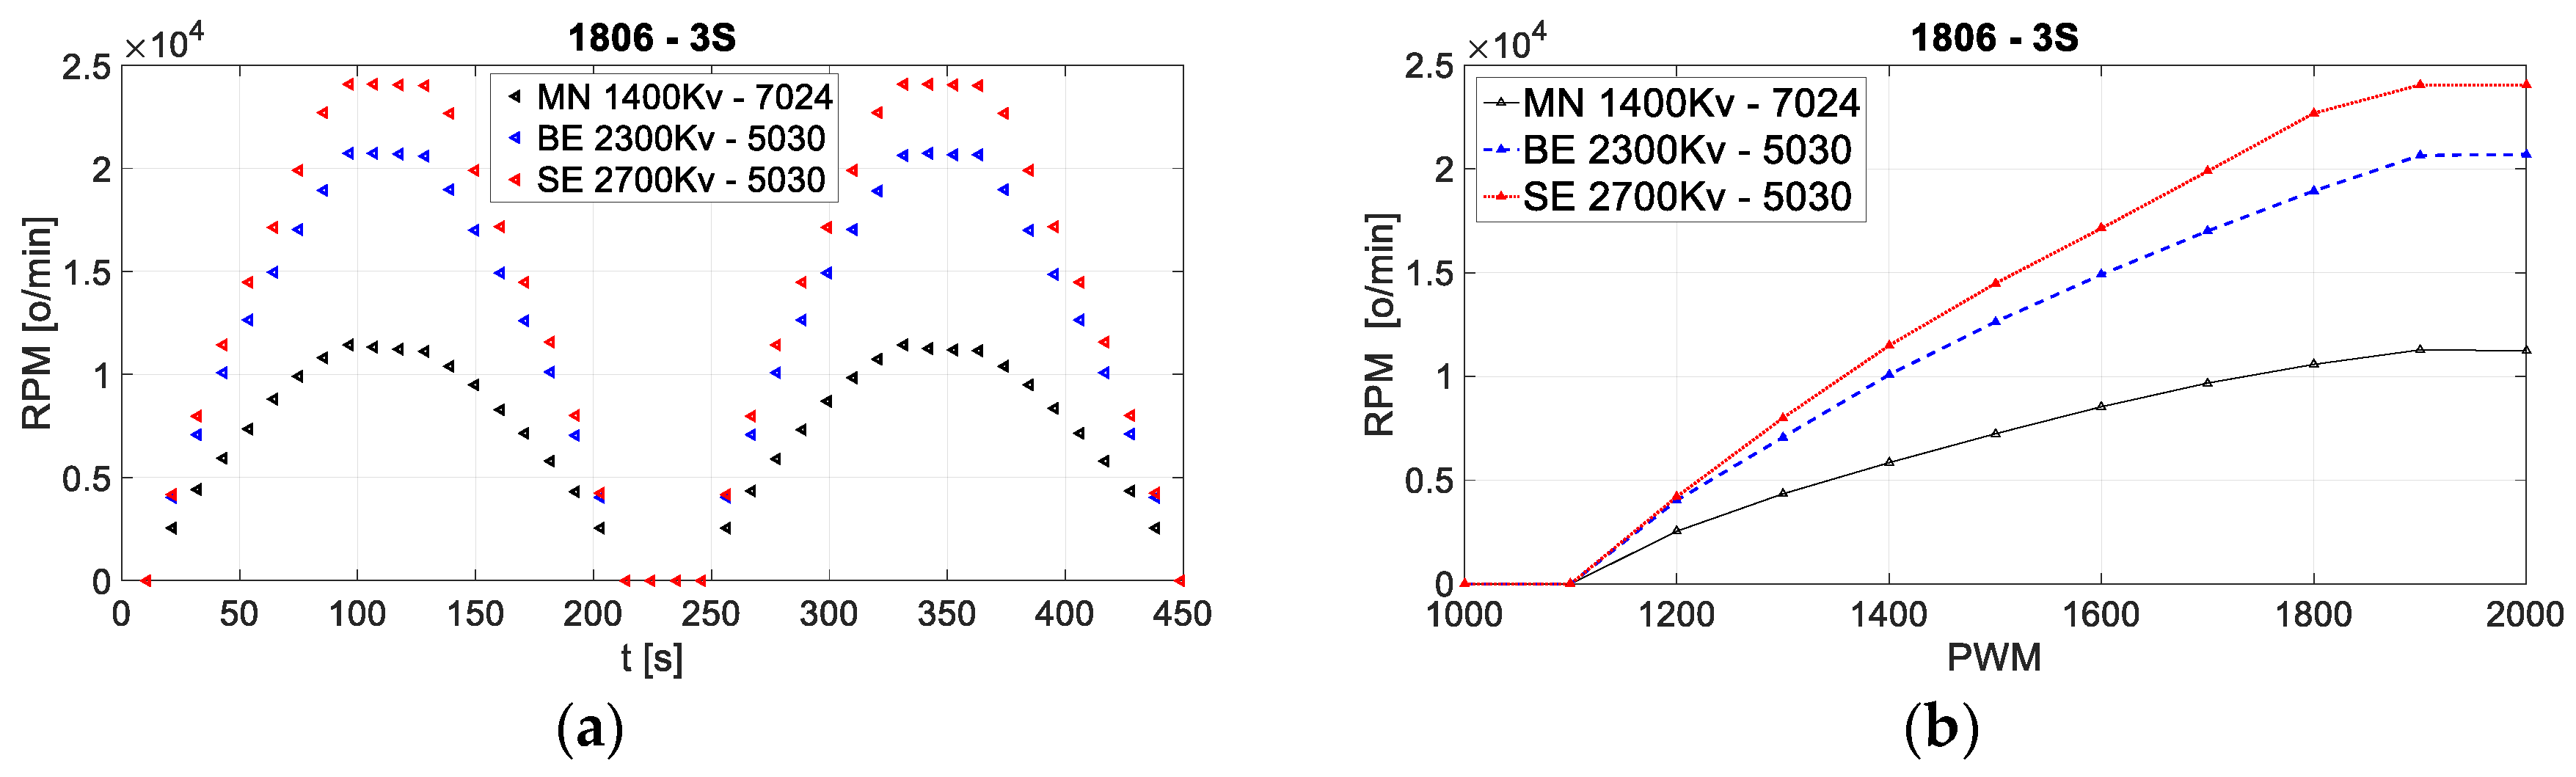
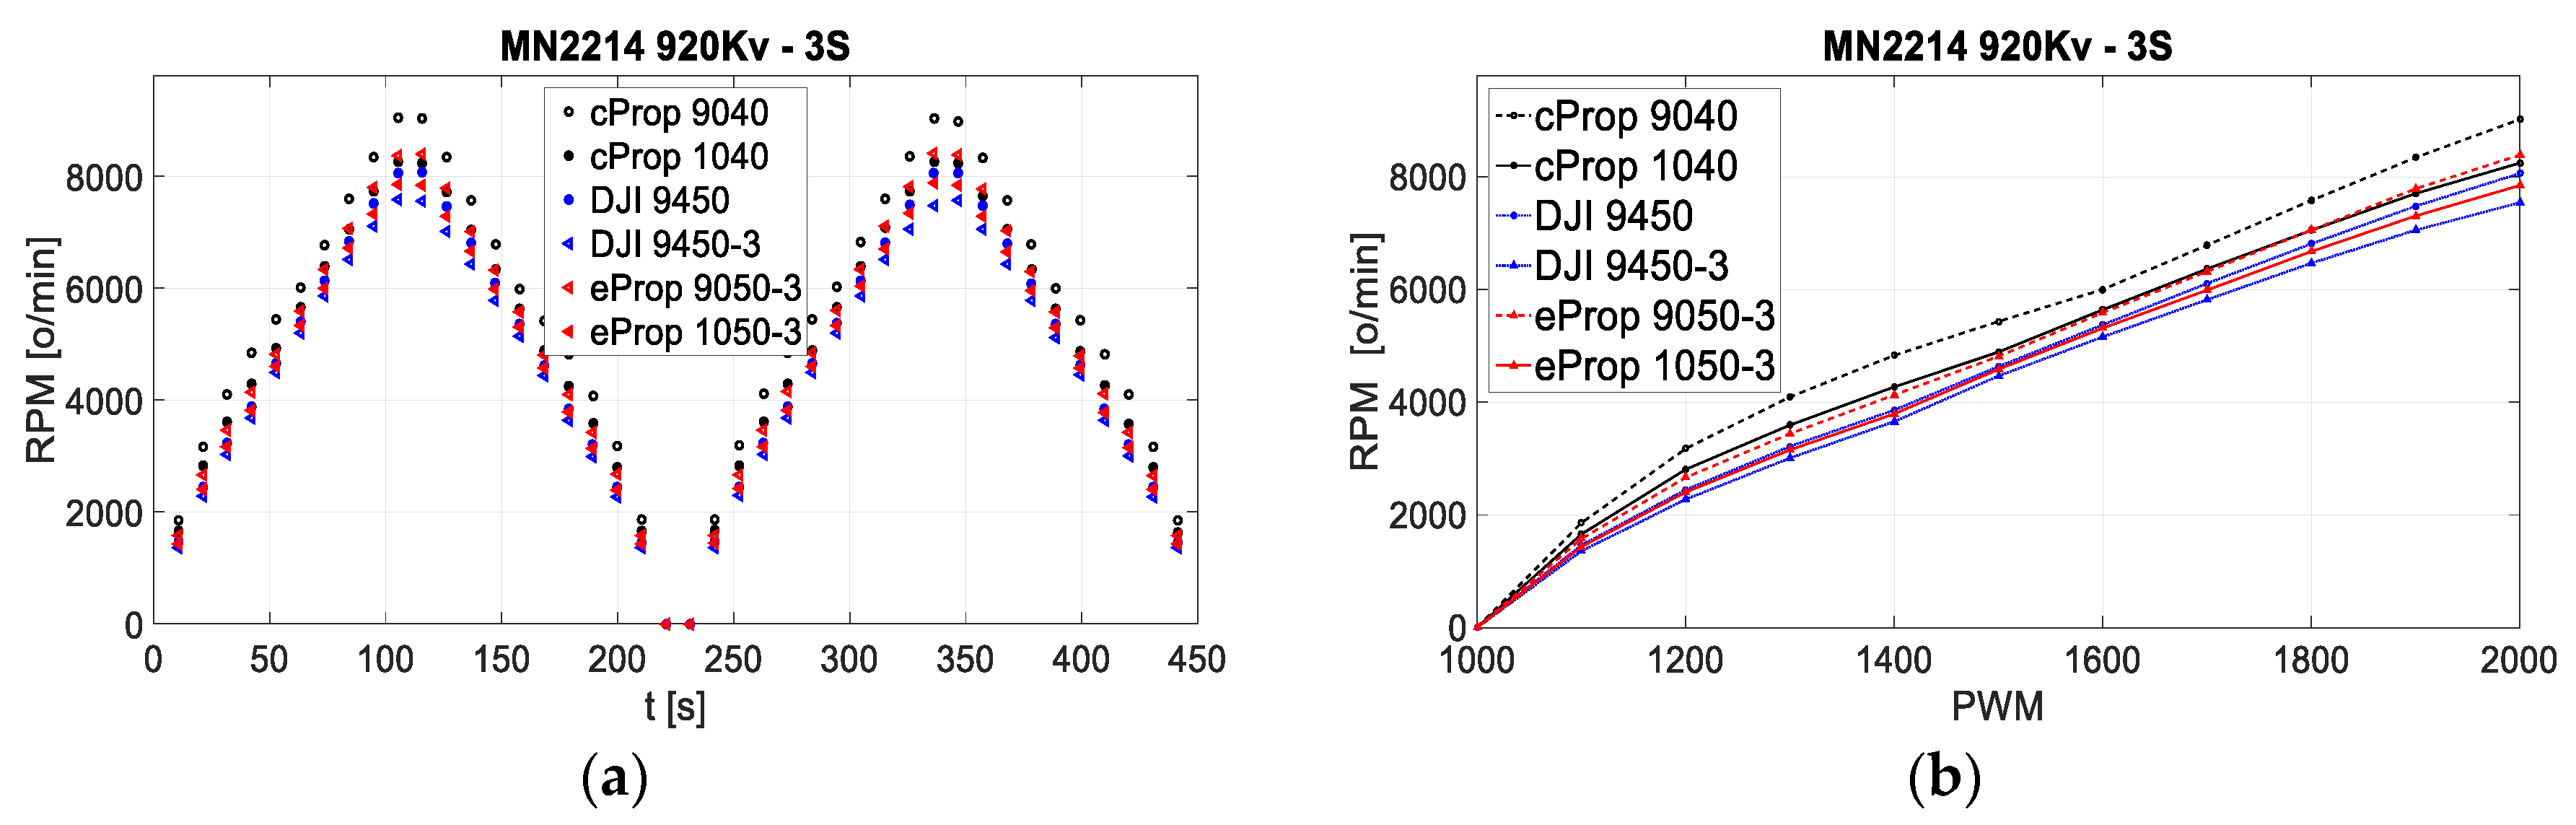
3.4. EPU Static Maps
4. Electric Propulsion System Characterization
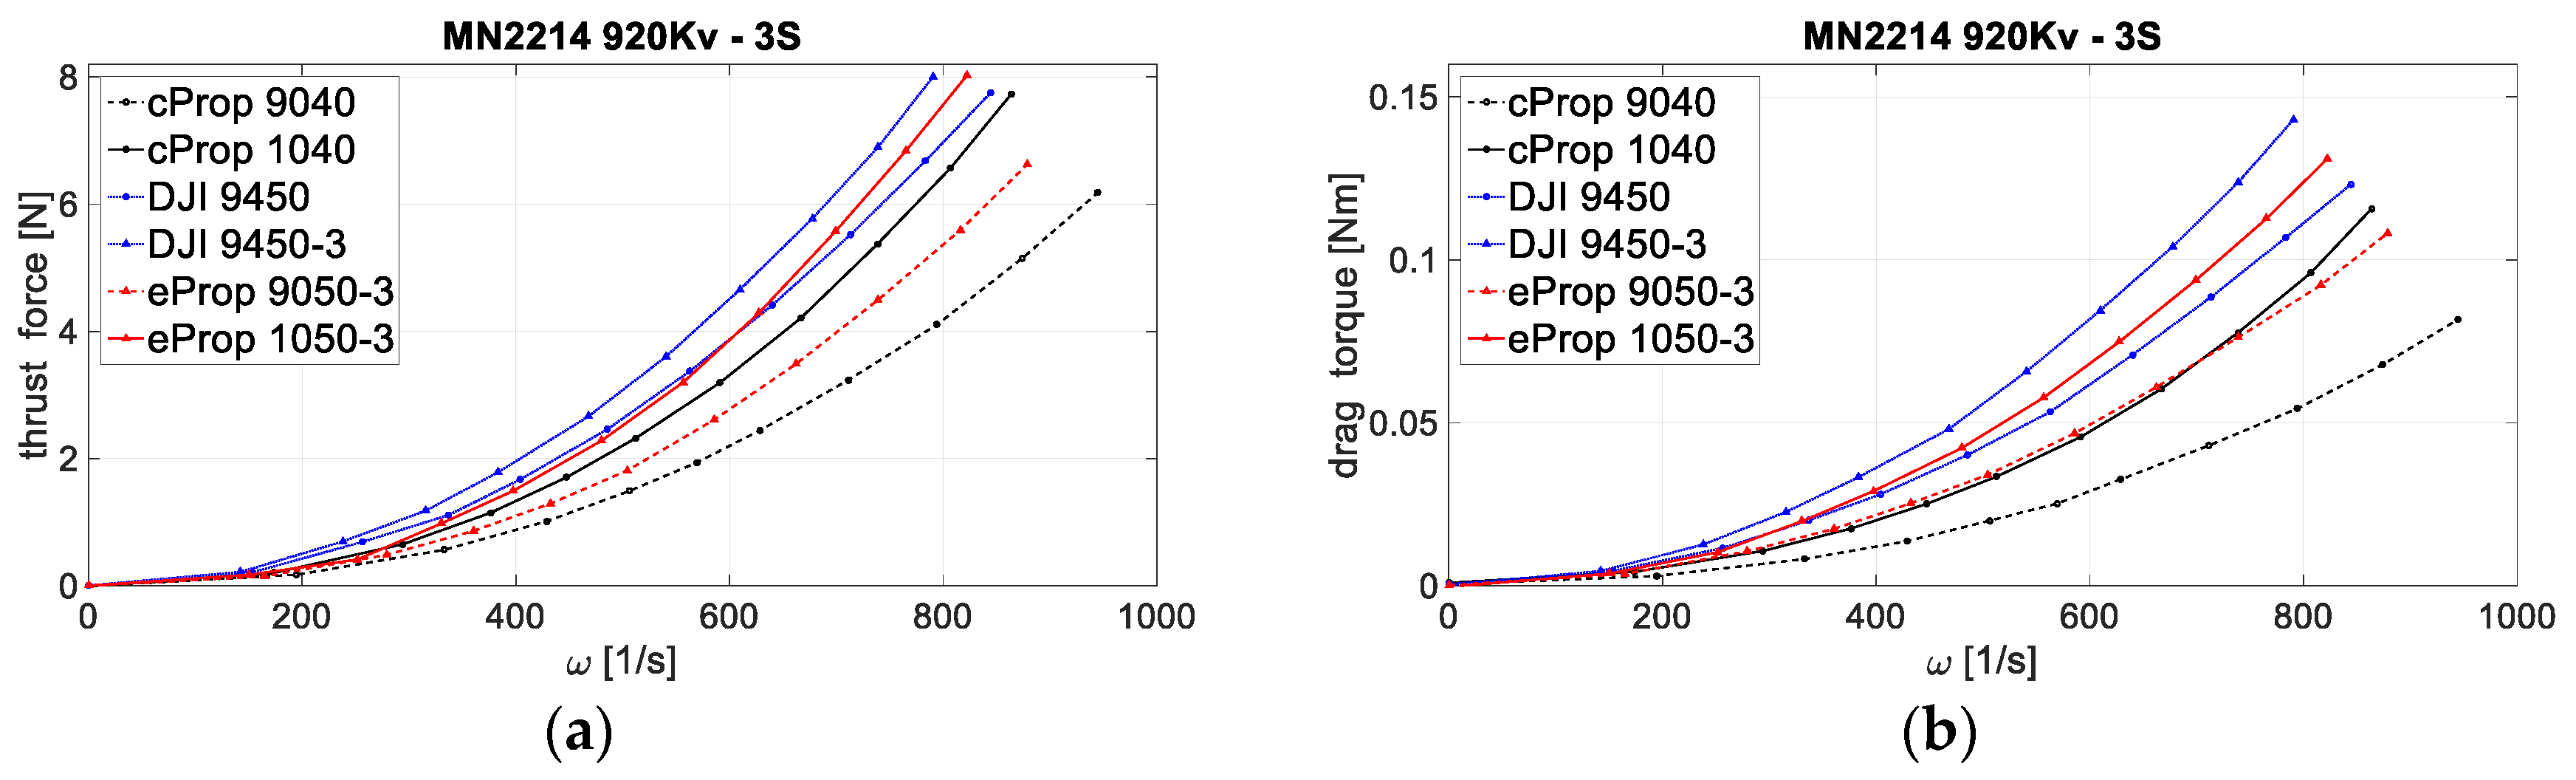
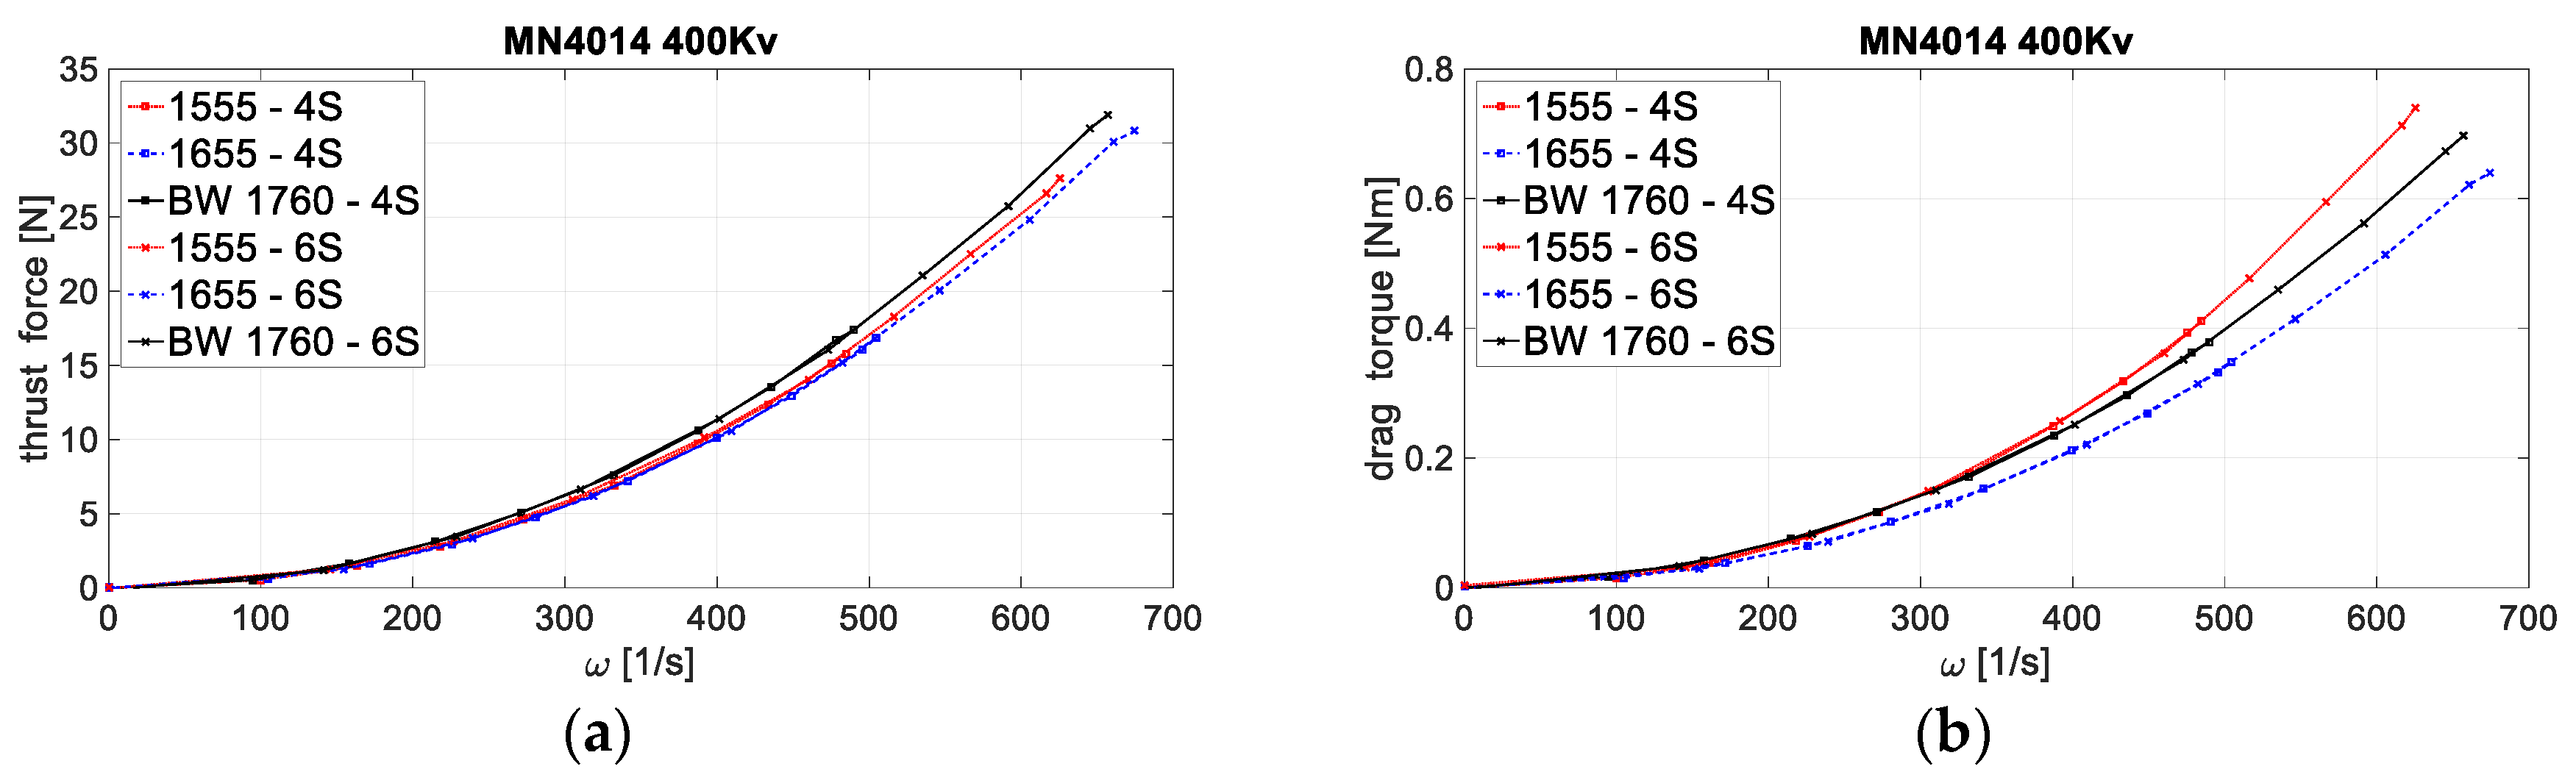
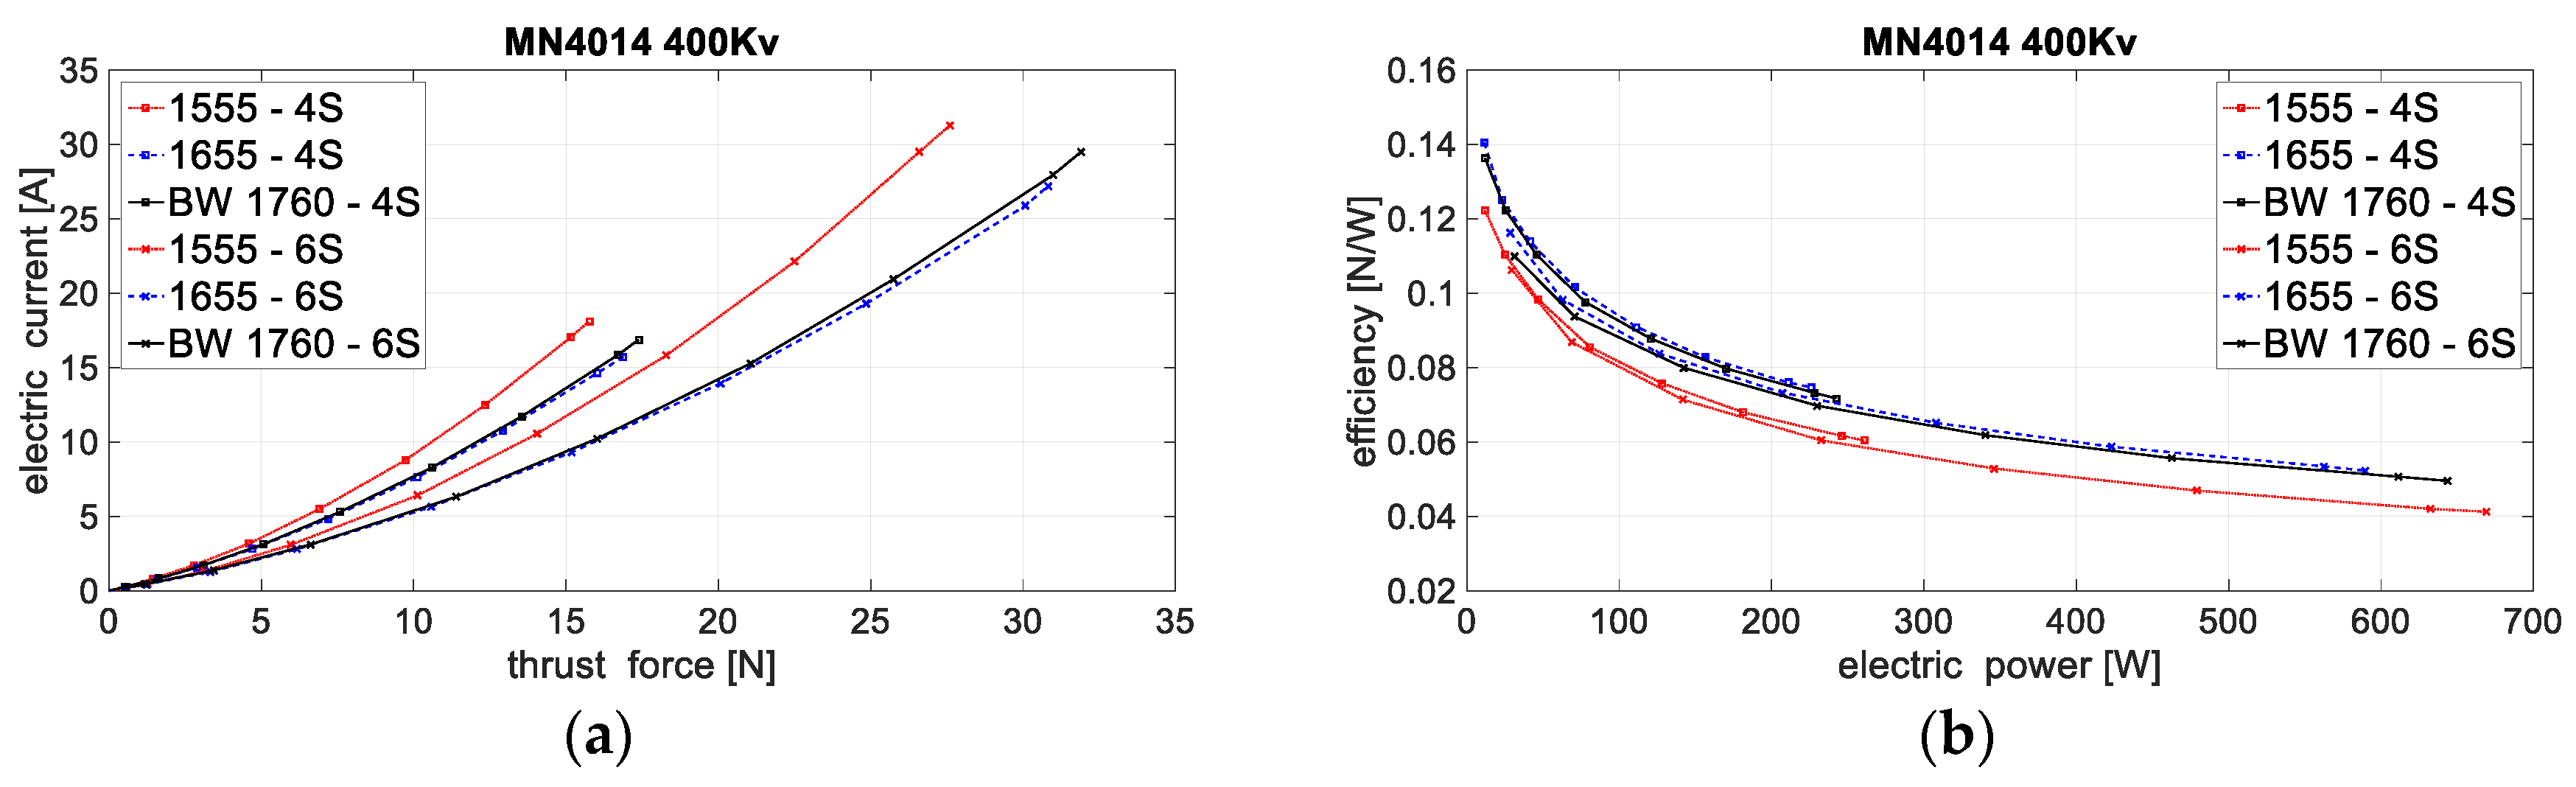
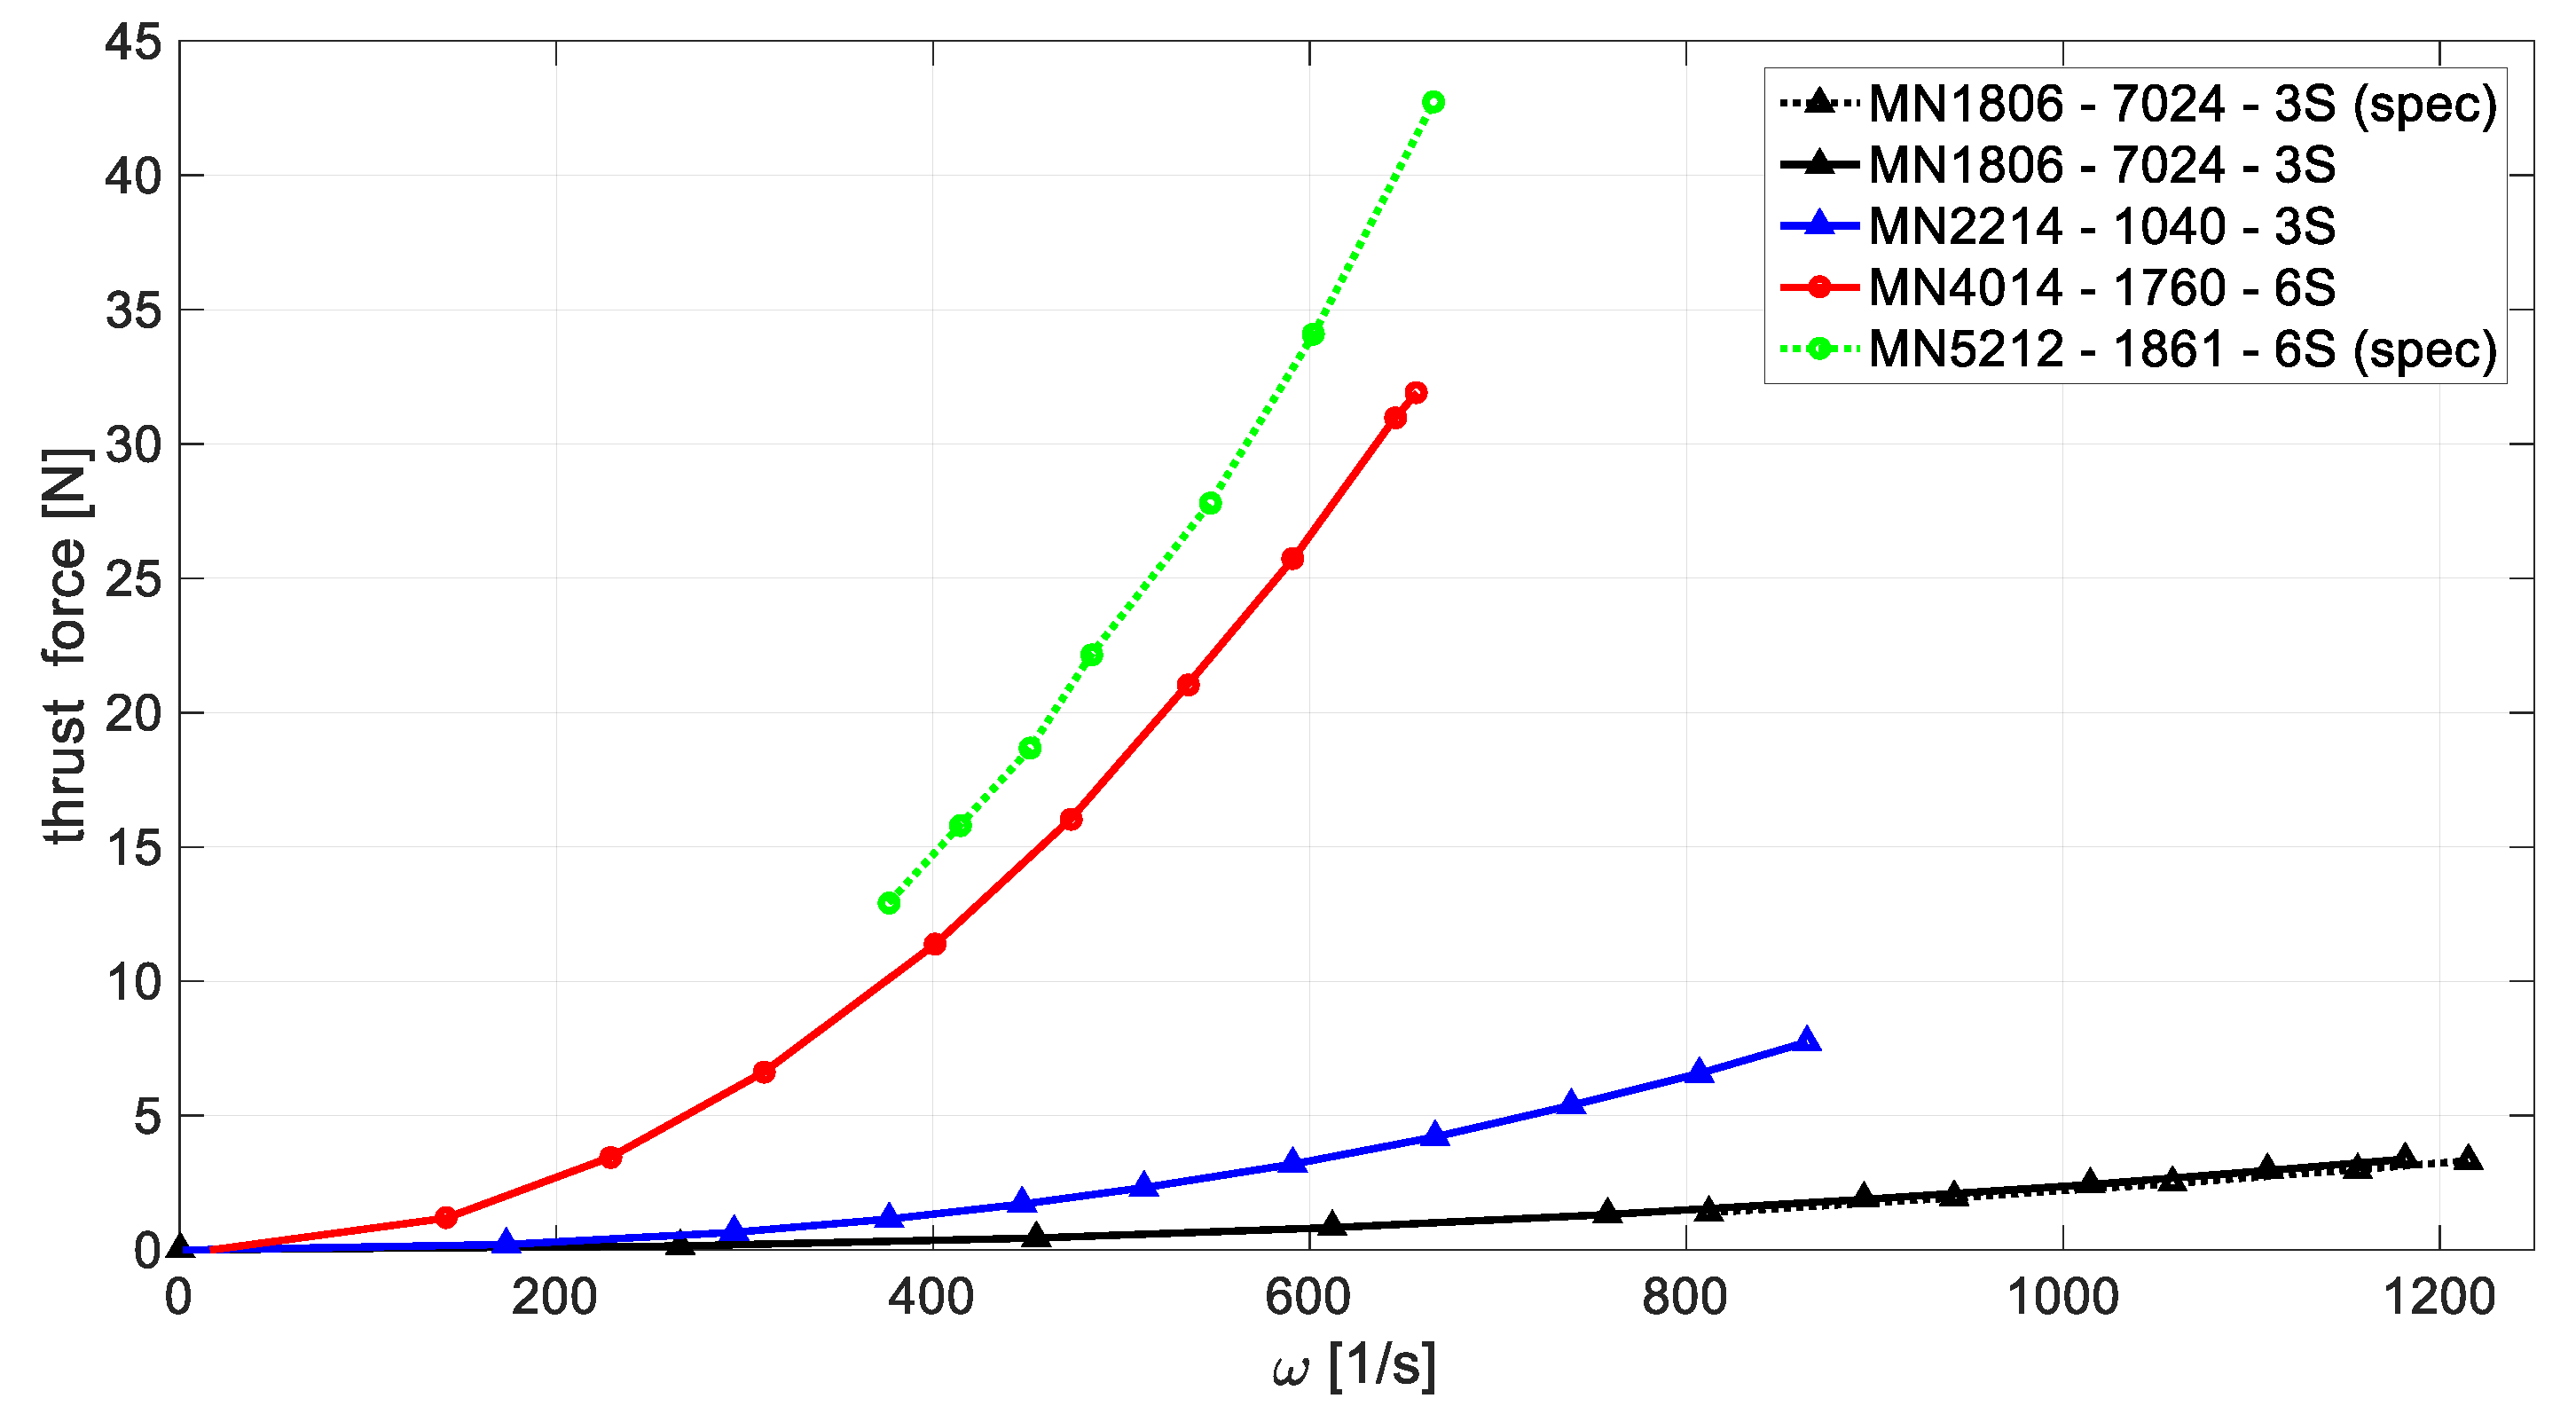
4.1. Aerodynamic Forces and Moments
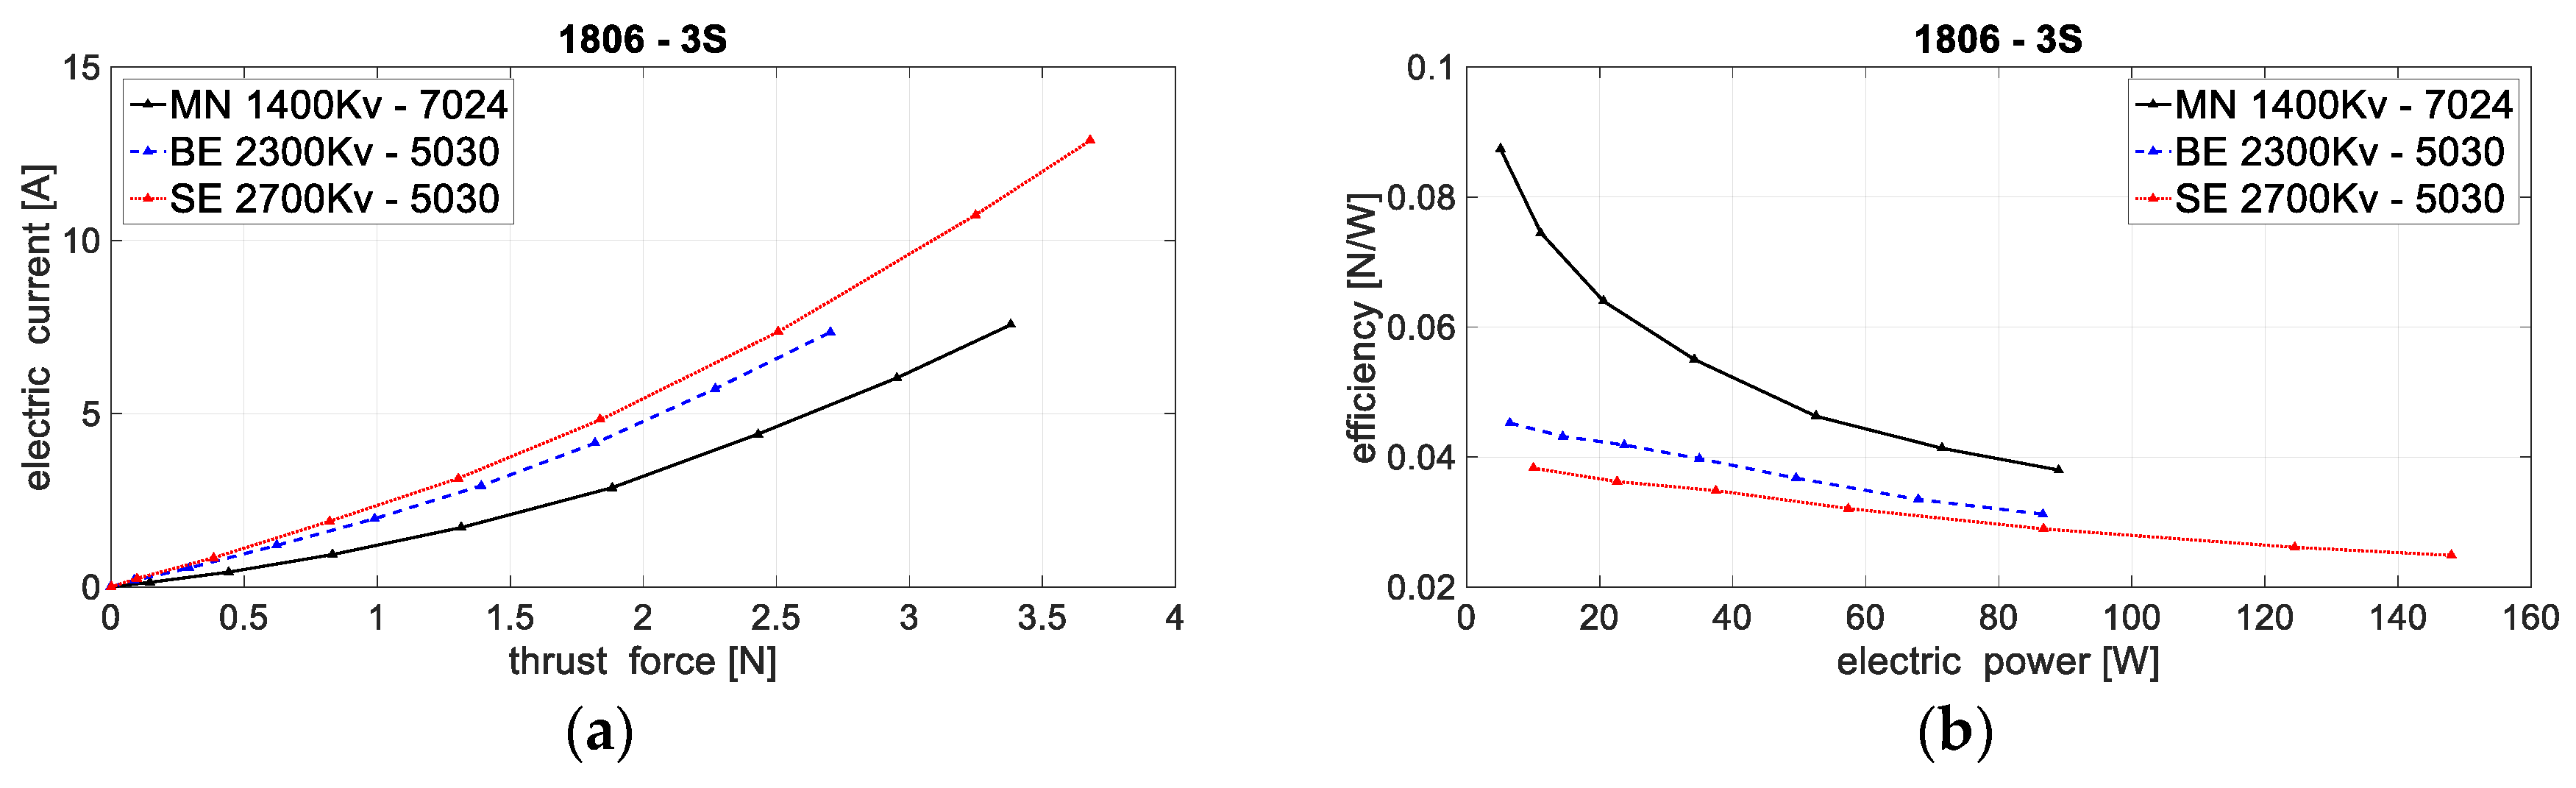
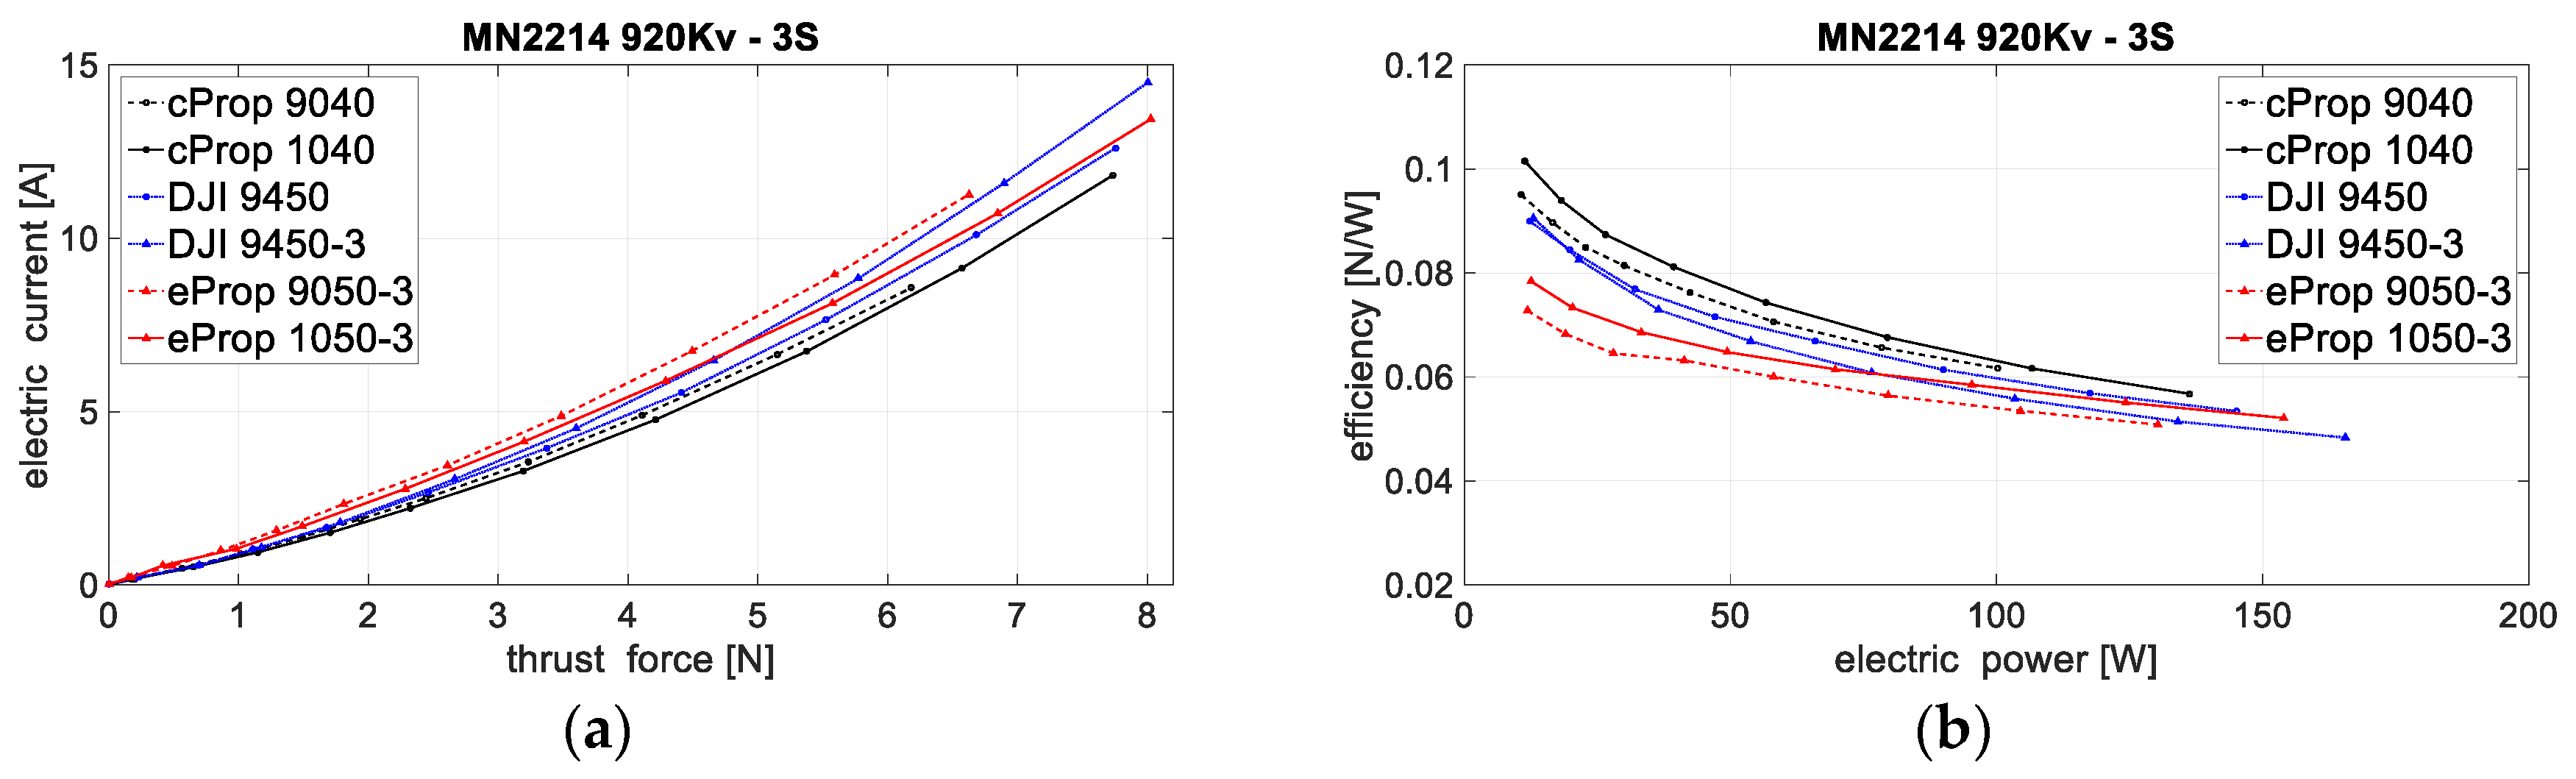
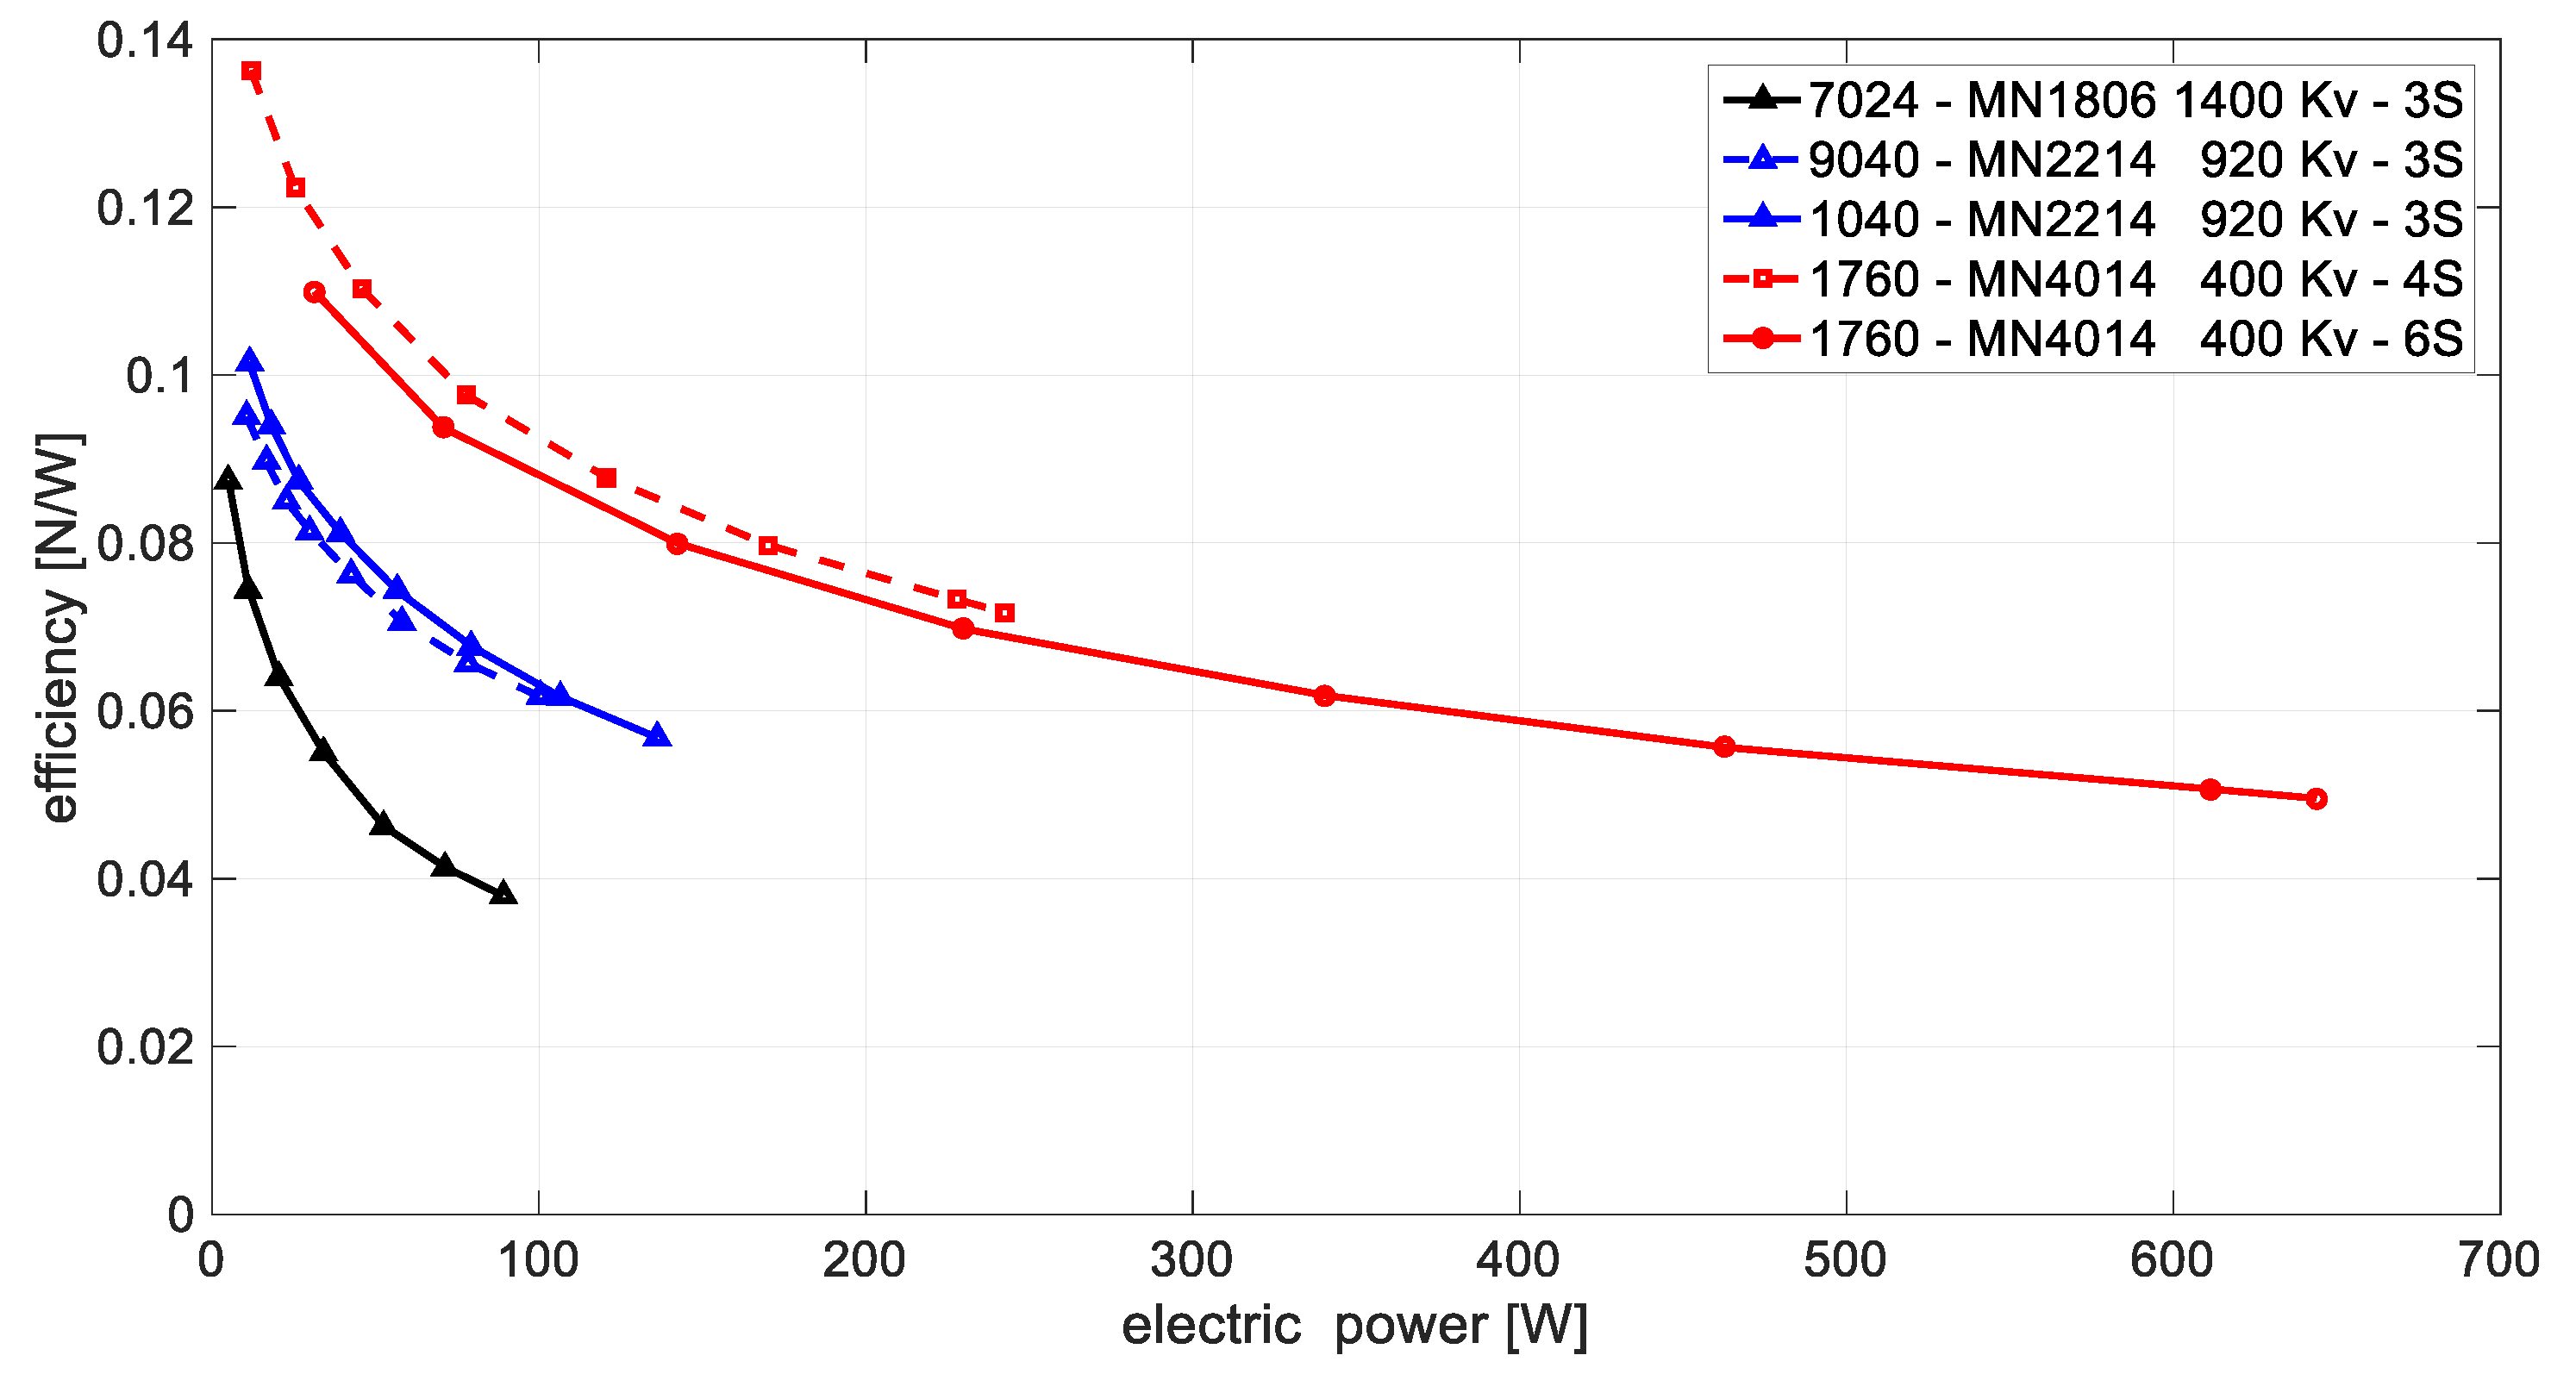
4.2. Energy Consumption and Efficiency
4.3. Electric Propulsion System Comparison
5. Conclusions
Author Contributions
Funding
Conflicts of Interest
References
- Kumar, V.; Michael, N. Opportunities and challenges with autonomous micro aerial vehicles. Int. J. Rob. Res. 2012, 31, 1279–1291. [Google Scholar] [CrossRef]
- Yeom, S.; Cho, I.J. Detection and tracking of moving pedestrians with a small unmanned aerial vehicle. Appl. Sci. 2019, 9, 3359. [Google Scholar] [CrossRef]
- Menéndez, O.; Pérez, M.; Auat Cheein, F. Visual-based positioning of aerial maintenance platforms on overhead transmission lines. Appl. Sci. 2019, 9, 165. [Google Scholar] [CrossRef]
- Li, Y.; Liu, C. Applications of multirotor drone technologies in construction management. Int. J. Constr. Manag. 2018, 19, 401–412. [Google Scholar] [CrossRef]
- Jannoura, R.; Brinkmann, K.; Uteau, D.; Bruns, C.; Joergensen, R.G. Monitoring of crop biomass using true colour aerial photographs taken from a remote controlled hexacopter. Biosyst. Eng. 2015, 129, 341–351. [Google Scholar] [CrossRef]
- Briod, A.; Kornatowski, P.; Zufferey, J.C.; Floreano, D.A. Collision-resilient flying robot. J. Field Robot. 2014, 31, 496–509. [Google Scholar] [CrossRef]
- Yang, B.; He, Y.; Han, J.; Liu, G. Rotor-flying manipulator: Modeling, analysis, and control. Math. Probl. Eng. 2014, 2014, 1–13. [Google Scholar] [CrossRef]
- Nguyen, A.T.; Xuan-Mung, N.; Hong, S.K. Quadcopter adaptive trajectory tracking control: A new approach via backstepping technique. Appl. Sci. 2019, 9, 3873. [Google Scholar] [CrossRef]
- Park, J.; Cho, N. Collision avoidance of hexacopter UAV based on LiDAR data in dynamic environment. Remote Sens. 2020, 12, 975. [Google Scholar] [CrossRef]
- Ikeda, T.; Yasui, S.; Fujihara, M.; Ohara, K.; Ashizawa, S.; Ichikawa, A.; Okino, A.; Oomichi, T.; Fukuda, T. Wall contact by octo-rotor UAV with one DoF manipulator for bridge inspection. In Proceedings of the 2017 IEEE/RSJ International Conference on Intelligent Robots and Systems (IROS), Vancouver, BC, Canada, 24–28 September 2017; pp. 5122–5127. [Google Scholar] [CrossRef]
- Kotarski, D.; Kasać, J. Generalized control allocation scheme for multirotor type of UAVs. In Drones-Applications; Dekoulis, G., Ed.; IntechOpen: London, UK, 2018; pp. 43–58. [Google Scholar] [CrossRef]
- Prior, S.D.; Bell, J.C. Empirical measurements of small unmanned aerial vehicle co-axial rotor systems. J. Sci. Innov. 2011, 1, 1–18. [Google Scholar]
- Haus, T.; Car, M.; Orsag, M.; Bogdan, S. Identification results of an internal combustion engine as a quadrotor propulsion system. In Proceedings of the 2017 25th Mediterranean Conference on Control and Automation (MED), Valletta, Malta, 3–6 July 2017; pp. 713–718. [Google Scholar] [CrossRef]
- Chéron, C.; Dennis, A.; Semerjyan, V.; Chen, Y. A multifunctional HIL testbed for multirotor VTOL UAV actuator. In Proceedings of the 2010 IEEE/ASME International Conference on Mechatronic and Embedded Systems and Applications, Qingdao, China, 15–17 July 2010; pp. 44–88. [Google Scholar] [CrossRef]
- Chovancová, A.; Fico, T.; Chovanec, Ľ.; Hubinsk, P. Mathematical modelling and parameter identification of quadrotor (a survey). Procedia Eng. 2014, 96, 172–181. [Google Scholar] [CrossRef]
- Series 1580 Dynamometer Datasheet. Available online: https://cdn-docs.rcbenchmark.com/wp-content/uploads/2016/01/2016-02-04-RCbenchmark-1580-datasheet.pdf (accessed on 14 October 2019).
- Khan, W.; Nahon, M. Toward an accurate physics-based UAV thruster model. IEEE ASME Trans. Mechatron. 2013, 18, 1269–1279. [Google Scholar] [CrossRef]
- Brazinskas, M.; Prior, S.D.; Scanlan, J.P. An empirical study of overlapping rotor interference for a small unmanned aircraft propulsion system. Aerospace 2016, 3, 32. [Google Scholar] [CrossRef]
- Wang, B.; Hou, Z.; Liu, Z.; Chen, Q.; Zhu, X. Preliminary design of a small unmanned battery powered tailsitter. Int. J. Aerosp. Eng. 2016, 2016, 1–11. [Google Scholar] [CrossRef]
- Gatti, M.; Giulietti, F.; Turci, M. Maximum endurance for battery-powered rotary-wing aircraft. Aerosp. Sci. Technol. 2015, 45, 174–179. [Google Scholar] [CrossRef]
- Kotarski, D.; Piljek, P.; Brezak, H.; Kasać, J. Chattering free tracking control of a fully actuated multirotor with passively tilted rotors. Trans. Famena 2018, 42, 1–14. [Google Scholar] [CrossRef]
- Lee, B.S.; Tullu, A.; Hwang, H.Y. Optimal design and design parameter sensitivity analyses of an eVTOL PAV in the conceptual design phase. Appl. Sci. 2020, 10, 5112. [Google Scholar] [CrossRef]
- Gamazo-Real, J.C.; Vazquez-Sanchez, E.; Gomez-Gil, J. Position and speed control of brushless DC motors using sensorless techniques and application trends. Sensors 2010, 10, 6901–6947. [Google Scholar] [CrossRef] [PubMed]
- Kotarski, D.; Krznar, M.; Piljek, P.; Šimunić, N. Experimental identification and characterization of multirotor UAV propulsion. J. Phys. Conf. Ser. 2017, 870, 1–9. [Google Scholar] [CrossRef]
- PowerLog 6S Manual. Available online: https://www.progressiverc.com/media/PowerLog%206S%20Manual.pdf (accessed on 10 October 2019).
- Szafranski, G.; Czyba, R.; Błachuta, M. Modeling and identification of electric propulsion system for multirotor unmanned aerial vehicle design. In Proceedings of the 2014 International Conference on Unmanned Aircraft Systems (ICUAS), Orlando, FL, USA, 27–30 May 2014; pp. 470–476. [Google Scholar] [CrossRef]
- Sartori, D.; Yu, W. Experimental Characterization of a Propulsion System for Multi-rotor UAVs. J. Intell. Robot. Syst. 2019, 96, 529–540. [Google Scholar] [CrossRef]


| BLDC Motor Designation | ||||
|---|---|---|---|---|
| SE1806 | 2700 | 5″ | 3S | 20 A |
| BE1806 | 2300 | 5″ | 3S | 15 A |
| MN1806 | 1400 | 7″ | 3S | 15 A |
| MN2214 | 920 | 9–10″ | 3S | 20 A |
| MN4014 | 400 | 15–17″ | 4–6S | 40 A |
| EPU Setup | MN 1806–7024–3S | MN 2214–1040–3S | MN 4014–1760–6S | ||||||
|---|---|---|---|---|---|---|---|---|---|
| 4 | 6 | 8 | 4 | 6 | 8 | 4 | 6 | 8 | |
| (g) | 850 | 1050 | 1250 | 1150 | 1800 | 2400 | 3000 | 4700 | 6400 |
| (g) | 100 | 200 | 300 | 500 | 750 | 1000 | 2000 | 4000 | 6000 |
| (mAh) | 4000 | 5000 | 6000 | 5000 | 10,000 | 15,000 | 10,000 | 20,000 | 30,000 |
| (min) | 14.8 | 15.2 | 15.4 | 16.6 | 21.2 | 23.8 | 21.2 | 23 | 23.6 |
Publisher’s Note: MDPI stays neutral with regard to jurisdictional claims in published maps and institutional affiliations. |
© 2020 by the authors. Licensee MDPI, Basel, Switzerland. This article is an open access article distributed under the terms and conditions of the Creative Commons Attribution (CC BY) license (http://creativecommons.org/licenses/by/4.0/).
Share and Cite
Piljek, P.; Kotarski, D.; Krznar, M. Method for Characterization of a Multirotor UAV Electric Propulsion System. Appl. Sci. 2020, 10, 8229. https://doi.org/10.3390/app10228229
Piljek P, Kotarski D, Krznar M. Method for Characterization of a Multirotor UAV Electric Propulsion System. Applied Sciences. 2020; 10(22):8229. https://doi.org/10.3390/app10228229
Chicago/Turabian StylePiljek, Petar, Denis Kotarski, and Matija Krznar. 2020. "Method for Characterization of a Multirotor UAV Electric Propulsion System" Applied Sciences 10, no. 22: 8229. https://doi.org/10.3390/app10228229
APA StylePiljek, P., Kotarski, D., & Krznar, M. (2020). Method for Characterization of a Multirotor UAV Electric Propulsion System. Applied Sciences, 10(22), 8229. https://doi.org/10.3390/app10228229