Article

Refined Seismic Design Method for RC Frame Structures to Increase the Collapse Resistant Capacity

1
Key Lab of Structures Dynamic Behavior and Control of the Ministry of Education, Harbin Institute of Technology, Harbin 150090, China
2
Key Lab of Smart Prevention and Mitigation of Civil Engineering Disasters of the Ministry of Industry and Information Technology, Harbin Institute of Technology, Harbin 150090, China
*
Author to whom correspondence should be addressed.
Appl. Sci. 2020, 10(22), 8230; https://doi.org/10.3390/app10228230
Submission received: 16 October 2020 / Revised: 13 November 2020 / Accepted: 17 November 2020 / Published: 20 November 2020
(This article belongs to the Section Civil Engineering)

Abstract

:
In current structural design codes, elastic vibration modes are used for seismic design. However, when a structure is subjected to strong earthquakes and inelastic response or even when collapse damage is observed, the damage state is always unevenly distributed along the height of the structure. Such a phenomenon implies the materials of stories with elastic response and slight damage are not fully utilized. In this paper, a new practical and effective method, which improves collapse resistant capacity by making full use of materials, is proposed for reinforcement concrete (RC) frame structures at a structural collapse state. In this method, incremental dynamic analysis (IDA) is used to evaluate the structural collapse capacity. Tangent_ratio (TR) is formulated based on the IDA curves, and the longitudinal reinforcement of columns is modified based on the TR to achieve uniform distribution of damage along the height of building. Fewer variables are optimized and constraints of the provisions in current codes are considered, which makes the proposed procedure more computationally efficient and practical. The proposed method is employed on a 5-story RC frame structure to illustrate its feasibility and practicality. Comparison work indicates that the refined seismic design method can significantly increase the collapse resistant capacity and decrease the maximum inter-story drift ratio response under strong ground motion in a few iterative steps without a cost increase.

1. Introduction

A force-based method is adopted in current seismic design codes. It regards the earthquake loads as equivalent lateral inertia force consistent with the fundamental elastic vibration modes of structures [1,2,3,4]. During a whole structural design service life, the occurrence probability of strong earthquakes which exceed the design earthquake intensity cannot be neglected [5,6]; they may lead to inelastic response, and even more structurally collapse occasionally. Previous experimental and analytical studies showed that buildings which were designed by current codes exceeded the elastic limits and performed inelastic seismic demands under rare earthquakes [7,8,9,10,11].
Many studies have been carried out to achieve a status of uniform seismic demands. In these studies, pushover analysis was conducted to calculate the inelastic seismic demands [12,13,14,15,16]. However, pushover analysis cannot consider the higher vibration modes or dynamic characteristics of the earthquake loadings. Consequently, pushover analysis had limitations for the accurate prediction of inelastic seismic demands, especially for a severe damage state [17,18]. Meanwhile, the cross sections of the structural loading bearing elements were set as the optimization variables, which might lead to unpractical sizes of cross sections [19].
To integrate closely with the seismic design procedure in present design codes, extensive studies have been conducted on proposing a modified lateral load pattern to achieve uniform seismic demands while other procedures remain unchanged. Lee [20] and Chao [21] concluded that the earthquake-induced story shear forces were different from the forces determined by the lateral force pattern in the seismic design codes. New lateral load patterns, which consider the effects of higher vibration modes and the inelastic behavior of structures under earthquake excitations, were proposed. Mohammadi [22] and Moghaddam [23] proposed the theory of uniform deformation. Afterwards, various related investigations [24,25,26,27,28,29,30] were conducted based on this theory to optimize lateral load patterns for frame structures under a series of real and synthetic earthquake records. The input earthquake records were scaled to a specific intensity to match with the design spectra. Meanwhile, the influences of the dynamic characteristics of earthquake ground motion and structural parameters were also discussed. Ganjavi [31,32] and Lu [33] investigated the influence of the soil–structure interaction on the optimized lateral load pattern for a uniform distribution of seismic demands along the height of buildings. Li [34] proposed an analytical formula of the lateral load pattern for multi-story buildings to increase the collapse resistant capacity. It showed that the optimized lateral load pattern leads to lower collapse probability than that of the conventional seismic design method with the same construction cost. The advantages of the optimized lateral load pattern were demonstrated, but the shear-beam model used in these studies cannot provide accurate seismic response predictions under severe earthquakes. In addition, most optimized lateral load patterns were impractical because of ignoring the constrained provisions in the design codes.
Various studies were conducted on the optimum seismic design by optimizing the cross section of the structural elements considering inelastic performance under severe earthquakes [35,36,37]. A heavy computer calculation cost was needed and multiple cross sections were designed, which are unacceptable in practical application.
The aforementioned studies have shown the advantages of optimum seismic design methods based on the theory of uniform seismic demands, while limitations still exist. Though new lateral load pattern oriented research works can be nested in the seismic design procedure in current codes, the adopted lumped mass finite element model cannot accurately predict the strong nonlinear response under severe earthquake ground motion, and cannot catch the element damage without consideration of the constrained provisions in codes (e.g., minimum and maximum reinforcement ratio, strong column and weak beametc). Moreover, most optimized lateral load patterns cannot be directly applied to other structure types. Optimization methods in terms of variables relating to the cross section of structure elements are often of expensive computation cost and/or complex mathematical calculation requirements, which makes them not applicable for engineers. Additionally, most previous investigations were performed in terms of a certain earthquake intensity corresponding to exceedance probabilities of 10% or 2% in 50 years. However, earthquakes larger than the design level also have a relatively noticeable probability of occurrence.
Previous post-earthquake disaster surveys showed that the multi-story frame structures had more reported collapse damages with higher risks than those of high-rise frame structures. Frame structures could be used to strengthen and retrofit multi-story structures (e.g., a masonry structure) [38,39,40,41]. It is important to investigate the optimum design method of frame structure towards increasing its collapse resistant capacity under earthquakes. In this study, a refined seismic design method for reinforcement concrete (RC) frame structures is developed at the state of collapse damage using incremental dynamic analysis (IDA). The proposed method is aimed at improving the structural collapse resistant capacity with limited computation cost, while the structure construction cost remains unchanged. The efficiency and implementation of the proposed method are demonstrated by optimizing a five-story RC frame structure design.

2. Refined Seismic Design Methodology

In the Code for Seismic Design of Buildings in China (CSDBC) [4], the structures are designed to be undamaged under earthquake intensity corresponding to a 63.2% probability of exceedance, repairable under the earthquake intensity with a 10% probability of exceedance, and to not collapse subjected to earthquake intensity with a 2–3% probability of exceedance, all referring to a 50-year return period. These seismic fortification objectives are called three levels of seismic fortification. The code-based seismic fortification objectives are expected to be satisfied in this study
Collapse evaluation is the basis of this study. IDA is generally applied for the seismic collapse evaluation of structures. The IDA can efficiently describe the whole process of a structure from elastic state to inelastic range until collapse damage occurs. IDA involves subjecting the structure to a set of ground motions and incrementally scaling the records to multiple levels of intensity, subsequently developing a group of curves of seismic demand parameters versus earthquake intensity levels [42]. Inter-story drift ratio and the 5% damped spectral acceleration, Sa(T1, 5%), corresponding to the structural fundamental period, are applied as the structural seismic demand parameter and earthquake intensity parameter, respectively. As suggested in FEMA P695 [43], the point on the IDA curve, which has a tangent slope that reduces to 20% of the initial elastic slope of the curve, is defined as the structural collapse capacity point. Therefore, the tangent slope of adjacent points on the IDA curve is a crucial parameter which can directly represent collapse state. Accordingly, as shown in Figure 1, Tangent_ratio (TR) is formulated as the ratio of the tangent slope of the adjacent points on the IDA curve of the story and the initial elastic slope of the curve, and it can be calculated by Equations (1)–(3).
T R i = T a n g e n t i , c T a n g e n t i , initial
T a n g e n t i , c = I M i , c I M i , c 1 E D P i , c E D P i , c 1
T a n g e n t i , initial = I M i , 1 E D P i , 1
where I M i , c and I M i , c 1 are the earthquake intensities of the structural collapse point and the point on the IDA curve before the collapse point for ith story, respectively; T R i is the TR of the ith story; T a n g e n t i , c is the tangent slope of the collapse point and the step before the collapse damage state on the IDA curve for the ith story; T a n g e n t i , initial is defined as the initial slope of the IDA curve of the ith story; E D P i , c and E D P i , c 1 are the seismic demands of the ith story under the ground motion intensity I M i , c and I M i , c 1 , respectively; and the I M i , 1 and E D P i , 1 are the seismic intensity and the seismic demand of the ith story at the first step of IDA, separately. Referring to the evaluation of structural collapse in FEMA P695 [43], the structure collapses when the TR reduces to less than 20%.
In this study, in order to visually represent whether on each floor of the structure there occurs collapse damage, TR is selected as the story damage index for refining the seismic design method. The refined design is to achieve a state tending to be TR uniformly distributed along the height of the building when the building collapses. The structural configuration is pre-decided according to the structural space and occupancy requirements. It is impractical to change the concrete and the sizes of the components due to the structural construction practice limitation. Furthermore, the collapse evaluation of the structure under earthquake ground motions based on IDA is relatively time-consuming, so the number of optimization variables influences the efficiency of the optimization procedure. The columns are crucial components for resisting lateral loads. The capacity of them is significantly influenced by the amount of longitudinal steel reinforcement. Accordingly, the longitudinal steel reinforcements of columns are selected as the optimization variables considered in developing the refined seismic design method in this study. The following procedure is presented to obtain a state of uniform TR distribution along the height of the building based on the IDA for a specific earthquake ground motion:
(1)
Design a structure according to the current design code, such as CSDBC [4].
(2)
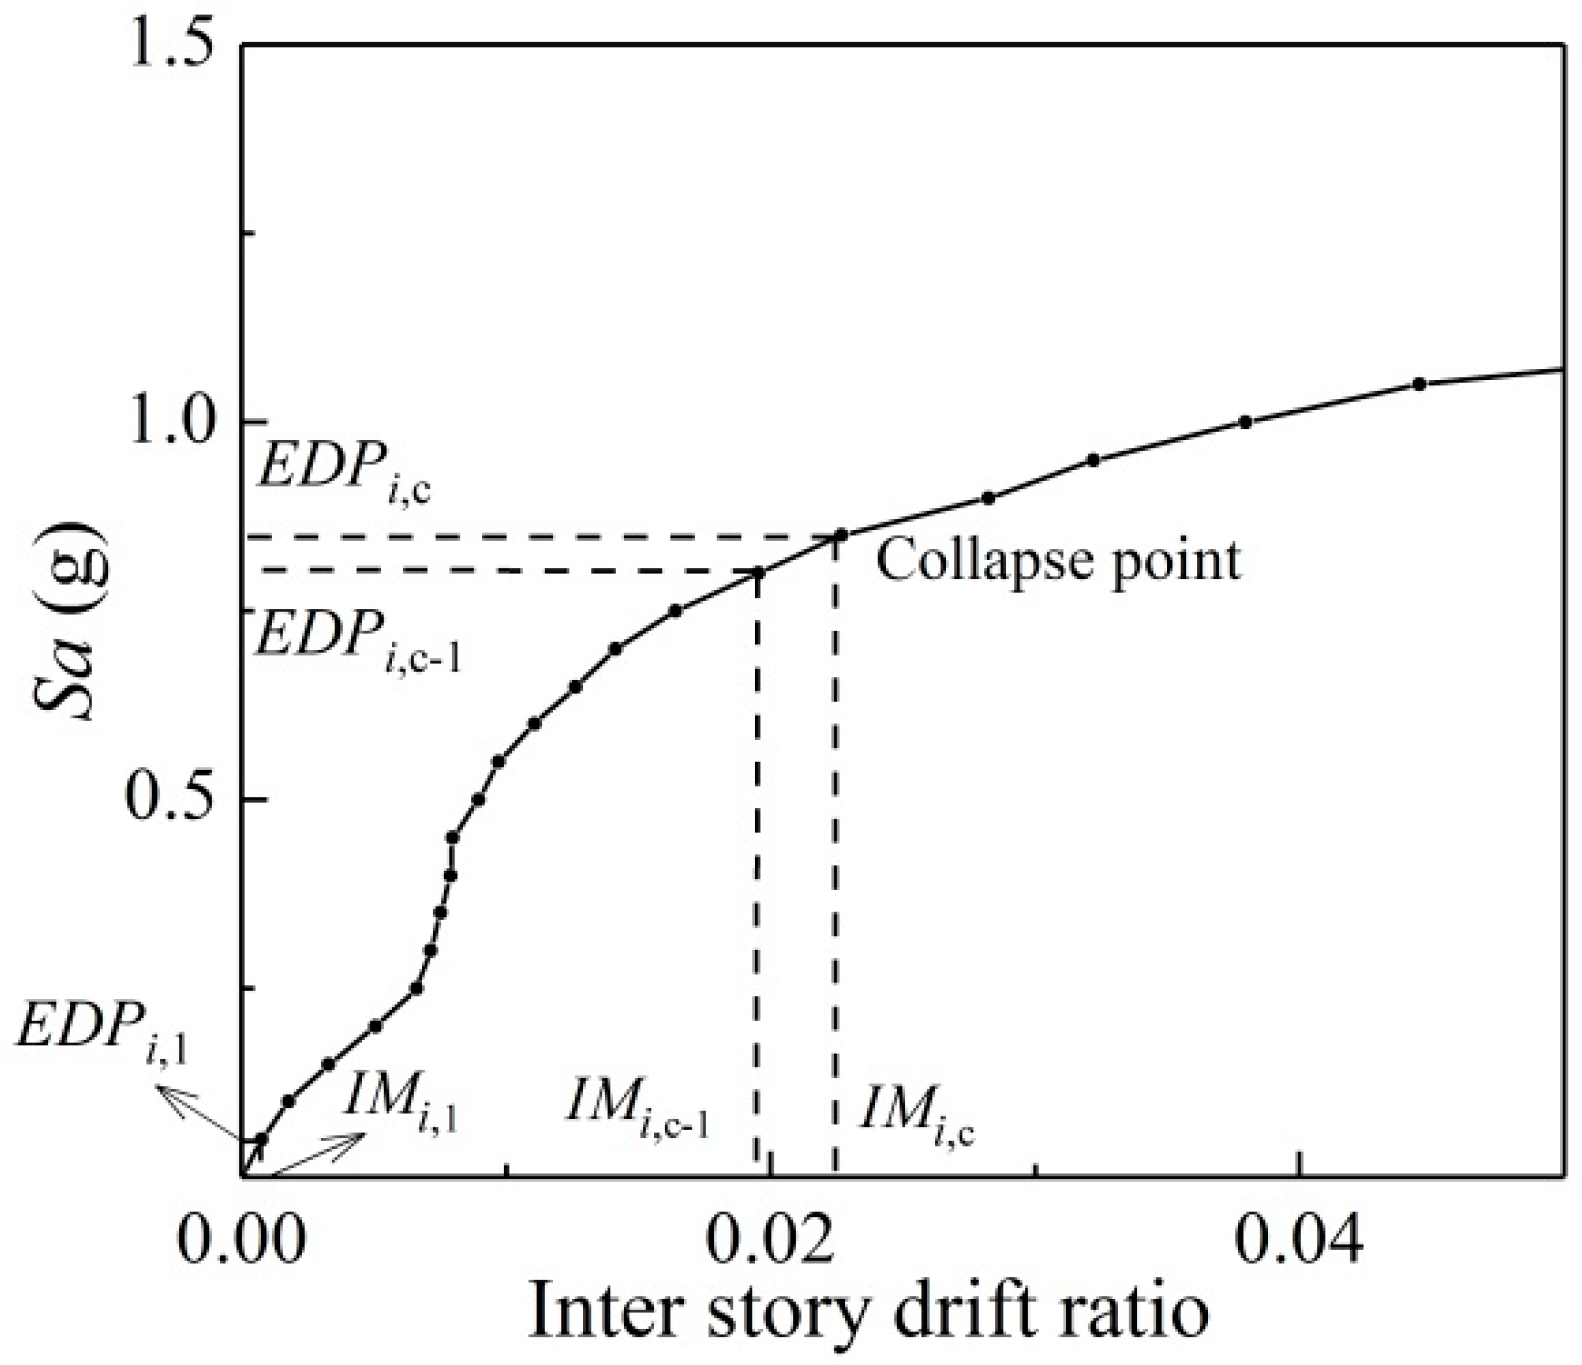
Establish the numerical model of the designed building, and perform IDA to determine the collapse capacity under the selected earthquake ground motion. Then, the intensity of the earthquake ground motion relating to the state of structural collapse damage can be obtained and recorded as I M c .
(3)
Scale the intensity of selected ground motion to I M c , I M c 1 , and I M 1 , and perform the dynamic analysis to derive the seismic demand of the structure. Calculate the TR of each floor using the Equations (1)–(3).
(4)
Based on the calculation results of TR, calculate the coefficient of variation of TR based on the Equation (4).
C o v = 1 n i = 1 n ( T R i , c T R average , c ) 2 T R average , c
where Cov is the coefficient of variation of T R i , c ; n is the number of the structure floor; and T a n g e n t average , c is the average value of T R i , c .
(5)
If the value of Cov reduces to a pre-determined target value, that means the code-based structure has a relatively uniform TR distribution along the height of the building while the structure collapses, and no redesign is needed; otherwise, an iterative procedure is proceeded, where the longitudinal steel reinforcement of columns is sequentially modified using Equations (5) and (6) until the value of Cov reduces to small enough (e.g., less than 0.5).
A s i j = ( T R i j 1 T R average j 1 ) α A s i j 1
A s i j = i = 1 n A s i i = 1 n A s i j
where A s i j and A s i j 1 are the dimension of the longitudinal steel reinforcement for one column on the ith floor at the jth and (j − 1)th iteration, respectively; T R i , c j is the TR of ith floor at (j − 1)th iteration; T R average , c j is the average of TR of each floor at (j − 1)th iteration; and α in Equation (5), which controls the convergence gradient, is a coefficient ranging from 0 to 1. Based on the previous studies [22,23,24,25,26,27,28,29], α is set as 0.02 for this study. In order to keep the same construction cost, the Equation (6) is utilized to adjust the sum of longitudinal steel reinforcement of candidate design to that of code-based structure. i = 1 n A s i j is the sum of A s i j ; i = 1 n A s i j is the sum of longitudinal steel reinforcement for a code-based structure; A s i j is the updated dimension after scaling the optimized results to the sum of longitudinal steel reinforcement for a code-based structure.
It should be clarified that the diameters and numbers of the longitudinal steel bars in each side of the column section are assumed herein to be the same for simplification purposes and engineering practicability. Meanwhile, the dimension of the steel bars is assumed to be continuous during the iterations; then, the proper steel bars are selected with the bars available in commerce, trying to be close to the optimization results at the last step. A suite of constraints should be preliminarily checked for every candidate design to make sure that the candidate designs have a desirable performance under earthquake loads and satisfy the requirements set in the provisions of the conventional seismic design code. The longitudinal steel reinforcement should meet the minimum and maximum reinforcement requirements simultaneously at each iterative cycle to avoid brittle failure and concrete crushing without steel yielding. This constraint is expressed in Equation (7).
A s min A s i j A s max
where A s min and A s max are the minimum and maximum dimension of longitudinal steel reinforcement complying with the criteria in the current code [4], respectively. If the calculated A s i j by Equation (5) is smaller than A s min , set the value of A s i j as the value of A s min ; and if the calculated A s i j by Equation (5) is bigger than A s min , set the value of the A s i j as the value of A s max .
The proposed optimization procedure is summarized in Figure 2. At the same time, the diameter of the longitudinal steel of columns and the shear confinement reinforcement for columns and beams should be checked. Using big diameter bars for columns can effectively achieve the “strong columns and weak beams” philosophy, to a certain extent. Adequate shear confinement reinforcement for columns and beams can guarantee that the beam-column joints are rigid without joint failure and strong enough to resist shear capacity. Therefore, the optimal design still meets the requirements of the “strong joints, weak components” and “strong shear, weak flexural’’ criteria in current code.
In this study, the proposed refined seismic design method presents an appropriate strategy for the phenomenon of non-uniform distribution at the state of structural collapse. An iterative routine was proposed to efficiently develop optimization designs. The proposed methodology contains analysis and redesign in each iteration: (1) analyze dynamic response at the specific intensities of ground motion to calculate the TR of every floor based on the collapse analysis utilizing IDA; (2) modify the longitudinal steel reinforcement of all columns until converging on a uniform state of TR along the height of the building at the state of structural collapse failure.
In the proposed methodology, the longitudinal steel of all columns has been considered as an independent optimal variable, which contributes to a significant number decrease of the required optimization variables driving to a more practical, straightforward mathematical and computationally efficient optimization design. The independent relationship between the optimized results and ground motion intensity was summarized in most previous research. This conclusion is rashly arbitrary, since the previous studies minimized the structural materials to obtain a new lateral load pattern with uniform distribution of a specific target deformation utilizing the simplified shear-building model, which is definitely different from this study. Thus, the independence is not applicable for all situations. The specific target deformation is not equivalent to structural collapse, which means the optimized lateral force pattern cannot result in uniform damage distribution when the structure undergoes collapse damage. Considering these factors, a refined seismic design method is developed to realize uniform or near-uniform distribution of TR, which is the important parameter for determining structural collapse with a refined finite element model based on collapse evaluation using IDA. The iteration loop is repeated under the earthquake intensity corresponding to the collapse capacity of the initial code-designed structure without updating the collapse earthquake intensity of modified structure. It can avoid the re-IDA of a modified structure and significantly reduce the computational cost. Moreover, the proposed optimization procedure corresponds closely with the construction practice limitations and constraints set by the provisions of the current design code (e.g., minimum reinforcement, “strong joints, weak elements”, etc.). The advantages of this refined design method are obvious.

3. Simulation Case

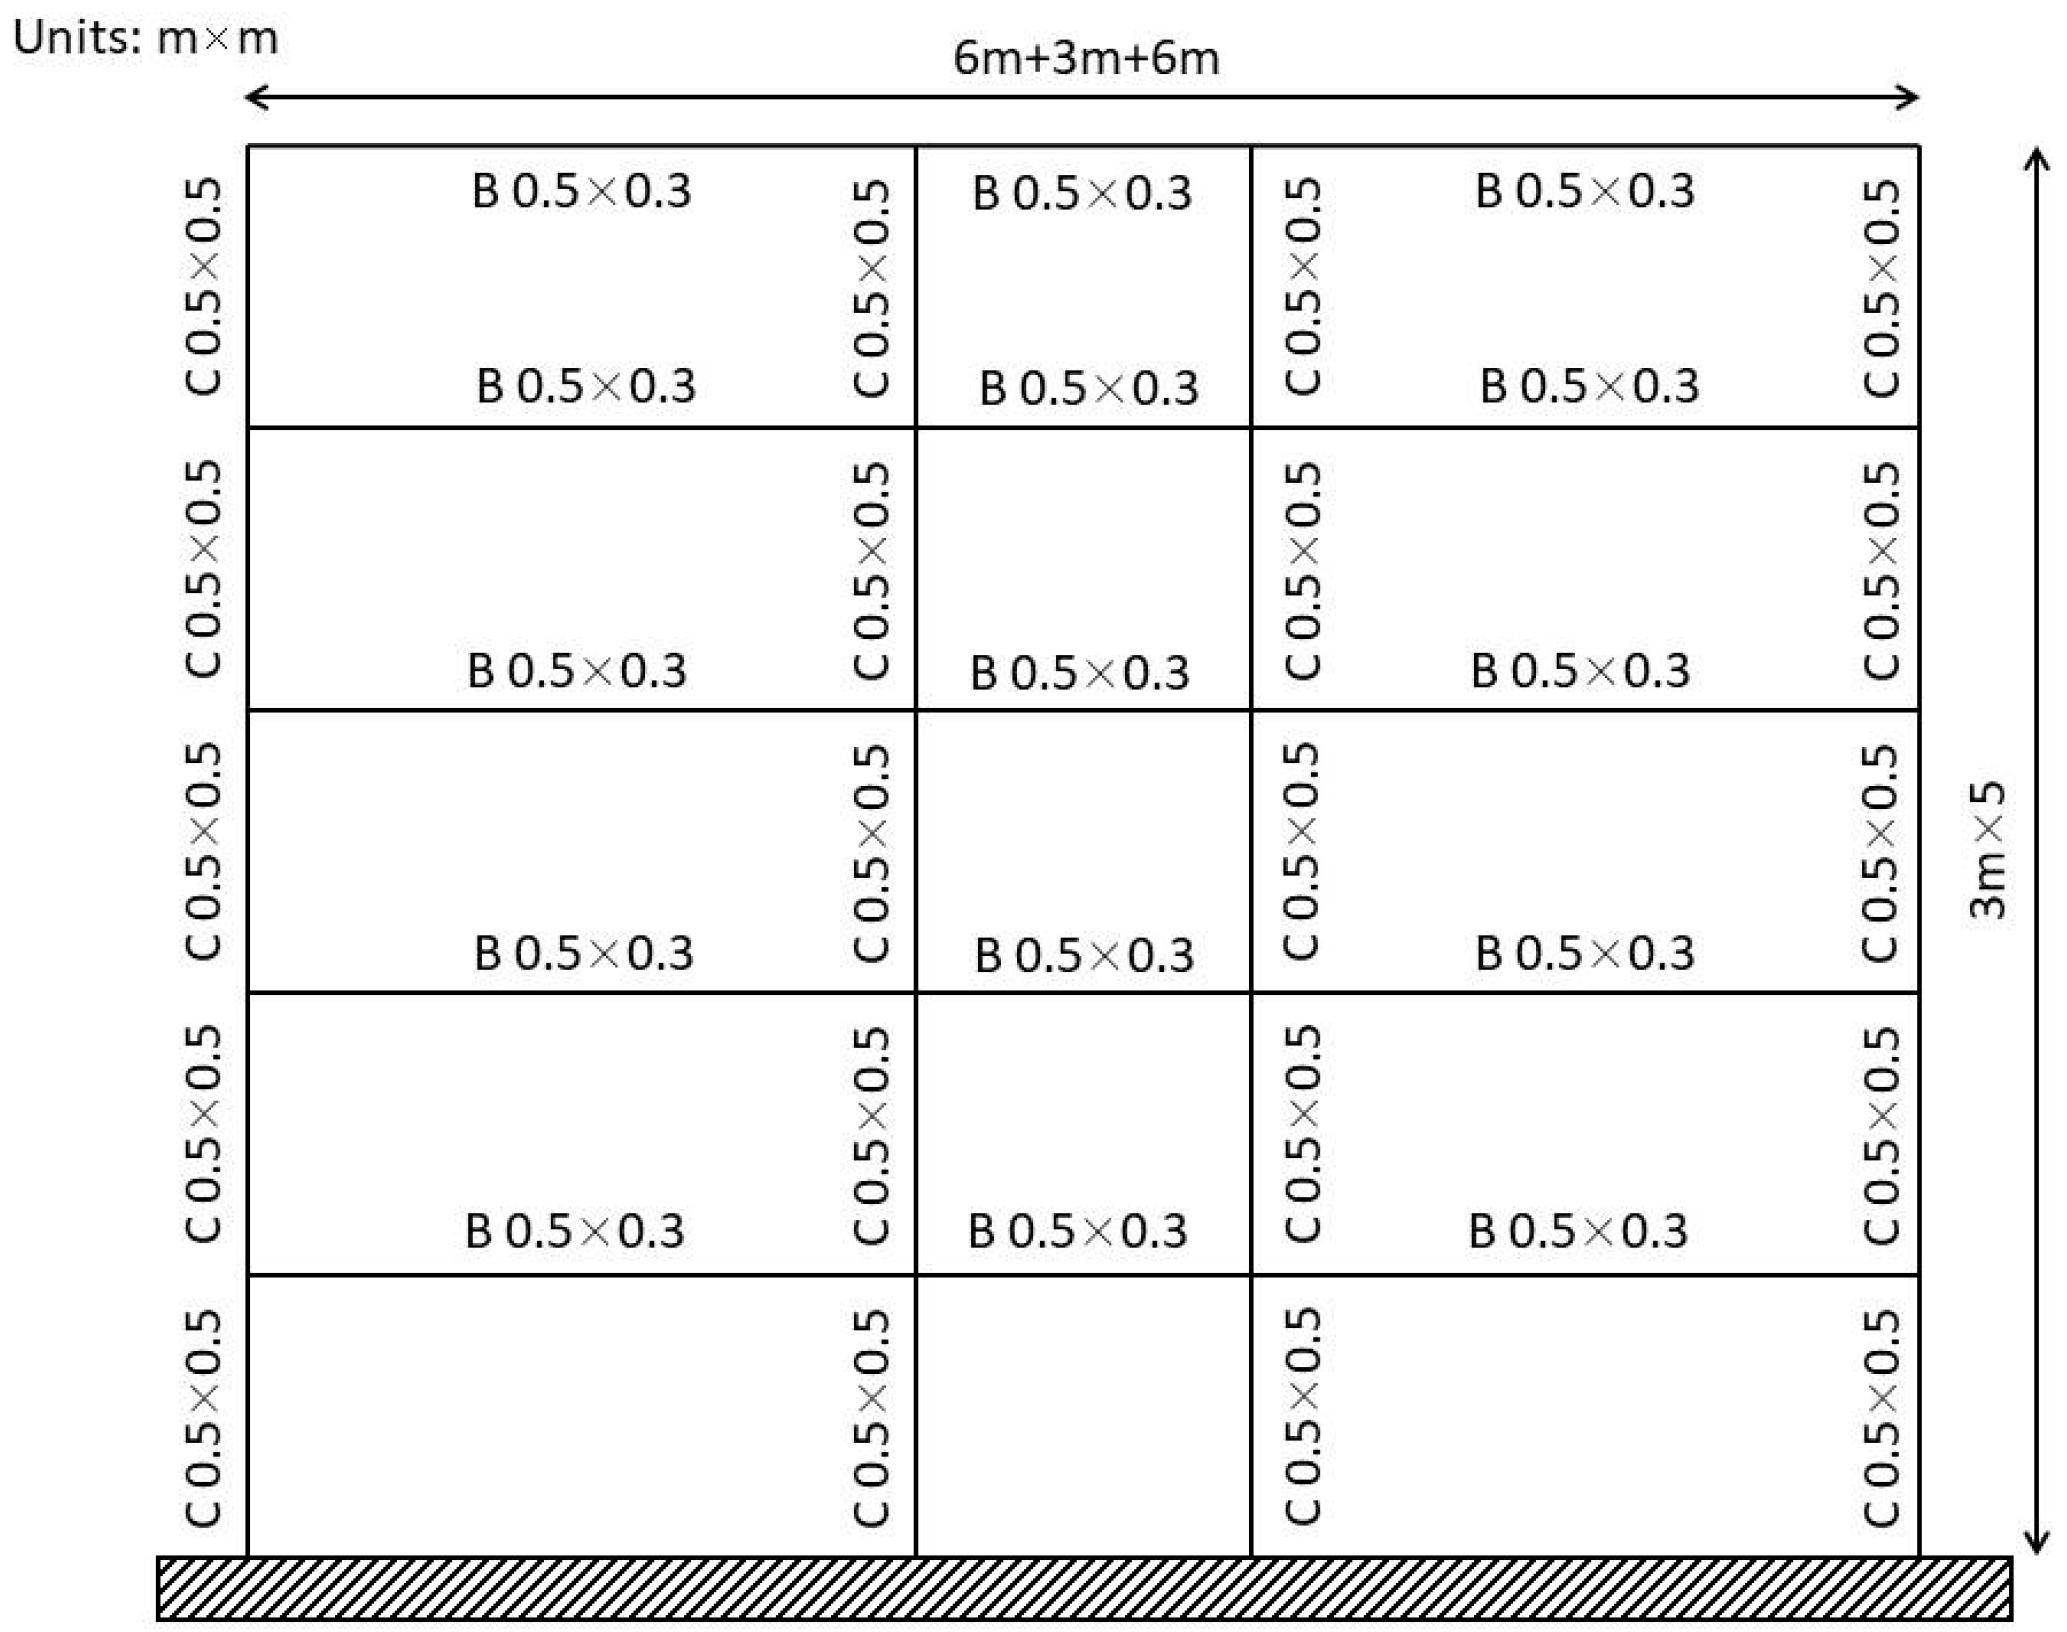
3.1. Simulation Structure

In this study, the proposed optimum methodology is applied on a 5-story structure (shown in Figure 3) to verify the feasibility and desirability. The 5-story RC frame structure with 3 bays is designed according to CSDBC [4]. The building is assumed to be constructed in a region of earthquake fortification intensity 8 with 0.2 g peak ground acceleration and a site soil classification Class Ⅱ with a first design earthquake group of CSDBC [4]; and this building has a story height of 3 m on all stories. The lateral-force resisting structure system consists of two orthogonal systems. One is three bays with a bay span of 6 m on both sides and a small bay span of 3 m in the middle bay. The other direction is six bays with the same bay span of 6 m. The plan dimensions are 15 m and 36 m. The dead loads for interior and top story are 6.0 kN/m2 and 5.0 kN/m2, respectively, and the live separately are 2.0 kN/m2 and 1.5 kN/m2. HRB335 with the design tension strength 335 N/mm2 and elastic modulus 2.0 × 10⁵ N/mm2 is selected as the reinforcement material for all the beams and columns. The cross section and reinforcement of the beams and columns, which are designed by the CSDBC [4], are shown in Table 1.
The dynamic characteristic analysis and nonlinear time history analysis of the structure were developed by the OpenSees software platform (Version 2. 5. 0, The Regents of the University of California, Berkeley, CA, USA, 2016) [44]. Nonlinear fiber elements are used to model the structure beams and columns. Uniaxial materials Concrete02 and Steel02 are selected for concrete and steel simulation, respectively. The Rayleigh damping ratio of 0.05 recommended by CSDBC [4] is adopted. The P-Delta transformation of geometrics stiffness is used for the P-Delta effects. Dynamic characteristics analysis is conducted based on this numerical model, and the fundamental period of this building is 0.79 s.

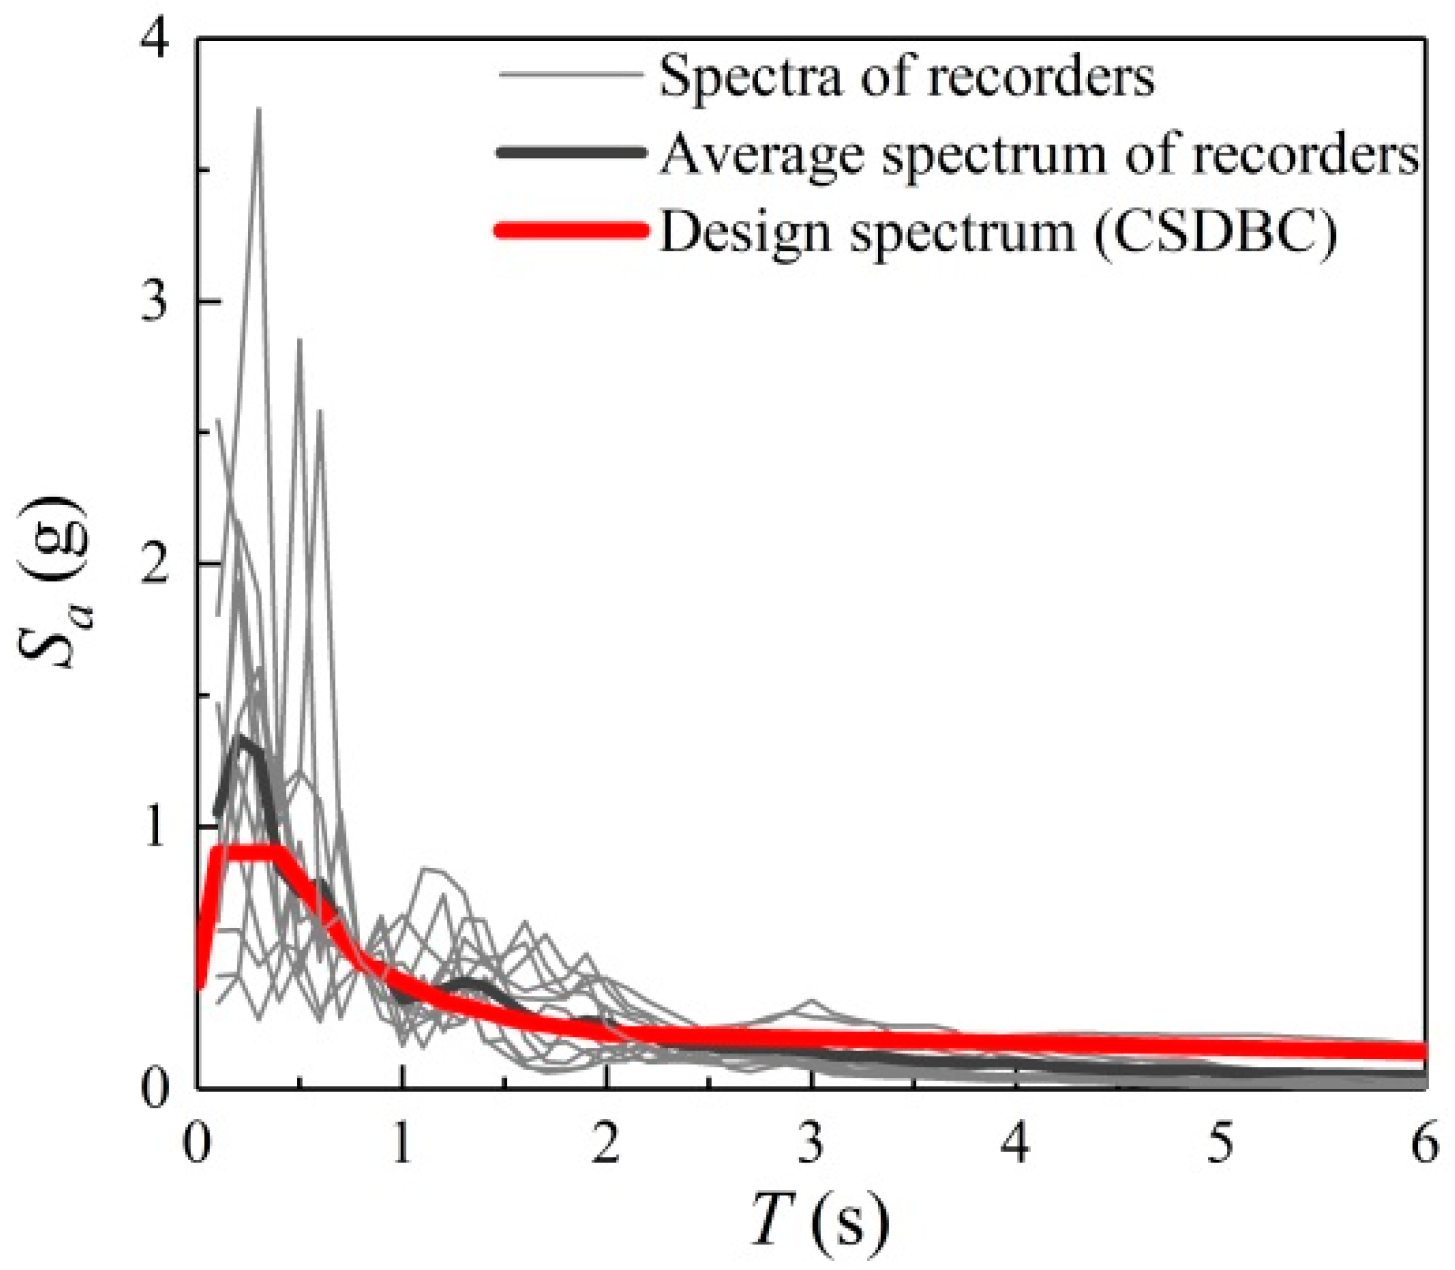
3.2. Selected Earthquake Ground Motions

Considering the uncertainty of an earthquake, at least 11 ground motion records are required according to ATC-58 [45] to develop relatively accurate seismic demands of the buildings. Incorporating the seismicity characteristics of the assumed site, a number of 11 earthquake records, listed in Table 2, were selected from the 22 far-field ground motions involving 44 horizontal earthquake components recommended in FEMA P695 [43]. The referent earthquake database has been thoroughly selected for a reasonable representation of the randomness of strong ground motions that may lead a building to the collapse damage state. To comprehensively consider the design spectrum matching and soil–structure interaction and to avoid specific earthquake event dominant-based bias during the selection process, this record group is generally employed for the seismic collapse assessment of buildings. Details of this referent record group are explained in FEMA P695 [43]. As shown in Figure 4, the average spectrum of the selected 11 ground motions is well matched to the design spectrum of severe earthquake intensity in CSDBC [4].

4. Optimum Design for a Single Earthquake Ground Motion

The CSDBC-designed 5-story RC frame structure is optimized, implementing the proposed optimization method subjected to a ground motion (San Fernando, 1971, RSN68). Figure 5 illustrates Cov, TR for each floor and the longitudinal reinforcement dimension of single columns for each floor from the CSDBC-designed structure tending to the final optimization design. As shown in Figure 5a,b, the proposed method eventually converges on a near-uniform distribution of TR until the variable coefficient of TR meets the constraint requirement with few iterative loops. It should be classified that the value of TR sometimes is negative, which results from the non-monotonic and back-and-forth twisting behaviors of the IDA curves. Further elaboration of these behaviors can be found in the original investigation of IDA [45]. It is shown in Figure 5c that the longitudinal reinforcement dimension of single column on the fourth and fifth floors eventually converged on the minimum reinforcement based on the constraints in CSDBC [4]. It indicates the necessity of the consideration of the constrained provisions in the optimization procedure. During the optimization procedure, the reinforcements of the fourth and fifth floors are gradually transferred to the first three floors with most materials being moved to the second floor.
The TR distribution along the height of the building under the earthquake intensity corresponding to the collapse state of the code-designed structure, the longitudinal reinforcement dimension of a single column for each story, and IDA curves for each story for the code-designed and optimized structure are compared in Figure 6. As shown in Figure 6a, this proposed optimization procedure is feasible, and can efficiently achieve a close-to-uniform distribution of TR along the height of the building. It is difficult to achieve an absolutely uniform distribution of TR because of the constraints setting in the iterative cycle. After optimization, the TR of each floor is greater than 20%. This implies that the optimized structure will not collapse under the collapse intensity of the code-designed building. In other words, the proposed optimization method can feasibly increase the structural collapse resistant capacity without a construction cost increase. For this ground motion, most reduced reinforcement in the fourth and fifth floor is moved to the second floor, and the reinforcement increase of the first and third floor is almost the same. It can be seen in Figure 6c that the first story of the code-designed structure collapses at earthquake intensity of 0.9 g, while the second story collapses for the optimized structure at 1.3 g. The collapse resistant capacity of the structure increases by 44.4% from 0.9 g to 1.3 g. At the same time, the maximum inter-story drift ratio response decreases for the first story at the inelastic range. It should be noted that the change of reinforcement of columns does not lead to a change of seismic demand in the elastic range. This should clarify the dependence between the optimized results and the ground motion intensity. Consequently, it should be emphasized that using the design intensity or severe intensity of the ground motion to develop the optimization design of the structure is unreasonable. When the earthquake is strong enough to develop an inelastic structural response, the optimum design method based on the theory of uniform deformation make sense. With the increase of the earthquake intensity, the structure suffers elastic deformation toward the inelastic range until structural collapse occurs. The seismic demand of the first story (the collapse story of the code-designed structure) decreases with the inelastic deformation development of the structure, while the decrease range increases with the inelastic deformation increasing. For other stories, the inter-story ratio increases lightly. The Figure 6c shows that the maximum inter-story drift ratio of the optimized structure is smaller than that of a code-designed structure under the same intensity of ground motion, and the code-based structure meets the three levels of earthquake fortification requirements. Therefore, one can directly conclude that the optimized building also satisfies the requirements of earthquake fortification. Furthermore, the second story IDA curve of the optimized structure (in Figure 6c) shows that the slope of the IDA curve does not change very much after the collapse point; and the elastic response of the structure is unaffected by the variation in the longitudinal steel of the column. This means the initial slope of IDA remains unchanged after optimization. Therefore, for the optimized structure, the TR slightly decreases after the collapse point. This means the structure reaches the numerical collapse point rather than the real collapse damage. However, the IDA curve of the code-designed structure is close to a straight horizontal line, which means the code-designed structure suffers the real collapse damage. This phenomenon implies that the optimization method significantly improves the structural collapse resistant capacity more than that of the calculated increase with same construction cost.

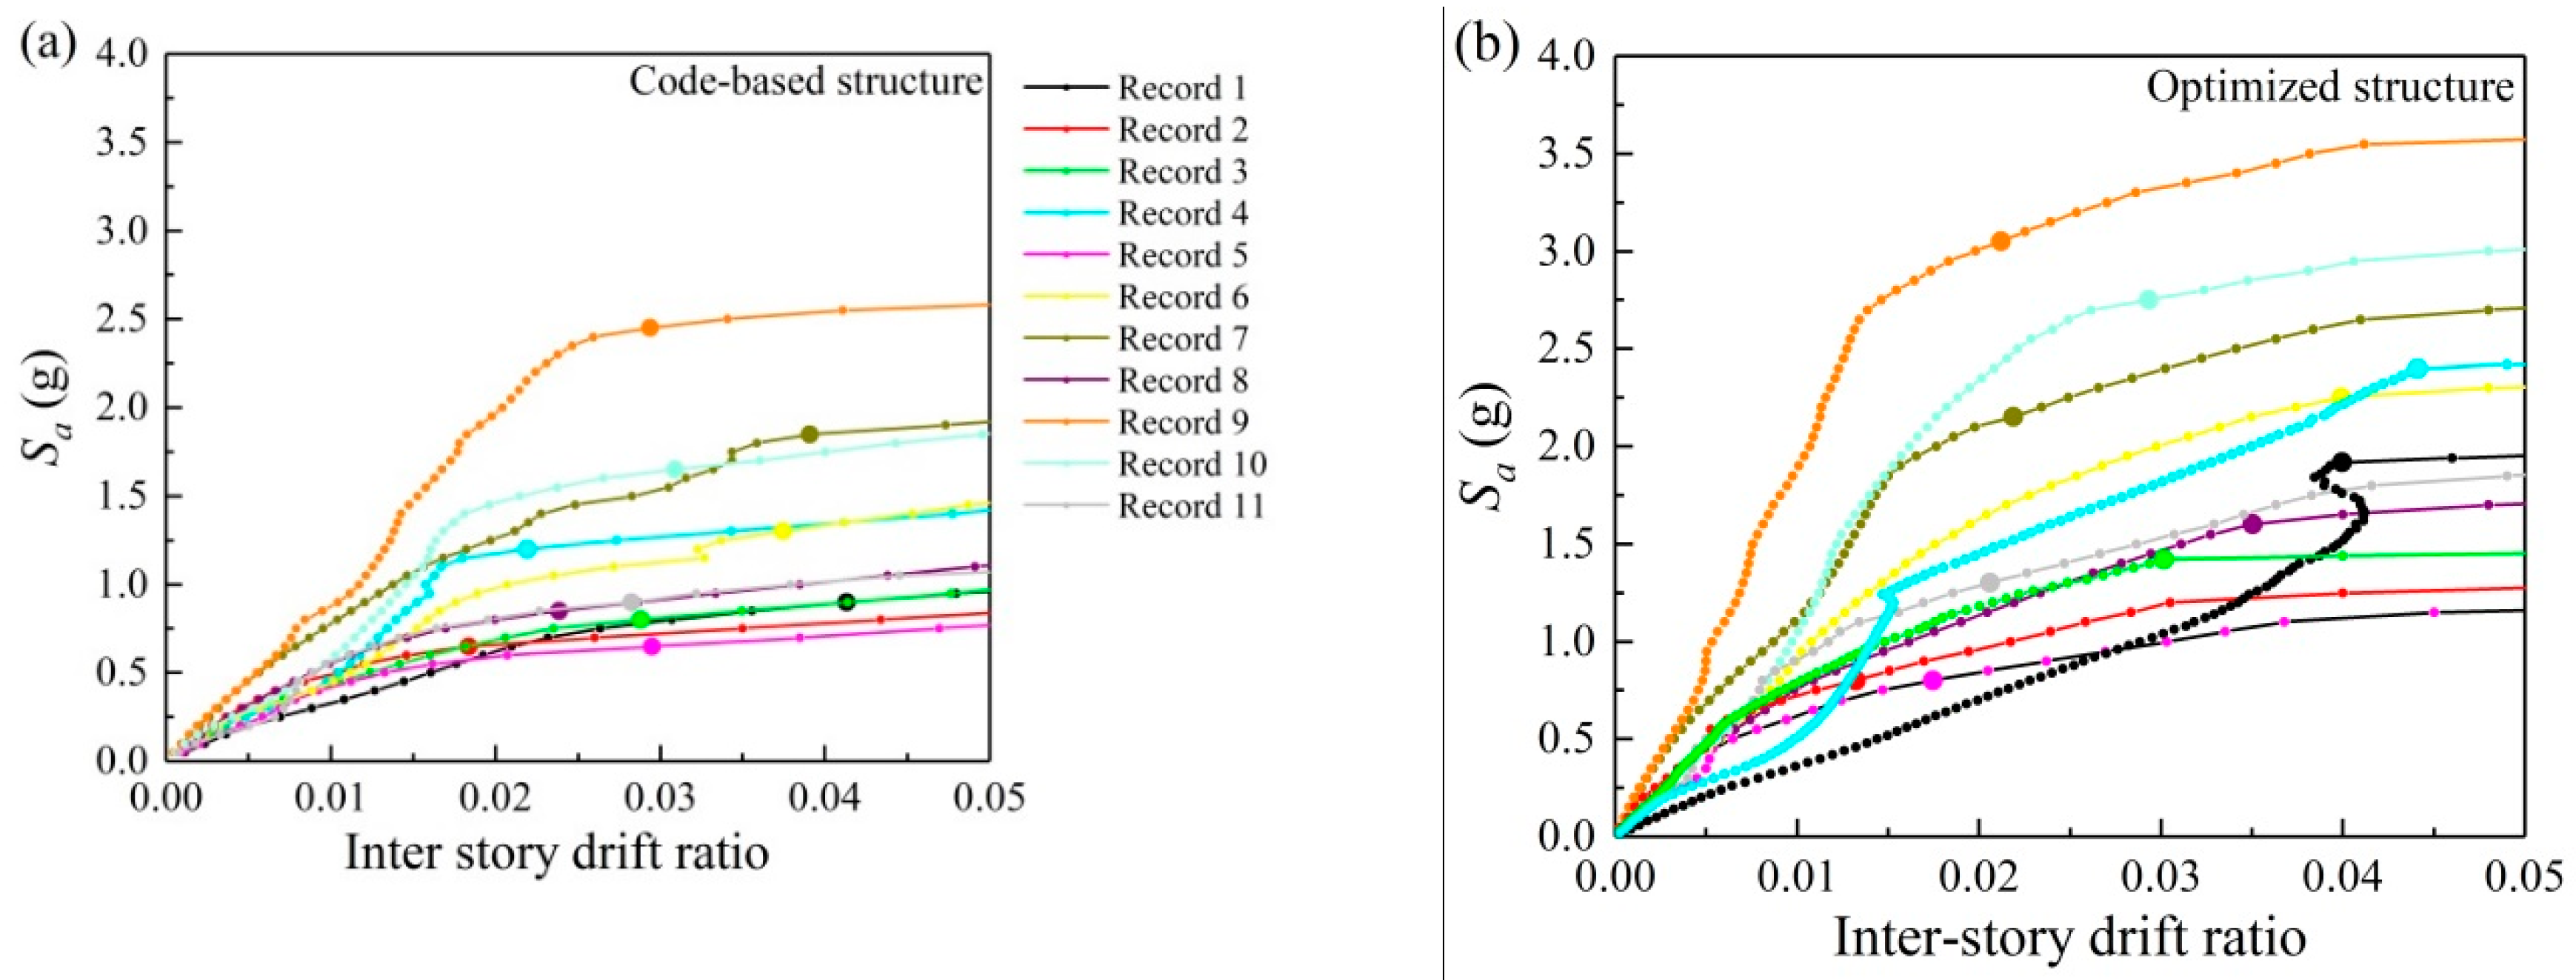
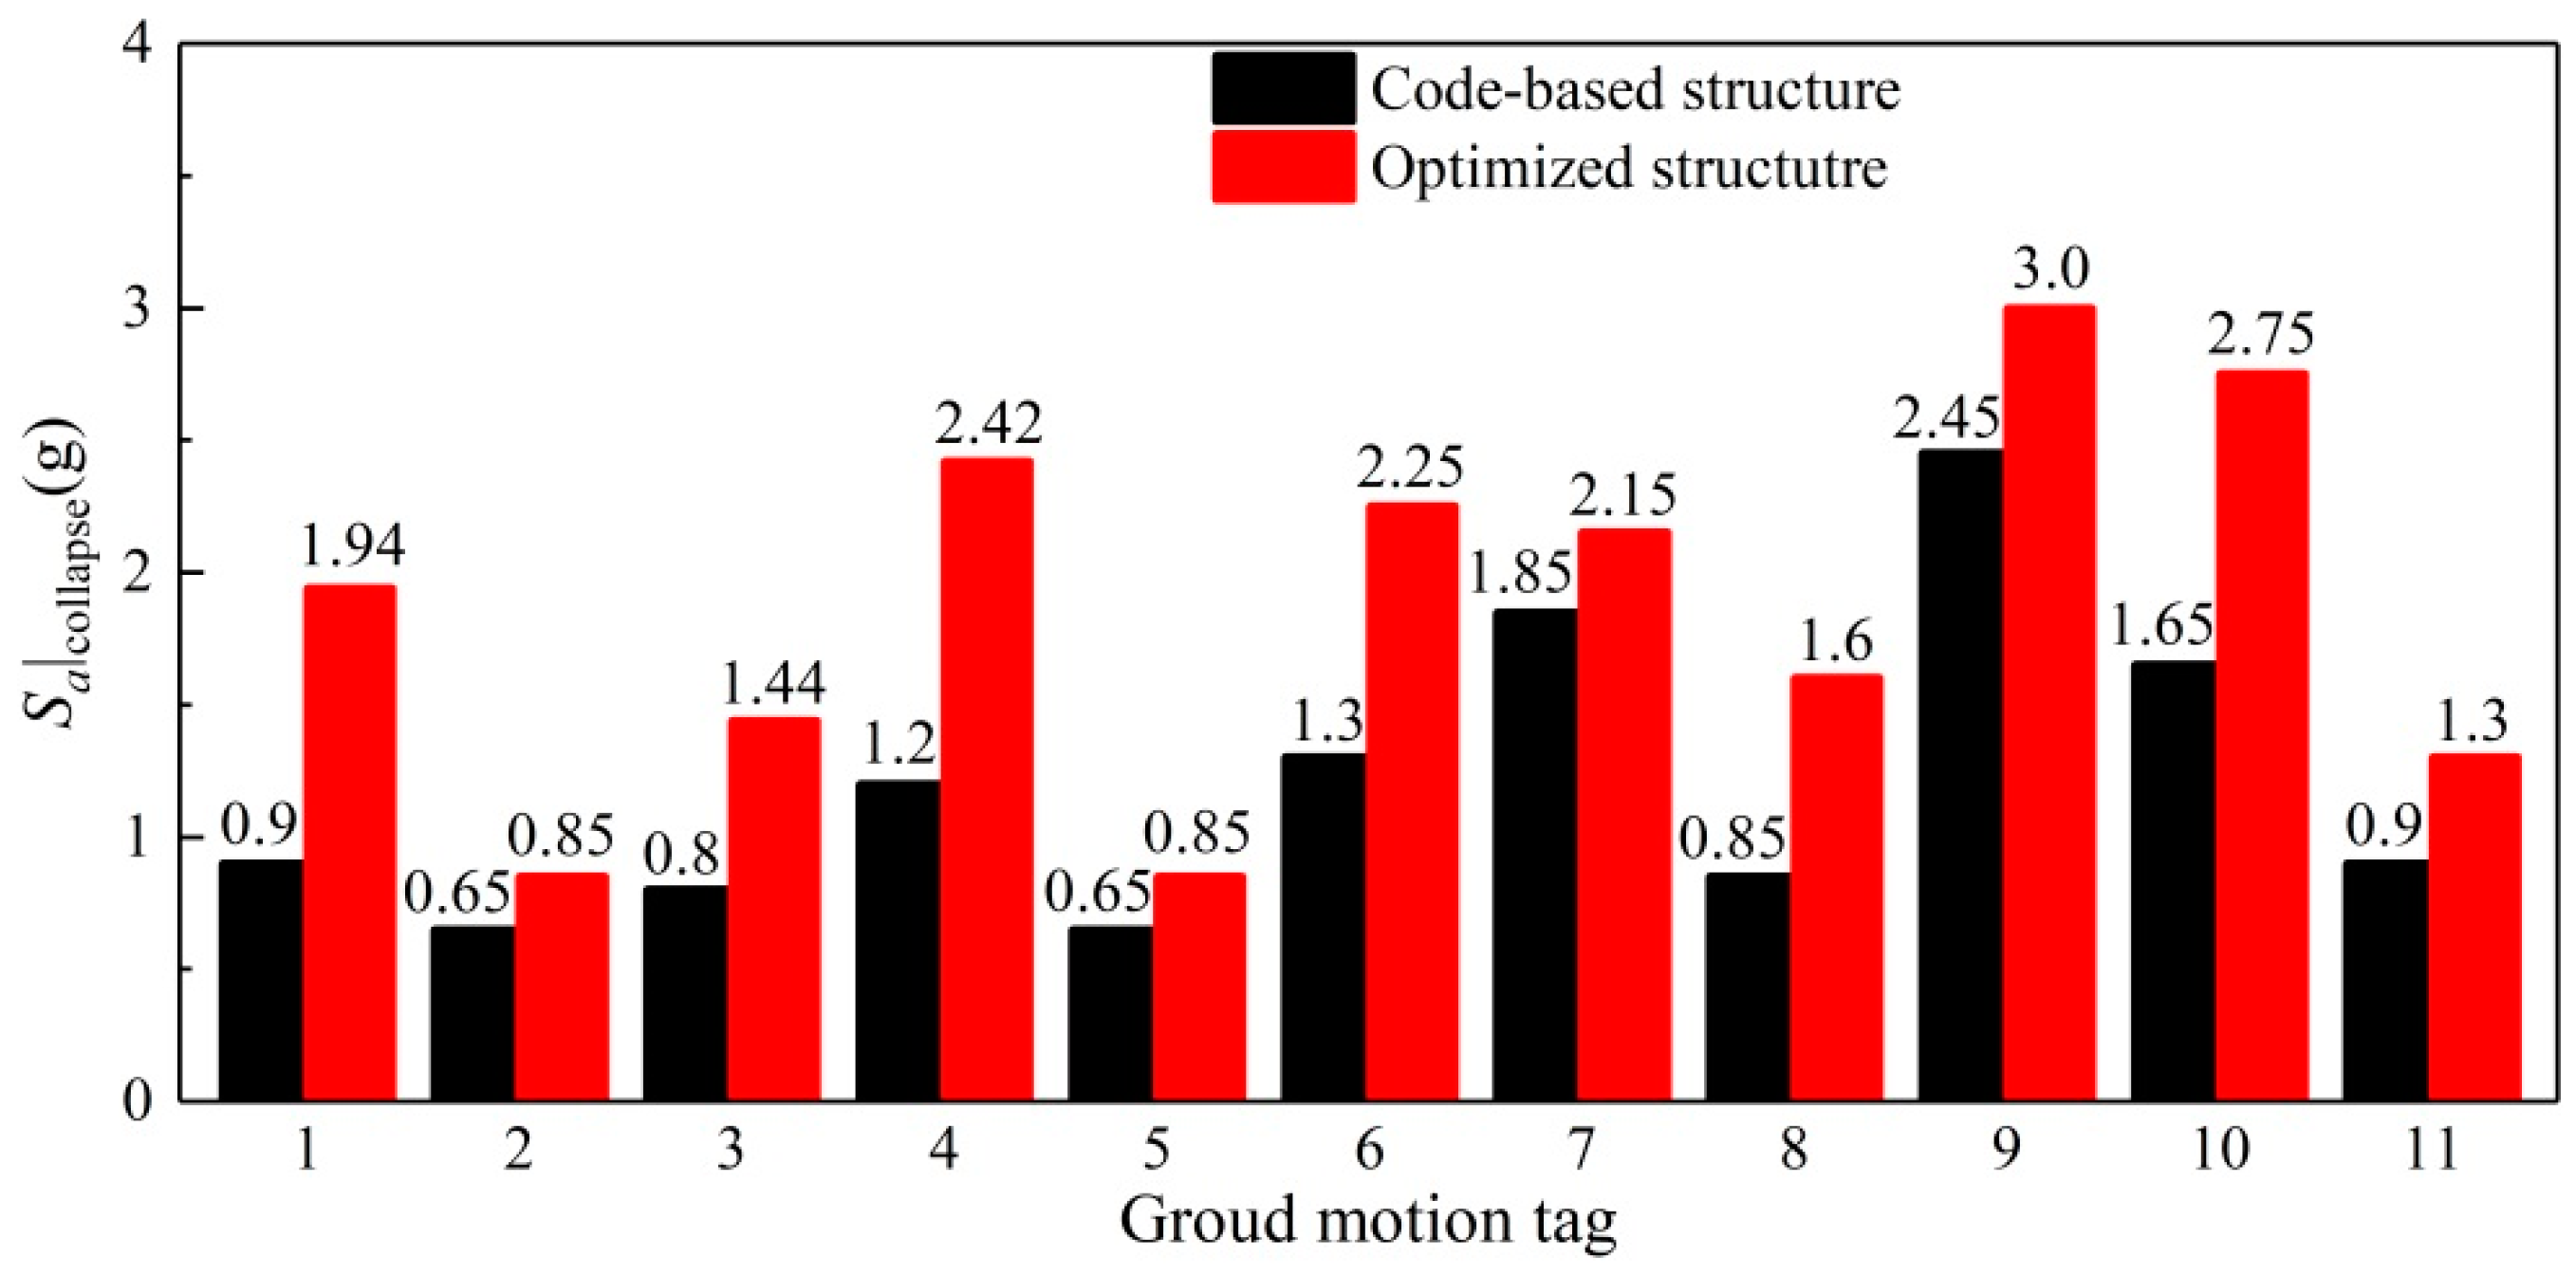
5. Optimum Design for the Selected Earthquake Ground Motion Set

In order to consider the uncertainty of the ground motion, the effectiveness of the developed optimization method was assessed by the selected ground motion group. As described above, the selected set of real earthquake records can be considered a representation of the seismic design spectrum complying with a severe earthquake intensity of CSBDC [4]. Figure 7 compares the longitudinal reinforcement of a single column for each floor of the code-designed structure, the optimization results obtained by the selected earthquakes, and the average value of the optimization designs. As assumed in the optimization procedure, the longitudinal reinforcement is assumed to be a continuous optimization variable. Steel bars available in commerce (shown as the red line with stars in Figure 7) were selected after obtaining the average value of the optimized longitudinal reinforcement for the columns. Though the diameter of the steel bars is discrete, in fact, the real reinforcement listed in Table 3 has a negligible bias with the average calculation results. Compared with the initial designed structure, for the optimization result, the reinforcement dimension of the third story experiences a slight decrease by 11%, the dimensions of the fourth and fifth floors significantly reduce by 27.6% and 33.2%, and the increase of longitudinal reinforcement for the first and second floors are 30.9% and 33.1%. Because the steel bars located at the corner of the column can not only achieve a maximum moment of inertia but also avoid concrete cracking due to stress concentration, CSDBC [4] restricts that the diameter of the corner steel bar should be bigger than the diameter of the middle bar. Similarly, the diameters of steel bars located at the same position of the column are suggested to be as similar as possible on successive floors for convenient construction. To consider the above factors, here are some suggestions about the reinforcement based on the average of the optimization solutions:
(1)
Try to make the corner steel bars have the same diameter with the code-designed structure;
(2)
Try to use the corner steel bars with a bigger diameter than the middle bars;
(3)
Try to use steel bars with the same diameter at the same position of the column on successive floors.
The TR distributions along the height of the code-based structure and optimized structure (reinforced using the steel bars in commerce) under the ground motion intensity relating to the collapse damage of the code-based structure subjected to the selected 11 ground motions are compared in Figure 8. As for the optimal design structure, the TR values of all the stories are larger than 20%. This means the optimized structure does not collapse at the collapse intensity of the initial structure; and it leads to a more uniform distribution of the TR along the height of the building. This phenomenon implies that the potential of the materials has been optimally exploited using the optimization design.
The IDA curves and collapse points of the initial structure and the optimal structure under the selected 11 earthquake records are illustrated in Figure 9a,b, respectively. Visually, the IDA curves of the initial structure turn relatively more horizontal than the IDA curves of the optimized building during the inelastic deformation range. This phenomenon means the initial structure develops more deformations than that of the optimized structure under the same earthquake intensity. As the reinforcements are modified from floors with large TR to floors with small TR, the floors with small TR are strengthened. The original collapse floors can resist the earthquake intensity of the collapse for a code-based structure. Figure 10 shows the collapse capacities of the structure before and after optimization under the selected earthquake set. Compared to the code-based structure, the proposed refined seismic design method results in a significant increase of the structural collapse resistant capacity with a maximum increase by 115.6% (ground motion: No. 4), a minimum increase by 16.3% (ground motion: No. 2 and No. 5), and an average increase by 60.9%, while the construction cost is almost unchanged (the sum steels dimension of all columns for the optimized structure is less than that of the initial structure by 0.4%). After optimization, the mean collapse capacity of the structure is increased from 1.2 g to 1.87 g by 55.7%. Briefly, the proposed optimum seismic design method increases the collapse resistant capacity largely compared to the code-based design method, while the maximum inter-story drift is reduced and the construction cost remains the same. As shown in Figure 10, the collapse capacity of the optimized structure increases for each ground motion record. It implies the proposed method has good robustness.

6. Conclusions

A refined seismic design method improving the structural collapse resistant capacity without an increase of construction cost for an RC frame structure is proposed. A five-story RC frame structure designed according to the CSDBC [4] is optimized to illustrate the feasibility and availability of the proposed optimization method. Based on the analytical results, some conclusions can be drawn:
  • Since the longitudinal reinforcement of columns is adopted as the optimization variable, the optimization procedure just needs a few iterative steps to achieve the optimization target. In addition, the constrained provisions (e.g., the maximum and minimum reinforcement ratio of the columns, etc.) in code are also taken into account during the iterative loops. It is a practical and computationally efficient method and easily implemented in engineering practice.
  • After optimization, the maximum inter-story response is reduced while the structure suffers inelastic deformation. The reduction level is increased with the nonlinear state developing.
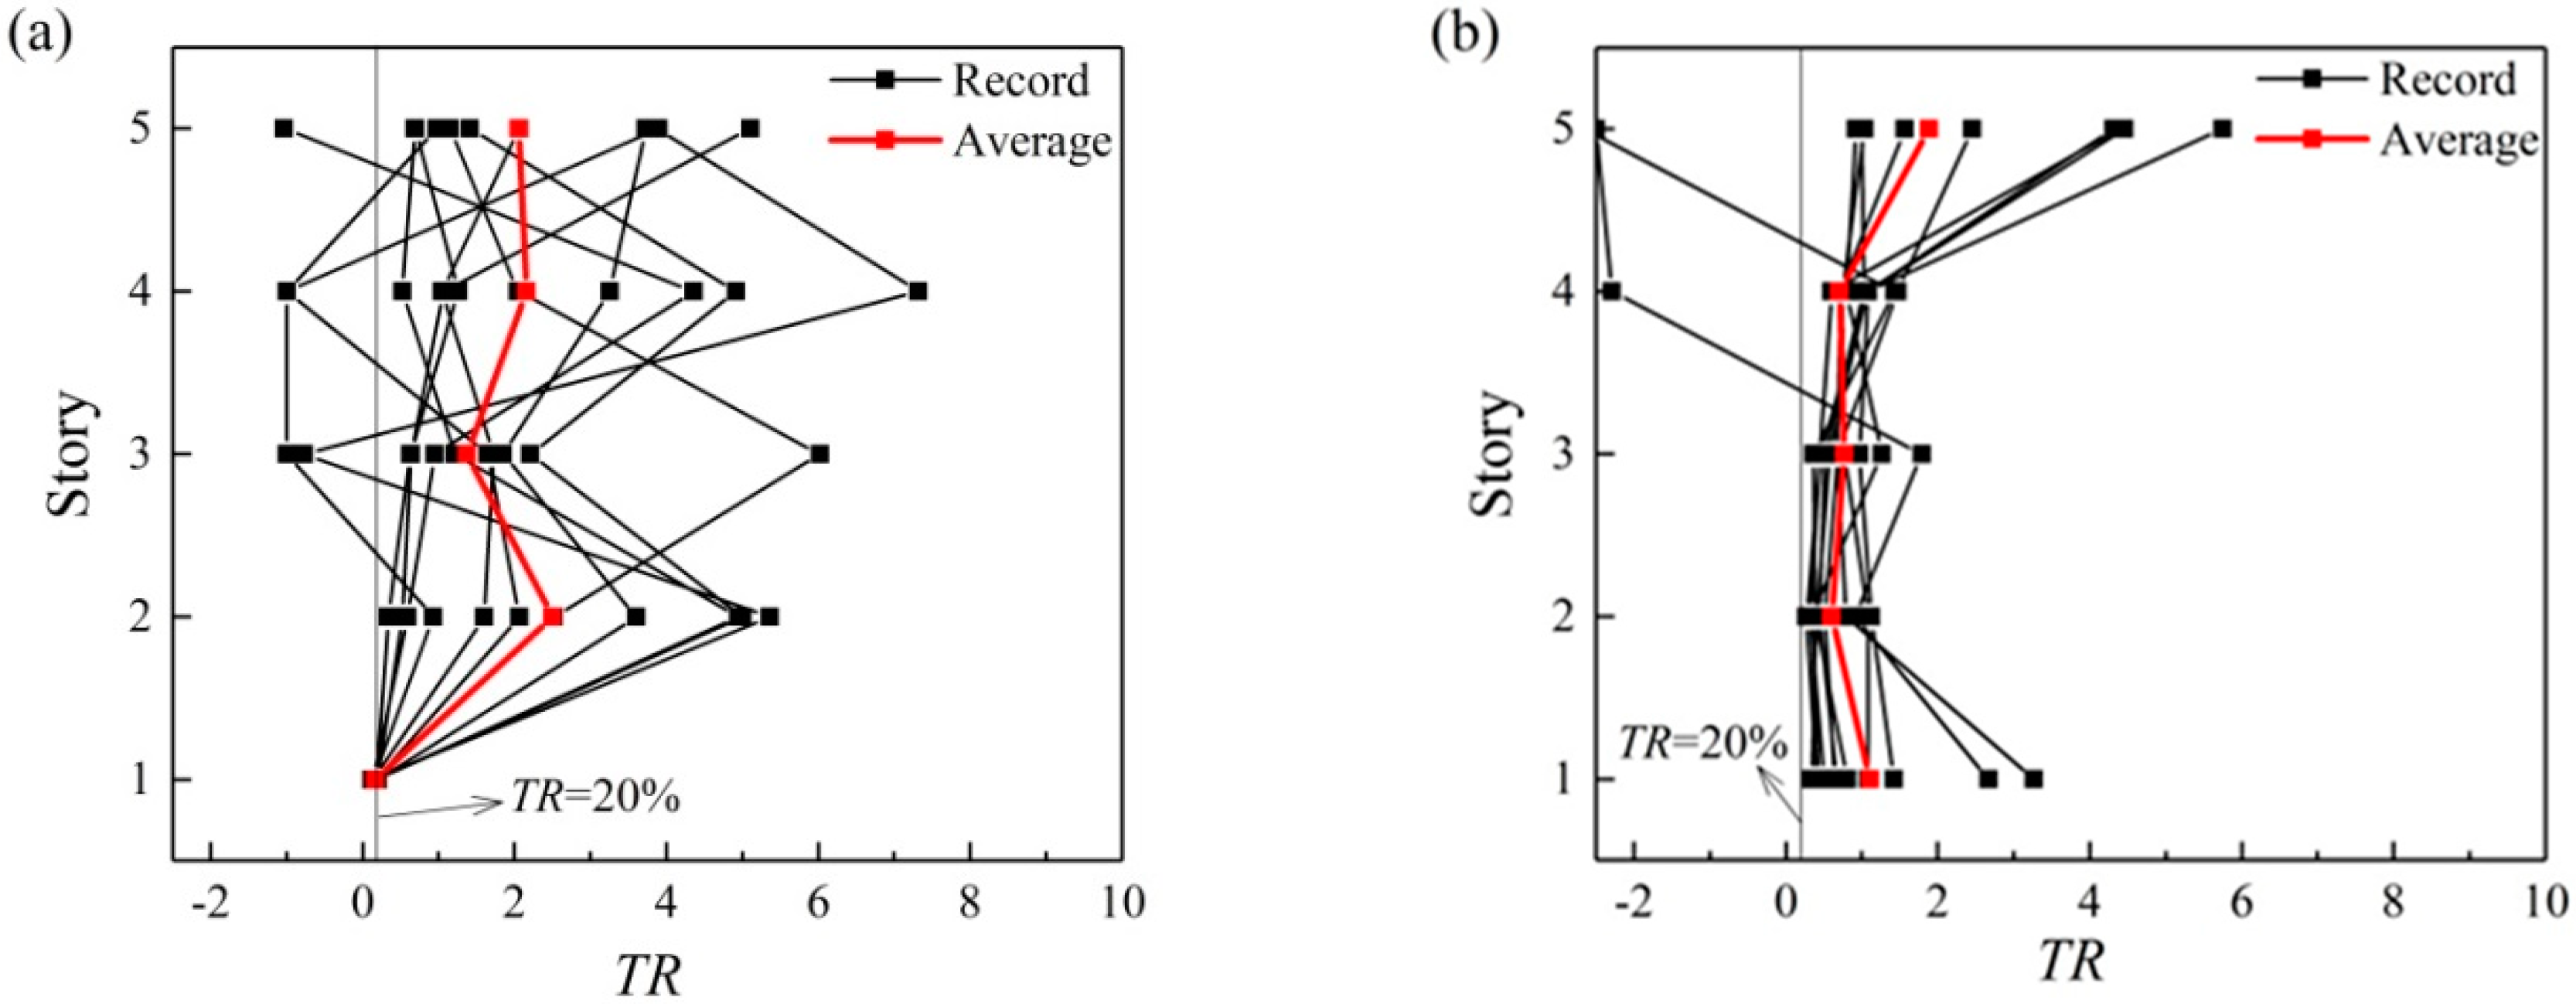
  • Compared to the code-based structure, with the same construction cost, the collapse resistant capacity of the optimized structure is remarkably increased (on average up to 60.9%); and the TR distributes more uniformly under the earthquake intensity of the initial structure collapse state.
  • Though the RC frame is analyzed in this study, the other type of structure can be optimized by a similar methodology. Similarly, the proposed optimization methodology also can be extended to strengthen and retrofit frame structures.

Author Contributions

Conceptualization, M.G. and S.L.; methodology, M.G.; software, M.G.; validation, M.G.; formal analysis, M.G.; investigation, M.G.; resources, M.G.; data curation, M.G.; writing—original draft preparation, M.G.; writing—review and editing, S.L.; visualization, M.G.; supervision, M.G.; project administration, S.L.; funding acquisition, S.L. All authors have read and agreed to the published version of the manuscript.

Funding

This research project was supported by the National Natural Science Foundation of China (Grant No. 51578202), Natural Science Foundation of Heilongjiang (Grant No. YQ2019E021).

Conflicts of Interest

There is no conflict of interest.

References

  1. Eurocode 8. Design of Structures for Earthquake Resistance. Part 1: General Rules, Seismic Action and Rules for Buildings; European Committee for Standardization: Brussels, Belgium, 2004.
  2. ASCE Standard ASCE/SEI 7-10. Minimum Design Loads for Buildings and Other Structures; American Society of Civil Engineers (ASCE): Reston, VA, USA, 2010.
  3. International Code Council, Inc. (Ed.) IBC 2015. International Building Code 2015; Country Club Hills: Cook County, IL, USA, 2015. [Google Scholar]
  4. Ministry of Housing and Urban-Rural Development of P. R. China (Ed.) Code for Seismic Design of Buildings (GB 50010-2010); China Architecture and Building Press: Beijing, China, 2016. [Google Scholar]
  5. Ou, J.-P.; Li, H. The regional engineering damage and reconstruction strategy in Wenchuan earthquake of China. J. Earthq. Tsunami 2011, 5, 189–216. [Google Scholar] [CrossRef]
  6. Lu, X.-Z.; Lin, X.-C.; Tian, Y.; Ye, L.-P. Comparison and discussion on destructive power of the ground motions recorded in the hardest-hit regions of Wenchuan, Lushan and Ludian earthquakes. Eng. Mech. 2014, 31, 1–7. [Google Scholar]
  7. Liel, A.B.; Haselton, C.B.; Deierlein, G.G. Seismic collapse safety of reinforced concrete buildings. II: Comparative assessment of nonductile and ductile moment frames. J. Struct. Eng. 2011, 137, 492–502. [Google Scholar] [CrossRef]
  8. Haselton, C.B.; Liel, A.B.; Deierlein, G.G.; Dean, B.S.; Chou, J.-H. Seismic collapse safety of reinforced concrete buildings. I: Assessment of ductile moment frames. J. Struct. Eng. 2011, 137, 481–491. [Google Scholar] [CrossRef] [Green Version]
  9. Lignos, D.-G.; Hikino, T.; Matsuoka, Y.; Nakashima, M. Collapse assessment of steel moment frames based on E-Defense full-scale table collapse tests. J. Struct. Eng. 2013, 139, 120–132. [Google Scholar] [CrossRef]
  10. Lu, Z.; Chen, X.-Y.; Lu, X.-L.; Yang, Z. Shaking table test and numerical simulation of an RC frame-core tube structure for earthquake-induced collapse. Earthq. Eng. Struct. Dyn. 2016, 45, 1537–1556. [Google Scholar] [CrossRef]
  11. Febf, D.C.; Kolay, C.; Ricles, J.M.; Li, J. Collapse simulation of reinforced concrete frame structures. Struct. Des. Tall Spec. Build. 2016, 25, 578–601. [Google Scholar]
  12. Ganzerli, S.; Pantelides, C.P. Performance-based design using structural optimization. Earthq. Eng. Struct. Dyn. 2000, 29, 1677–1690. [Google Scholar] [CrossRef]
  13. Chan, C.-M.; Zou, X.-K. Elastic and inelastic drift performance optimization for reinforced concrete buildings under earthquake loads. Earthq. Eng. Struct. Dyn. 2004, 33, 929–950. [Google Scholar] [CrossRef]
  14. Zou, X.-K.; Chan, C.-M. Optimum seismic performance-based design of reinforced concrete buildings using nonlinear pushover analysis. Eng. Struct. 2005, 27, 1289–1302. [Google Scholar] [CrossRef]
  15. Al-Ansari, M.; Senouci, A. Drift optimization of high-rise buildings in earthquake zones. Struct. Des. Tall Spec. Build. 2011, 20, 208–222. [Google Scholar] [CrossRef]
  16. Bai, J.-L.; Ou, J.-P. Seismic failure mode improvement of RC frame structure based on multiple lateral load patterns of pushover analyses. Sci. China Technol. Sci. 2011, 54, 2825–2833. [Google Scholar] [CrossRef]
  17. Krawinkler, H. Pushover analysis: Why, how, when, and when not to use it. In Proceedings of the 1996 SEAOC Convention, Maui, HI, USA, 1–6 October 1996. [Google Scholar]
  18. Li, S.; Zuo, Z.-X.; Zhai, C.-H.; Xie, L.-L. Comparison of static pushover and dynamic analyses using RC building shaking table experiment. Eng. Struct. 2017, 136, 430–440. [Google Scholar] [CrossRef]
  19. Aldwaik, M.; Adeli, H. Advances in optimization of highrise building structures. Struct. Multidiplinary Optim. 2014, 50, 899–919. [Google Scholar] [CrossRef]
  20. Lee, S.-S.; Goel, S.-G. Performance-based of steel moment frames using target drift and yield mechanism. In Proceedings of the U.S.-Japan Seminar on Advanced Stability and Seismicity Concept for Performance Based Design of Steel and Composite Structures, Kyoto, Japan, 23–26 July 2001. [Google Scholar]
  21. Chao, S.-H.; Goel, S.-C. A seismic design lateral force distribution based on inelastic state of structures. Eng. Spectra 2007, 23, 547–569. [Google Scholar] [CrossRef] [Green Version]
  22. Mohammadi, R.K.; Naggar, M.-H.-E.; Moghaddam, H. Optimum strength distribution for seismic resistant shear buildings. Int. J. Solids Struct. 2004, 41, 6597–6612. [Google Scholar] [CrossRef]
  23. Moghaddam, H.; Hajirasouliha, I.; Doostan, A. Optimum seismic design of concentrically braced steel frames: Concepts and design procedures. J. Constr. Steel Res. 2005, 61, 151–166. [Google Scholar] [CrossRef]
  24. Moghaddam, H.; Mohammadi, K. More efficient seismic loading for multidegrees of freedom structures. J. Struct. Eng. 2006, 132, 1673–1677. [Google Scholar] [CrossRef]
  25. Moghaddam, H.; Hajirasouliha, I. Toward more rational criteria for determination of design earthquake forces. Int. J. Solids Struct. 2006, 43, 2631–2645. [Google Scholar] [CrossRef] [Green Version]
  26. Moghaddam, H.; Hajirasouliha, I. Optimum strength distribution for seismic design of tall buildings. Struct. Des. Tall Spec. Build. 2008, 17, 331–349. [Google Scholar] [CrossRef]
  27. Hajirasouliha, I.; Moghaddam, H. New lateral force distribution for seismic design of structures. J. Struct. Eng. 2009, 135, 906–915. [Google Scholar] [CrossRef]
  28. Hajirasouliha, I.; Asadi, P.; Pilakoutas, K. An efficient performance-based seismic design method for reinforced concrete frames. Earthq. Eng. Struct. Dyn. 2012, 41, 663–679. [Google Scholar] [CrossRef]
  29. Hajirasouliha, I.; Pilakoutas, K. General seismic load distribution for optimum performance-based design of shear-buildings. J. Earthq. Eng. 2012, 16, 443–462. [Google Scholar] [CrossRef]
  30. Park, K.; Medina, R.A. Conceptual seismic design of regular frames based on the concept of uniform damage. J. Struct. Eng. 2007, 133, 945–955. [Google Scholar] [CrossRef]
  31. Ganjavi, B.; Hao, H. Optimum lateral load pattern for seismic design of elastic shear-buildings incorporating soil-structure interaction effects. Earthq. Eng. Struct. Dyn. 2013, 42, 913–933. [Google Scholar] [CrossRef]
  32. Ganjavi, B.; Hajirasouliha, I.; Bolourchi, A. Optimum lateral load distribution for seismic design of nonlinear shear-buildings considering soil-structure interaction. Soil Dyn. Earthq. Eng. 2016, 88, 356–368. [Google Scholar] [CrossRef]
  33. Lu, Y.; Hajirasouliha, I.; Marshall, A.M. Performance-based design of flexible-based multi-storey buildings considering soil-structure interaction. Eng. Struct. 2016, 108, 90–103. [Google Scholar] [CrossRef]
  34. Li, S.; Yu, B.; Gao, M.-M.; Zhai, C.-H. Optimum seismic design of multi-story buildings for increasing collapse resistant capacity. Soil Dyn. Earthq. Eng. 2019, 116, 495–510. [Google Scholar] [CrossRef]
  35. Mergos, P.E. Efficient optimum seismic design of reinforced concrete frames with nonlinear structural analysis procedures. Struct. Multidiscip. Optim. 2018, 58, 2565–2581. [Google Scholar] [CrossRef] [Green Version]
  36. Zhang, C.-Y.; Tian, Y. Simplified performance-based optimal seismic design of reinforced concrete frame buildings. Eng. Struct. 2019, 185, 15–25. [Google Scholar] [CrossRef]
  37. Bai, J.-L.; Jin, S.-S.; Ou, J.-P. An efficient method for optimizing the seismic resistance of reinforced concrete frame structures. Adv. Struct. Eng. 2020, 23, 670–686. [Google Scholar] [CrossRef]
  38. Mazzolani, F.M.; Della Corte, G.; D’Aniello, M. Experimental analysis of steel dissipative bracing systems for seismic upgrading. J. Civ. Eng. Manag. 2009, 15, 7–19. [Google Scholar] [CrossRef] [Green Version]
  39. Papalou, A. Strengthening of masonry structures using steel frames. Int. J. Eng. Technol. 2013, 2, 50–56. [Google Scholar] [CrossRef] [Green Version]
  40. Cecchi, A.; Russo, S.; Sciarretta, F. Preliminary investigation on FRP profiles for the structural retrofit of masonry structures. Key Eng. Mater. 2017, 747, 77–84. [Google Scholar] [CrossRef]
  41. Casalegno, C.; Russo, S.; Sciarretta, F. Numerical Analysis of a Masonry Panel Reinforced with Pultruded FRP Frames. Mech. Compos. Mater. 2018, 54, 207–220. [Google Scholar] [CrossRef]
  42. Vamvarsikos, D.; Cornell, C.A. Incremental dynamic analysis. Earthq. Eng. Struct. Dyn. 2002, 31, 491–514. [Google Scholar] [CrossRef]
  43. FEMA P695. Quantification of Building Seismic Performance Factors; Federal Emergency Management Agency: Washington, DC, USA, 2009. [Google Scholar]
  44. Open System for Earthquake Engineering Simulation (OpenSees). 2016. Available online: http://opensees.berkeley.edu/wiki/index.php/Command_Manual (accessed on 14 March 2017).
  45. ATC-58. Guidelines for Seismic Performance Assessment of Buildings; Applied Technology Council: Redwood City, CA, USA, 2009. [Google Scholar]
Figure 1. The description of the tangent ratio (TR) based on the incremental dynamic analysis (IDA) curve of ith storey.
Applsci 10 08230 g001
Figure 2. Flowchart of the proposed optimization method.
Applsci 10 08230 g002
Figure 3. The example reinforcement concrete (RC) five-storey three-bay frame structure.
Applsci 10 08230 g003
Figure 4. Elastic response spectra of selected earthquake set and CSDBC design spectrum for soil type Ⅱ (5% damping).
Applsci 10 08230 g004
Figure 5. Variation of Cov, TR, and As from CSBDC-based structure tending to final optimization solution: (a) coefficient of variation TR, (b) TR for each floor, (c) longitudinal reinforcement dimension of single column for each floor (Earthquake: San Fernando, 1971, RSN68).
Applsci 10 08230 g005
Figure 6. TR, IDA curves, and longitudinal reinforcement comparison of CSDBC-designed structure and optimized structure: (a) TR of each floor, (b) longitudinal reinforcement of single column for each floor, (c) IDA curves for each floor.
Applsci 10 08230 g006
Figure 7. Longitudinal reinforcement of single column for each floor comparisons of CSDBC-designed structure and optimized structure.
Applsci 10 08230 g007
Figure 8. TR distribution comparisons of CSDBC-designed structure and optimized structure: (a) TR distribution of code-based structure at the earthquake intensity corresponding to collapse state of code-based structure, (b) TR distribution of optimized structure at the earthquake intensity corresponding to the collapse state of code-based structure.
Applsci 10 08230 g008
Figure 9. IDA curves comparison of CSDBC-designed structure and optimized structure: (a) IDA curves for code-based structure, (b) IDA curves for optimized structure.
Applsci 10 08230 g009
Figure 10. Comparison of the seismic collapse capacity of code-based and optimized structure.
Applsci 10 08230 g010
Table 1. Cross-section and longitudinal reinforcement of beams and columns based on the Code for Seismic Design of Buildings in China (CSDBC).
StoryBeamsColumns
Size (mm2)ConcreteReinforcementSize (mm2)ConcreteReinforcement
Upper SideBottom Side
1300 × 500C254Φ254Φ22500 × 500C3012Φ22
2300 × 500C254Φ254Φ22500 × 500C3012Φ22
3300 × 500C254Φ254Φ22500 × 500C3012Φ22
4300 × 500C254Φ224Φ20500 × 500C3012Φ20
5300 × 500C254Φ224Φ20500 × 500C3012Φ20
Table 2. Basic information of selected ground motions.
No.Earthquake YearRecording NameMagnitudePGA (g)
1Northridge1994Canyon Country-WLC6.70.48
2Imperial Valley1979EI Centro Array #116.50.38
3Kobe, Japan1995Shin-Osaka6.90.24
4Kocaeli, Turkey1999Duzce7.50.36
5Kocaeli, Turkey1999Arcelik7.50.22
6Landers1992Yermo Fire Station7.30.24
7Loma Prieta1989Gilroy Array #36.90.56
8Superstition Hills1987Poe Road (temp)6.50.45
9Chi-Chi, Taiwan1999CHY1017.60.44
10San Fernando1971LA-Hollywood Stor6.60.22
11Hector Mine1999Hector7.10.34
Table 3. Longitudinal reinforcement of columns for code-designed and optimized structures.
StoryCode-DesignedOptimized
112Φ2212Φ25
212Φ2212Φ25
312Φ224Φ22 + 8Φ20
412Φ204Φ22 + 4Φ20
512Φ204Φ22 + 4Φ18
Publisher’s Note: MDPI stays neutral with regard to jurisdictional claims in published maps and institutional affiliations.

