Unsupervised 3D Motion Summarization Using Stacked Auto-Encoders

 ,
,  ,
,  and
and 
Abstract
1. Introduction
2. Related Works
2.1. Our Contribution
3. The Proposed Dance Summarization Workflow
3.1. Physics-Based Attributes of 3D Motion Primitives
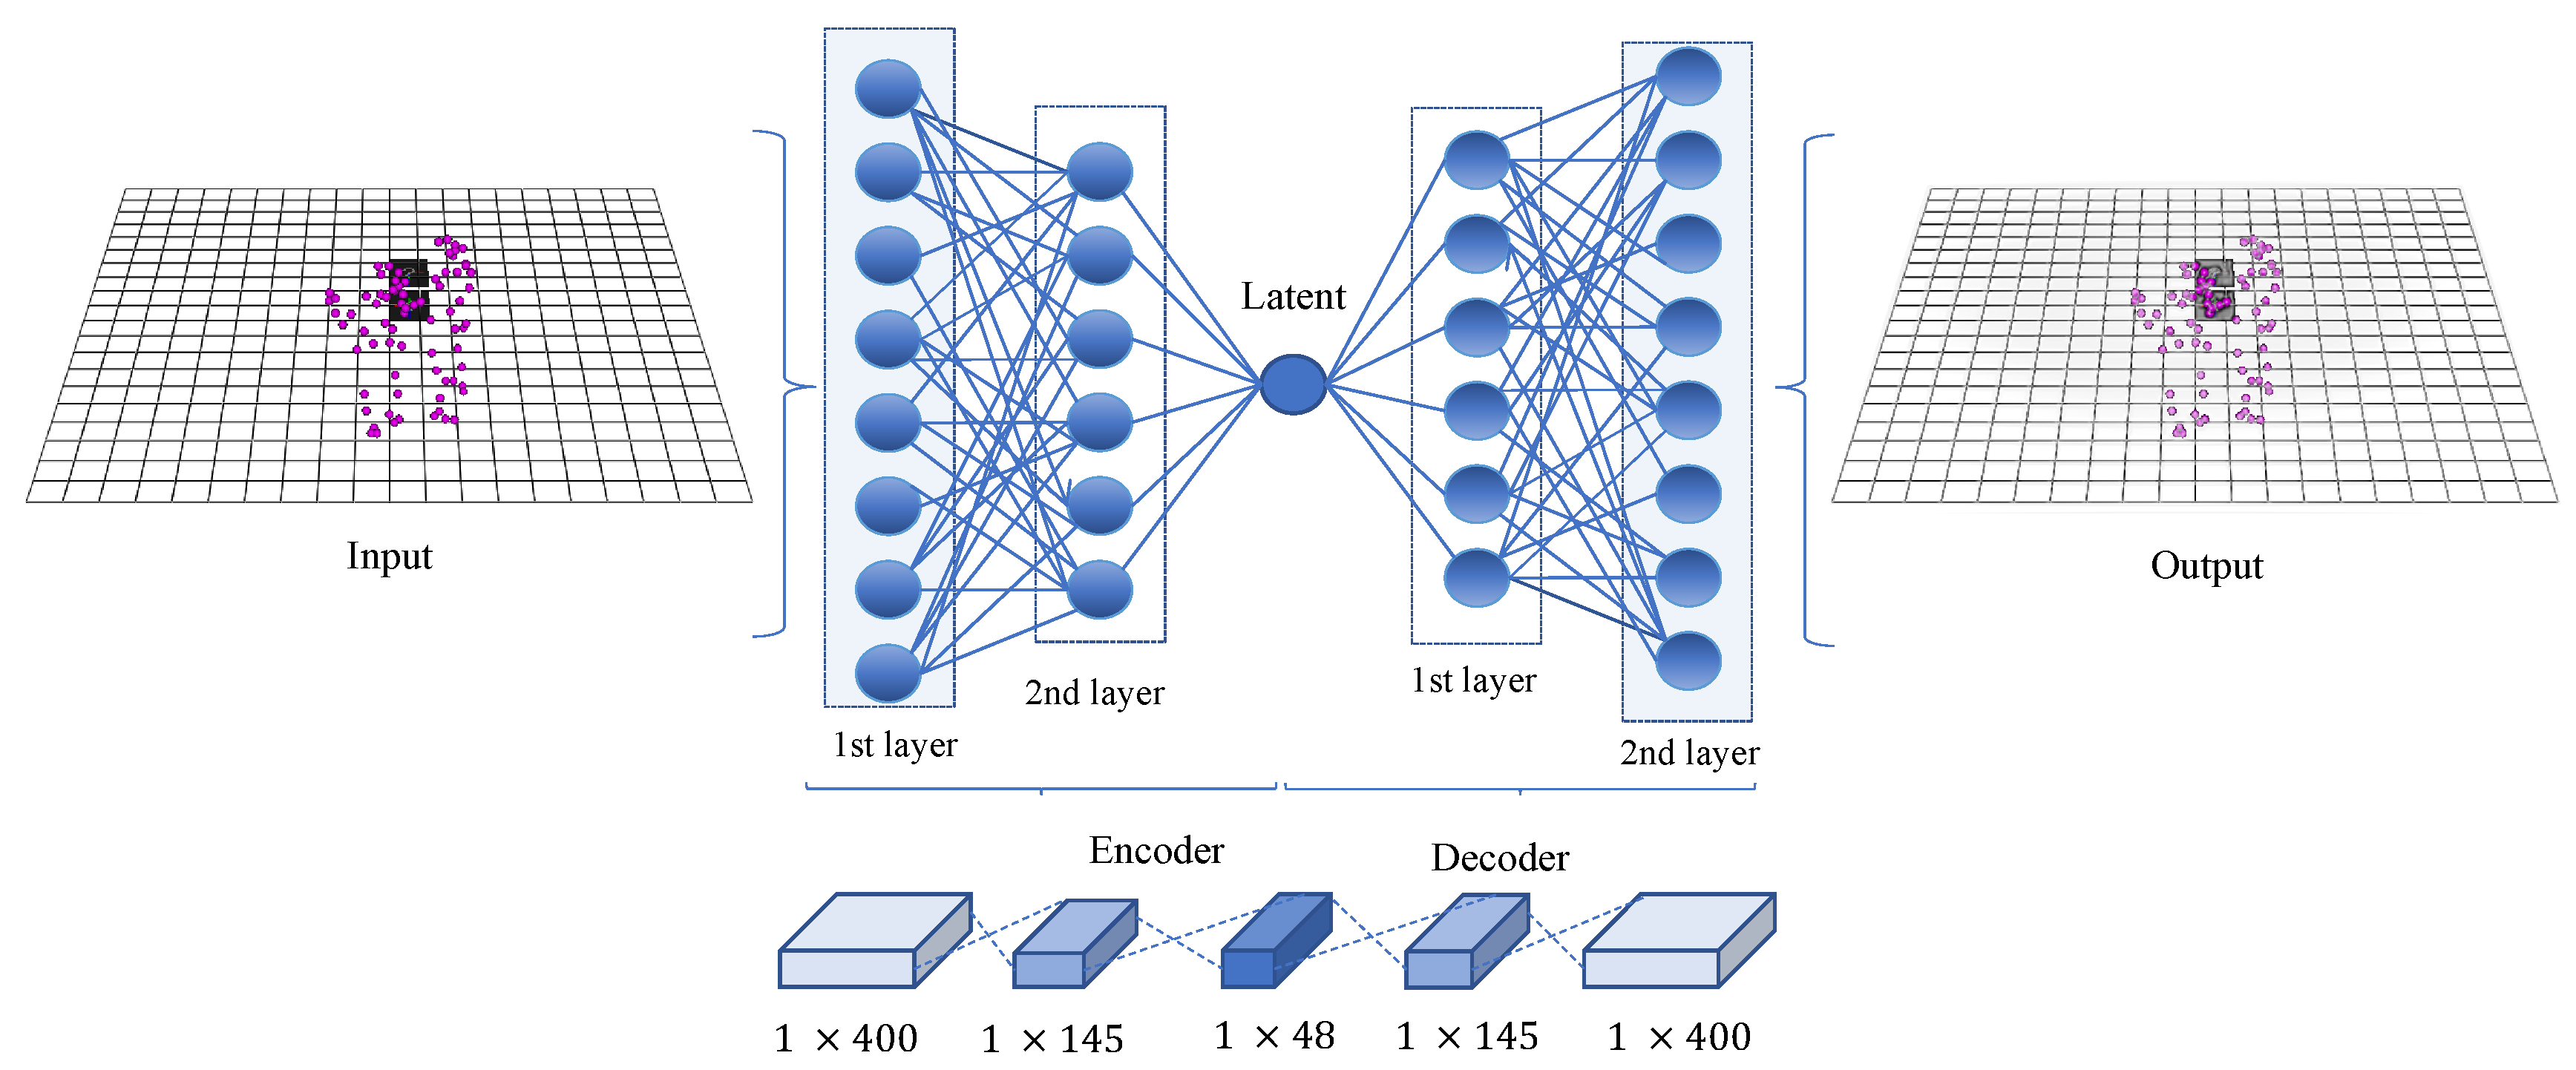
3.2. The Proposed Stacked Auto-Encoder (SAE) Module for Dimensionality Reduction
3.3. Unsupervised Representational Sampling Algorithms
4. The Proposed Sae Scheme for Dance Sequence Summarization
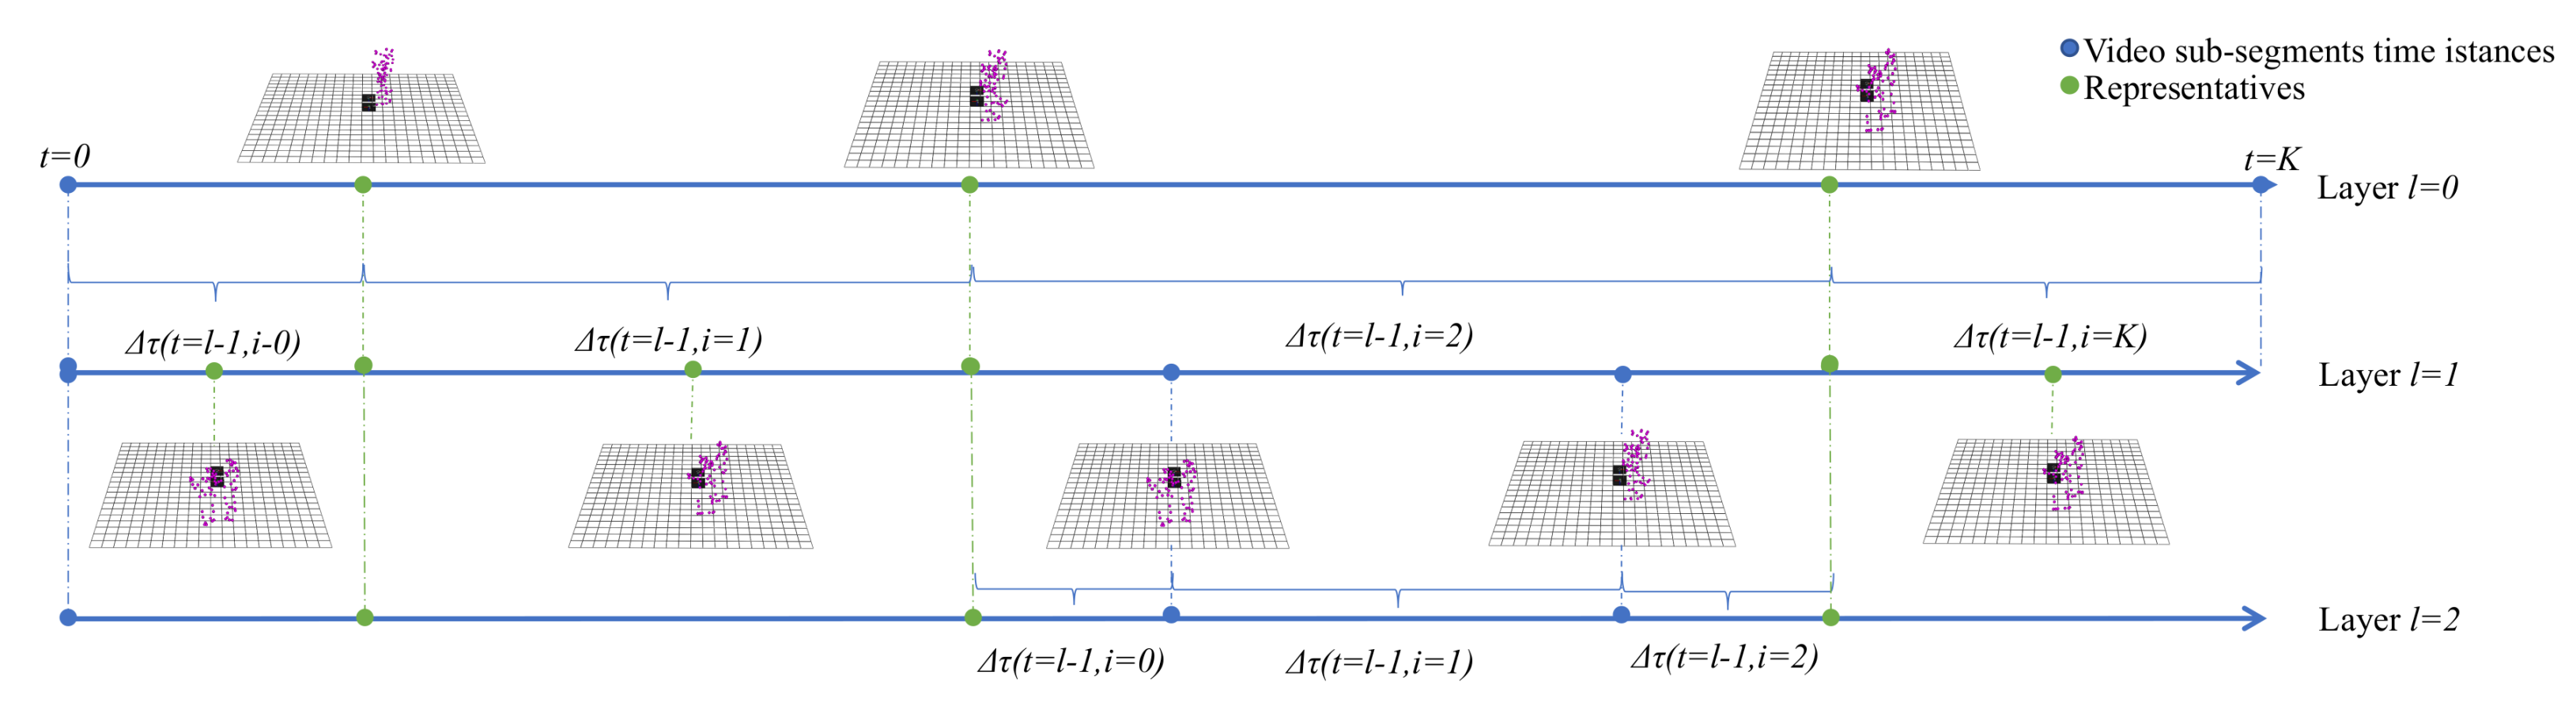
5. The Hierarchical-Sparse Modelling Representative Selection
6. Experimental Results
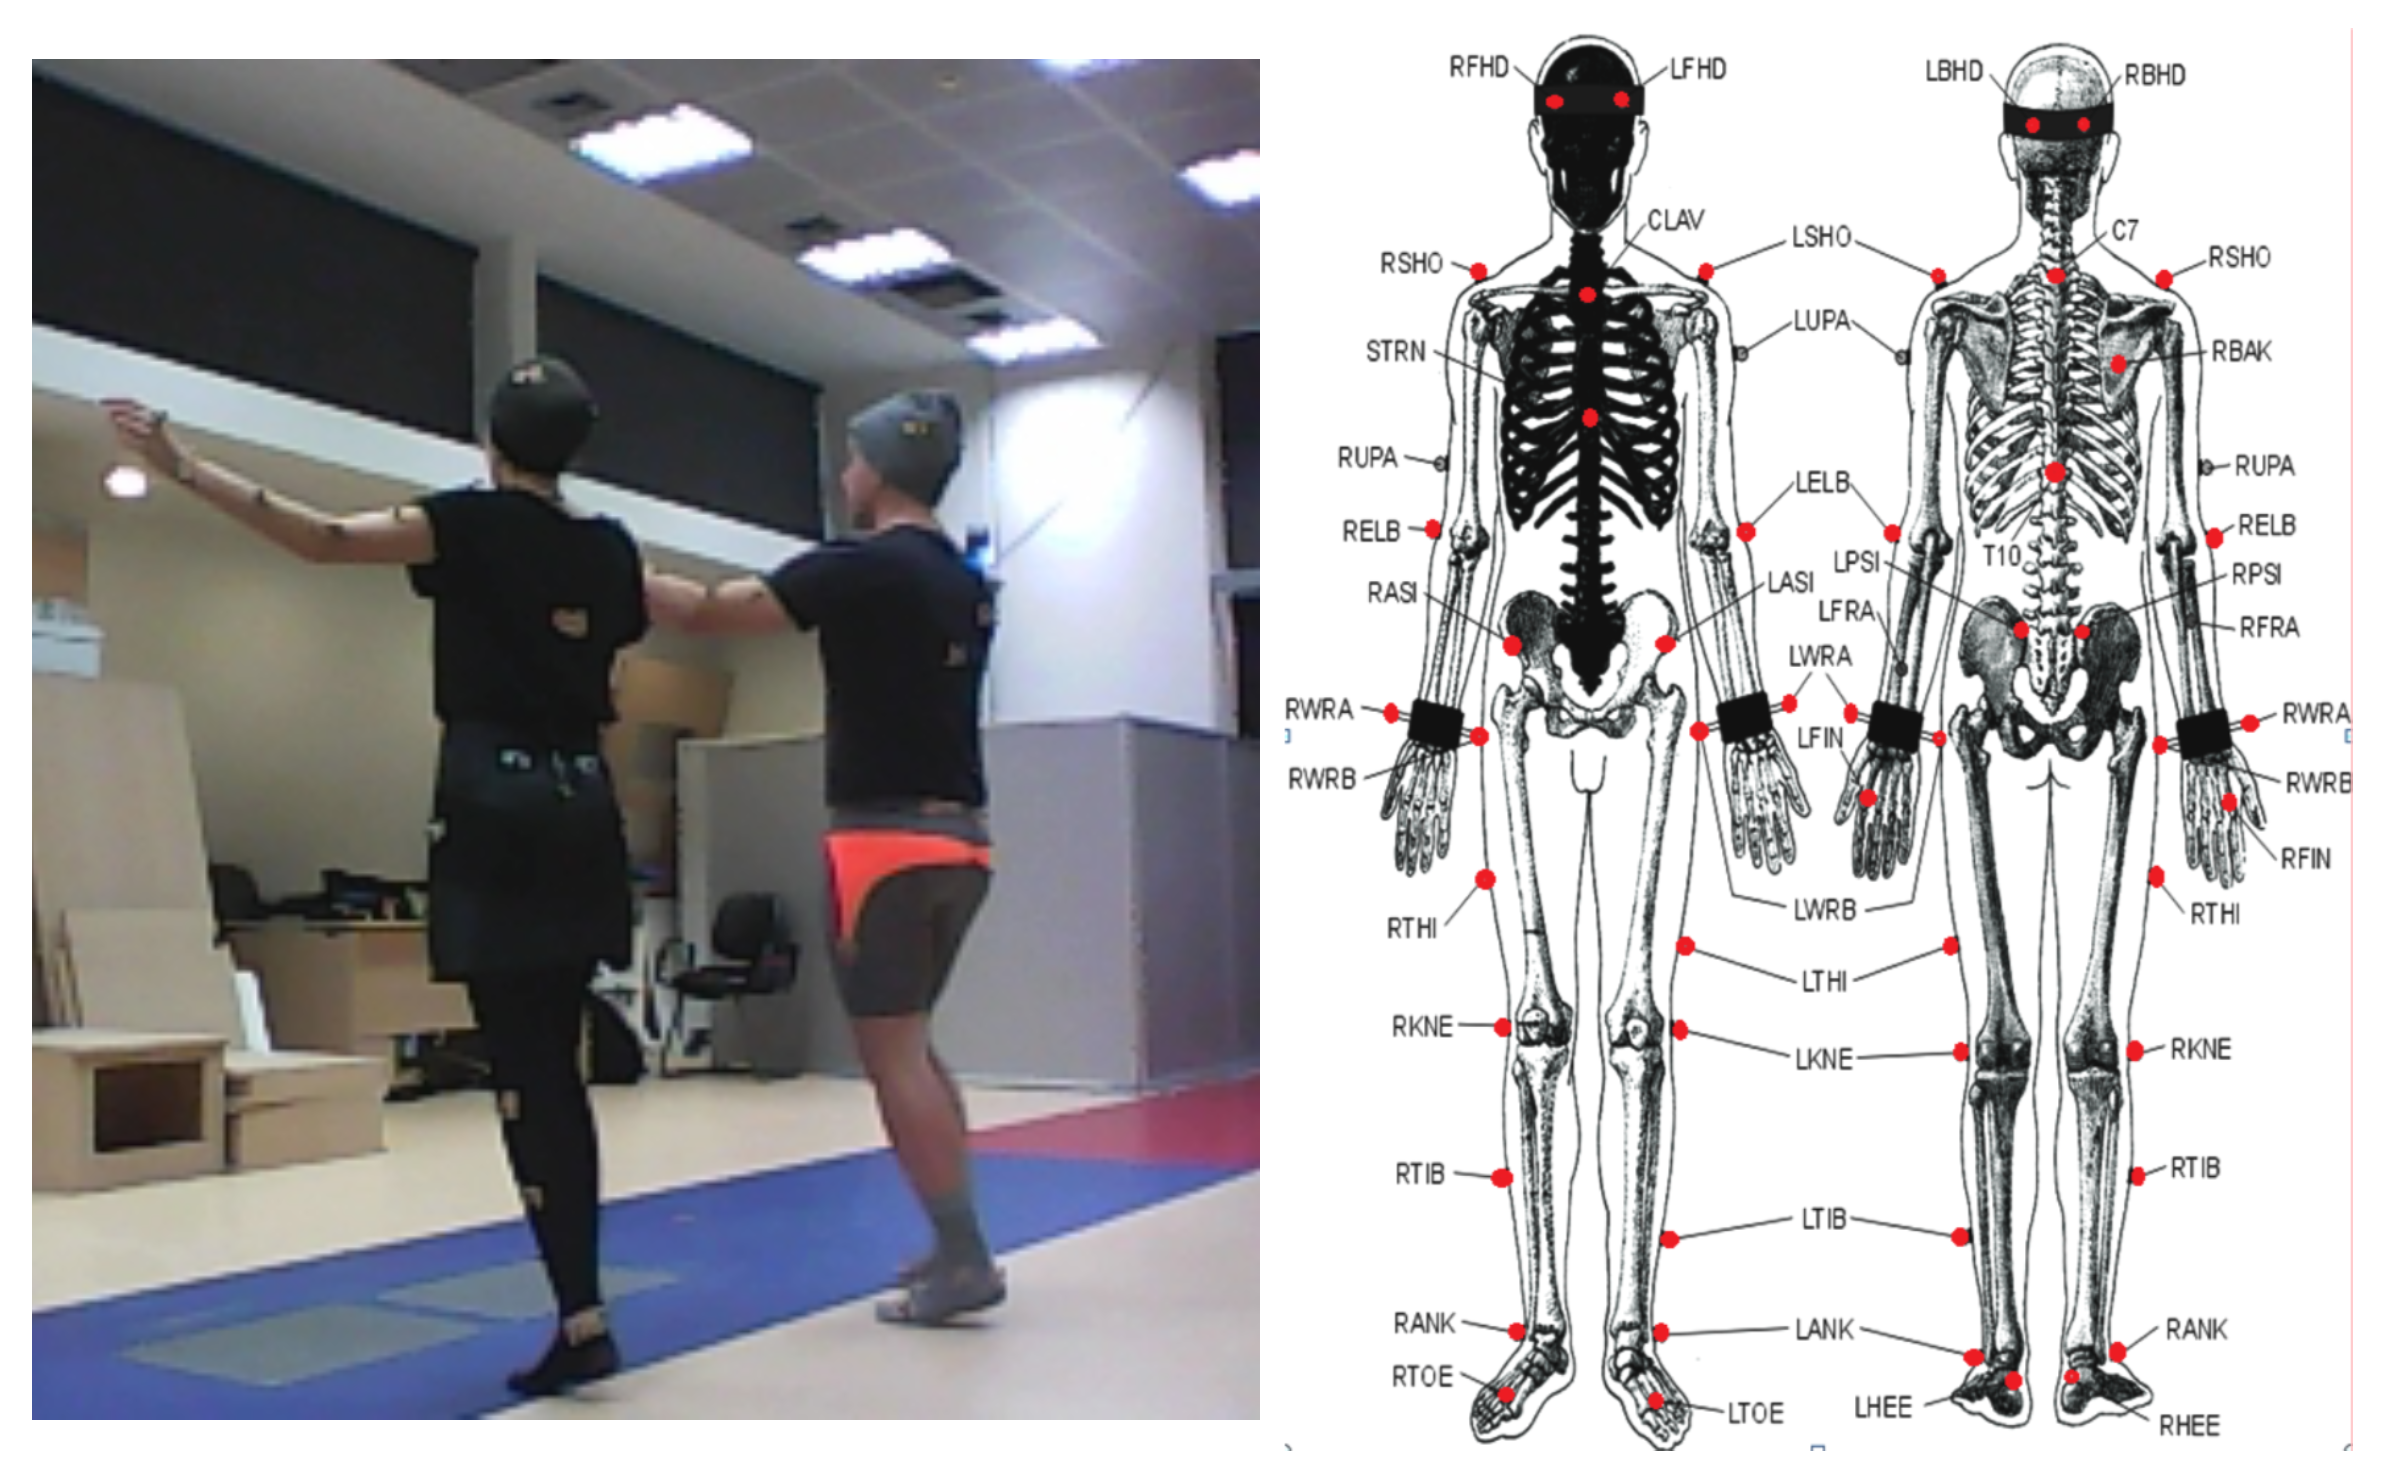
6.1. The Acquisition Module
6.2. Dataset Description
6.3. Evaluation Metrics
6.4. Dance Summarization Experiments
7. Conclusions
Author Contributions
Funding
Acknowledgments
Conflicts of Interest
Abbreviations
| SAE | Stacked Auto-Encoder |
| H-SMRS | Hierarchical Sparse Modelling Representative Selection |
| SMRS | Sparse Modelling Representative Selection |
| K-OPTICS | Kmeans-Ordering points to identify the clustering structure |
| CNNs | Convolutional Neural Networks |
| LSTM | Long Short-Term Memory |
| HACA | Hierarchical Aligned Cluster Analysis |
| PCA | Principal Component Analysis |
| KS | Kennard Stone |
References
- Avrithis, Y.S.; Doulamis, A.D.; Doulamis, N.D.; Kollias, S.D. A stochastic framework for optimal key frame extraction from MPEG video databases. Comput. Vis. Image Underst. 1999, 75, 3–24. [Google Scholar] [CrossRef]
- Zhang, Y.; Liang, X.; Zhang, D.; Tan, M.; Xing, E.P. Unsupervised object-level video summarization with online motion auto-encoder. Pattern Recognit. Lett. 2020, 130, 376–385. [Google Scholar] [CrossRef]
- Doulamis, A.D.; Doulamis, N.; Kollas, S. Non-sequential video content representation using temporal variation of feature vectors. IEEE Trans. Consum. Electron. 2000, 46, 758–768. [Google Scholar] [CrossRef]
- Doulamis, A.D.; Doulamis, N.D. Optimal content-based video decomposition for interactive video navigation. IEEE Trans. Circuits Syst. Video Technol. 2004, 14, 757–775. [Google Scholar] [CrossRef]
- Vasconcelos, N.; Lippman, A. A spatiotemporal motion model for video summarization. In Proceedings of the 1998 IEEE Computer Society Conference on Computer Vision and Pattern Recognition (Cat. No. 98CB36231), Santa Barbara, CA, USA, 23–25 June 1998; pp. 361–366. [Google Scholar]
- Rallis, I.; Doulamis, N.; Doulamis, A.; Voulodimos, A.; Vescoukis, V. Spatio-temporal summarization of dance choreographies. Comput. Graph. 2018, 73, 88–101. [Google Scholar] [CrossRef]
- Aristidou, A.; Cohen-Or, D.; Hodgins, J.K.; Chrysanthou, Y.; Shamir, A. Deep motifs and motion signatures. ACM Trans. Graph. (TOG) 2018, 37, 1–13. [Google Scholar] [CrossRef]
- Voulodimos, A.; Rallis, I.; Doulamis, N. Physics-based keyframe selection for human motion summarization. Multimed. Tools Appl. 2020, 79, 3243–3259. [Google Scholar] [CrossRef]
- Aristidou, A.; Lasenby, J. Inverse Kinematics: A Review of Existing Techniques and Introduction of a New Fast Iterative Solver; University of Cambridge: Cambridge, UK, 2009. [Google Scholar]
- Voulodimos, A.; Doulamis, N.; Doulamis, A.; Protopapadakis, E. Deep learning for computer vision: A brief review. Comput. Intell. Neurosci. 2018, 2018, 7068349. [Google Scholar] [CrossRef]
- Krizhevsky, A.; Sutskever, I.; Hinton, G.E. Imagenet classification with deep convolutional neural networks. In Proceedings of the Advances in Neural Information Processing Systems, Lake Tahoe, NV, USA, 3–6 December 2012; pp. 1097–1105. [Google Scholar]
- Elhamifar, E.; Sapiro, G.; Vidal, R. See all by looking at a few: Sparse modeling for finding representative objects. In Proceedings of the 2012 IEEE Conference on Computer Vision and Pattern Recognition, Providence, RI, USA, 16–21 June 2012; pp. 1600–1607. [Google Scholar]
- Protopapadakis, E.; Voulodimos, A.; Doulamis, A.; Doulamis, N.; Dres, D.; Bimpas, M. Stacked autoencoders for outlier detection in over-the-horizon radar signals. Comput. Intell. Neurosci. 2017, 2017, 5891417. [Google Scholar] [CrossRef]
- Mallat, S. A wavelet Tour of Signal Processing; Elsevier: Amsterdam, The Netherlands, 1999. [Google Scholar]
- Haykin, S. Neural Networks: A Comprehensive Foundation; Prentice-Hall: Upper Saddle River, NJ, USA, 2007. [Google Scholar]
- Doulamis, A.D.; Doulamis, N.D.; Kollias, S.D. On-line retrainable neural networks: Improving the performance of neural networks in image analysis problems. IEEE Trans. Neural Netw. 2000, 11, 137–155. [Google Scholar] [CrossRef]
- Rallis, I.; Georgoulas, I.; Doulamis, N.; Voulodimos, A.; Terzopoulos, P. Extraction of key postures from 3D human motion data for choreography summarization. In Proceedings of the 2017 9th International Conference on Virtual Worlds and Games for Serious Applications (VS-Games), Athens, Greece, 6–8 September 2017; pp. 94–101. [Google Scholar]
- Doulamis, A.; Doulamis, N.; Kollias, S. Fuzzy video content representation for video summarization and content-based retrieval. Signal Process. 2000, 80, 1049–1067. [Google Scholar] [CrossRef]
- Ngo, C.W.; Ma, Y.F.; Zhang, H.J. Video summarization and scene detection by graph modeling. IEEE Trans. Circuits Syst. Video Technol. 2005, 15, 296–304. [Google Scholar]
- Medentzidou, P.; Kotropoulos, C. Video summarization based on shot boundary detection with penalized contrasts. In Proceedings of the 2015 9th International Symposium on Image and Signal Processing and Analysis (ISPA), Zagreb, Croatia, 7–9 September 2015; pp. 199–203. [Google Scholar]
- Song, Y.; Vallmitjana, J.; Stent, A.; Jaimes, A. TVSum: Summarizing Web Videos Using Titles. In Proceedings of the IEEE Conference on Computer Vision and Pattern Recognition (CVPR), Boston, MA, USA, 7–12 June 2015. [Google Scholar]
- Meng, J.; Wang, H.; Yuan, J.; Tan, Y.P. From Keyframes to Key Objects: Video Summarization by Representative Object Proposal Selection. In Proceedings of the IEEE Conference on Computer Vision and Pattern Recognition (CVPR), Las Vegas, NV, USA, 27–30 June 2016. [Google Scholar]
- Gharbi, H.; Bahroun, S.; Zagrouba, E. Key frame extraction for video summarization using local description and repeatability graph clustering. Signal Image Video Process. 2019, 13, 507–515. [Google Scholar] [CrossRef]
- Zhou, F.; De la Torre, F.; Hodgins, J.K. Hierarchical aligned cluster analysis for temporal clustering of human motion. IEEE Trans. Pattern Anal. Mach. Intell. 2012, 35, 582–596. [Google Scholar] [CrossRef] [PubMed]
- Zhou, F.; De la Torre, F. Spatio-Temporal Matching for Human Pose Estimation in Video. IEEE Trans. Pattern Anal. Mach. Intell. 2016, 38, 1492–1504. [Google Scholar] [CrossRef]
- Miura, T.; Kaiga, T.; Katsura, H.; Tajima, K.; Shibata, T.; Tamamoto, H. Adaptive keypose extraction from motion capture data. J. Inf. Process. 2014, 22, 67–75. [Google Scholar] [CrossRef]
- Bakalos, N.; Rallis, I.; Doulamis, N.; Doulamis, A.; Voulodimos, A.; Vescoukis, V.C. Motion Primitives Classification using Deep Learning Models for Serious Game Platforms. IEEE Comput. Graph. Appl. 2020, 40, 26–38. [Google Scholar] [CrossRef]
- Bernard, J.; Wilhelm, N.; Krüger, B.; May, T.; Schreck, T.; Kohlhammer, J. Motionexplorer: Exploratory search in human motion capture data based on hierarchical aggregation. IEEE Trans. Vis. Comput. Graph. 2013, 19, 2257–2266. [Google Scholar] [CrossRef]
- Saptoro, A.; Tadé, M.O.; Vuthaluru, H. A modified Kennard-Stone algorithm for optimal division of data for developing artificial neural network models. Chem. Prod. Process. Model. 2012, 7. [Google Scholar] [CrossRef]
- Protopapadakis, E.; Voulodimos, A.; Doulamis, A.; Camarinopoulos, S.; Doulamis, N.; Miaoulis, G. Dance pose identification from motion capture data: A comparison of classifiers. Technologies 2018, 6, 31. [Google Scholar] [CrossRef]
- Boyd, S.; Parikh, N.; Chu, E.; Peleato, B.; Eckstein, J. Distributed optimization and statistical learning via the alternating direction method of multipliers. Found. Trends Mach. Learn 2011, 3, 1–122. [Google Scholar] [CrossRef]
- Doulamis, A.D.; Voulodimos, A.; Doulamis, N.D.; Soile, S.; Lampropoulos, A. Transforming Intangible Folkloric Performing Arts into Tangible Choreographic Digital Objects: The Terpsichore Approach. In Proceedings of the VISIGRAPP (5: VISAPP), Porto, Portugal, 1–27 February 2017; pp. 451–460. [Google Scholar]


| Type of Dance | Description | Main Choreographic Steps |
|---|---|---|
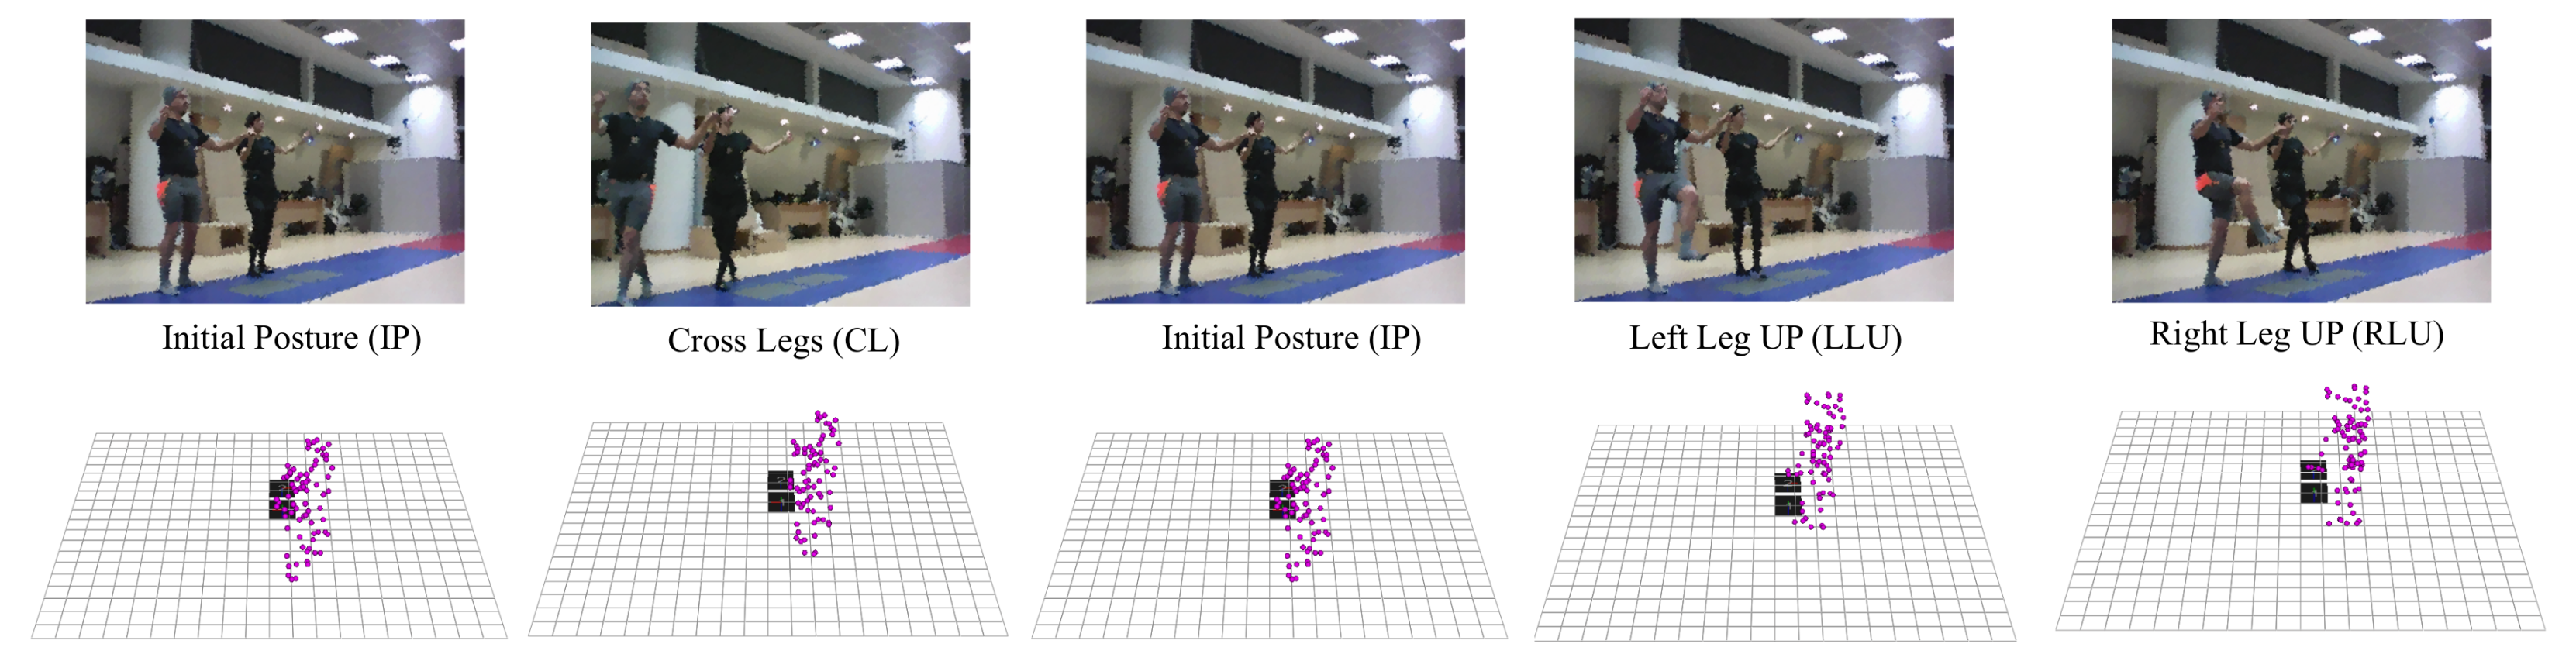
| Sirtos (3-Beat) | A Greek folklore dance in a slow rhythm performed by both women and men. | (1) Initial Posture (IP); (2) Cross Leg (CL); (3) Initial Posture (IP); (4) Left Leg Up (LLU); (5) Initial Posture (IP); (6) Right Leg Up (RLU) |
| Sirtos (2-Beat) | A Greek folkloric circular dance performed by both women and men, with a 7/8 musical beat. | (1) Initial Posture (IP); (2) Left Leg Back (LLB); (3) Cross Legs (CL); (4) Cross Legs (CL); (5) Cross Legs (CL); (6) Initial Posture (IP); (7) Right Leg Back (RLB); |
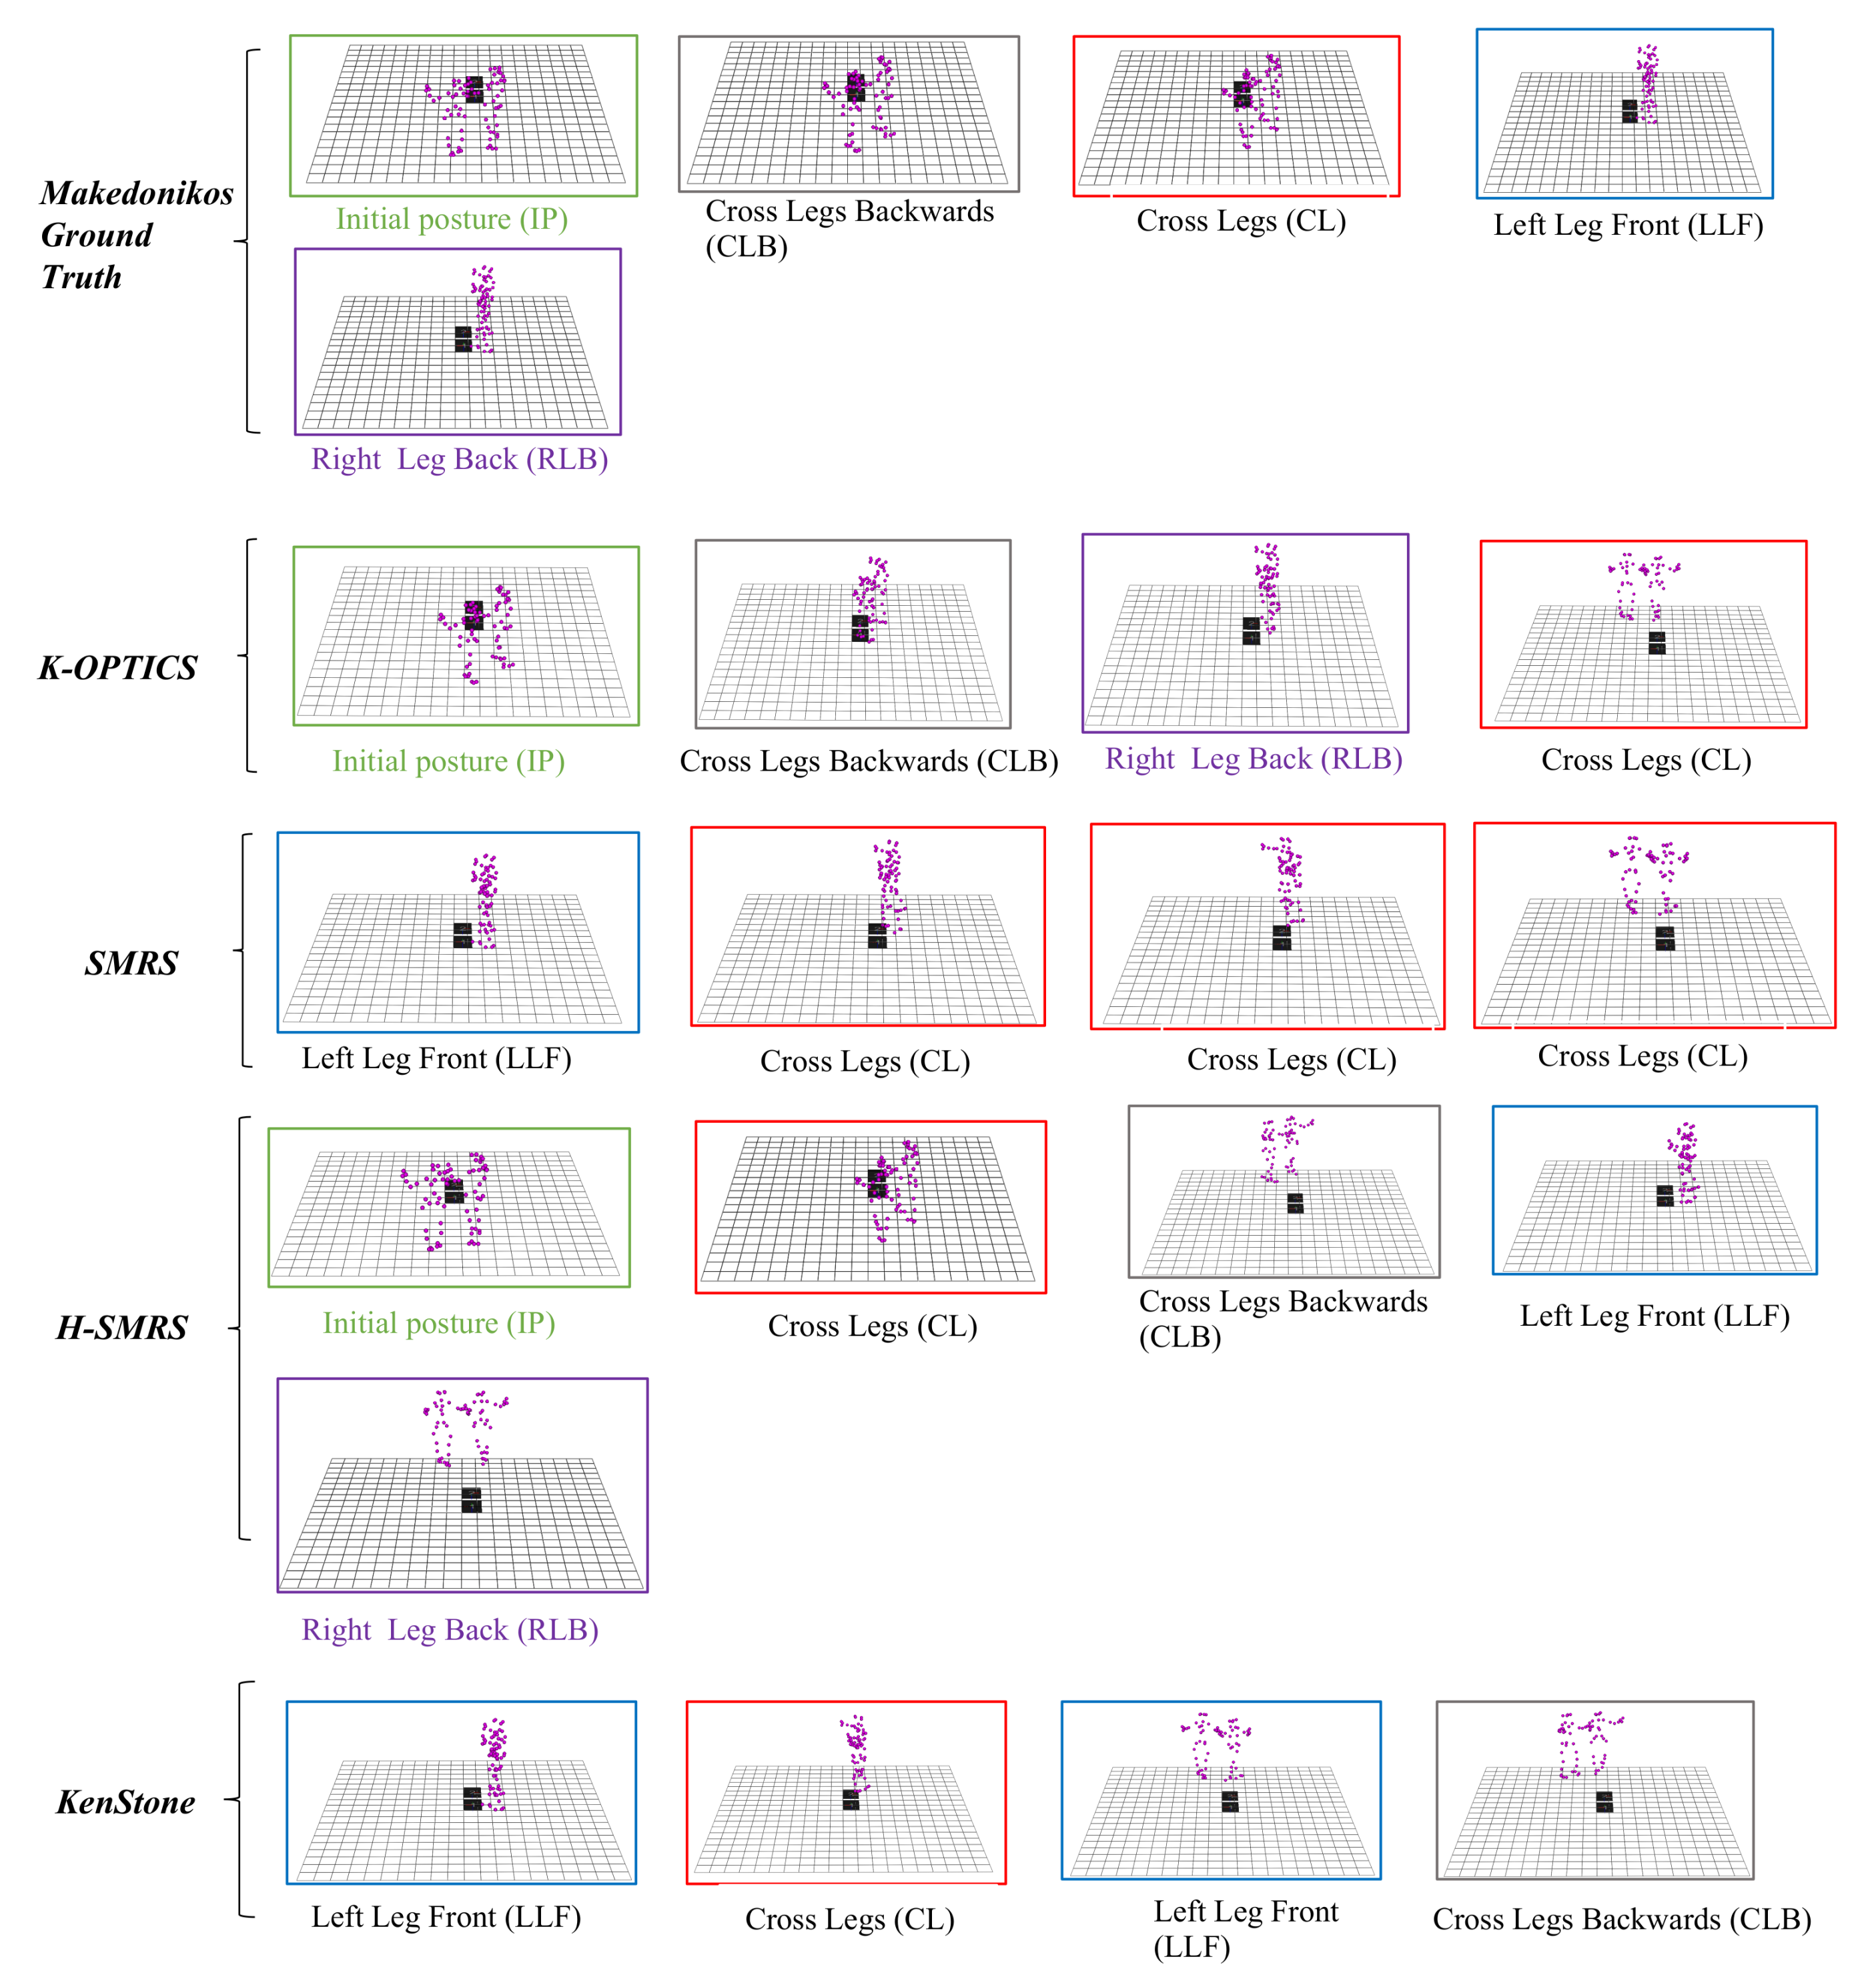
| Makedonikos | A Greek folkloric circular dance performed by both women and men, with a 9/8 musical beat. | (1) Initial Posture (IP); (2) Cross Legs Backwards (CLB); (3) Cross Legs (CL); (4) Left Leg Front (LLF); (5) Right Leg Back (RLB) |
| Dance Sequence | Max Correlation Without Corrupted Frames | Max Correlation with Corrupted Frames | Sampling Summarization Algorithm |
|---|---|---|---|
| Makedonikos | 0.64 | 0.52 | KenStone |
| 0.61 | 0.47 | K-OPTICS | |
| 0.65 | 0.53 | SMRS | |
| 0.65 | 0.53 | H-SMRS | |
| Syrtos (2-beats) | 0.30 | 0.29 | KenStone |
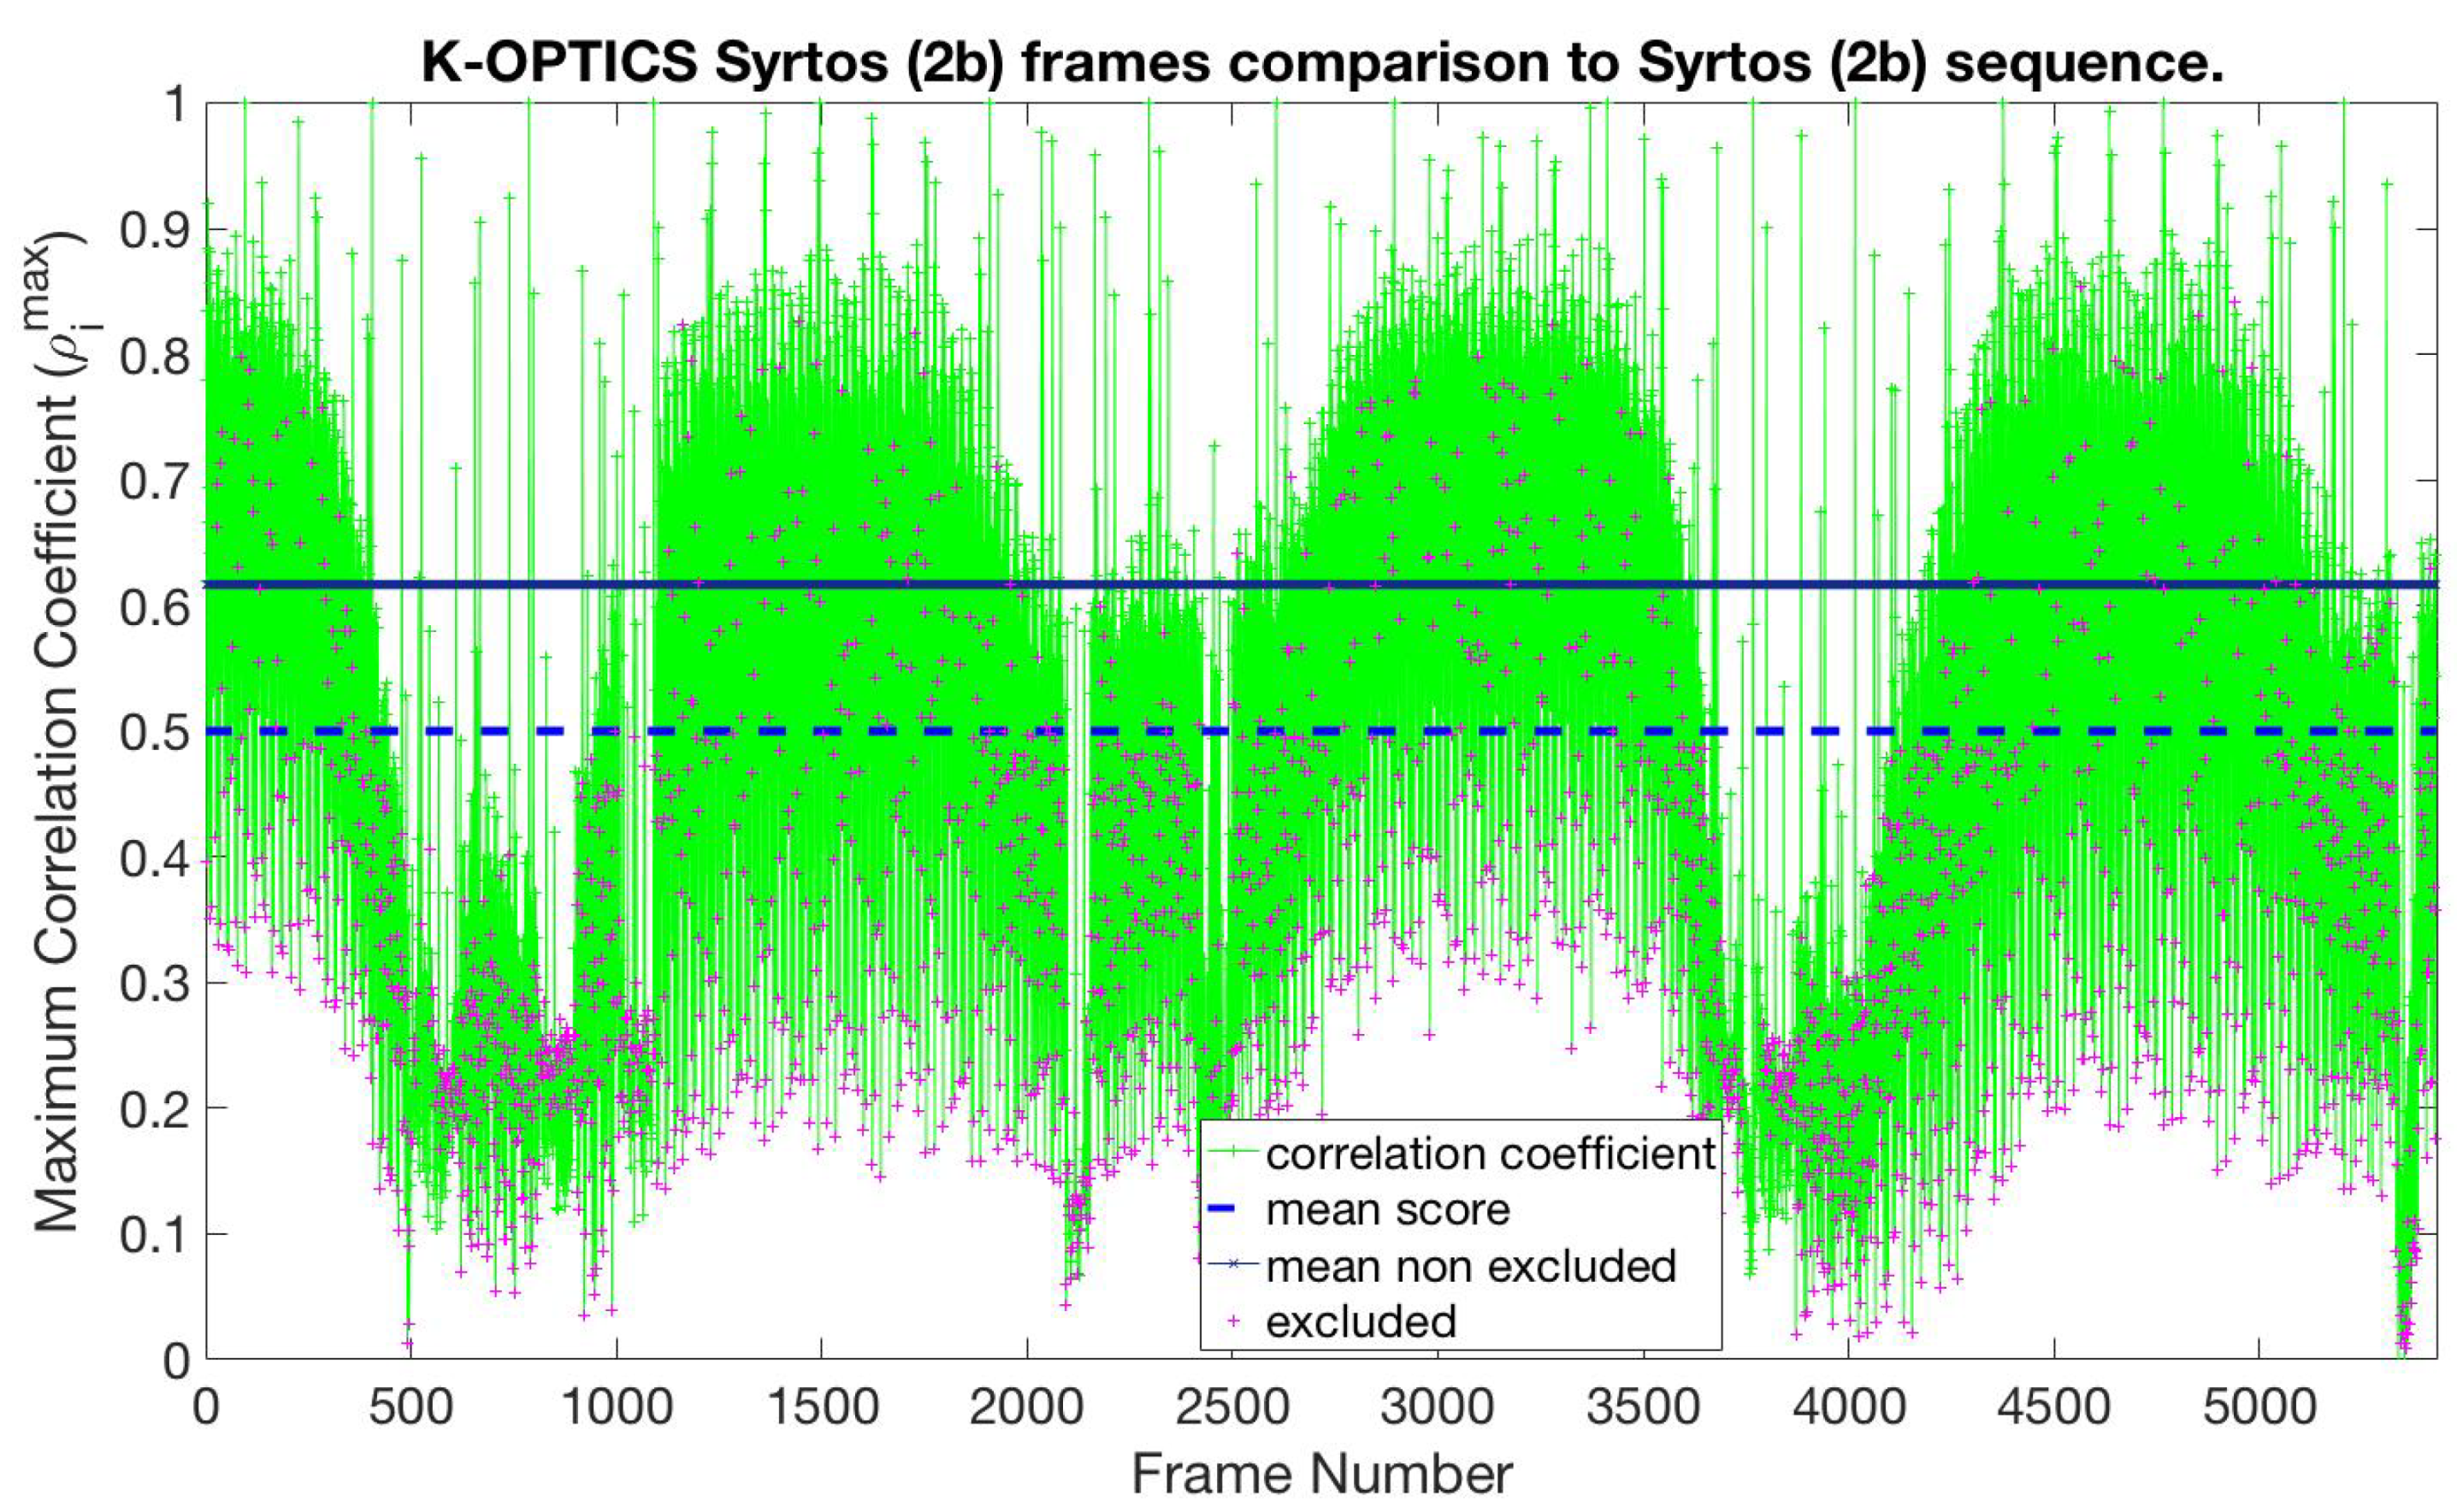
| 0.64 | 0.51 | K-OPTICS | |
| 0.57 | 0.43 | SMRS | |
| 0.57 | 0.43 | H-SMRS | |
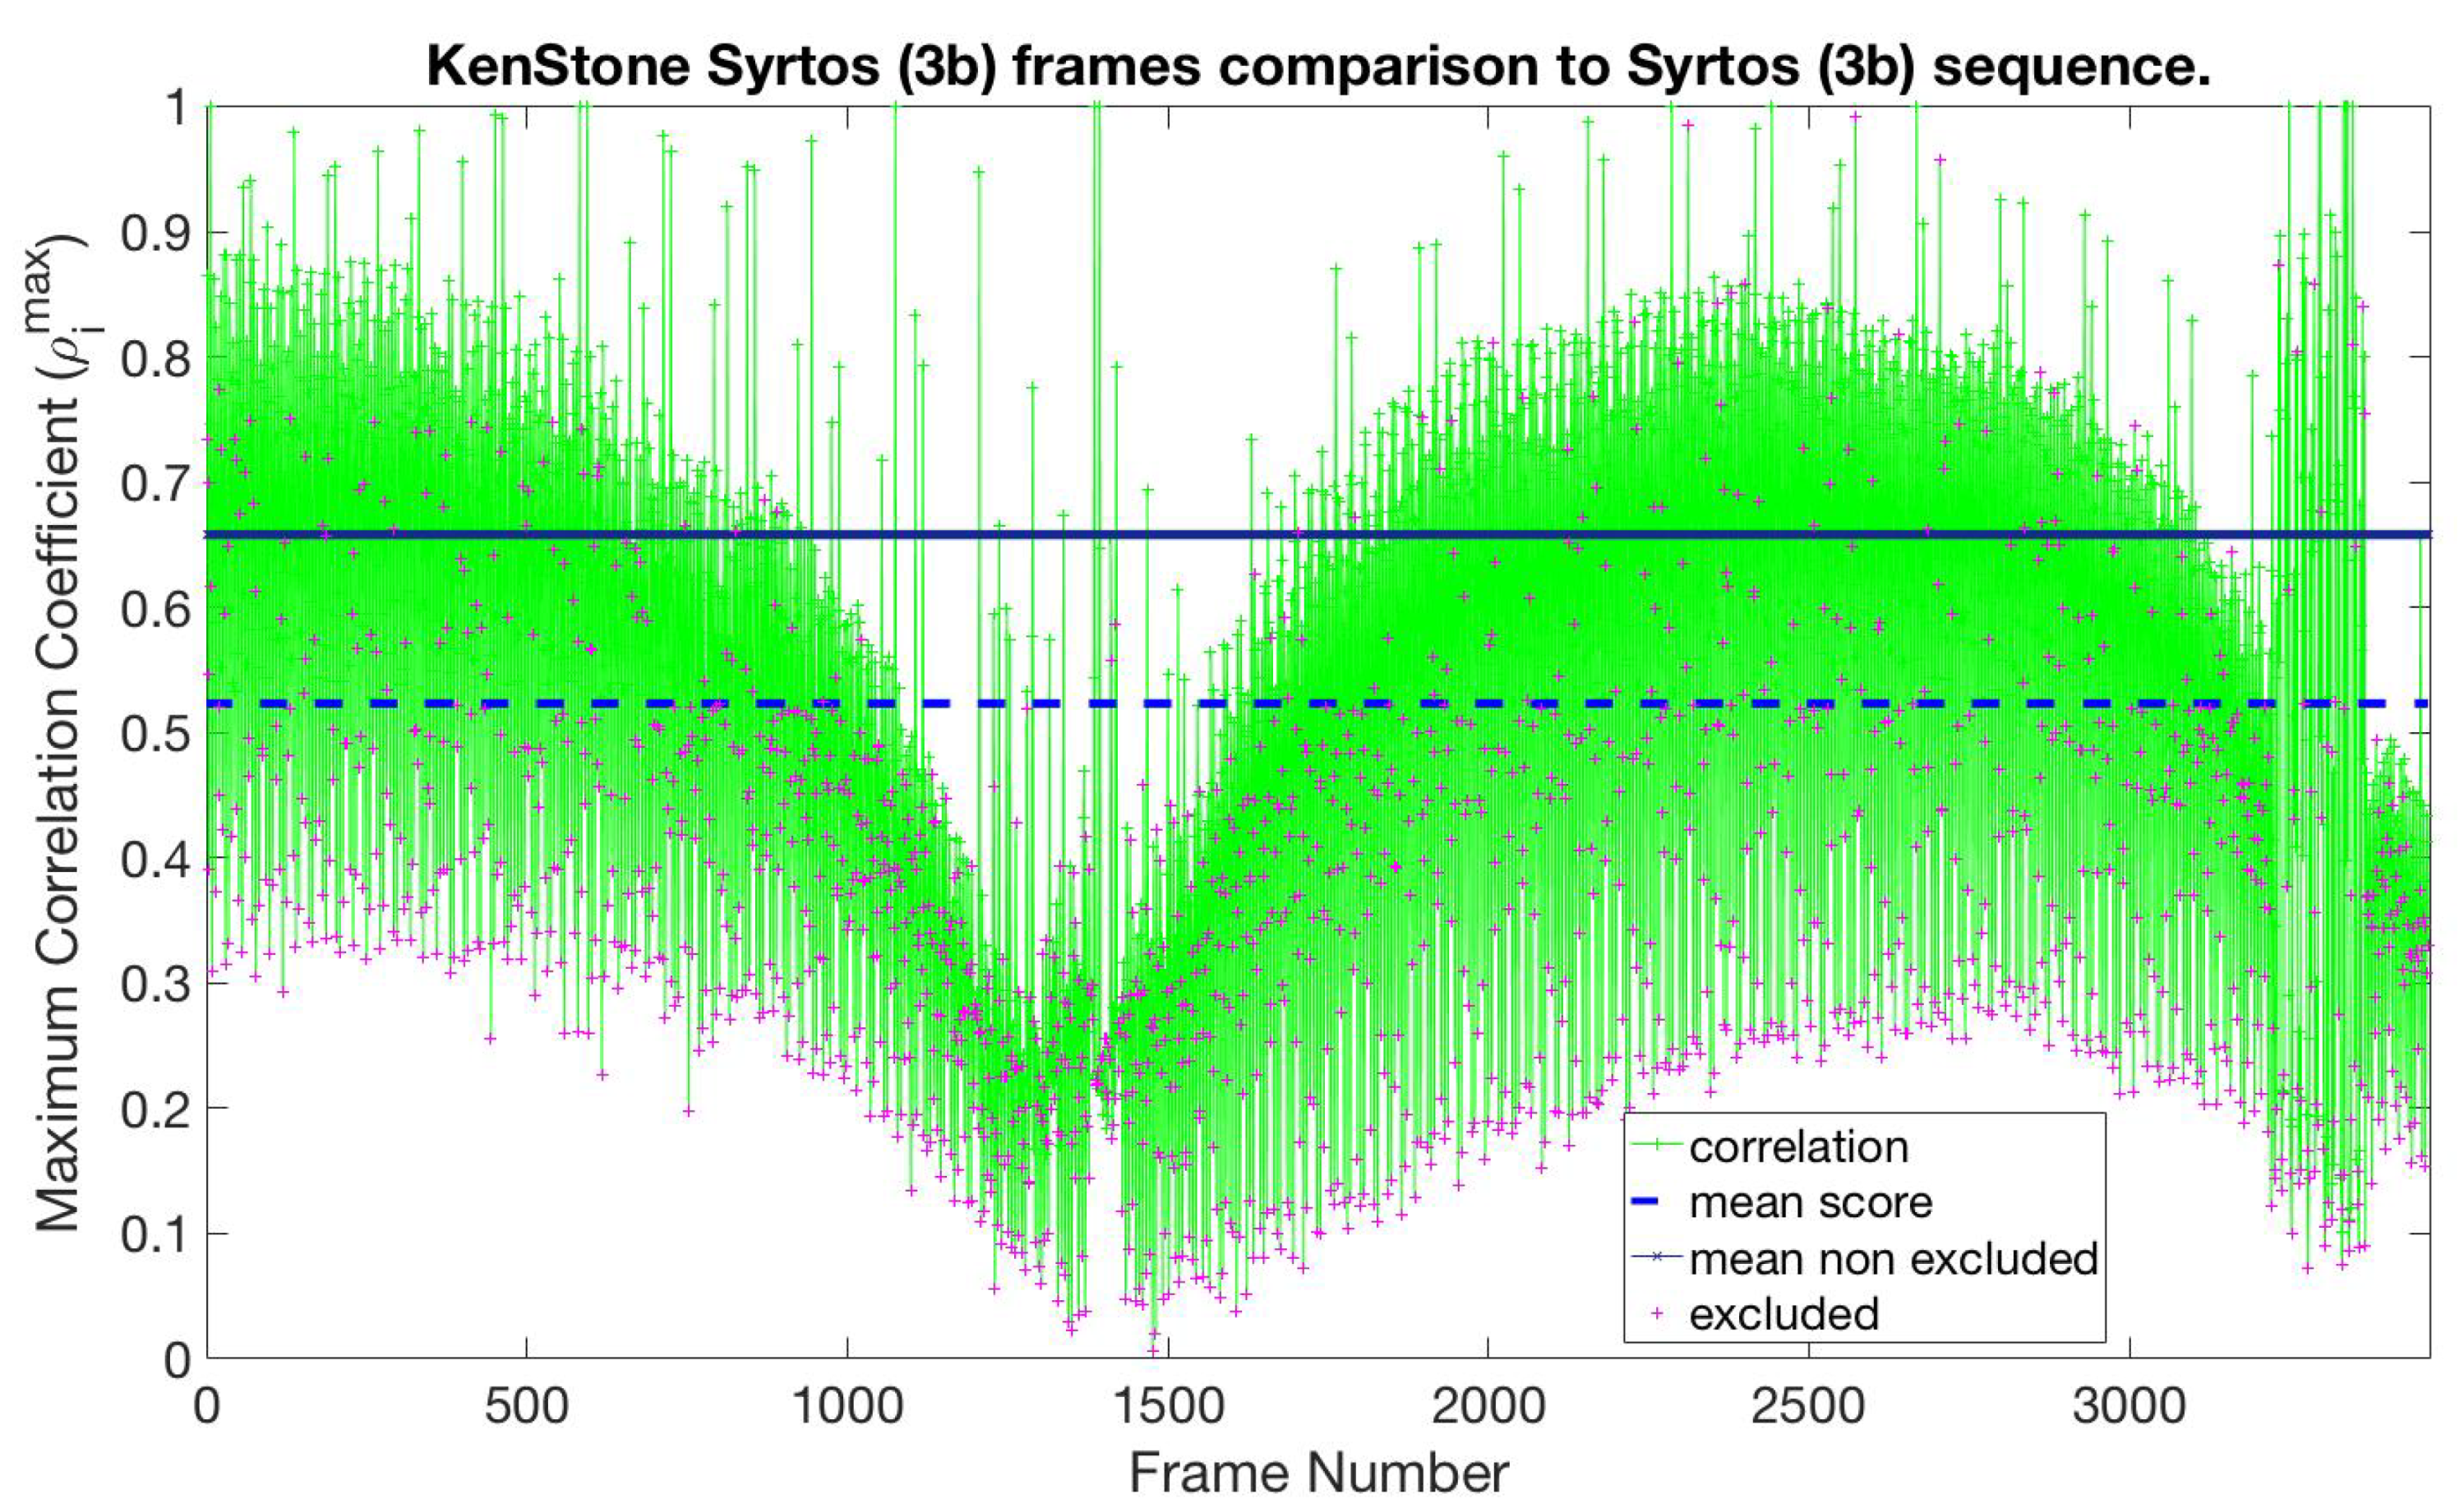
| Syrtos (3-beats) | 0.63 | 0.50 | KenStone |
| 0.60 | 0.48 | K-OPTICS | |
| 0.57 | 0.43 | SMRS | |
| 0.57 | 0.43 | H-SMRS |
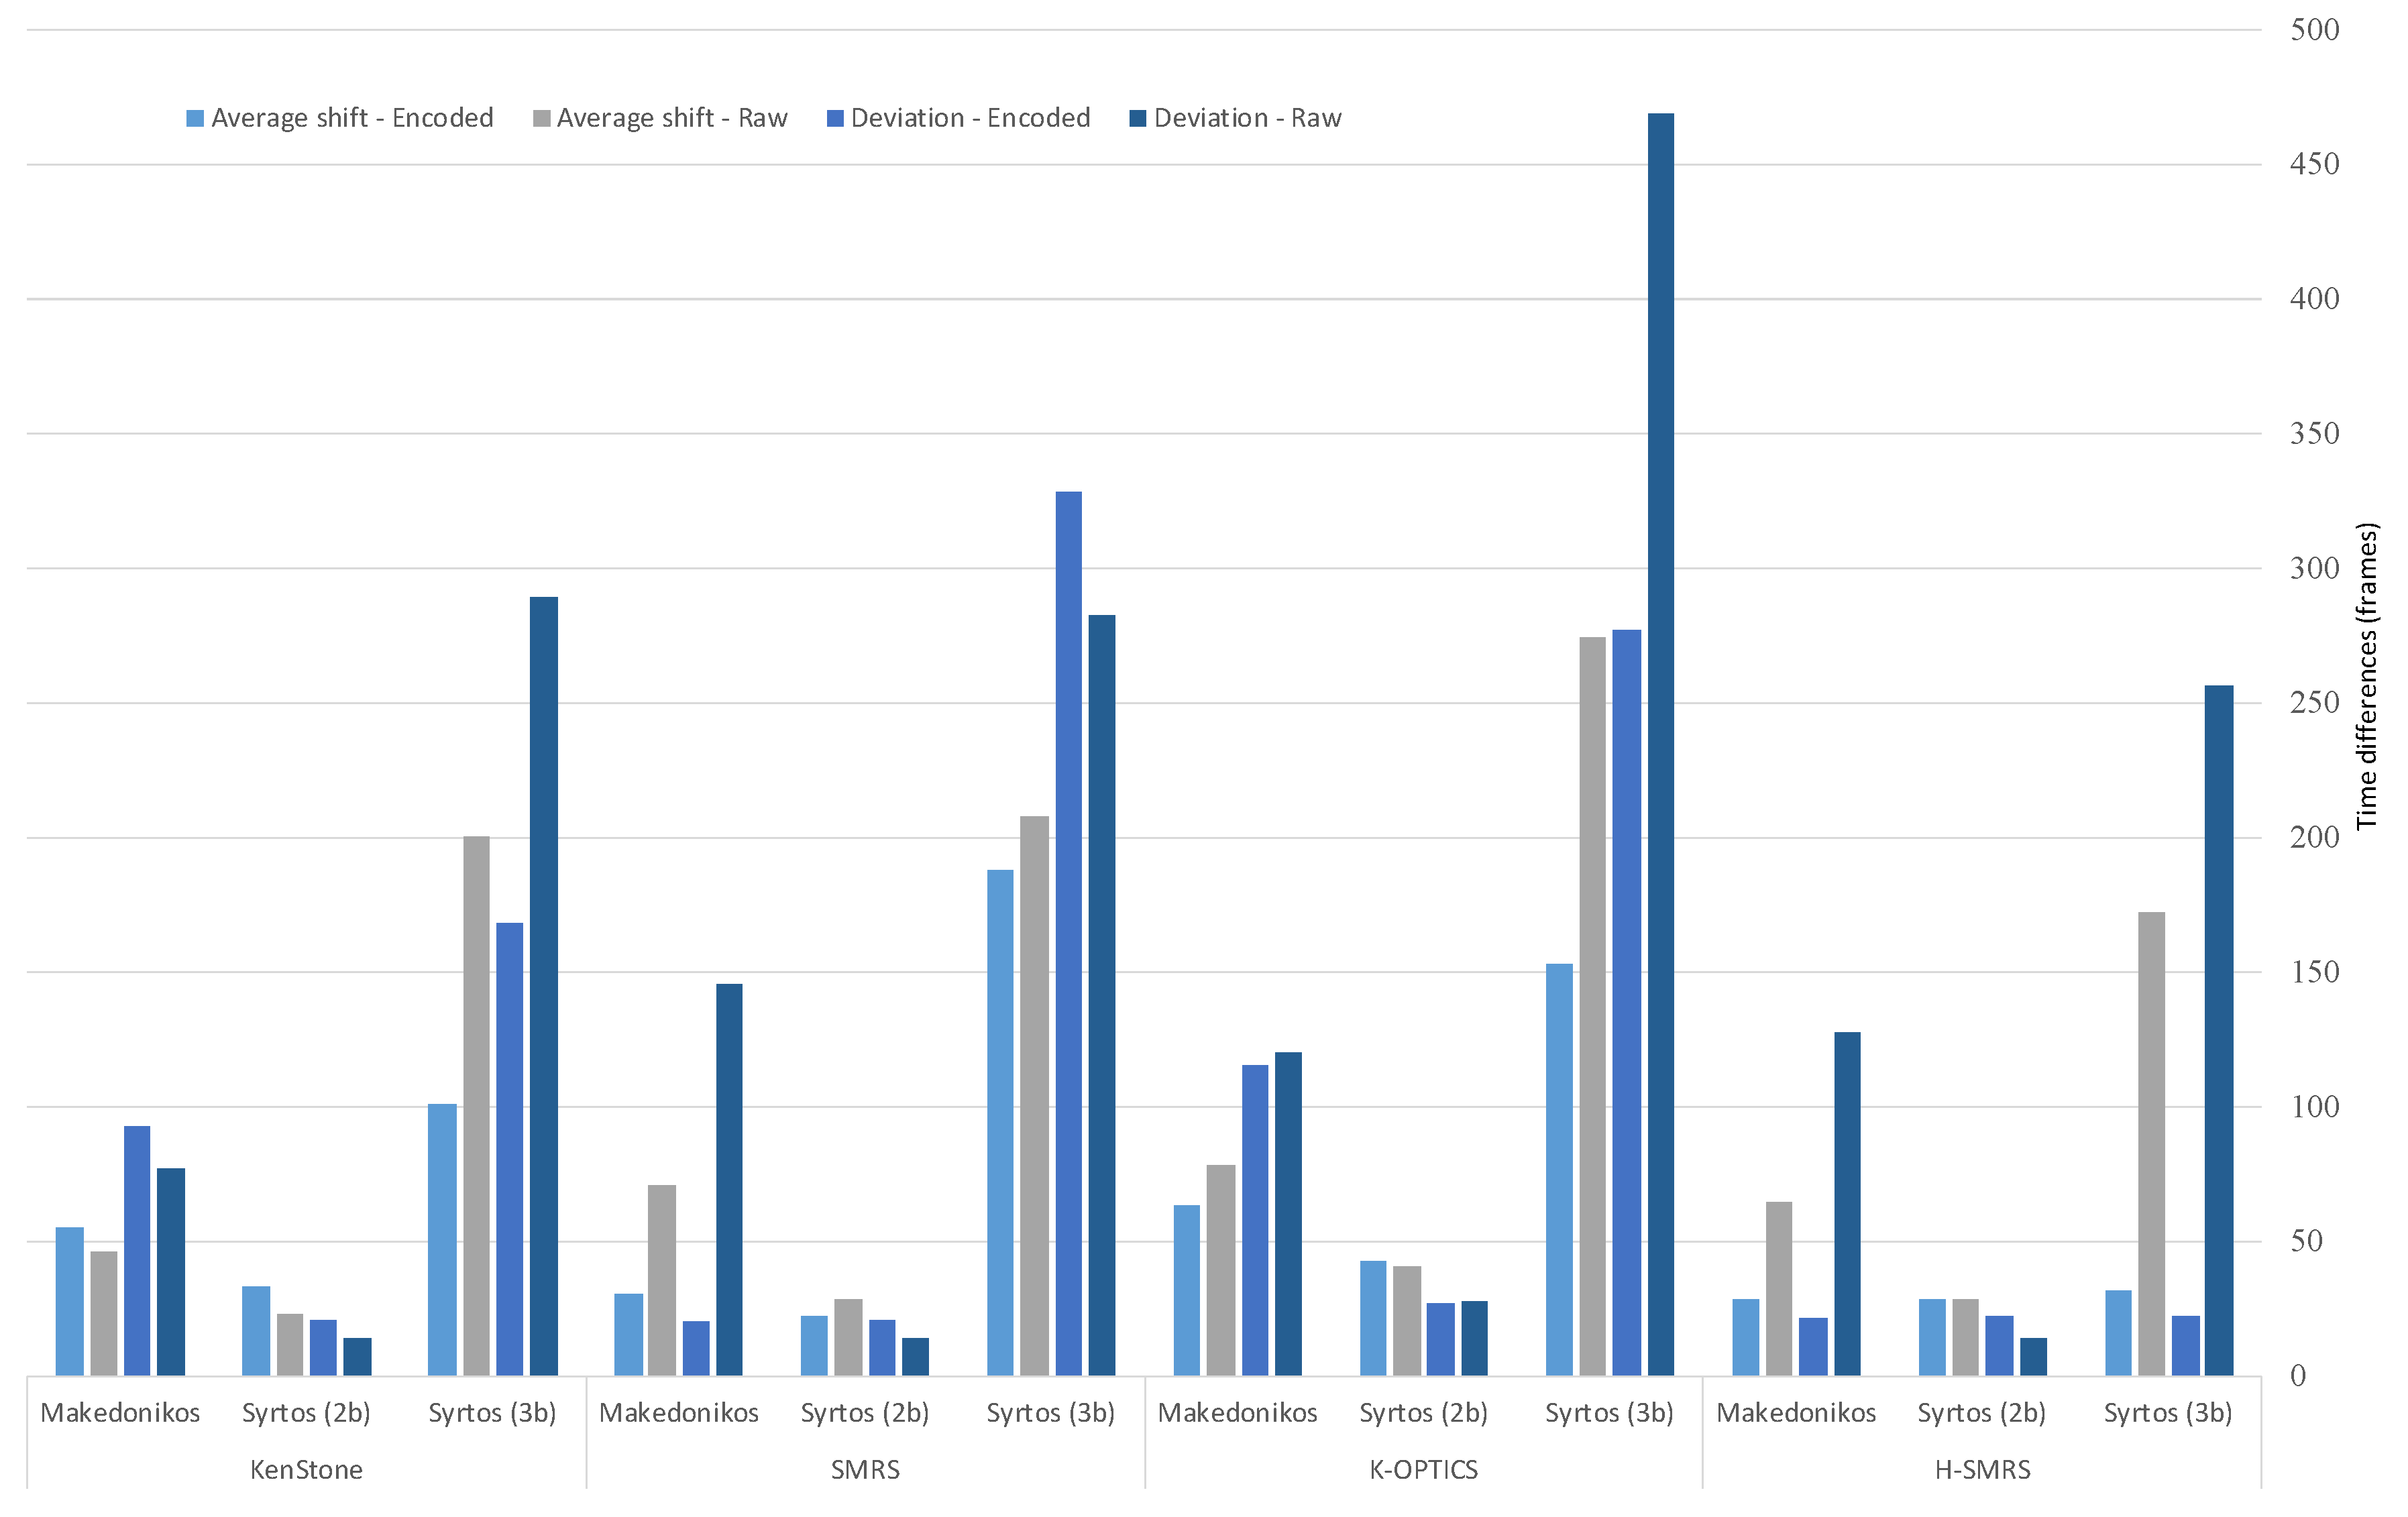
| Summarization Algorithm | Dance | Average Shift with SAE | Average Shift without SAE | Standard Deviation with SAE | Standard Deviation without SAE |
|---|---|---|---|---|---|
| KenStone | |||||
| Makedonikos | 0.46 | 0.38 | 0.78 | 0.64 | |
| Syrtos (2b) | 0.27 | 0.19 | 0.17 | 0.12 | |
| Syrtos (3b) | 0.84 | 1.67 | 1.4 | 2.41 | |
| SMRS | |||||
| Makedonikos | 0.25 | 0.59 | 0.17 | 1.21 | |
| Syrtos (2b) | 0.19 | 0.23 | 0.17 | 0.12 | |
| Syrtos (3b) | 1.03 | 1.73 | 2.74 | 2.35 | |
| K-OPTICS | |||||
| Makedonikos | 0.53 | 0.65 | 0.96 | 1 | |
| Syrtos (2b) | 0.34 | 0.36 | 0.23 | 0.23 | |
| Syrtos (3b) | 1.28 | 2.29 | 2.31 | 3.91 | |
| H-SMRS | |||||
| Makedonikos | 0.24 | 0.54 | 0.18 | 1.06 | |
| Syrtos (2b) | 0.23 | 0.24 | 0.18 | 0.12 | |
| Syrtos (3b) | 0.26 | 1.44 | 0.19 | 2.14 |
| Summarization Algorithm | Aver. Shift Without SAE (Single Dancer) | Aver. Shift With SAE (Single Dancer) | Improvement Ratio (Single Dancer) | Aver. Shift Without SAE (Two Dancers) | Aver. Shift With SAE (Two Dancers) | Improvement Ratio (Two Dancers) |
|---|---|---|---|---|---|---|
| KenStone | 0.51 | 0.47 | 6.96% | 1.67 | 0.84 | 49.79% |
| K-OPTICS | 0.51 | 0.51 | 0.67% | 1.28 | 2.29 | 79.15% |
| SMRS | 0.47 | 0.41 | 11.41% | 1.73 | 1.03 | 40.55% |
| H-SMRS | 0.45 | 0.31 | 31.15% | 1.44 | 0.26 | 81.80% |
| Dance | Minimum Difference | Maximum Difference | Sampling Summarization Algorithm |
|---|---|---|---|
| Makedonikos | 0.06 s | 5.20 s | KenStone |
| 0.04 s | 6.71 s | K-OPTICS | |
| 0.04 s | 6.66 s | SMRS | |
| 0 s | 0.72 s | H-SMRS | |
| Syrtos (2-beats) | 0.008 s | 4.45 s | KenStone |
| 0.016 s | 3.88 s | K-OPTICS | |
| 0.016 s | 0.5 s | SMRS | |
| 0 s | 0.74 s | H-SMRS | |
| Syrtos (3-beats) | 0.041 s | 0.54 s | KenStone |
| 0.116 s | 0.808 s | K-OPTICS | |
| 0.033 s | 0.541 s | SMRS | |
| 0 s | 0.55 s | H-SMRS |
Publisher’s Note: MDPI stays neutral with regard to jurisdictional claims in published maps and institutional affiliations. |
© 2020 by the authors. Licensee MDPI, Basel, Switzerland. This article is an open access article distributed under the terms and conditions of the Creative Commons Attribution (CC BY) license (http://creativecommons.org/licenses/by/4.0/).
Share and Cite
Protopapadakis, E.; Rallis, I.; Doulamis, A.; Doulamis, N.; Voulodimos, A. Unsupervised 3D Motion Summarization Using Stacked Auto-Encoders. Appl. Sci. 2020, 10, 8226. https://doi.org/10.3390/app10228226
Protopapadakis E, Rallis I, Doulamis A, Doulamis N, Voulodimos A. Unsupervised 3D Motion Summarization Using Stacked Auto-Encoders. Applied Sciences. 2020; 10(22):8226. https://doi.org/10.3390/app10228226
Chicago/Turabian StyleProtopapadakis, Eftychios, Ioannis Rallis, Anastasios Doulamis, Nikolaos Doulamis, and Athanasios Voulodimos. 2020. "Unsupervised 3D Motion Summarization Using Stacked Auto-Encoders" Applied Sciences 10, no. 22: 8226. https://doi.org/10.3390/app10228226
APA StyleProtopapadakis, E., Rallis, I., Doulamis, A., Doulamis, N., & Voulodimos, A. (2020). Unsupervised 3D Motion Summarization Using Stacked Auto-Encoders. Applied Sciences, 10(22), 8226. https://doi.org/10.3390/app10228226