Article

Selection Strategy of Vibration Feature Target under Centrifugal Pumps Cavitation

National Research Center of Pumps, Jiangsu University, Zhenjiang 212013, China
*
Author to whom correspondence should be addressed.
Appl. Sci. 2020, 10(22), 8190; https://doi.org/10.3390/app10228190
Submission received: 11 October 2020 / Revised: 2 November 2020 / Accepted: 12 November 2020 / Published: 19 November 2020
(This article belongs to the Section Acoustics and Vibrations)

Abstract

:
The cavitation states among centrifugal pumps can be mirrored by corresponding vibration features. To select the vibration feature target scientifically and objectively for monitor the cavitation states in real time, the analysis method of grey slope correlation with weight entropy was proposed in this paper to explore the relevance between cavitation and vibration features. Thus, the net positive suction head (NPSH) and vibration signal from centrifugal pumps under multiple operation conditions were captured. Moreover, the universal feature targets were extracted from the vibration signal. The grey slope correlation method was applied in the analysis of the positive and negative relevance between NPSH and the multiple operation conditions in a different stage. These feature targets are transformed into the same numerical scale by standardization process. In the end, the final comprehensive coefficient can be attached after endowing power by weight entropy method. These methods can be used to determine the feature targets which have intensive relevance with NPSH. The analysis results indicate that the kurtosis factor, variance, absolute mean, and root mean square obtained from the vibration acceleration signal have stable relevance with NPSH. These feature targets can be used for the proper detection and evaluation of cavitation states in centrifugal pumps. Therefore, the analysis method of grey slope correlation with weight entropy can be used to pre-select the feature targets based on the calculated grey incidence. This method is effective in establishing the relevance between NPSH and vibration.

1. Introduction

Real-time monitoring based on centrifugal pumps [1] has become a trending research point in the hydraulic machine as a result of development in artificial intelligence and communication technology. Nowadays, the acceleration signal can be received by vibration transducer and processed by corresponding algorithm, such as wavelet packet transform (WPT) and empirical mode decomposition (EMD) [2]. The acquired data from hydraulic machine [3,4] can be used to identify pump working states and give a valid disposal scheme based on intelligence diagnosis [5]. These can considerably reduce contingency occurrence probability and prolong the pump life cycle. However, in the real experiments, an error could be found due to poor incidence such as background noise and vibration, flow rate setting error, the influence of reflecting surfaces around the instrument, even the distance between the pump and the instrument [6]. Meanwhile, it is important to ensure that the applied data are robust enough to give an accurate result and reduce the misjudgment ratio induced by the diagnostic algorithm. In the present study, the selection of feature parameters extracted from the acceleration signal is a random and tedious process for some scholars which usually leads to ideal output. Considering the relevance between the independent variable and dependent variable as a most fundamental task, ensuring the significant degree and priority among the feature targets before the running of analysis code enable the scholar to pay more attention in digging valuable results from vast amount of data.
Currently available results indicated that the suction pressure difference might change the pump vibration states [7,8,9], although this sort of vibration feature has a different appearance in different working flow rates [10,11,12,13,14,15,16]. However, cavitation can be defined as the rupture of a liquid due to a pressure drop [17]. It can be identified by vibration feature due to bubble burst. In these cited works of signal process, the feature target is a key element which should be considered and determined. Thus, root mean square (RMS) might be the most popular and universal parameter since it can be extracted from a historical vibration signal and reflect the cavitation occurrence. For instance, Dong et al. [18] and Zhang et al. [19] selected the concept of energy developed from the RMS to establish the potential variation caused by suction pressure and working flow rates. Similarly, to acquire the situations in different net positive suction head (NPSH), the RMS of acceleration in different monitor points displaced on the pump was captured to mirror the cavitation states [20]. Moreover, the parameters like the mean, variance, standard deviation, skewness, kurtosis, and crest factor were also used to carry out this kind of work [21]. In the literature [22], empirical mode decomposition (EMD) method with these parameters was used to decompose original signals into a number of intrinsic mode functions (IMFs). In the process of diagnosing the flow instabilities [23], the most troubling and confusion things were that different feature target selection might disturb the evaluation while the pump is working in the cavitation or air injection mode. The result points out the fact that the feature target might have different sensitivity under various circumstances.
As mentioned in the first part, all the feature target selections were based on perceptual cognizance and personal experience. The details of strict mathematical explanation about why these targets can be used to evaluate the vibration manner were not adequately captured in the literature. It is against this backdrop that this research was conceived to find a reliable way to execute a robust and reliable relation between variables which would give an absolute fact instead of ambiguous justification identified by Al-Obaidi [24]. On the condition of the small sample, variety and complexity of uncertain factors, multivariate analysis cannot be directly applied. Grey relation analysis, a branch of grey system theory, as an effective method to evaluate the relevance between variants, has exhibited its charming and universality in the multifarious discipline. For instance, in the automatic driving [25], the parameters which affect safe driving can be extracted and analyzed. In the iron austempering [26], it can be used to establish the relationship between temperature and machinability performance. In the architectural planning [27], it can be used to evaluate and ensure the substation site selection.
Above all, the grey relation method would be applied in the pump field to determine what targets derived from the initial vibration signal have an intensity relation with the NPSH. Moreover, the information entropy method would be used in the research to sort out the relevant parameters for its importance degree.

2. Grey Relation Entropy Analysis Method

2.1. Grey Slope Correlation Method

Although the traditional Deng’s relation computation has perfectly solved issues like small samples and poor information, some limited applied conditions are worthy of discussion in this algorithm. Existing literature [28,29] about pump parameter assumption established the use of positive correlation between variables. Meanwhile, there is a potential risk that a negative correlation may exist between NPSH and vibration feature. This situation makes it difficult to completely rely on the traditional method to draw a conclusion since it could result in fatal errors. As a result, the improved algorithm and grey slope correlation can be more appropriate in solving these problems. In the improved algorithm method, the slope is used to establish the relevance of the relationship between the numerical interval of −1 and 1. While the absolute slope value is closer to one, the extracted feature is more sensitive to NPSH. On the contrary, the insensitivity between two variables due to the positive and negative sign convention is a reflection of its positive or negative characteristic. Hence, a new method needs to be established that can account for both positive and negative characteristics between cavitation and vibration. Thus, to evaluate the feature target, the acquired data need to be validated and transformed into a unified standard. The above process is an essential part in the assessment process which enables the application of the weight entropy method in order to solve the problem.

2.2. Weight Entropy Method

Weight entropy is an objective weighting method. This concept was originally introduced into information theory from thermodynamics by Shannon [30]. For this method, if the feature values of the research target have a tremendous difference on some index, the entropy is small which indicates that this index can provide massive valid information and the weight should be vast. On the contrary, if the feature values of research target have a small difference on some index, the entropy is large which indicates that this index can provide a tiny amount of effective information and the weight should be small.

2.3. Calculation Process

The concrete steps of grey slope correlation with weight entropy methods are listed as follows.
Step 1: Define reference sequence (RS) and comparative sequence (CS)
Suppose N = { N ( P 1 ) , N ( P 2 ) , N ( P 3 ) , , N ( P n ) } as the reference sequence, which indicates the sequence of tabulated data of NPSH, where Pn represents the real-time pressure on nth times. Vibration features are taken as the comparative sequence, that is V i = { V i ( P 1 ) , V i ( P 2 ) , V i ( P 3 ) , , V i ( P n ) } , i = 1 , 2 , , k , which denotes the comparative sequence.
Step 2: Make sequence be dimensionless
Due to the values’ physical scale difference, the maximum value treatment can be used to normalize the data. This mathematical process can enable us to obtain more accurate results in the grey correlation analysis. The preprocessing can express as:
P n max = P n max { P n } , n = 1 , 2 , 3 , , m
X ( P n max ) = N ( P n ) max { N ( P n ) } , n = 1 , 2 , 3 , , m
Y i ( P n max ) = V i ( P n ) max n { V i ( P n ) } , n = 1 , 2 , 3 , , m
Step 3: Calculate the coefficient of grey slope correlation
For the unequal interval sequence, define the grey slope correlation coefficient as
ξ i ( P n max ) = sgn ( Δ X ( P n max ) , Δ Y i ( P n max ) ) Θ
where,
sgn ( Δ X ( P n max ) , Δ Y i ( P n max ) ) = { 1 , Δ X ( P n max ) Δ Y i ( P n max ) 0 1 , Δ X ( P n max ) Δ Y i ( P n max ) < 0
Θ = 1 + | 1 X ¯ Δ X ( P n max ) Δ P n max | 1 + | 1 X ¯ Δ X ( P n max ) Δ P n max | + | 1 X ¯ Δ X ( P n max ) Δ P n max 1 Y ¯ i Δ Y i ( P n max ) Δ P n max |
{ Δ X ( P n max ) = X ( P n max ) X ( P n 1 max ) Δ Y i ( P n max ) = Δ Y i ( P n max ) Δ Y i ( P n 1 max ) Δ P n max = P n max P n 1 max , n 2
Y ¯ i = 1 m n = 1 m Y i ( P n max )
X ¯ = 1 m n = 1 m X ( P n max )
Step 4: Standardize the target matrix ξ i ( P n max )
As the uncertainty of positive and negative value exist in ξ i ( P n max ) , therefore, the transmitting to the same sign is necessary for this paper.
Define, R i n = ( ξ i ( P n max ) ) i × n
If the sequence belongs to the larger-the-better type-like positive value, the comparable sequence (CS) is calculated as
R i n = R i n min { R i n } n max { R i n } n min { R i n } n
If the sequence belongs to the smaller-the-better type like negative value, the comparable sequence (CS) is expressed as
R i n = max { R i n } R i n n max { R i n } n min { R i n } n
where R i n [ 0 , 1 ]
Step 5: Calculate grey slope correlation entropy
Define the entropy of the nth to be:
H n = 1 ln m n = 1 m f i n ln f i n
where, f i n = R i n n = 1 m R i n , while R i n * = 0 , let R i n * ln R i n * = 0
Then, the nth entropy coefficient is:
ω n = 1 H n n = 1 m 1 H n
Step 6: Calculate final comprehensive coefficient
From the weight entropy, the final coefficient can be expressed as
ξ i = n = 1 m ω ( n ) R i n ( n )
Accordingly, the ranking rule of the grey slope correlation sequence is obtained. The higher the entropy correlation degree of the comparison column and the reference column is, the greater the influence on the reference column will be.

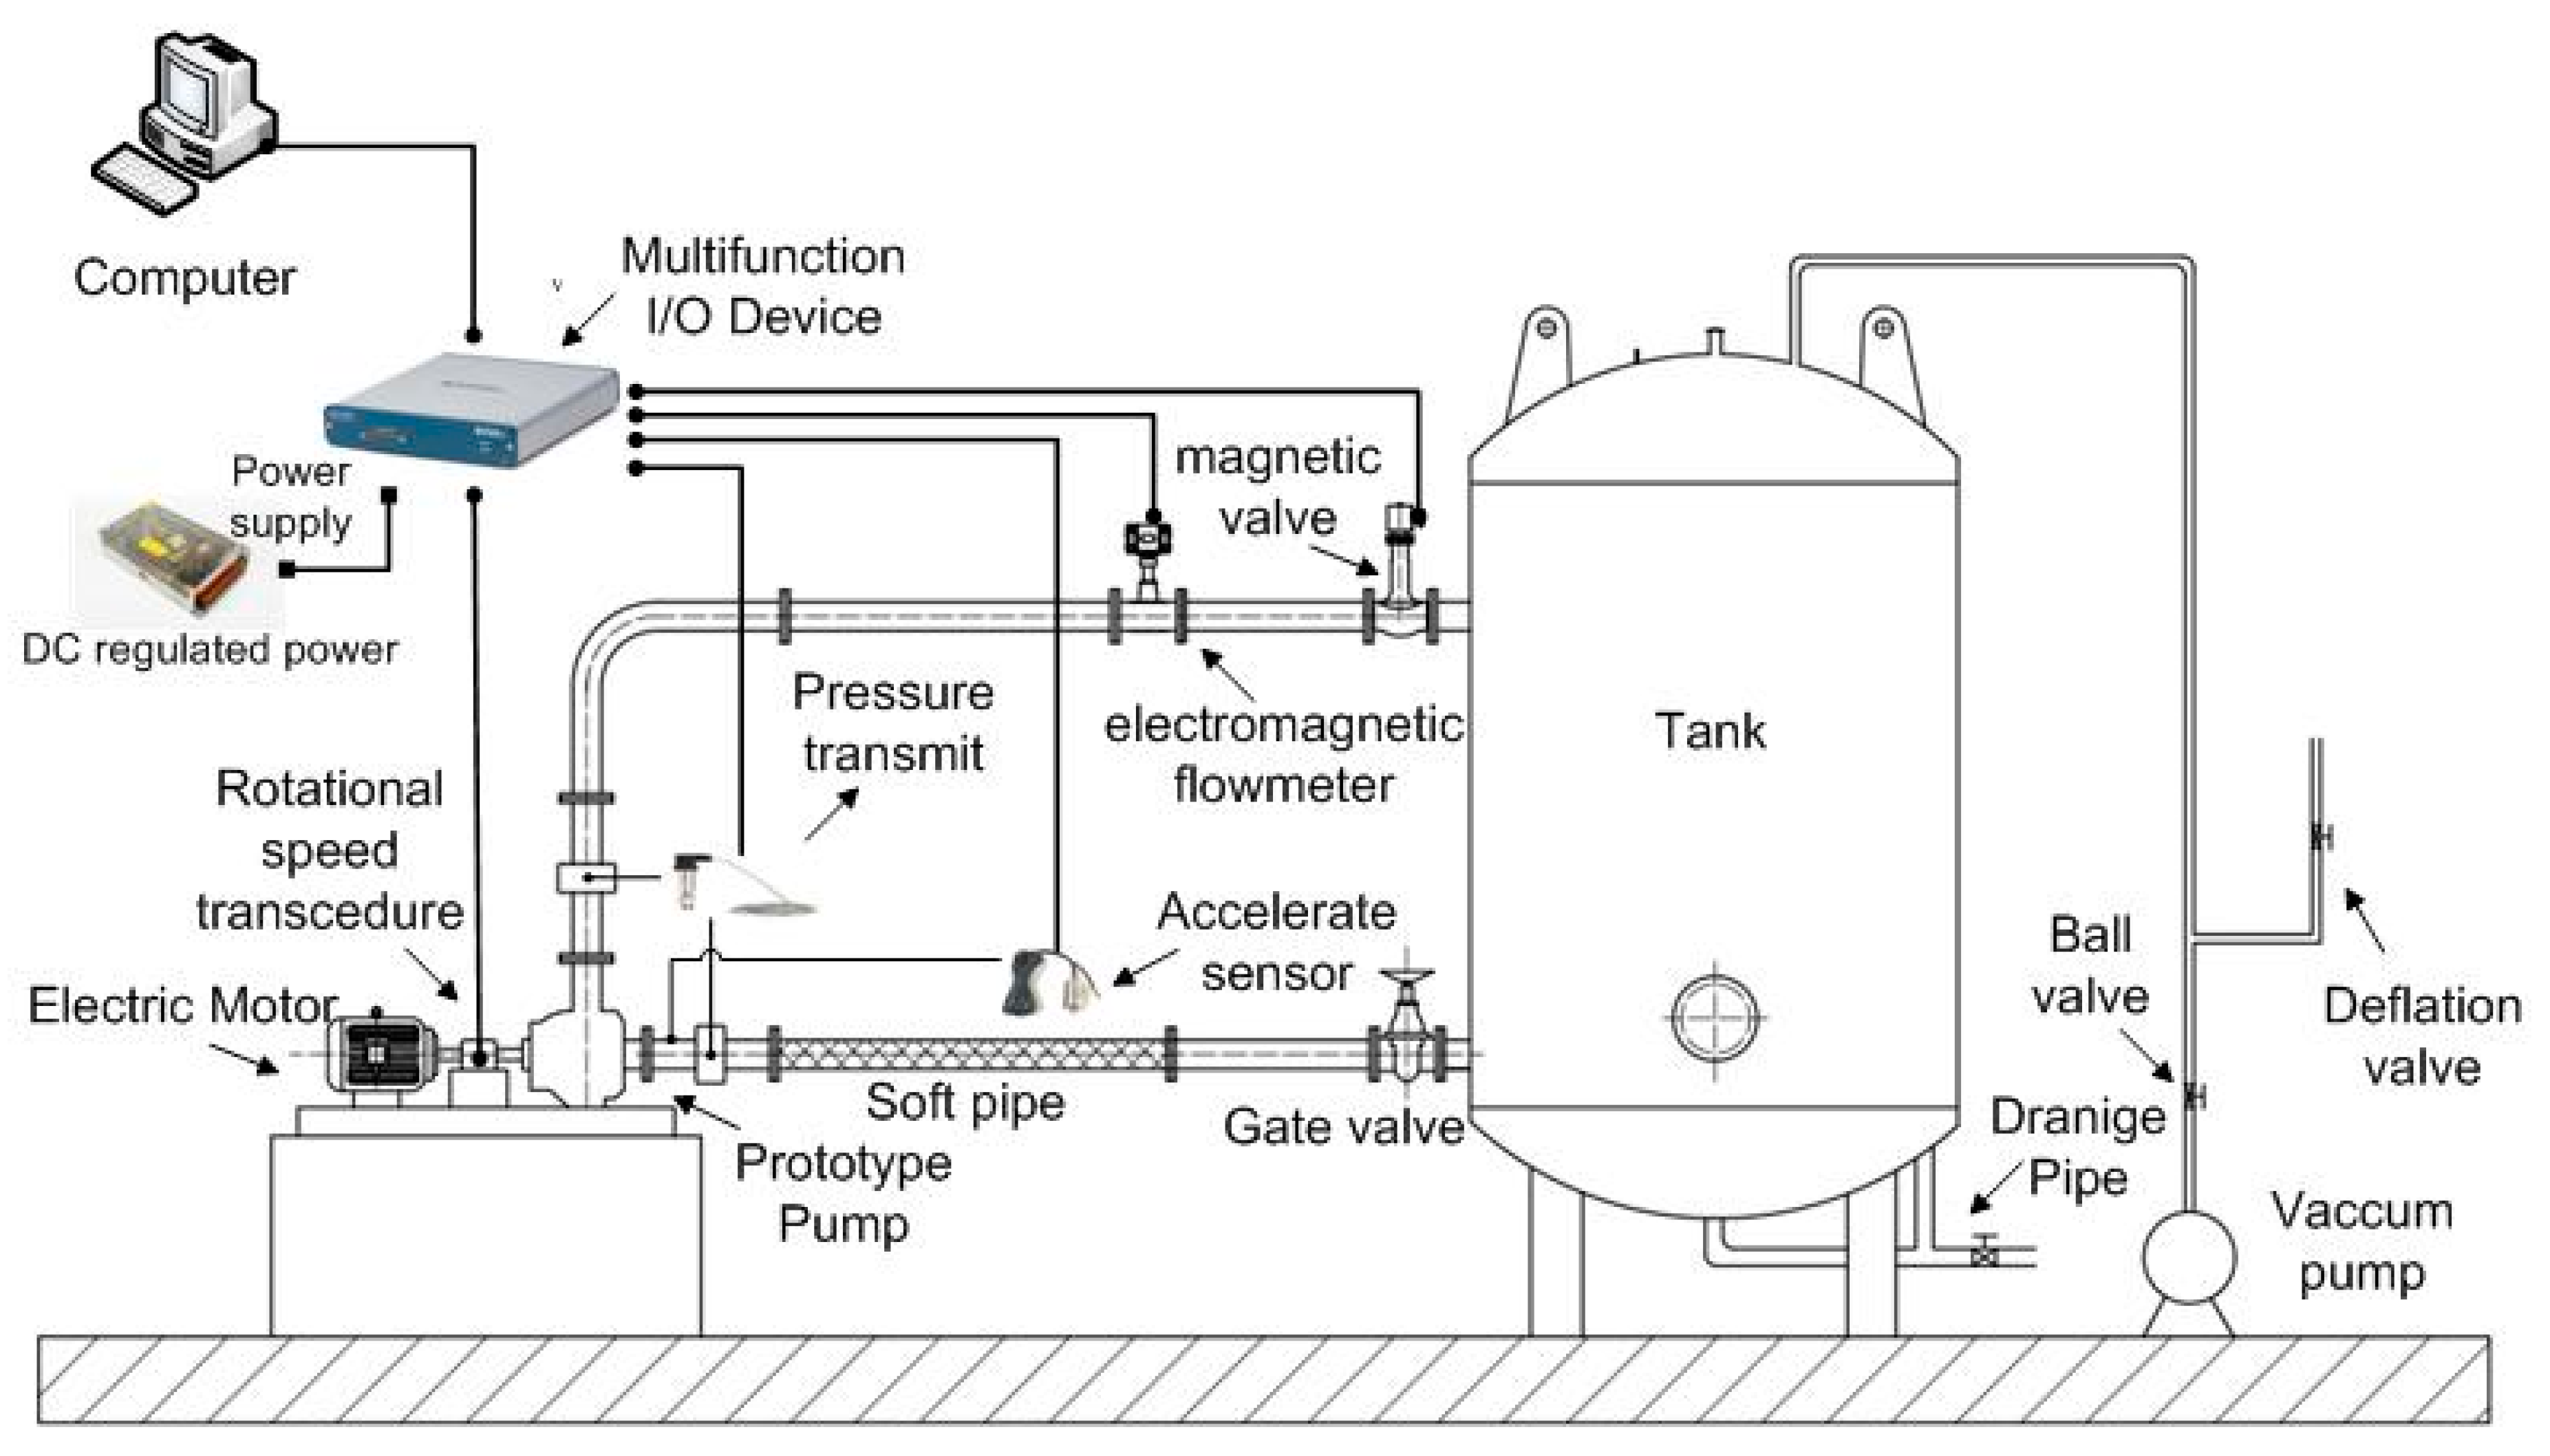
3. Signal Capture and Pretreatment

In order to verify the scientific feasibility of the proposed method as described earlier in Section 2.1 and Section 2.2, a handle process was adopted as shown in Figure 1. The experiments were conducted in multiple suction pressure under three flow rate points. The vibration features were extracted from its vibration acceleration signal.

3.1. Test Rig

The experiments were carried out on a closed test rig located within Jiangsu University as presented in Figure 2. In the cyclic process, the fluid from the tank enters into the pump through the soft pipe by the rotational effect of the impeller. The impeller transfers the fluid back to the tank through the elbow sections, electromagnetic flowmeter (for monitor flow rate) and magnetic valve (for adjust flow rate).
Table 1 shows the important geometric and operational parameters of the prototype pump under investigation.

3.2. Experiment Instrument

In this experiment, vibration acceleration and suction pressure data were monitored and recorded in detail. The vertical vibration acceleration signals of suction pipe ektexine were monitored using a computer and these signals were saved under different operating conditions of pressure. Figure 3 shows the monitor location on the tested pump.
The sensor used in this experiment is a high frequency sensor (PCB 352A60 series) with a sensitivity value of 10 mv/g and the frequency response range of ±500 g/Hz. A pressure transmitter (WIKA S-10) with ±0.2% accuracy in full scale was used to record the pressure difference. In order to capture the relative signals accurately, the sampling frequency and time used were 16,000 Hz and 1 s respectively [22]. For further details about the experimental method, please refer to the author’s previous work [31,32,33].

3.3. Experiment Method

In this experiment, the pressure and vibration must be recorded simultaneously. At the given flow rate, multiple data, captured by the suction pressure, were used to study the vibration with pressure variation at a constant rotation speed of 3000 rpm. Firstly, the deflation valve was fully open and the ball valve was closed. After measuring the data under this condition, the deflation valve was closed and the ball valve and vacuum pump were opened gradually in order to reduce the pressure at the suction side of the pump until cavitation occurred. After the emergence of cavitation, the vacuum pump and ball valve were opened and observed over a period of time until there was a drop in pressure at the inlet of the pump. At this point, the data acquisition process was put on hold until the vacuum pump cannot take away any atmosphere from the tank or the test rig cannot provide the foreseeable dangers. The same steps would be repeated in the flow rate of 40 m3/h and 60 m3/h to guarantee the robust of algorithm.

3.4. Data Pretreatment

Transforming the suction pressure into NPSH and the vibration acceleration signal would convert into fifteen (15) types of feature target which contain the maximum, minimum, mean, peak, absolute mean, variance, standard deviation, kurtosis, skewness, root mean square, shape factor, crest factor, kurtosis factor, impulse factor, and margin factor. The specific mathematical function and steps can be found in Appendix A from the literature [24].

4. Analysis and Methodology

On the foundation of Step 1, the above data in ever flow rate point would be turned into the reference sequence (RS) and comparative sequence (CS) as the following matrix expresses:
R S = { N P S H r ( p 1 ) , N P S H r ( p 2 ) , N P S H r ( p 3 ) N P S H r ( p n 1 ) , N P S H r ( p n ) }
CS = { M a x i m u m ( p 1 ) M a x i m u m ( p 2 ) M a x i m u m ( p n 1 ) M a x i m u m ( p n ) M i n i m u m ( p 1 ) M i n i m u m ( p 2 ) M i n i m u m ( p n 1 ) M i n i m u m ( p n ) I m p u l s e f a c t o r ( p 1 ) I m p u l s e f a c t o r ( p 2 ) I m p u l s e f a c t o r ( p n 1 ) I m p u l s e f a c t o r ( p n ) M arg i n ( p 1 ) M arg i n ( p 2 ) M arg i n ( p n 1 ) M arg i n ( p n ) }
For the normalization processing of the data from a matrix by the maximum way according to Step 2, the tackled data are drawn on Figure 4.
From Figure 4, in the NPSH decreasing process, the corresponding fifteen (15) vibration feature value in the test interval coexist in the situation of increase and decrease instead of monotonous relations. Meanwhile, as the vacuum pump starts working, positive and negative relevance coexists between the NPSH and fifteen (15) vibration feature. On the other hand, some values might be abnormal since the negative values exist in the original signal and the potential unknown factors are distributing. For instance, Figure 4d shows the mean value in 40 m3/h. However, as weight entropy states, the rationale and credible value can be acquired based on the calculated value of grey relation and entropy weight. In this way, the objective relation between NPSH and feature parameter can be decided whether it is related or not. Furthermore, the relevance matrix θ can be acquired with the data in Figure 4b–p through the Step 3 calculation, the consequence of which can be seen in Figure 5.
In Figure 5, n denotes the numbers of the calculated slope, and ζ expresses the grey slope coefficient of the corresponding feature target in different stages. From Figure 5, the trend of all targets except the Kurtosis factor basically considered has a positive or negative relevance with NPSH but the grey coefficient tends to 0 in the terminal. In mathematical terms, these parameters do not have strong relevance with NPSH in the terminal. However, from a physics perspective, this kind of description cannot satisfy common sense. According to the definition of grey slope correlation, using the slope in different stages reflects the relevance between the vibration feature target and NPSH. Mirrored in Figure 5, in the cavitation stage, the slope value of the feature target and vibration has a big difference. The physics states in the pump are changed and the corresponding physics meaning is the minimum variation in NPSH which would cause logarithmic leaps among the feature targets. Thus, these descriptions correspond to the fact of phase-change vibration caused by bubble burst.
Due to the existence of positive and negative value in the feature target, the relevance of the feature target cannot be judged directly. Therefore, transforming the negative and positive value into the same positive interval by Step 4 as Figure 6 depicted.
According to Step 5, the corresponding entropy weight can be attached under different pressure stages in a corresponding flow rate. The final relevant coefficient in the corresponding flow rate can be calculated by Step 6. The average value can be acquired by repeating Step 5 and Step 6. The calculation results are enumerated in Table 2.
For the above calculating consequence, the value closer to 1 means the relevance is more intense. On the contrary, when the value is closer to 0, it depicts a weaker relevance. By ranking the feature target in the principle of small to large, the recommended ordering of vibration feature target in different flow rate is as follows:
  • 40 m3/h: variance > absolute mean > root mean square > standard deviation > skewness > mean > kurtosis factor > maximum > margin factor> peak > impulse factor> minimum > crest factor > kurtosis > shape factor.
  • 50 m3/h: kurtosis factor > variance > root mean square > standard deviation > absolute mean > maximum > peak > skewness > minimum > margin factor > impulse factor > crest factor > kurtosis > mean >shape factor.
  • 60 m3/h: kurtosis factor > kurtosis > shape factor > skewness > mean > variance > margin factor > impulse factor > crest factor > minimum > maximum > peak > standard deviation > root mean square > absolute mean.
  • Average: kurtosis factor > variance > absolute mean > root mean square > standard deviation > skewness > maximum > peak > mean > kurtosis > minimum > shape factor > margin factor > impulse factor > crest factor.
From the calculated results, the relevance coefficient might have diversity under different operating conditions. However, the relevance coefficient of the kurtosis factor, variance, absolute mean and root mean square above all along which recommend applying priority. The shape factor, margin factor, impulse factor, and peek factor always below 0.5 means that the low sensitive with NPSH. This explains why the summary feature targets from the literature [21,23] have good effects in detecting and monitoring the cavitation in terms of mathematics. From the physical concept, such as the kurtosis factor, it is a quantity indicating how sharply a probability distribution increases and decreases around the distribution mean. As one sort of dimensionless coefficient, it has great sensitivity to the impulse signal and is nearly independent of the rotation speed, size, and load with machine. The numerical value uncovers the fact that this feature target has an intensity relation with NPSH which can put the vibration signal induced by the bubble burst into the range of the impulse signal. Thus, this feature target is especially appropriate to establish the relation between the vibration and cavitation. This further establishes how feasible the application of grey slope correlation and entropy weight method is in the selection of centrifugal pump.

5. Conclusions

In this research, the vibration acceleration signal is captured under pressure and flow rate variation and extracted fifteen (15) common feature targets from it to establish the relevance issues between cavitation and vibration. The grey slope correlation is proposed to quantitatively evaluate the relevance between feature the target and cavitation. The new established method has successfully solved the problem of positive and negative relations which cannot be solved by the traditional Deng’s grey relation. In addition, with the entropy weight method applied, the feature target can be evaluated on the same scale. The numerical calculation shows that the kurtosis factor, variance, absolute mean, root mean square of vibration acceleration signal has intensity relevance with NPSH. The cavitation states of the centrifugal pump can be monitored by using these parameters. This paper provides an objective selection strategy of a vibration feature target in evaluating the cavitation based on the numerical value. In terms of feature target selection, the universal and specific mathematical standard is established in the research.

Author Contributions

Conceptualization, R.C.; Methodology, R.C.; Software, R.C.; Validation, J.Y. Formal Analysis, R.C.; Investigation, R.C.; Resources, J.Y.; Data Curation, R.C.; Writing-Original Draft Preparation, R.C.; Writing-Review & Editing, R.C.; Supervision, J.Y.; Project Administration, J.Y.; Funding Acquisition, J.Y. Both authors have read and agreed to the published version of the manuscript.

Funding

This research was funded by National Key Research and Development Program of China (No. 2018YFB0606103) and Jiangsu Key Research and Development Plan of China (No. BE2018085).

Acknowledgments

The authors are sincerely grateful to editor Tracy Yu and anonymous reviewers for providing valuable comments and reviewing the manuscripts. This study is supported by National Key Research and Development Program of China (No. 2018YFB0606103) and Jiangsu Key Research and Development Plan of China (No. BE2018085).

Conflicts of Interest

The authors declare no conflict of interest.

References

  1. Hu, Q.; Ohata, E.F.; Silva, F.H.S.; Ramalho, G.L.B.; Han, T.; RebouçasFilho, P.P. A new online approach for classification of pumps vibration patterns based on intelligent IoT system. Measurement 2020, 151, 107138. [Google Scholar] [CrossRef]
  2. He, D.; Wang, X.; Li, S.; Lin, J.; Zhao, M. Identification of multiple faults in rotating machinery based on minimum entropy deconvolution combined with spectral kurtosis. Mech. Syst. Signal Process. 2016, 81, 235–249. [Google Scholar] [CrossRef]
  3. Zhang, Y.; Zheng, X.; Li, J.; Du, X. Experimental study on the vibrational performance and its physical origins of a prototype reversible pump turbine in the pumped hydro energy storage power station. Renew. Energy 2019, 130, 667–676. [Google Scholar] [CrossRef]
  4. Muhirwa, A.; Cai, W.-H.; Su, W.-T.; Liu, Q.; Binama, M.; Li, B.; Wu, J. A review on remedial attempts to counteract the power generation compromise from draft tubes of hydropower plants. Renew. Energy 2020, 150, 743–764. [Google Scholar] [CrossRef]
  5. Zhu, D.; Tao, R.; Xiao, R.; Pan, L. Solving the runner blade crack problem for a Francis hydro-turbine operating under condition-complexity. Renew. Energy 2020, 149, 298–320. [Google Scholar] [CrossRef]
  6. Černetič, J.; Čudina, M. Estimating uncertainty of measurements for cavitation detection in a centrifugal pump. Measurement 2011, 44, 1293–1299. [Google Scholar] [CrossRef]
  7. Li, Y.; Feng, G.; Li, X.; Si, Q.; Zhu, Z. An experimental study on the cavitation vibration characteristics of a centrifugal pump at normal flow rate. J. Mech. Sci. Technol. 2018, 32, 4711–4720. [Google Scholar] [CrossRef]
  8. Al-Obaidi, A.R.; Towsyfyan, H. An Experimental Study on Vibration Signatures for Detecting Incipient Cavitation in Centrifugal Pumps Based on Envelope Spectrum Analysis. J. Appl. Fluid Mech. 2019, 12, 2057–2067. [Google Scholar] [CrossRef]
  9. Li, S.; Chu, N.; Yan, P.; Wu, D.; Antoni, J. Cyclostationary approach to detect flow-induced effects on vibration signals from centrifugal pumps. Mech. Syst. Signal Process. 2019, 114, 275–289. [Google Scholar] [CrossRef]
  10. Lu, J.; Liu, X.; Zeng, Y.; Zhu, B.; Hu, B.; Yuan, S.; Hua, H. Detection of the Flow State for a Centrifugal Pump Based on Vibration. Energies 2019, 12, 3066. [Google Scholar] [CrossRef] [Green Version]
  11. Heo, Y.; Kim, K.-J. Characterization of a water pump for drum-type washing machine by vibration power approach. Mech. Syst. Signal Process. 2015, 54–55, 367–376. [Google Scholar] [CrossRef]
  12. Rapur, J.S.; Tiwari, R. Automation of multi-fault diagnosing of centrifugal pumps using multi-class support vector machine with vibration and motor current signals in frequency domain. J. Braz. Soc. Mech. Sci. Eng. 2018, 40, 278. [Google Scholar] [CrossRef]
  13. Milovančević, M.; Nikolić, V.; Petkovic, D.; Vracar, L.; Veg, E.; Tomic, N.; Jović, S. Vibration analyzing in horizontal pumping aggregate by soft computing. Measurement 2018, 125, 454–462. [Google Scholar] [CrossRef]
  14. Kumar, A.; Kumar, R. Time-frequency analysis and support vector machine in automatic detection of defect from vibration signal of centrifugal pump. Measurement 2017, 108, 119–133. [Google Scholar] [CrossRef]
  15. Zhao, W.; Wang, Z.; Ma, J.; Li, L. Fault Diagnosis of a Hydraulic Pump Based on the CEEMD-STFT Time-Frequency Entropy Method and Multiclass SVM Classifier. Shock Vib. 2016, 2016, 1–8. [Google Scholar] [CrossRef]
  16. Stan, M.; Pana, I.; Minescu, M.; Ichim, A.; Teodoriu, C. Centrifugal Pump Monitoring and Determination of Pump Characteristic Curves Using Experimental and Analytical Solutions. Processes 2018, 6, 18. [Google Scholar] [CrossRef] [Green Version]
  17. KäHler, G.; Bonelli, F.; Gonnella, G.; Lamura, A. Cavitation inception of a van der Waals fluid at a sack-wall obstacle. Phys. Fluids 2015, 27, 123307. [Google Scholar] [CrossRef] [Green Version]
  18. Dong, L.; Zhao, Y.; Dai, C. Detection of Inception Cavitation in Centrifugal Pump by Fluid-Borne Noise Diagnostic. Shock Vib. 2019, 2019, 1–15. [Google Scholar] [CrossRef]
  19. Zhang, N.; Yang, M.; Gao, B.; Li, Z. Vibration Characteristics Induced by Cavitation in a Centrifugal Pump with Slope Volute. Shock Vib. 2015, 2015, 1–10. [Google Scholar] [CrossRef]
  20. Lu, J.; Yuan, S.; Siva, P.; Yuan, J.; Ren, X.; Zhou, B. The characteristics investigation under the unsteady cavitation condition in a centrifugal pump. J. Mech. Sci. Technol. 2017, 31, 1213–1222. [Google Scholar] [CrossRef]
  21. Rapur, J.S.; Tiwari, R. Experimental fault diagnosis for known and unseen operating conditions of centrifugal pumps using MSVM and WPT based analyses. Measurement 2019, 147, 106809. [Google Scholar] [CrossRef]
  22. Azizi, R.; Attaran, B.; Hajnayeb, A.; Ghanbarzadeh, A.; Changizian, M. Improving accuracy of cavitation severity detection in centrifugal pumps using a hybrid feature selection technique. Measurement 2017, 108, 9–17. [Google Scholar] [CrossRef]
  23. Rapur, J.S.; Tiwari, R. On-line Time Domain Vibration and Current Signals Based Multi-fault Diagnosis of Centrifugal Pumps Using Support Vector Machines. J. Nondestruct. Eval. 2018, 38, 6. [Google Scholar] [CrossRef]
  24. Al-Obaidi, A.R.; Mishra, R. Experimental Investigation of the Effect of Air Injection on Performance and Detection of Cavitation in the Centrifugal Pump Based on Vibration Technique. Arab. J. Sci. Eng. 2020, 45, 5657–5671. [Google Scholar] [CrossRef]
  25. Li, S.; Zhang, J.; Li, P.; Wang, Y.; Wang, Q. Influencing Factors of Driving Decision-Making Under the Moral Dilemma. IEEE Access 2019, 7, 104132–104142. [Google Scholar] [CrossRef]
  26. Qin, C.; Li, B.; Shi, B.; Qin, T.; Xiao, J.; Xin, Y. Location of substation in similar candidates using comprehensive evaluation method base on DHGF. Measurement 2019, 146, 152–158. [Google Scholar] [CrossRef]
  27. Uzun, G. Analysis of grey relational method of the effects on machinability performance on austempered vermicular graphite cast irons. Measurement 2019, 142, 122–130. [Google Scholar] [CrossRef]
  28. Chang, H.; Shi, W.; Li, W.; Wang, C.; Ramesh, K.A. Experimental Optimization of Jet Self-Priming Centrifugal Pump Based on Orthogonal Design and Grey-Correlational Method. J. Therm. Sci. 2020, 29, 241–250. [Google Scholar] [CrossRef]
  29. Wang, X.L.; An, C.; Fu, Q.; Zhu, R.S.; Lu, Y.G.; Cai, Z.; Jiang, X.F. Grey relational analysis and optimization of guide vane for reactor coolant pump in the coasting transient process. Ann. Nucl. Energy 2019, 133, 431–440. [Google Scholar] [CrossRef]
  30. Yao, W.P.; Yao, W.L.; Yao, D.Z.; Guo, D.Q.; Wang, J. Shannon entropy and quantitative time irreversibility for different and even contradictory aspects of complex systems. Appl. Phys. Lett. 2020, 116, 014101. [Google Scholar] [CrossRef]
  31. Sun, H.; Luo, Y.; Yuan, S.; Yin, J. Hilbert spectrum analysis of unsteady characteristics in centrifugal pump operation under cavitation status. Ann. Nucl. Energy 2018, 114, 607–615. [Google Scholar] [CrossRef]
  32. Sun, H.; Yuan, S.; Luo, Y. Characterization of cavitation and seal damage during pump operation by vibration and motor current signal spectra. Proc. Inst. Mech. Eng. Part A J. Power Energy 2018, 233, 132–147. [Google Scholar] [CrossRef]
  33. Sun, H.; Yuan, S.; Luo, Y. Cyclic Spectral Analysis of Vibration Signals for Centrifugal Pump Fault Characterization. IEEE Sens. J. 2018, 18, 2925–2933. [Google Scholar] [CrossRef]
Figure 1. Flow chart of process.
Applsci 10 08190 g001
Figure 2. Test rig.
Figure 2. Test rig.
Applsci 10 08190 g002
Figure 3. Instrument layout: (a) test site; (b) monitor points.
Applsci 10 08190 g003
Figure 4. Normalization value: (a) NPSH, (b) Maximum, (c) Minimum, (d) Mean, (e) Peak, (f) Absolute mean, (g) Variance, (h) Standard deviation, (i) Kurtosis, (j) Skewness, (k) Root mean square, (l) Shape factor, (m) Crest factor, (n) Kurtosis factor, (o) Impulse factor, (p) Margin factor.
Applsci 10 08190 g004
Figure 5. Grey slope correlation coefficient: (a) Maximum, (b) Minimum, (c) Mean, (d) Peak, (e) Absolute mean, (f) Variance, (g) Standard deviation, (h) Kurtosis, (i) Skewness, (j) Root mean square, (k) Shape factor, (l) Crest factor, (m) Kurtosis factor, (n) Impulse factor, (o) Margin factor.
Applsci 10 08190 g005
Figure 6. Heat map of translated value: (a) 40 m3/h, (b) 50 m3/h, (c) 60 m3/h.
Applsci 10 08190 g006
Table 1. Main parameters of the prototype pump.
NameSymbolValue
Designed flow rateQd50 m3/h
Designed headHd37 m
Rated rotational speedn3000 r/min
Impeller inlet diameterD174 mm
Impeller outlet diameterD2174 mm
Impeller outlet widthb212 mm
BladesZ6
Volute diameterD3184 mm
Rated Powerp5 kW
Table 2. Final comprehensive coefficient.
Target405060Average
Maximum0.50840.84310.50900.6398
Minimum0.44550.57250.51080.5130
Mean0.71450.38810.81190.6131
Peak0.44650.84290.50860.6187
Absolute mean0.92540.93430.48880.8102
Variance0.94720.95410.55190.8424
Standard deviation0.92370.93440.48990.8099
Kurtosis0.40680.41990.88360.5416
Skewness0.74470.58160.84980.7093
Root mean square0.92380.93450.48990.8100
Shape factor0.37740.29440.87060.4790
Crest factor0.44530.42000.51170.4534
Kurtosis factor0.68690.99230.91620.8690
Impulse factor0.44630.42010.51260.4541
Margin factor0.440.42010.51300.4543
Publisher’s Note: MDPI stays neutral with regard to jurisdictional claims in published maps and institutional affiliations.

