1. Introduction
The requirements for military fortification construction are specific regarding the actions that these structures have to carry. The assessment of the condition of these structures is crucial to the commander′s decision as to whether the structure can serve its purpose. However, with the deterioration of the security situation, these requirements are close to the requirements for critical infrastructure protection facilities. Steel fiber-reinforced concrete appears to be a very promising construction material that could expand the range of cement-based materials used for the design and construction of the protective structures new generation.
Moreover, in relation to the expeditionary style of military operations that can be conducted around the world, this style of operations entailed the requirement for effective temporary structures and installations including field fortifications along with taken advantage of new materials as high performance concretes (HPC), ultra-high-performance concrete (UHPC) or high-performance fiber reinforcement concrete (HPFRC) and others.
Field fortifications pose military protective structures intended to protect forces against the consequences of direct and indirect fire. After such an impact, it is necessary to determine before further use whether the structure still has the required protective properties.
Based on the results of long-term field testing, we are working on creating a methodology for the diagnostics of military fortification structures. A procedure suitable for evaluating the condition of protective structures after the impact of a pressure wave and shards is sought. However, this procedure must not invalidate the continued use of this protection structure if it can continue to perform the protection function. A structure designed to protect the live force against the effects of a shock wave and projectiles cannot be diagnosed by such a method as to break the protective structure. For these reasons, nondestructive testing methods should be preferred. Non-destructive testing (NDT) is suitable for the protective structures testing, as the protective properties of the construction are not compromised by sampling. Another advantage is the repeatability of the tests. The disadvantage of NDT is the relatively complicated evaluation of measurement results. These methods are only partially appropriate for determining whether a military protective structure can withstand additional actions without jeopardizing the concealed force [
1].
Non-destructive testing can be used to detect and describe defects in tested materials and products by such methodological procedures, the application of which does not damage the products, nor change their future usability, service life or ability to perform the intended function. In professional publications, NTD methods have been mentioned for a long time, for example for testing materials that were initially assessed only on the basis of a visual evaluation of the expert on the basis of his many years of personal experience [
2].
The current field of NDT is characterized not only by the need for extensive knowledge of the properties of materials and technologies used in the 21st century, but also by the widespread use of the possibilities of electronics and modern computer technology. The results of the latest research show progress in all technical disciplines. For the evaluation of the tested material or structural element, not only sufficient knowledge of the evaluated material and experience with measuring instruments is required, but also the correct interpretation of the measured results.
Radiation and electromagnetic methods are mainly used for NDT of the steel fiber-reinforced concrete [
3]. Both methods are based on the basic assumption of differences in the physical properties of the cement matrix and one of the added components—steel fibers. However, all these methods have relatively large limitations, whether it is the time-consuming measurement, the relevance of the information obtained about the tested material or, finally, the economic aspect. Radiation methods were often chosen for the evaluation of “in situ” structures, but they cannot be applied in most cases, due to the necessary configuration of the radiation source-detector assembly, and also due to the harmfulness of ionizing radiation and thus the necessary protection of persons from primary and secondary ionizing radiation, etc. For this reason, electrodynamic and electromagnetic methods are currently used, the applicability of which has been discussed by the general professional public in recent years [
4].
To assess the condition of the protective structure after the impact by a pressure wave using NDT methods, it is important to have a record of the condition of the structure before the impact for comparison. It is crucial to know the material properties of the structure and the uniformity of the distribution of reinforcement or cracks in the material. The development of new NDT methods usable for evaluating the concentration and orientation of steel fibers in composites has been discussed several times among the professional public [
5,
6,
7]. The authors themselves have been researching and publishing in this area for a long time [
7,
8,
9,
10,
11,
12].
The authors are looking for a combination of suitable NDT methods that would be used in the future to prove the degree of damage to cement-based protective structures after an explosion. The article presents the first part of an experiment designed to verify the applicability of NDT methods, to evaluate the degree of damage of the protective structure in the field. The experiment consists of three parts. The first part is a laboratory verification of the initial material characteristics of the materials used. The first test set of structural elements is made of steel fiber-reinforced concrete. The elements will be evaluated using NDT methods and for comparison by destructive laboratory methods. The second part will be the impact of structures using explosion and evaluation of the condition of structures using NDT methods in the field. The last part will be used to verify the results of the NDT method, which will ensure the residual strength of the structure in the laboratory and try to find the relationship between changes in the results of NDT methods and the residual strength. Radiography was included in the introductory and concluding parts of the experiment to verify the results. Although this method is not suitable for using in-situ, it is the only standardized method of the NDT methods used.
2. NDT Methods for Evaluation of Steel Fiber-Reinforcement Concrete (SFRC)
The aim of the whole experiment is to demonstrate the usability of the described methods in-situ, directly in the field conditions for the purposes of engineering assessment of the state of the military protective structure. During field testing of protective structures, impact by explosion of structures and structural elements occurs. It was these field experiments that proved the great advantages of fiber concrete as a building material for the implementation of protective military structures [
9,
13,
14]. Although field tests are logistically very demanding the practical field testing at the Department of Engineer Technology date back to 2004. In most cases, cement-based materials have been tested. In the last five years, the field tests are organized regularly twice a year. Unfortunately, due to the epidemiological situation and its restrictive measures, the preliminary study was conducted. Namely, the attention was first focused on the preparation of the field test and thus on the comprehensive processing of the evaluation of the internal structure of the materials of the test specimens produced. This evaluation is focused on monitoring internal inhomogeneities using NDT methods. The aim is to prove the suitability of the ultrasonic method for field testing of military protective structures by the method and to validate the achieved results by the radiation method.
Non-destructive testing methods generally applied to determine material imperfection. NDT methods are designed to detect changes in structure, minor changes in surface quality, the presence of cracks or other physical imperfections. Based on the performed searches, the following is a list of NDT methods, their basic principles and possibilities of use for determining the changes caused by the external stress on the monitored composite.
2.1. Ultrasonic Method
The ultrasonic method is one of the most widely used electrodynamic non-destructive diagnostic methods. When an ultrasonic wave passes through the environment, its energy decreases, and thus its acoustic pressure, depending on the properties of the environment. The cause of this attenuation is wave absorption, reflection, refraction, bending and scattering. Ultrasound absorption in solids arises as a result of internal friction, hysteresis losses, plastic creep and relaxation and thermal phenomena. The attenuation of longitudinal waves is greater than of transverse ones.
In ultrasonic flaw detection, the oscillations are excited by a transducer called an ultrasonic pulse. The time of one oscillation corresponds to one wavelength λ.
Two basic ultrasonic methods are most often used in construction. The oldest and simplest is the pass-through method, the main feature of which is the measurement of the transmitted acoustic pressure or the determination of the time of passage of ultrasonic waves through the examined environment. The second is the impulse ultrasonic method. The principle of the pulse method consists in the transmission of pulses, which are captured and displayed using the so-called A-scan. The reflected pulses return either to the same electroacoustic transducer or to the receiving transducer. It is suitable for structural diagnostics, where access is allowed only from one side of the structure. At present, two technical standards ČSN 73 1371 [
15] and ČSN EN 1250-4 [
16] describing measurement methods using ultrasound are in force.
The ultrasonic method has been used in construction for many decades. It is commonly used to determine the modulus of elasticity of concrete, estimation of compressive strength, uniformity of concrete, the presence of cracks or cavities, changes in properties over time. Ultrasonic devices measure the time of passage of the ultrasonic pulse through the tested material and from the knowledge of the length of the measuring base the speed of propagation of the ultrasonic pulse according to ČSN 73 1371 [
15] is evaluated. The Czech Technical Standard [
16] discusses in some detail the factors that may affect the measurement of the pulse propagation rate. These are the moisture content of the concrete, the length of the measuring base and the presence of reinforcement in the concrete element.
It has been shown that the steel fiber reinforced concrete can be expected to have a higher rate of propagation of the ultrasonic pulse compared to the unreinforced concrete of the same quality [
17]. This method is suitable for evaluating the disturbance of the internal structure of steel fiber-reinforced concrete or its uniformity as well as for plain concrete. Thanks to the relatively easy handling of ultrasonic devices for testing building structures in situ, very suitable.
2.2. Radiography
The radiographic method is based on the specific properties of gamma radiation, which is scattered and absorbed by the medium through which it passes. The degree of attenuation at the same radiation energy depends on the irradiated thickness and the bulk density of the material. Inhomogeneities in the irradiated material are then displayed in a suitable manner (based on the transmitted radiation dose at different points in the material). In the technical practice, it is the method that allows the display of internal inhomogeneities in the material. The radiation source can be a source with temporary emission of radiation (X-ray, betatron, linear accelerator—then we talk about X-ray) or a radioactive gamma emitter (then it is gammagraphy).
The most common means of recording was a radiographic film. However, the development of computer technologies and new methods of radiation detection has made it possible to produce recording means that record the internal inhomogeneities of controlled structural elements in real time. A fundamental problem with radiography is the fact that its application uses ionizing radiation, which is harmful to human health. In Czech legislation, radiation protection is addressed by the so-called Atomic Act and the subsequent decree on radiation protection. As a basis for legal measures, exposure limits have been set, exceeding which is not permissible from the point of view of radiation protection. These limits apply to exposure from all activities leading to exposure [
18]. On the practical implementation of radiography, it is necessary to strictly follow the principles, which often lead to the impossibility of using this diagnostic method in situ. Another factor that to some extent reduces the importance of the use of radiography in construction is the development of other non-destructive control methods. Just as computer technology is used in the development of radiography, it helps to develop other non-destructive methods. These methods are mostly based on long-known principles, but the use of computer technology allows to increase their sensitivity, operability and better interpretation of measured values [
19].
However, based on the use of X-rays, other methods have been established, which are increasingly used in the construction industry. It is mainly the computed tomography, which has so far been used mainly in medical diagnostics (X-ray and detector orbited a lying patient), but in recent years it is beginning to be used in industry (the examined object rotates between the source and detectors). Computed tomography allows three-dimensional reconstruction of the inspected object without breaking it, which is used mainly in the inspection of composite materials. However, it should be borne in mind that computed tomography is extremely costly both for investment in instrumentation and for operation [
18,
19].
The use of radiographic imaging is now a classic non-destructive approach to obtain information about the structure of the steel fiber-reinforced concrete. The number of the steel fibers is determined by direct detection of the position of wires from individual images. On graphic outputs of this type (if they are available in a sufficiently representative quantity) it is thus easy to check whether the macroscopic isotropy of the material or the formation of cracks during tensile stresses from different directions was observed by the technological process. Despite certain limitations, the radiographic method is used to evaluate fiber-reinforced concrete structures in terms of controlling the occurrence of internal inhomogeneities due to static or dynamic loading. However, regarding the above-mentioned legislative restrictions, work with radiography is carried out only in special laboratories. Although this method is not useful for evaluating the condition of protective structures in situ, this method still serves very well as a validation method for NDT electrodynamic and electromagnetic methods.
3. Experiment
3.1. Material Characteristics of SFRC
Three sets of samples were produced for experiment in the accredited laboratory of the Faculty of Civil Engineering of the Czech Technical University in Prague:
Samples of the set A1 were made of the UHPC (ultra high-performance concrete) more precisely the UHPFRC (ultra high performance fiber-reinforcement concrete).
Samples of the set A2 were made of the SFRC (steel fiber-reinforcement concrete). Due to the purpose of use for military protection structures, marked Dramix RC 65/60BN wires were added to the recipe with a quantity of 60 kg.m−3 concrete.
Samples of the set A3 were made of the plain HSC (high strength concrete) with strength class C110/130.
A total of 18 test samples were produced, each with dimensions 700 × 700 × 60 mm. Six test slabs were made in each set (A1, A2, A3). In this article we will deal with the set A2 made of the SFRC (steel fiber-reinforcement concrete). For the SFRC mixture see
Table 1.
It is clear from the recipe that this concrete contains an extreme amount of fibers, which is unusual in common building structures, but is very desirable for military protective structures.
In addition to testing slabs, accompanying test specimens were also made to determine the properties of concrete. Five test specimens for laboratory determination of compressive strength and three test specimens for determination of working diagram of concrete by bending.
Table 2 shows the results of the SFRC properties.
Figure 1 shows results of flexural strength measurements for samples made of SFCR.
3.2. Measuring by The Ultrasonic Puls Velocity Testing Method
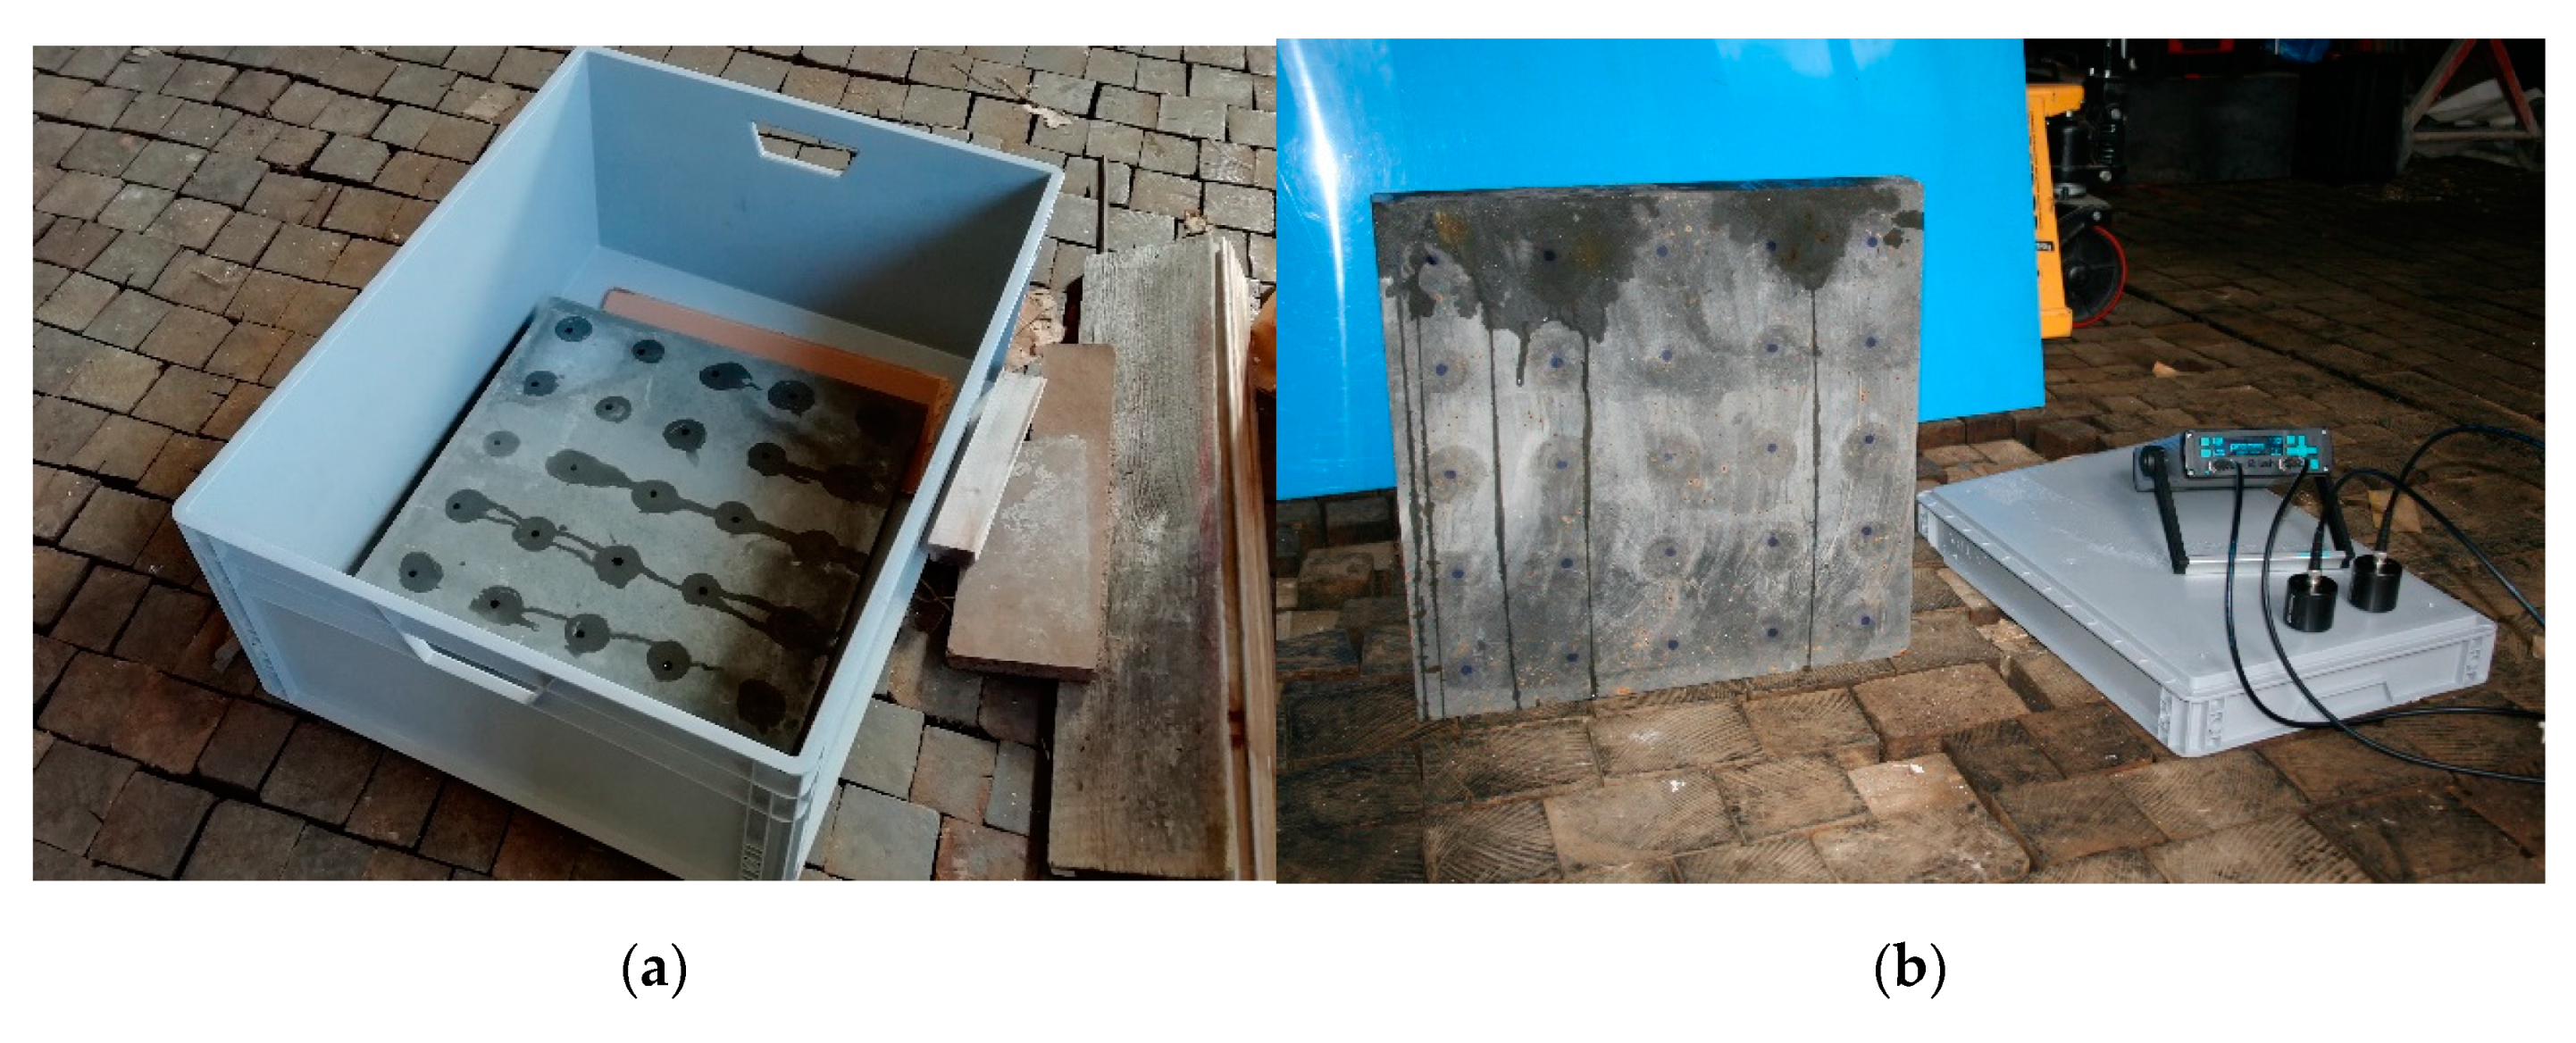
All slabs were measured using the ultrasonic testing method. The ultrasonic wave transit time [µs] was measured. Before the measurement itself was conducted, it was necessary to line the testing slabs on both sides with the measuring network and to mark the starting point of the measurement.
Figure 2a shows the template for plotting testing slab and
Figure 2b shows plotted slabs before ultrasound measurement.
The measured values of the ultrasound ultrasonic wave transit time were taken at each square grid point of every testing slab. To illustrate the propagation of the ultrasonic wave transit time [µs] or in this case ultrasonic wave transit time at individual points of the testing slab, the program for creation of isovels named 3D Filed Pro 64 bit was used. This allows visual comparison of results before and after explosion.
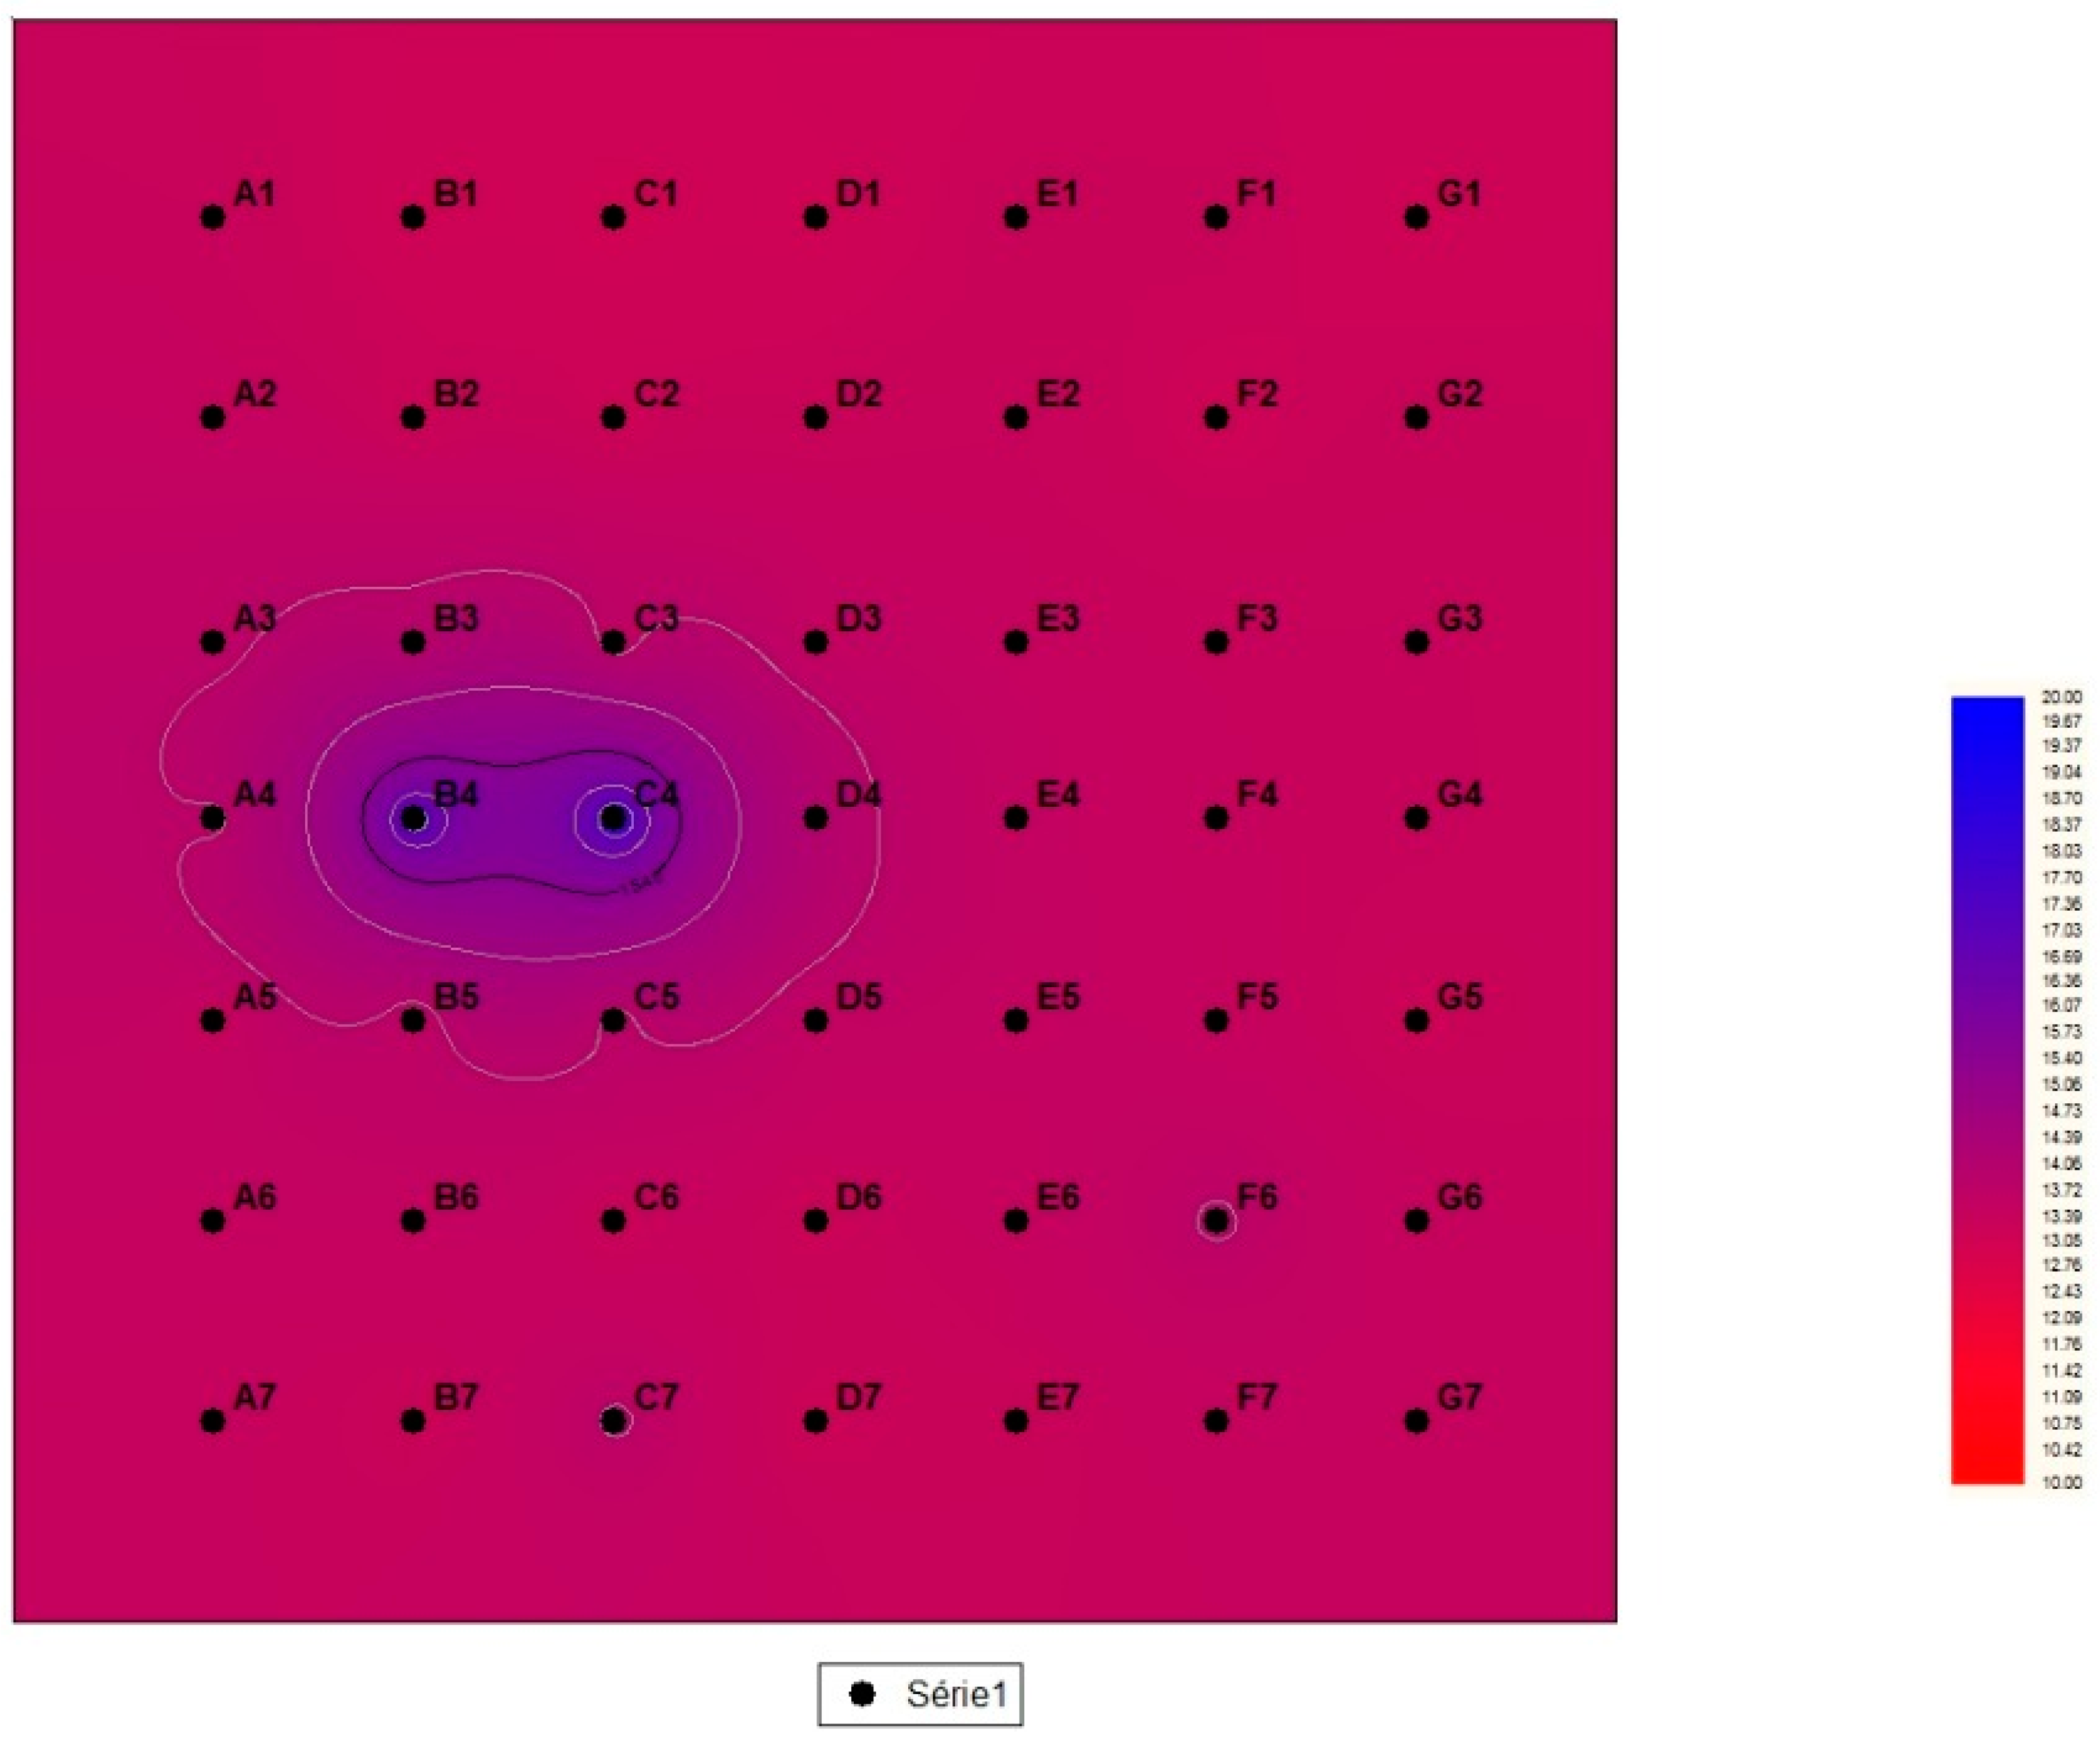
Figure 3 shows the individual measuring points, including their coordinates, and also records the times of passage of the ultrasonic wave through the sample at the given measuring point. On the right side of
Figure 3, the color scale of resolution according to the passage time from 20 µs to 10 µs is shown. The transit time of the ultrasonic wave can be exchanged its speed, see e.g., [
1,
8,
9].
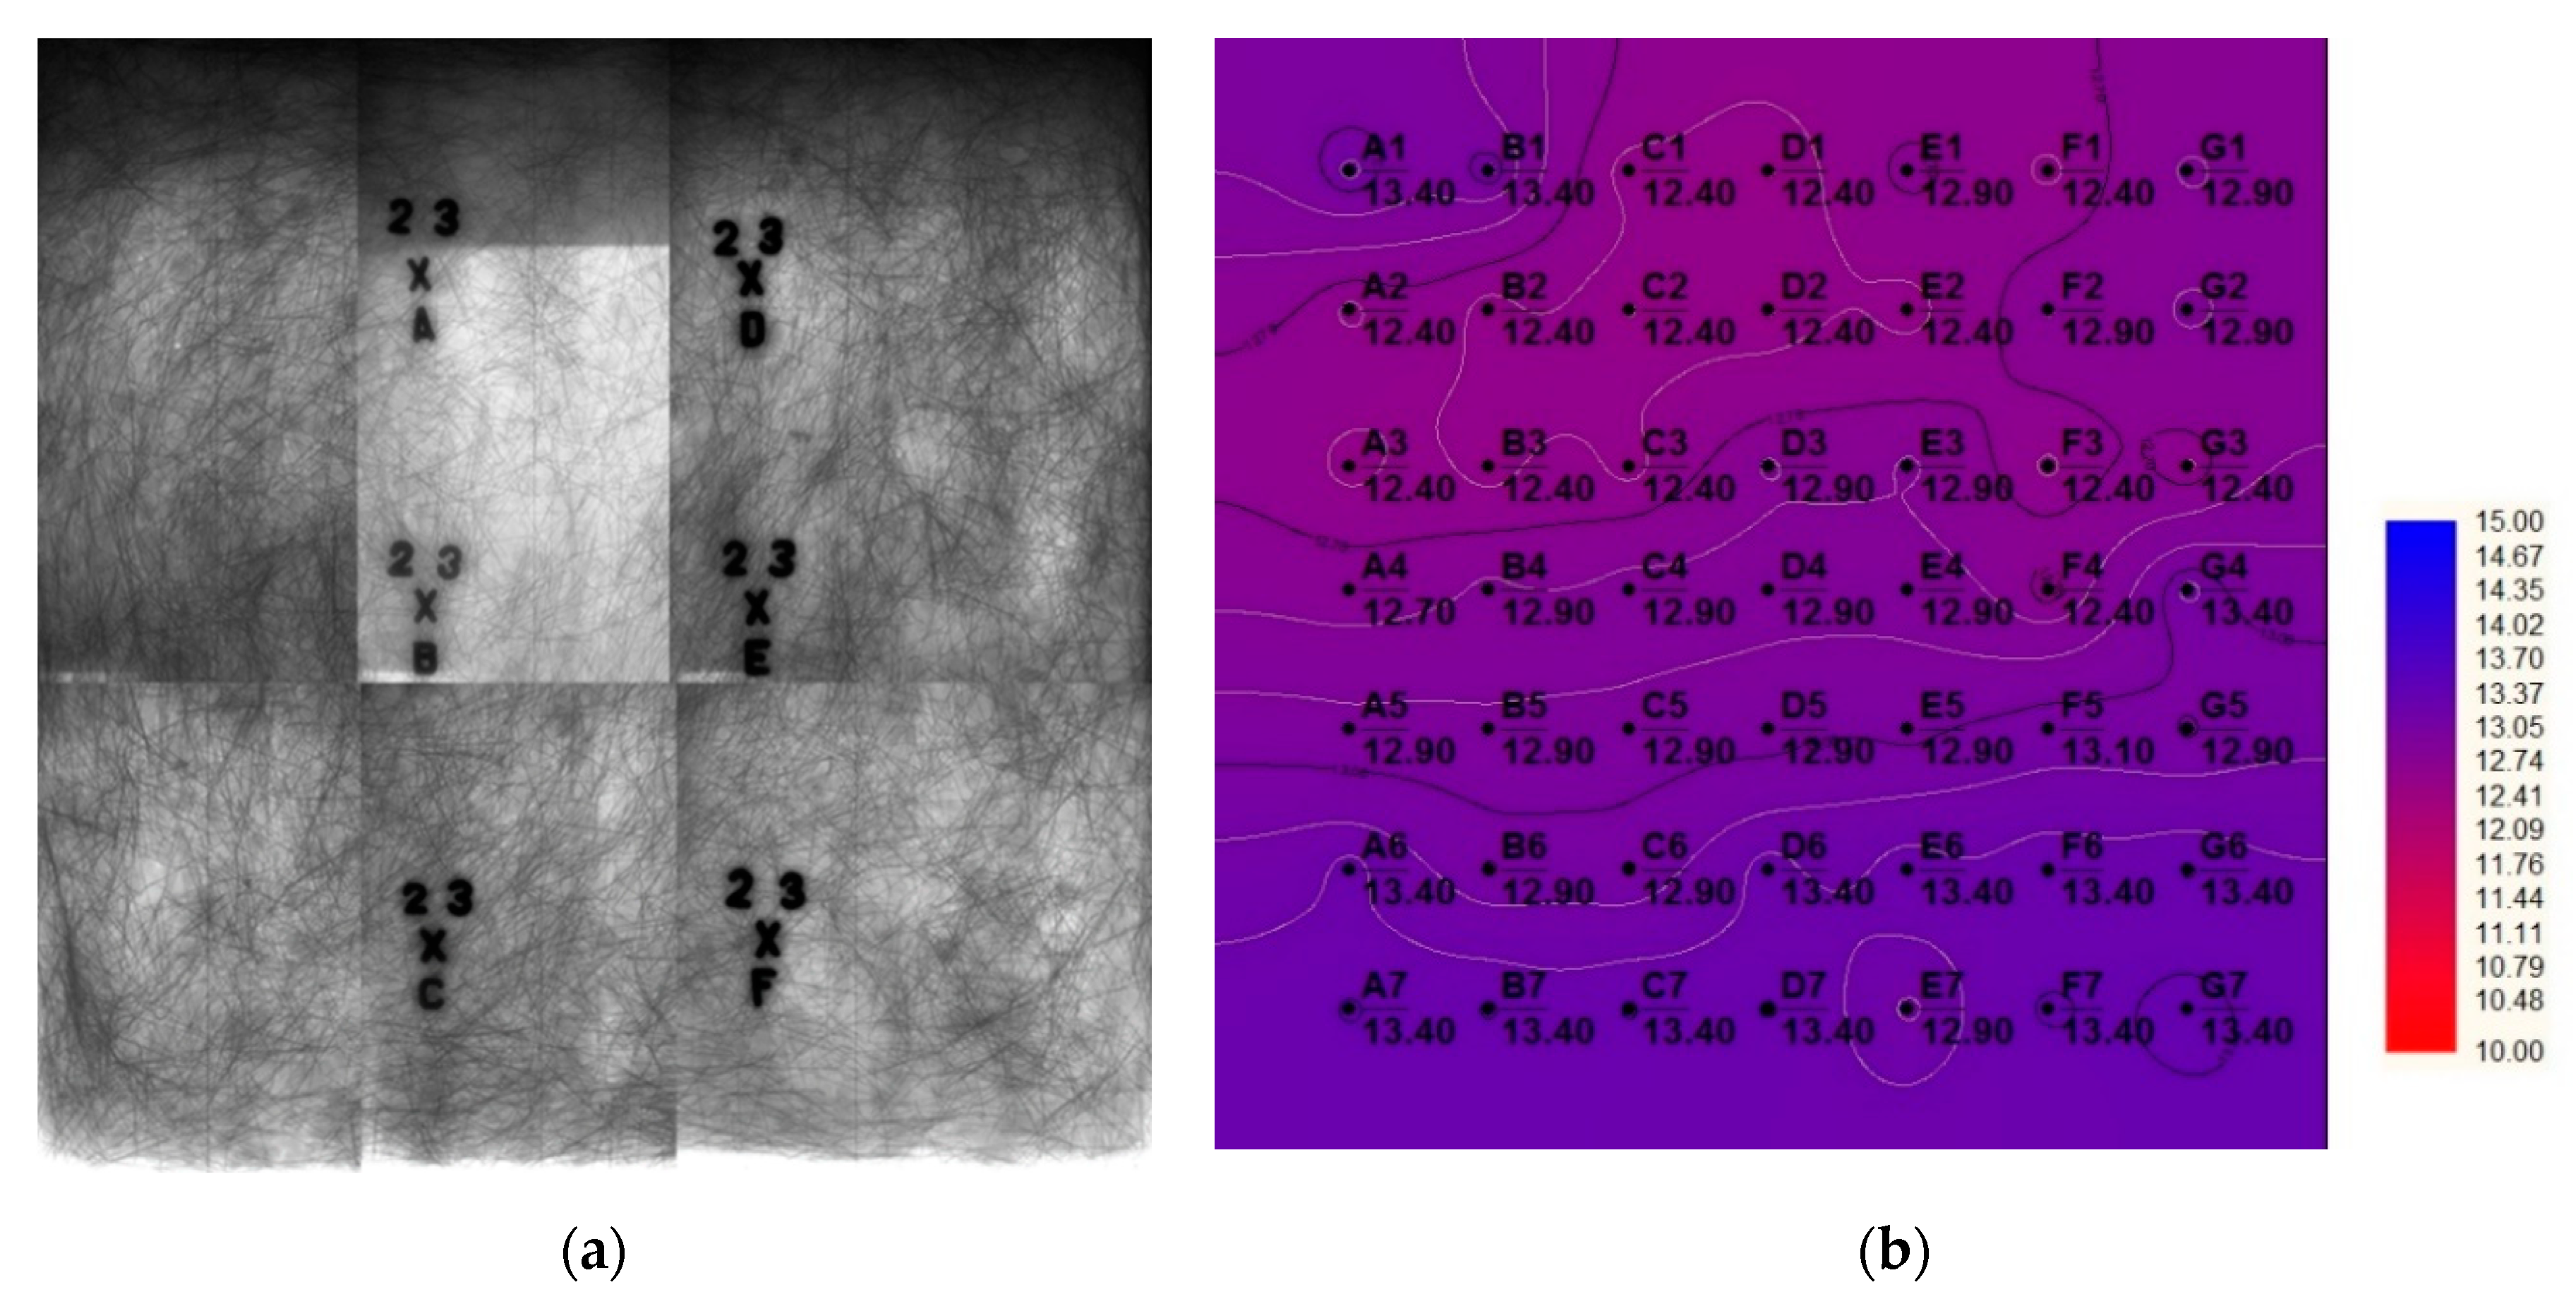
Even though the ultrasonic pulse velocity UPV testing method is relatively simple, this method is prone to the correct execution of measurements and training of the measuring team. If the measurements take place in large series and, moreover, for example in the field under degraded methodological conditions, it is very difficult to keep everyone’s attention. Such a measurement error can be seen in
Figure 4b. Although
Figure 4a clearly shows minor inhomogeneities in the distribution of steel wires in slab, such as places with bundles of previously glued and separated steel fibers, and in several areas also fibers with a predominant unidirectional orientation; there is no reason for such differences between measured times.
3.3. Influence of Rainwater on the Results of the Measurement Using the UPV Method
Based on the specifics of the evaluation of the integrity of the structures of military protective structures in field conditions, the authors were interested in whether rainwater affects the validity of measurements. Based on published research [
20], it was assumed that precipitation should not affect the measurement results using the UPV testing method.
Nevertheless, we decided to perform a preliminary experiment, in which we took different thicknesses and different materials and measured the speed of passage of the ultrasound wave under normal conditions and then after one day of intense rain and a week of rain.
The following plates were used for the experiment:
Testing Slab V1 FC with dimensions 500 × 500 × 60 mm, made of SFRC (steel fiber reinforced concrete);
Testing Slab V2 FC with dimensions 500 × 500 × 40 mm, made of UHPFRC (ultra high-performance steel fiber reinforced concrete);
Testing Slab V3 FC with dimensions 500 × 500 × 55 mm, made of SFRC (steel fiber reinforced concrete). See
Figure 5.
3.4. Measuring by Radiography
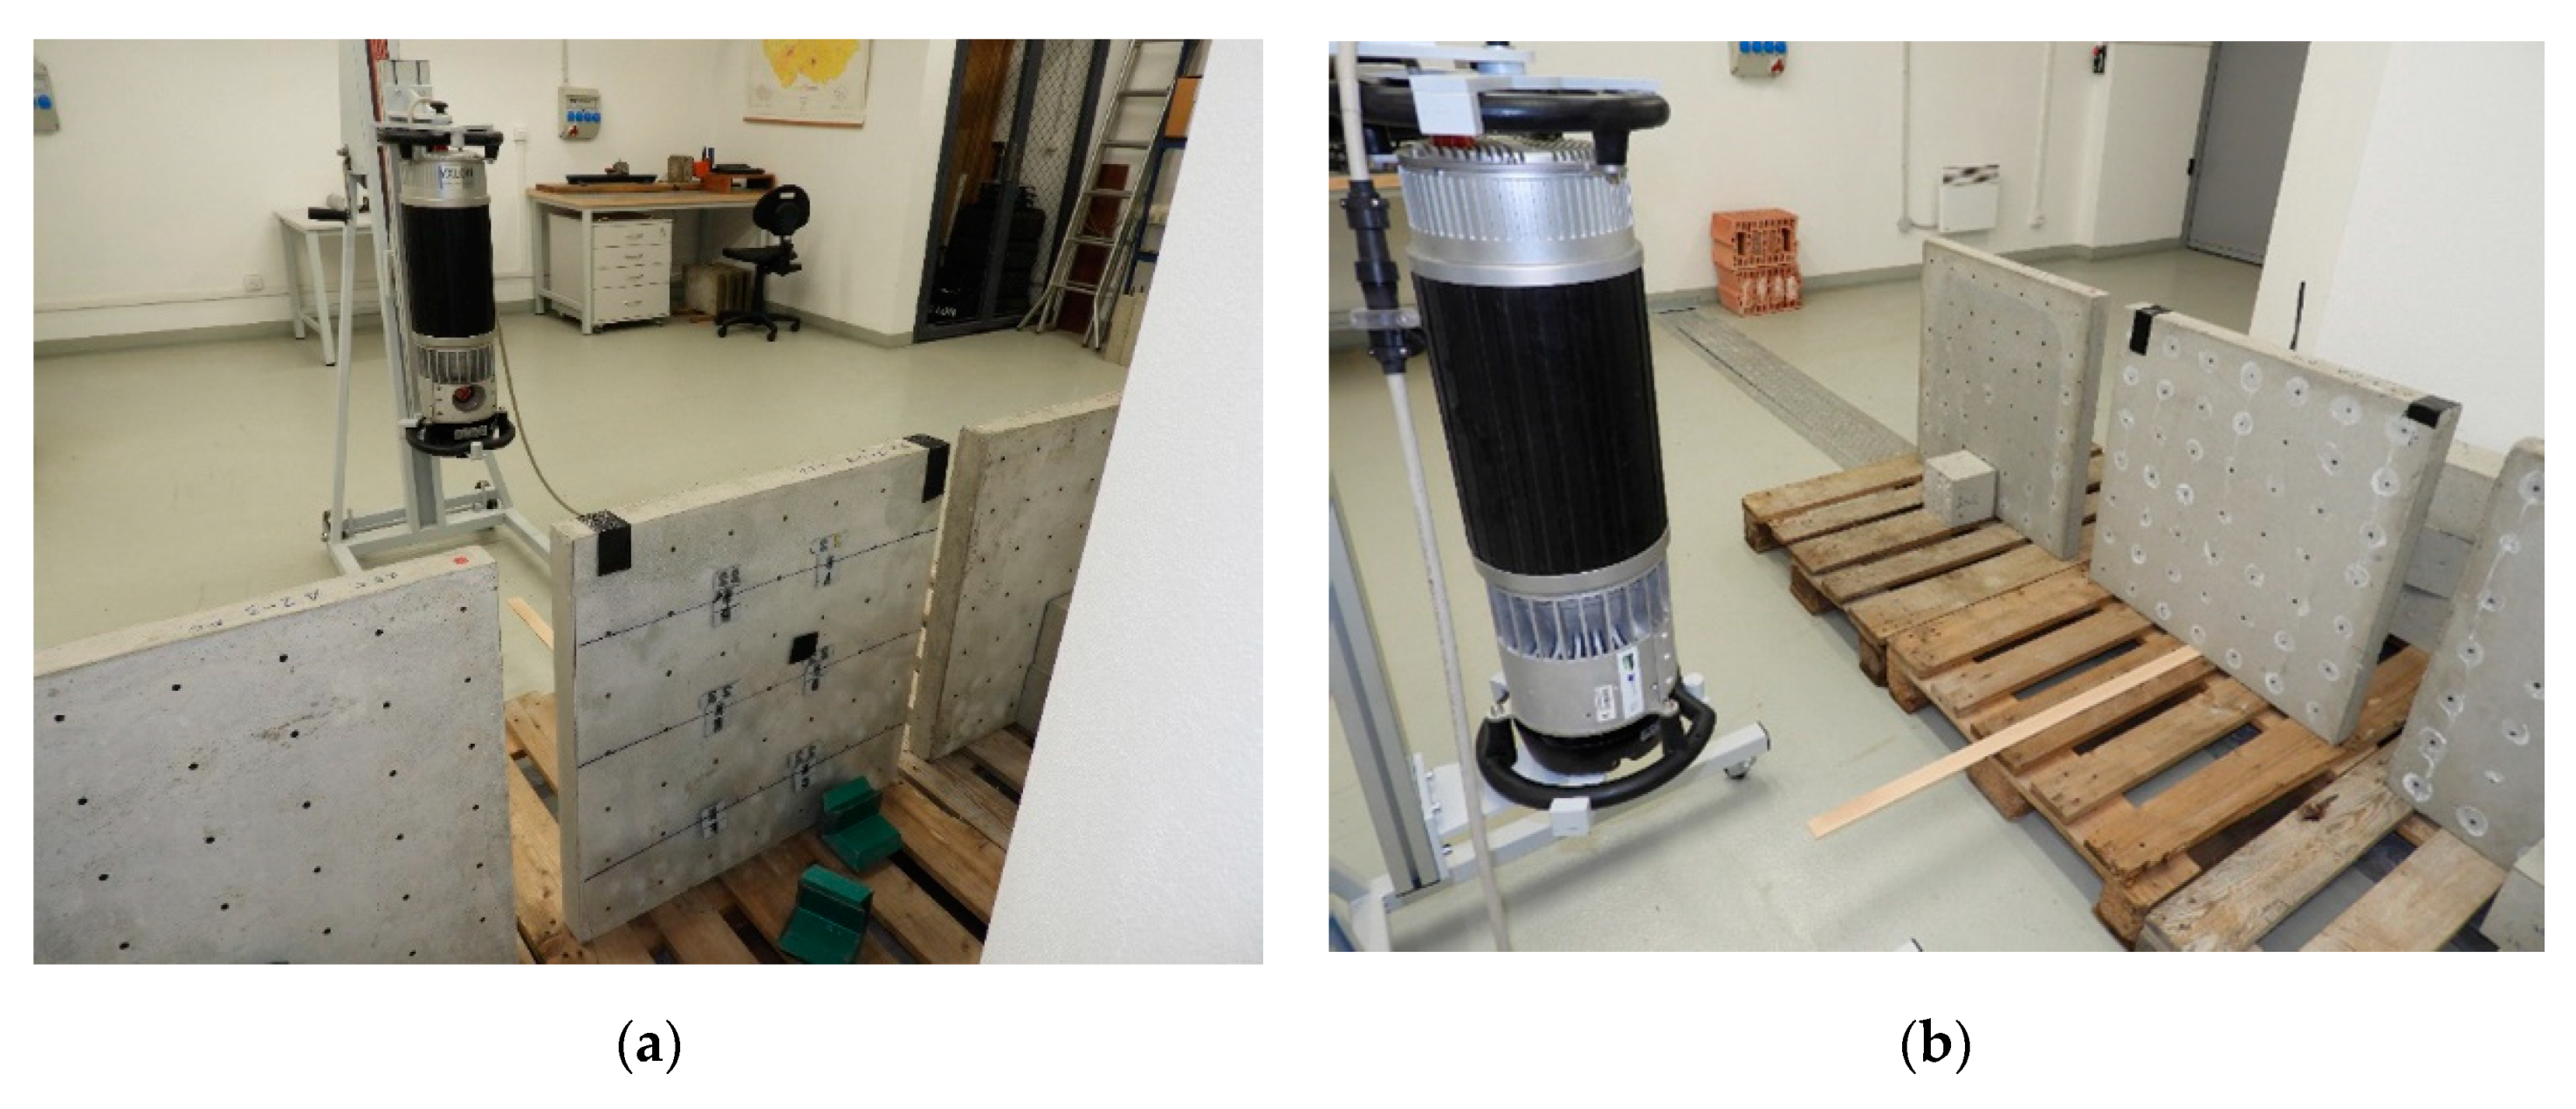
To control the homogeneity of the dispersion of steel fibers in concrete, a radiographic method was chosen, based on the passage and attenuation of X-rays. YXLON SMART 300 HP X-ray was used as the radiation source, Dürr memory foils were used in combination with the CR35 NDT Plus Scanner to record transmitted and attenuated radiation. See
Figure 6.
For plates A2-2 and A2-3, the focal length was set to 1200 mm and the following exposure parameters were optimized:
The location of testing slabs in radiography is shown in
Figure 6.
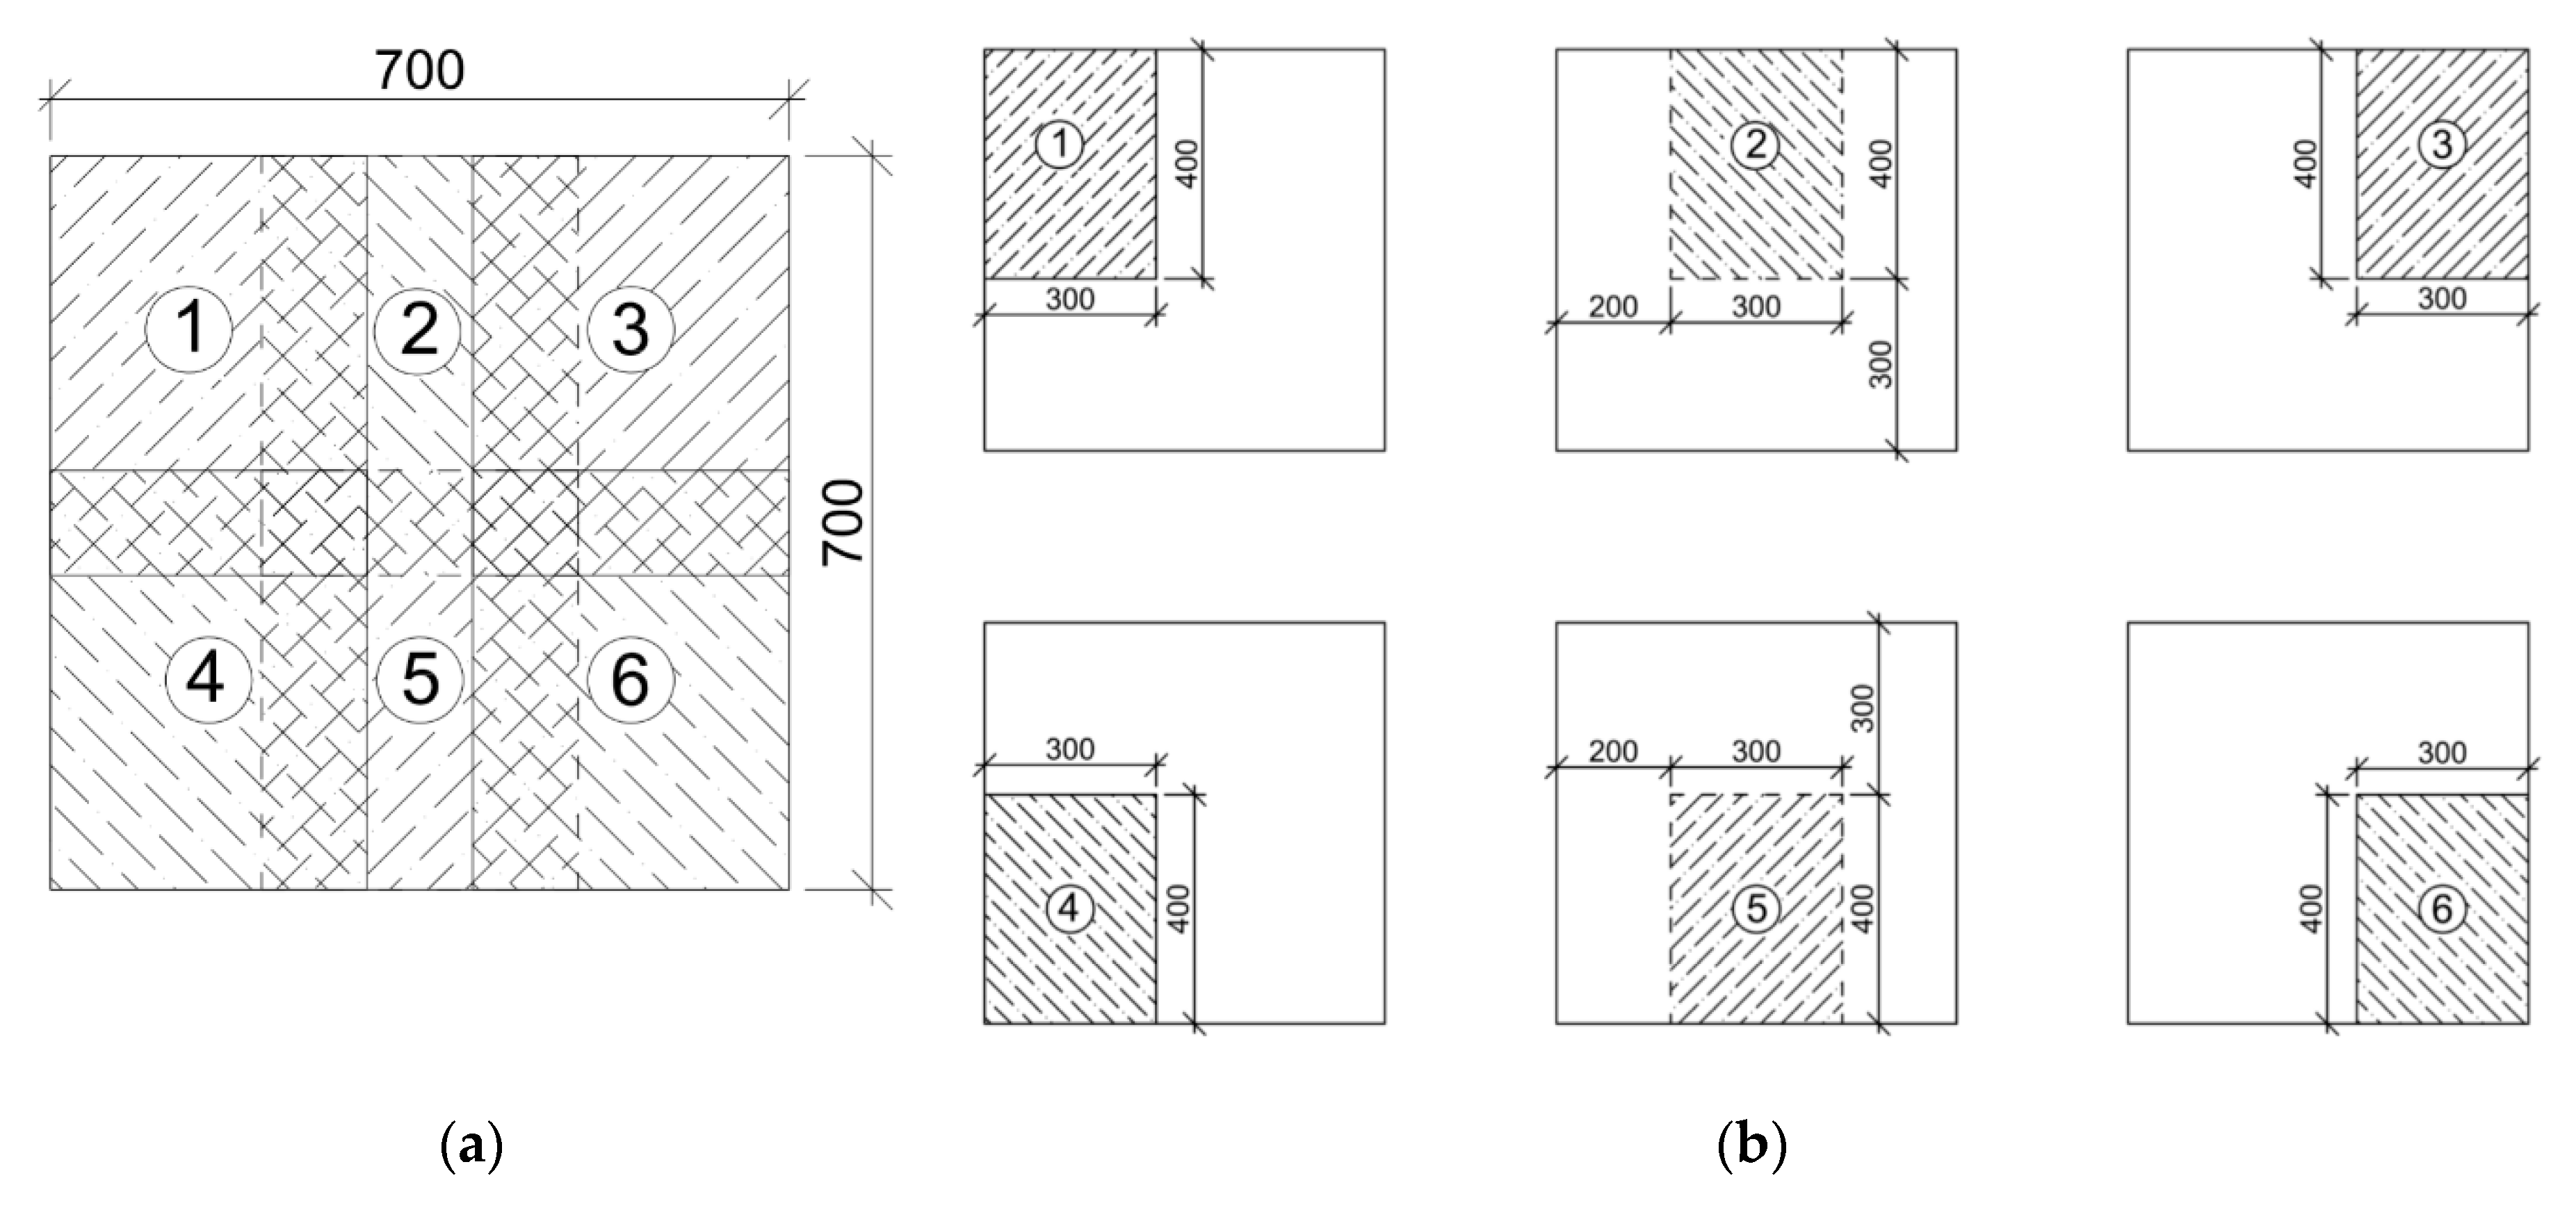
Due to the surface dimensions of the test plates 700 × 700 mm, and the dimensions of the memory foils 400 × 300 mm, the area of the test plate was always covered with six radiograms (see the diagram in
Figure 7). To clearly identify the position of the radiogram within the testing slab area, lead marks were placed on the back of the irradiated slabs (closer to the memory foil), which, due to the high lead density, are clearly visible in the images regardless of the irradiation parameters. In
Figure 8, there are visible radiograms that overlapped on the surface of the slab.
4. Research Results
4.1. Influence of Rainwater on Measurement Using the UPV Testing Method
Based on the results of measurements of ultrasound transmission rates in slabs, an analysis of variance (ANOVA) analysis was performed.
Having a few independent samples (i.e., three different rain conditions), there was a need to compare their mean values. A pairwise comparison test could not be used; therefore, the analysis of variance (ANOVA) was employed. First, the Bartlett test of homogeneity of variances was conducted. If its p-value was larger than the significance level (α = 0.05), we proceeded to test the null hypothesis H: μ1 = μ2 = μ3 against the alternative hypothesis A: μi ≠ μj for i, j = 1, 2, 3 and i ≠ j, using the F-statistics calculated as the ratio of mean squares, which describes variability within and between the samples. If the hypothesis H was rejected, the post hoc test—Tukey test—was used to compare the differences between the samples and to point out which pair of means was significantly different.
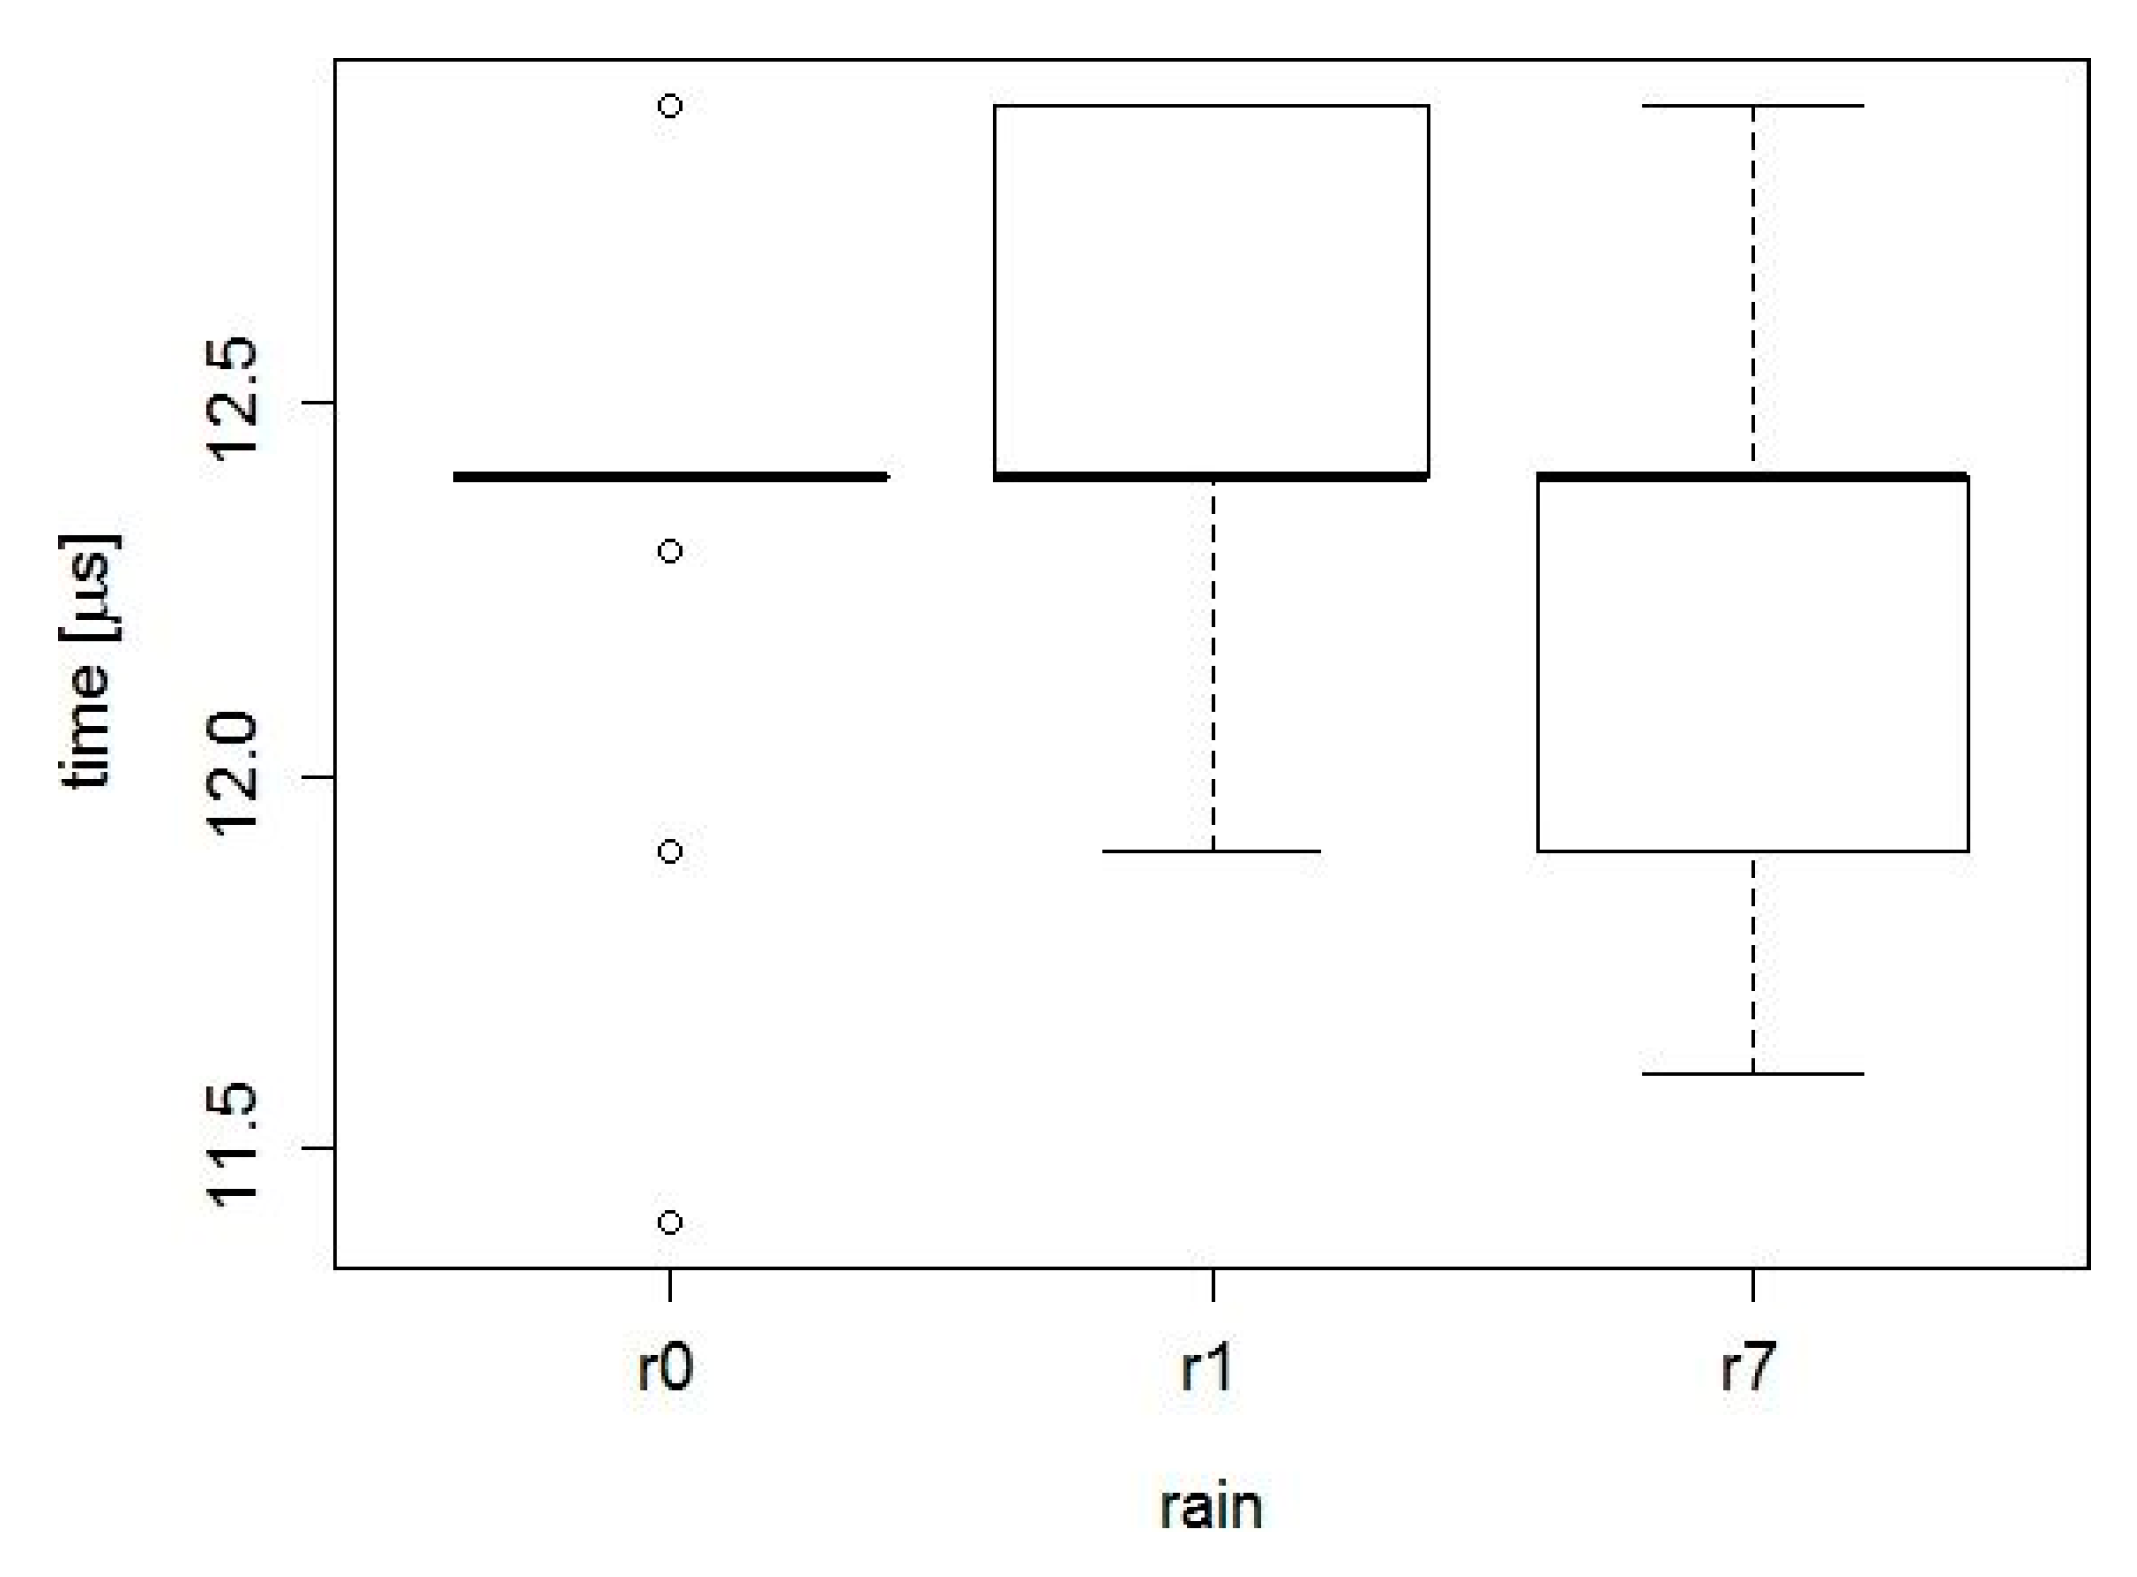
4.1.1. Testing Slab V1 SFRC
The results of the ANOVA calculation are summarized in
Table 3 and in the graphical form in
Figure 9, where are depicted boxplots of the ultrasonic wave transmission with respect to the factor level represented by the number of rain days (r0 = no rain, r1 = one day of rain, r7 = seven days of rain).
The ANOVA showed that the hypothesis of the same means was rejected (
p-value is smaller than the significance level 0.05). Therefore, the Tukey post hoc test was conducted. Its results are summarized in
Table 4.
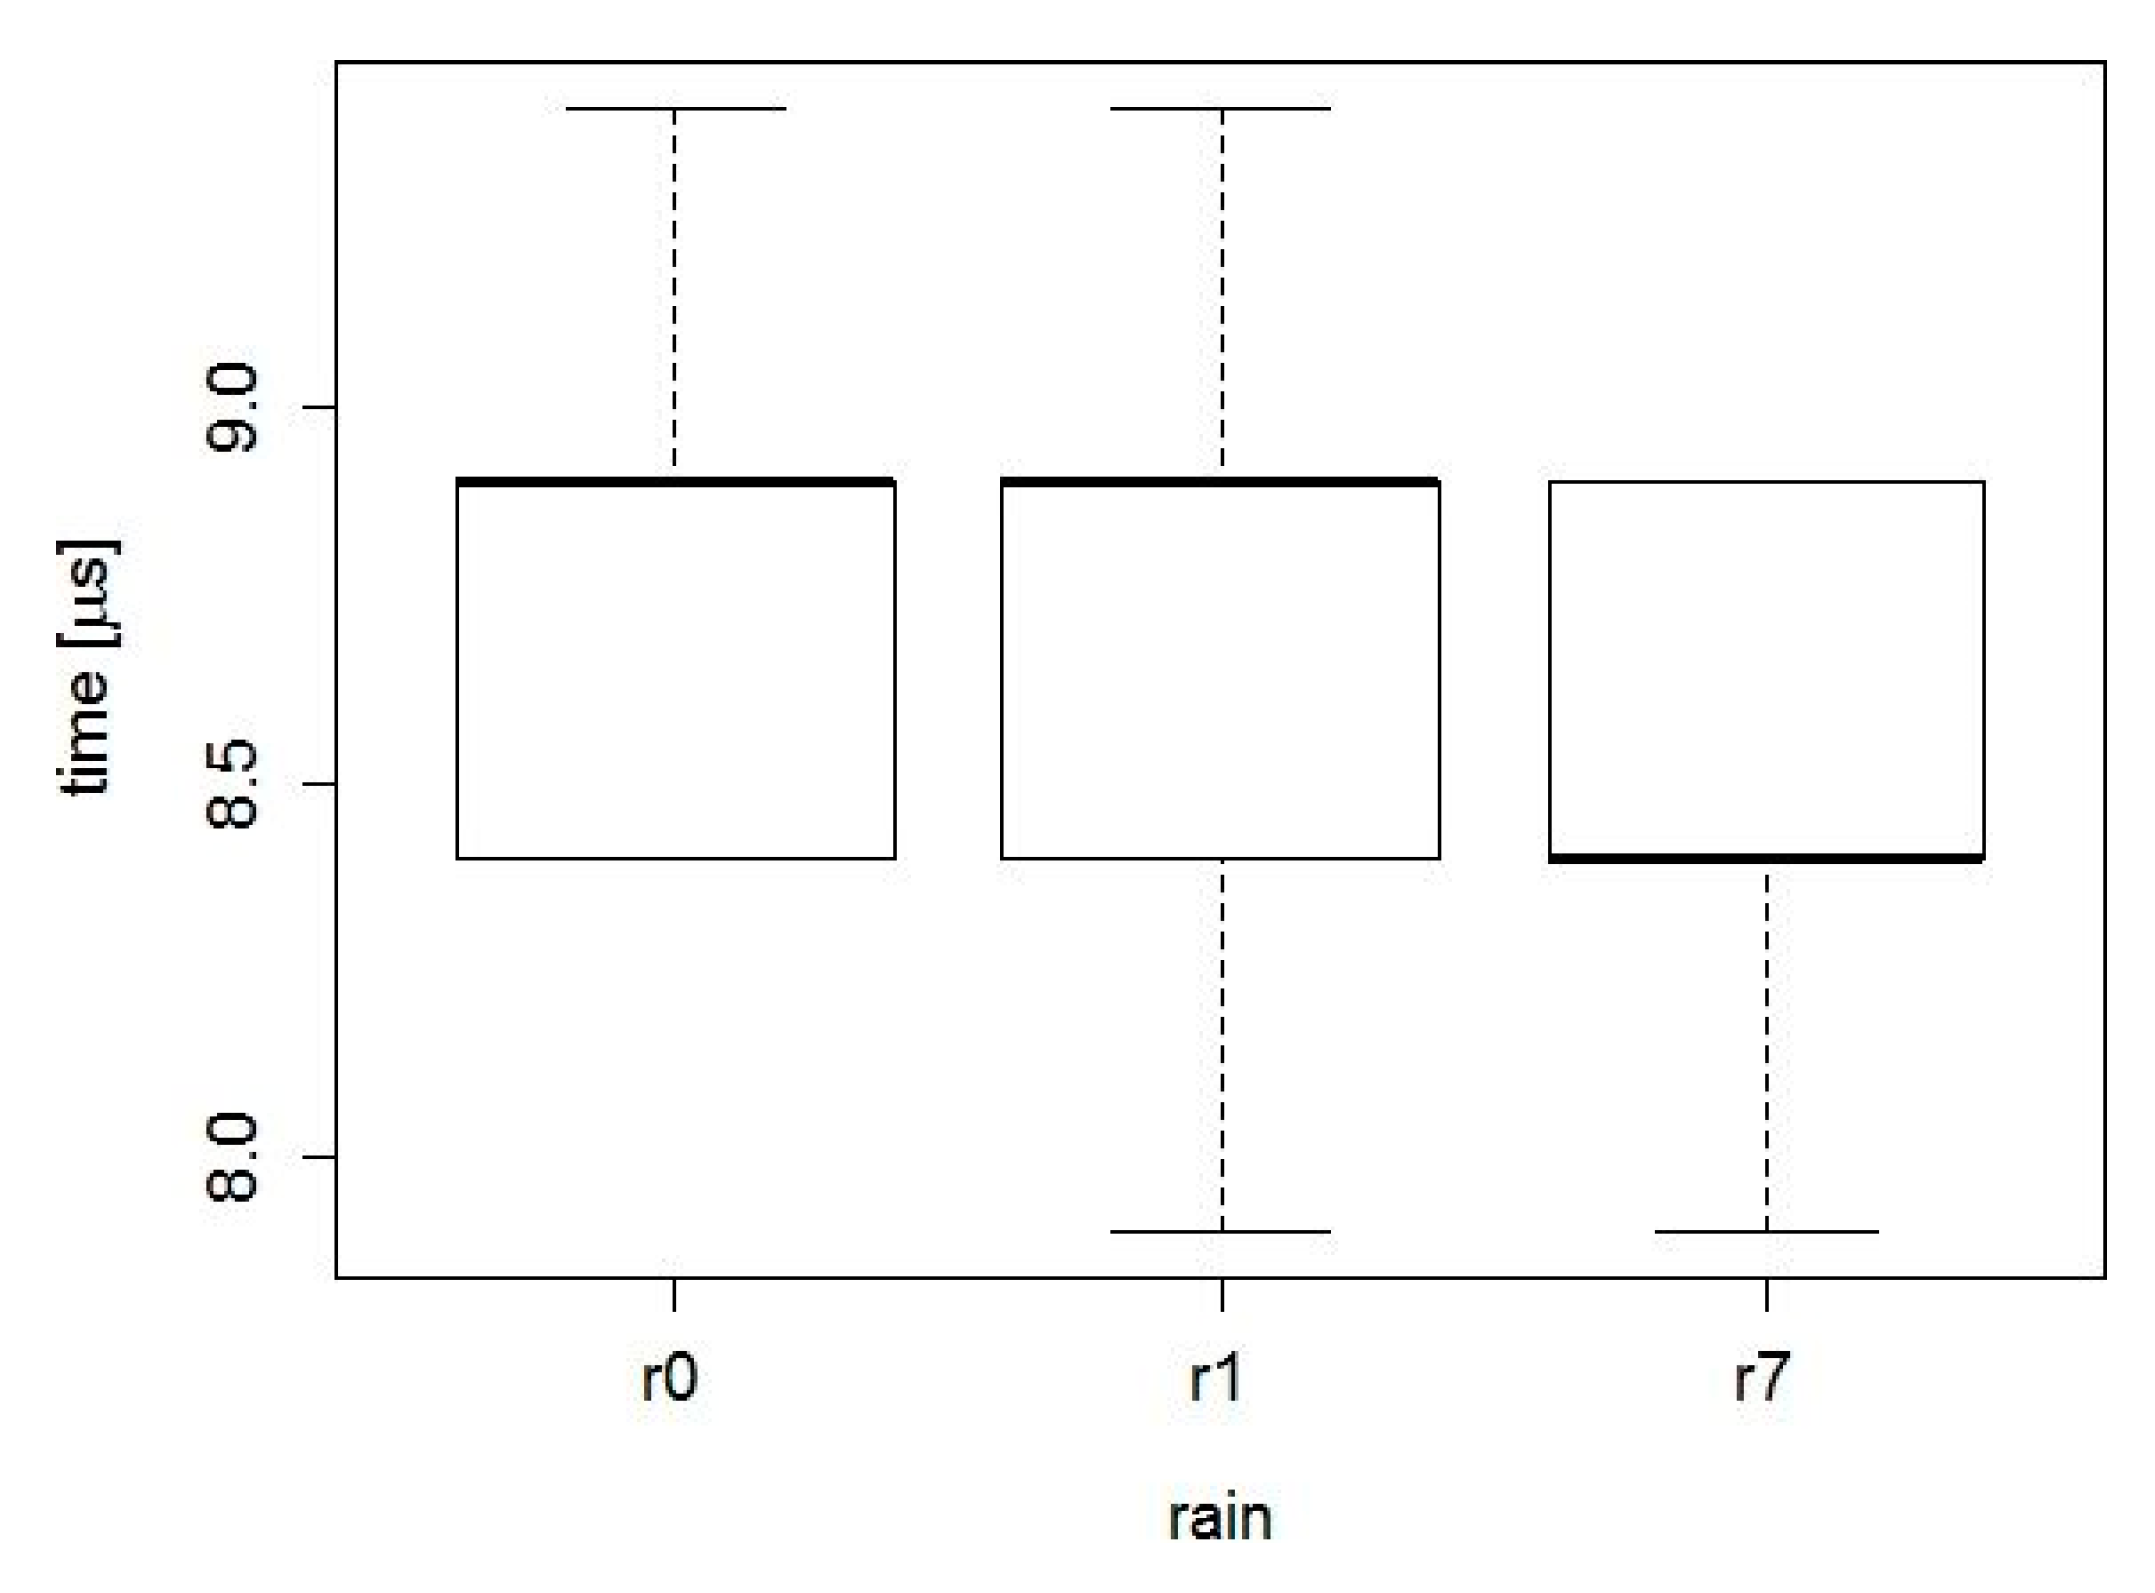
4.1.2. The Testing Slab V2 UHPFRC
The ANOVA showed that the hypothesis of the same means was not rejected (p-value is greater than the significance level 0.05).
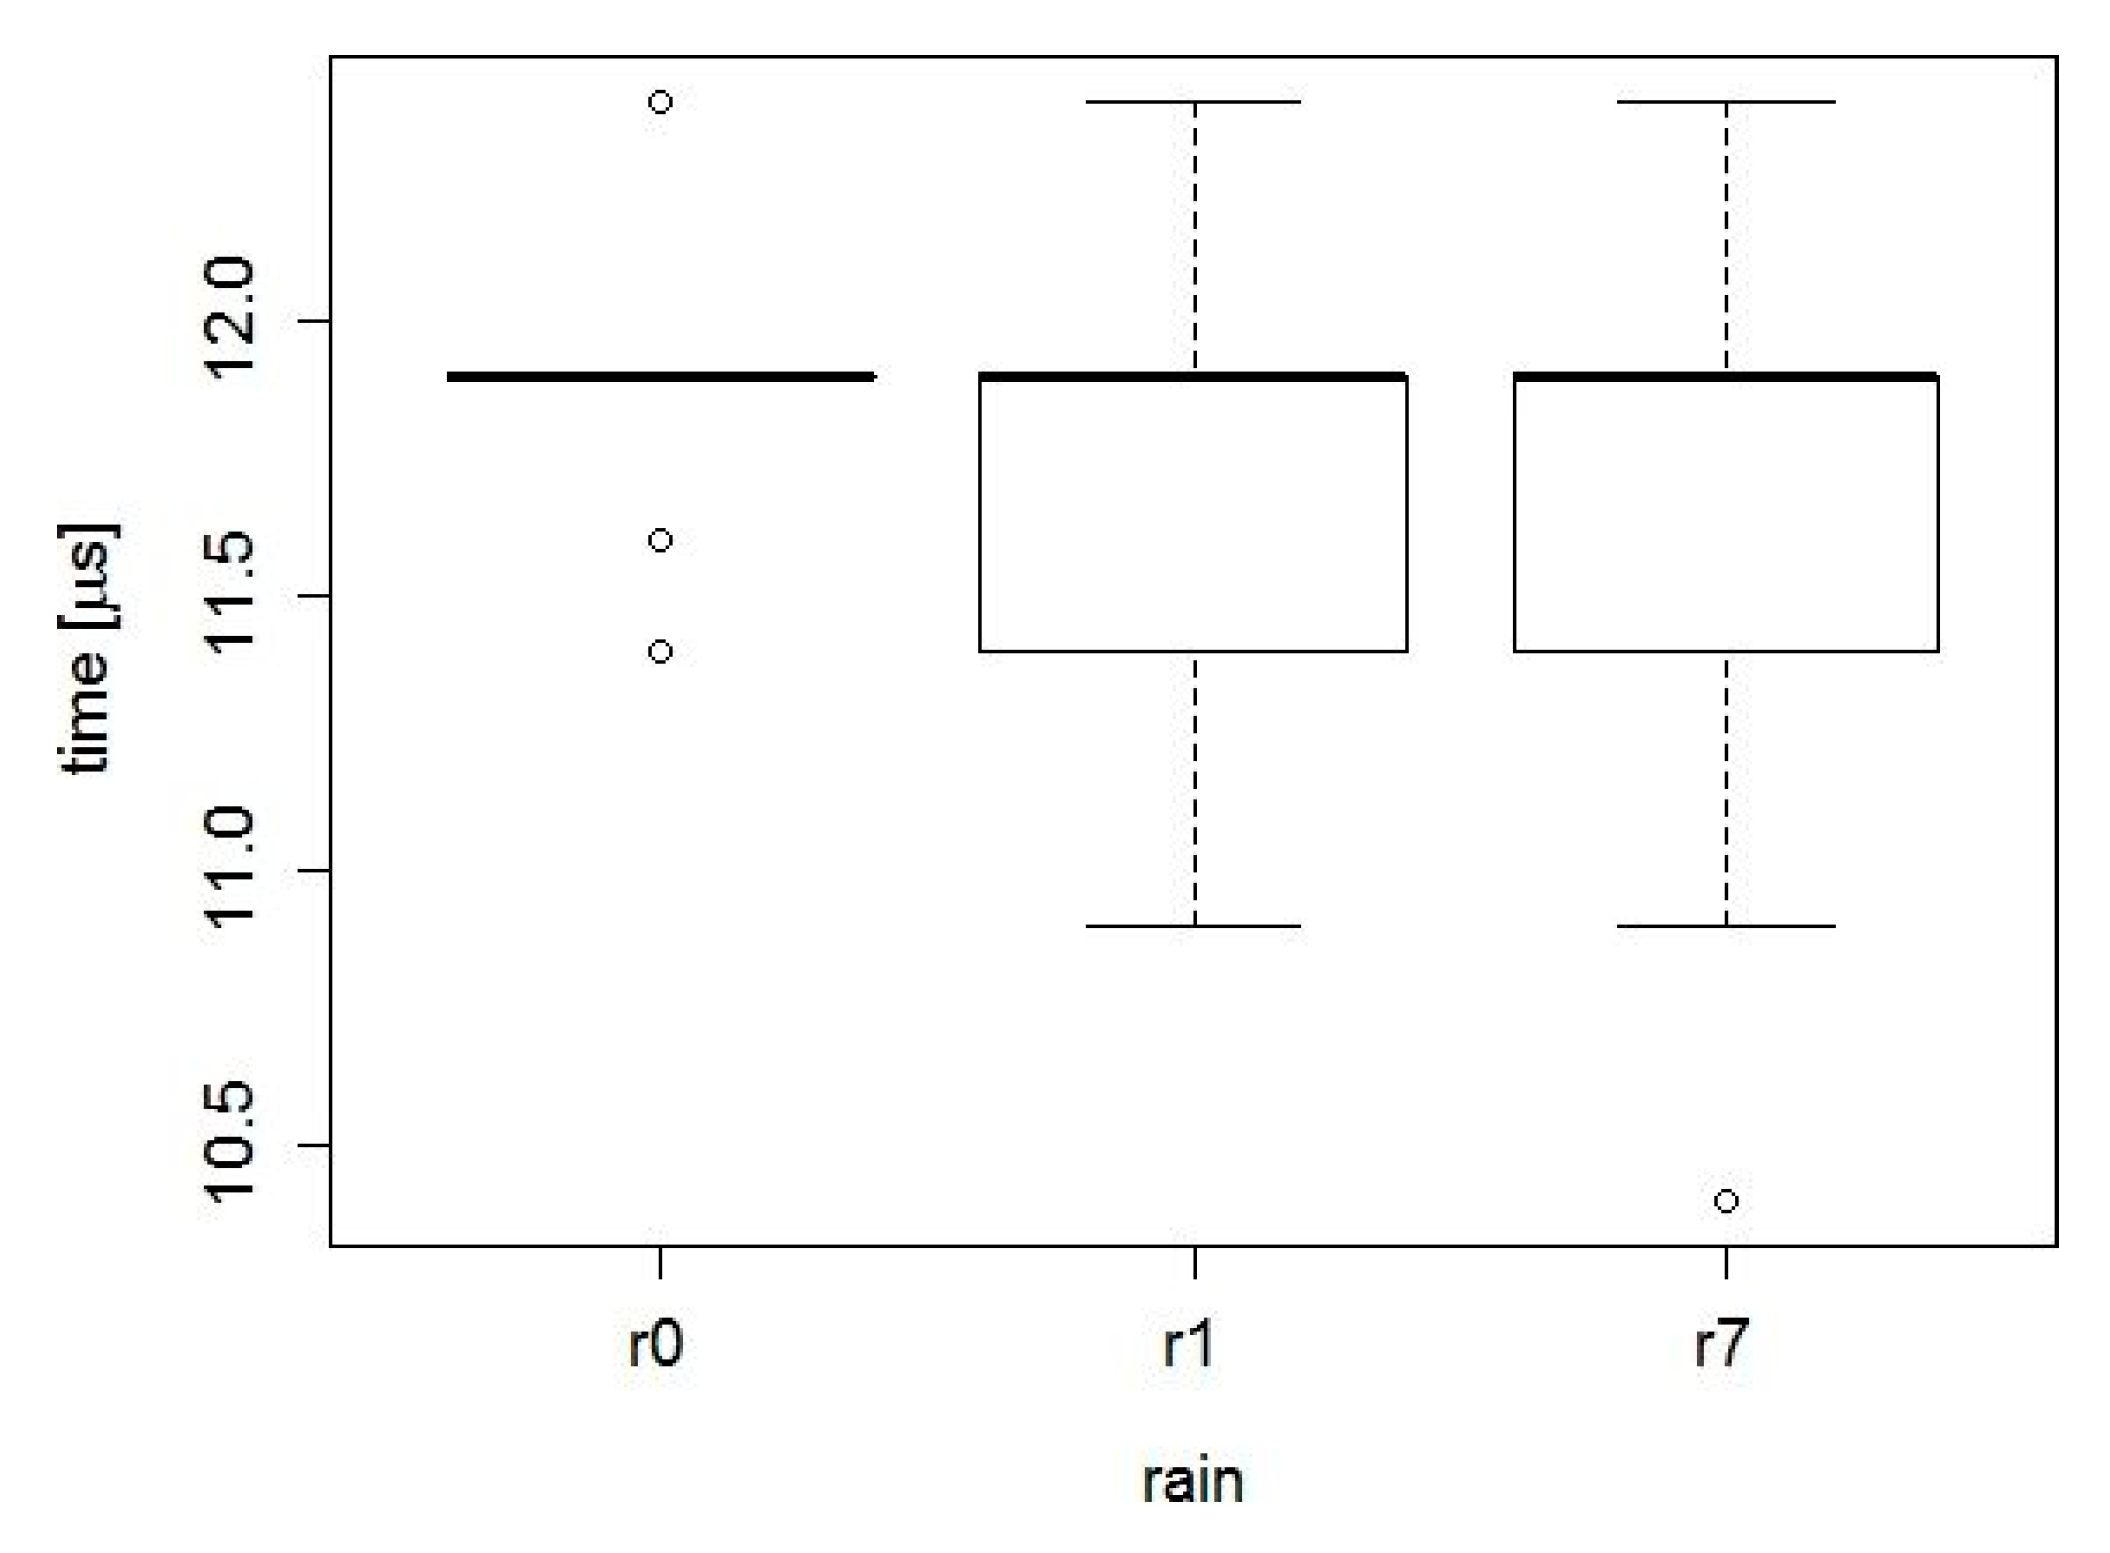
4.1.3. The Testing Slab V3 SFRC
The ANOVA showed that the hypothesis of the same means was not rejected (
p-value is greater than the significance level 0.05). All calculations were done in R [
21].
4.2. Comparison of Results of Measuring Method UPV and Radiography
To validate the values measured by ultrasound, a radiographic method was chosen, which is not usable for in situ measurements, but it is a standard method for verifying the discontinuities of materials.
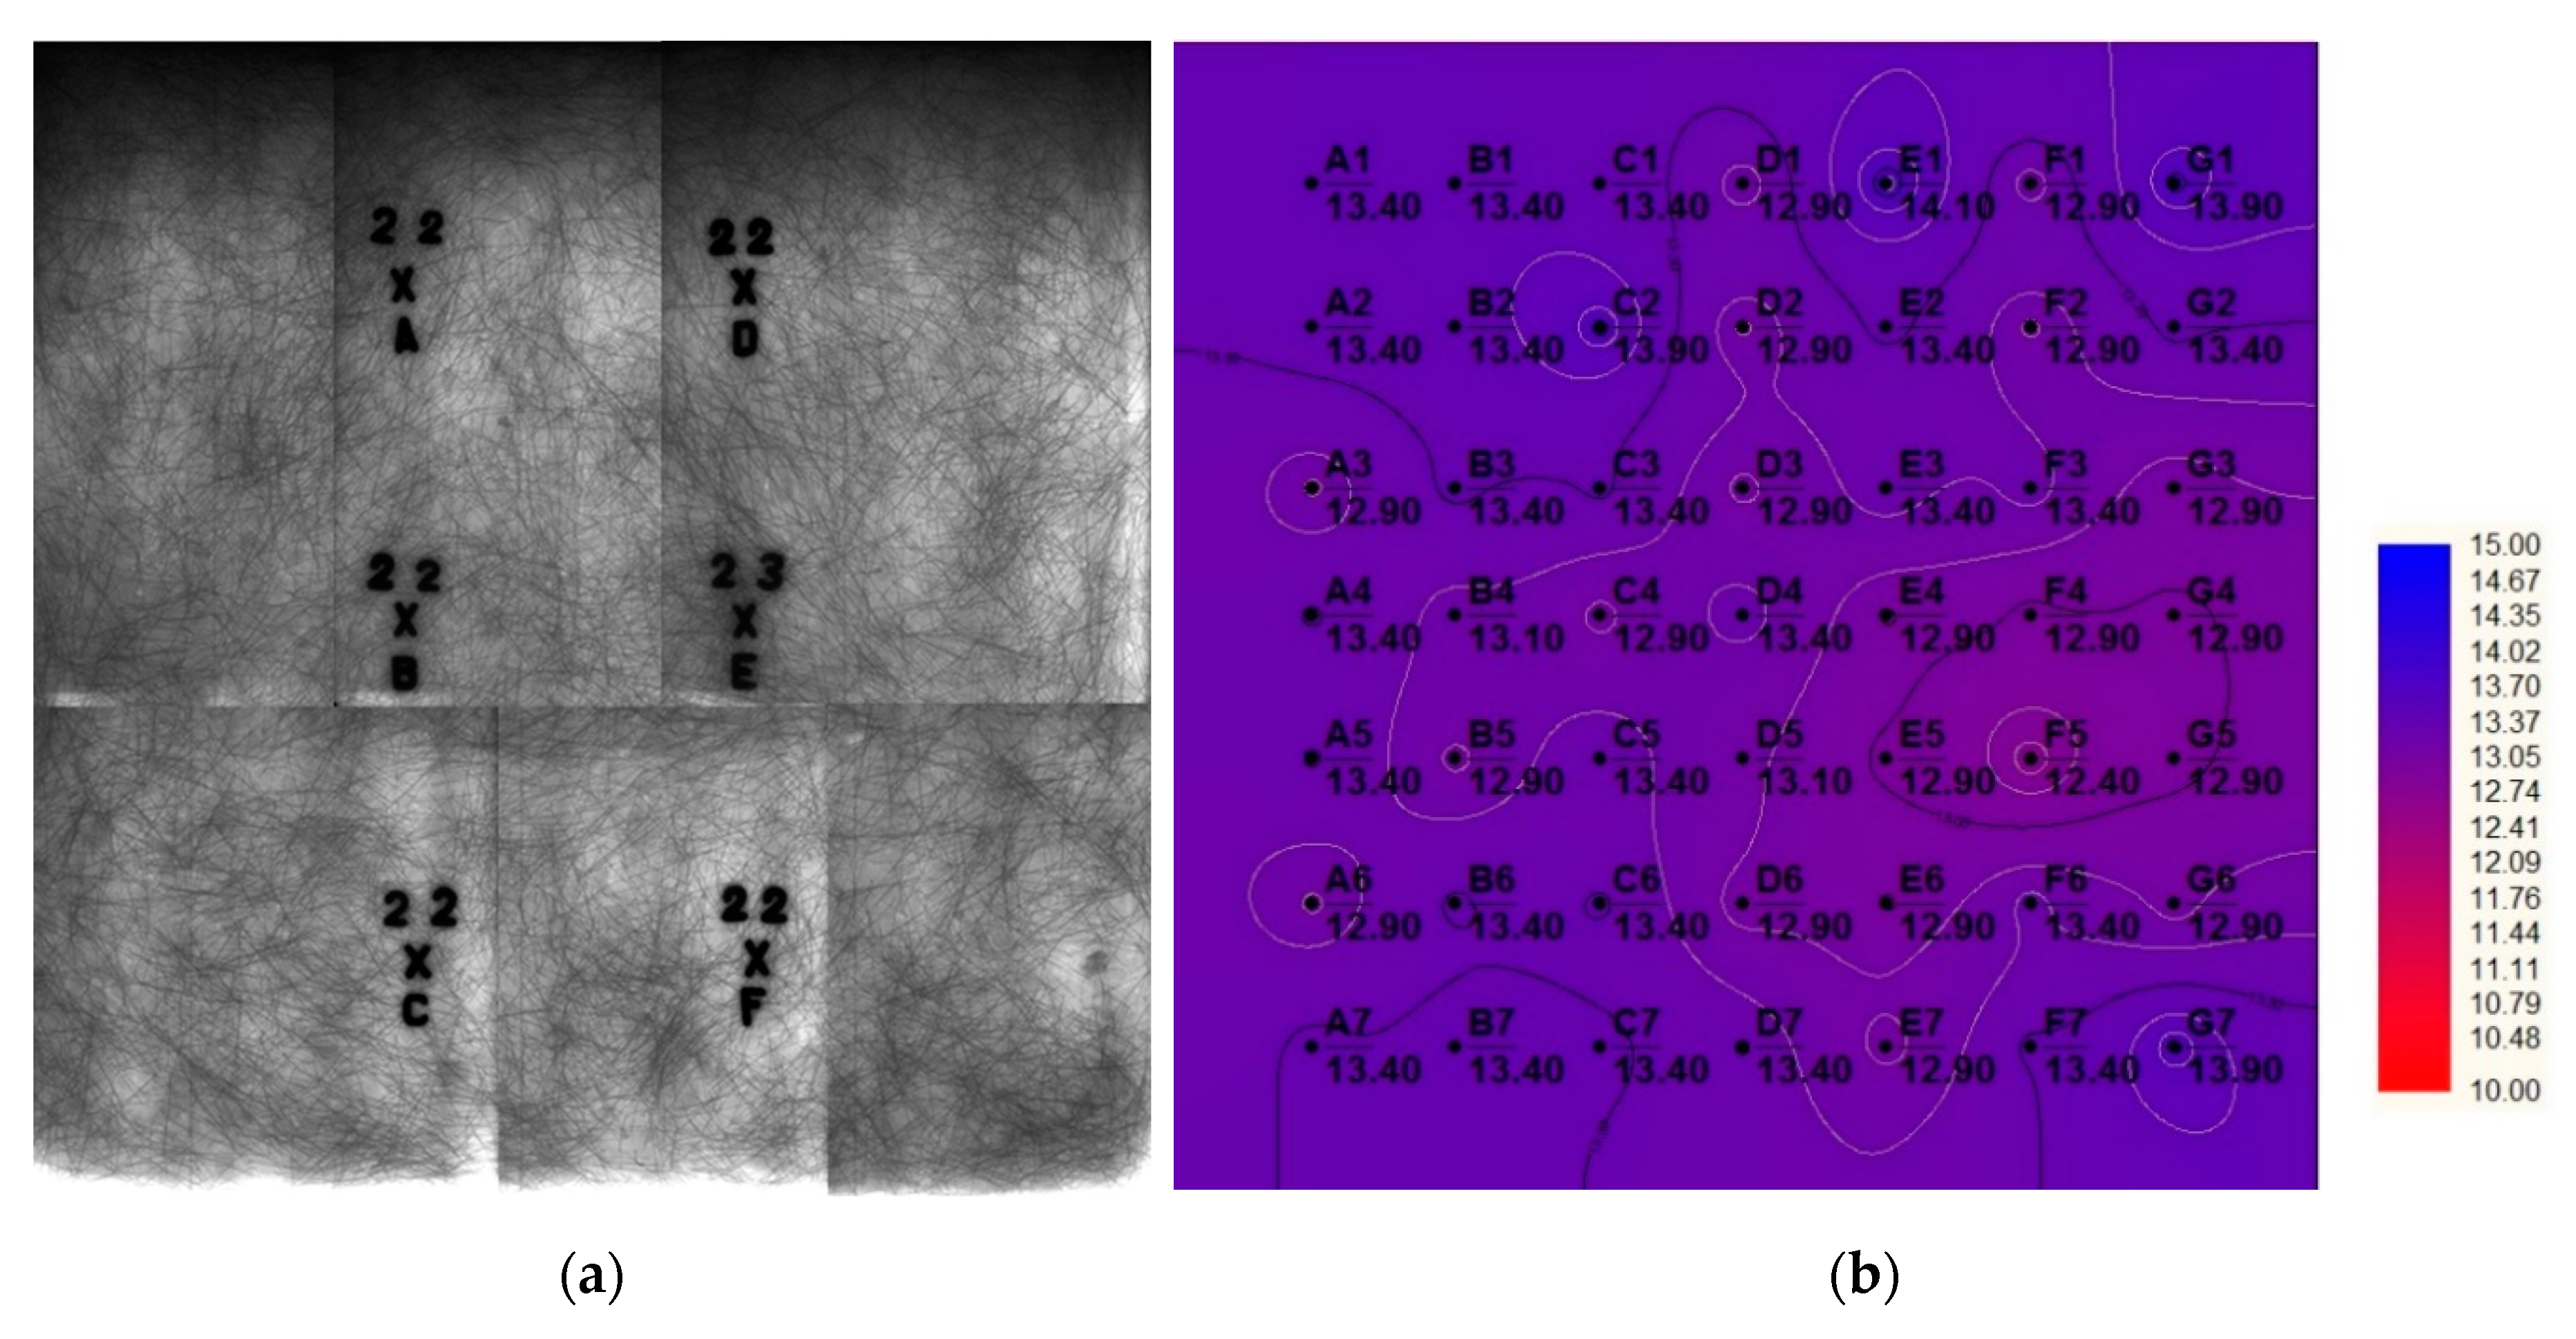
Figure 12a shows radiography result of the tested Slab A2-2. The final radiogram clearly shows the structure of the wire distribution in the slab. The steel fibers in the slab are distributed homogeneously, areas with locally higher or lower concentration are negligible.
Figure 12b shows isovels distribution the SFRC tested slab. It indicates no significant discontinuity in the slab.
Figure 13a shows radiography result of the tested Slab A2-3. The final radiogram clearly shows the structure of the wire distribution in the slab. The steel fibers in the slab are distributed homogeneously, areas with locally higher or lower concentration are negligible. The predominant unidirectional orientation of the steel fibers occurs only in the lower part of the slab, as a marginal effect during concreting.
Figure 12b shows isovels distribution of the SFRC tested slab. It indicates no significant discontinuity in the slab. The longer transit time of the ultrasonic waves is concentrated in the lower part of the plate, which supports the conclusion from the radiography.
The final evaluation of fibers scattering homogeneity in testing slabs. Based on the analysis of acquired radiographs and on the basis of measured values using the ultrasonic method, it can be stated that the structure of steel fibers distribution in concrete is very homogeneous in Slabs A2–2 and A2–3, only with slight deviations of locally increased or decreased concentration.
5. Discussion and Conclusions
From the outputs of the statistical analyses on the effect of rain on in situ measurements, it seems that the effect of water content in the test specimen on the measured values of the speed of ultrasound velocity is more or less negligible. When the simplest measure, such as a coefficient of variation, was used, it indicated that the slabs would show very similar behavior. Namely, the first testing slab (V1 SFRC) provided the least different results in the sense of its variability. Nevertheless, from a technical point of view, it can be deduced that this testing slab was apparently poorly compacted and therefore it had a different porosity than Slabs V2 and V3. Unfortunately, it was not possible to test another test sample with the same mixture, especially with the same value of the water ratio. The water ratio has a great influence on the resulting porosity of the internal structure of the composite. The amount and size of the pores affect the time of water penetration through the composite and its amount needed for full saturation. Basically, it was needed more water to fully saturate Slab V1, which could slow the rate of the ultrasound signal penetration. It can be said that according to laboratory tests, the effect of the evaluated composite saturation degree on the resulting values of the rate of ultrasound propagation is negligible. However, for a more complex evaluation of this issue, further experiments will be performed. The question is whether it is necessary for the methodology of assessment of the condition of the protective structure in situ to include the moisture of the structure caused by rain in the factors influencing the assessment result. This question arises from the assumption of the formation of cracks and microcracks in the internal structure of the composite after dynamic loading, when there is no full destruction. A larger amount of water would be needed to saturate the loaded structure, which could have a more significant effect on the speed of the ultrasound. Due to the overall result of the statistical test, a larger statistical data set will be needed for verification, i.e., to perform further measurement on more samples.
Based on the analysis of the acquired radiographs, it can be stated that the structure of the distribution of steel fibers in concrete is very homogeneous in testing slabs, with only slight deviations of the locally increased or decreased concentration.
Based on the results of ultrasonic measurement and subsequent validation of measurement results by radiography, it can be stated that the ultrasonic method is suitable for detecting discontinuities of cement-based material in field conditions. Therefore, it is appropriate to include it in the set of NDT methods designed to assess the condition of military protective structures in the field. What needs to be worked out on this method is a set of measures and possibly aids that would eliminate the effects on the accuracy and repeatability of measurements.
Another part of the research will take place in the Boletice Military Training Area. After transport, the boards will be measured ultrasonically to check for structural changes. Following this, they will be loaded with an explosion so that microcracks form. The charge size for each testing slab will be mathematically simulated using ANSYS-AUTODYN software.
Author Contributions
Conceptualization, Z.E. and K.T.; methodology, Z.E. and K.T.; software, S.P., H.K. and A.O.; validation, Z.E., Š.J. and K.T.; formal analysis H.K., S.P., K.T. and A.O.; investigation, Z.E. and K.T.; resources, K.T. and Z.E.; data curation, Z.E., K.T., Š.J., H.K. and S.P.; writing—original draft preparation, Z.E. and K.T.; writing—review and editing, E.Z., K.T., Š.J., H.K. and A.O.; visualization, Z.E. and K.T.; supervision, Š.J.; project administration, Z.E. All authors have read and agreed to the published version of the manuscript.
Funding
This research received no external funding.
Acknowledgments
The work presented in this article has been supported by the Czech Republic Ministry of Defence—K 201 Department development program “Development of Technologies in the Field of Weapon Construction, Ammunition, Armament Equipment, Material Engineering and Military Infrastructure”.
Conflicts of Interest
The authors declare no conflict of interest.
References
- Zezulová, E.; Kroupa, L. On Diagnostics of Military Fortification Constructions. In Challenges to National Defence in Contemporary Geopolitical Situation (CNDCGS 2020); General Jonas Žemaitis Military Academy of Lithuania: Vilnius, Lithuania, 2020; Volume 2, pp. 32–42. Available online: https://www.cndcgs2020.org/conference-program/ (accessed on 20 October 2020)ISSN 2669-2023.
- Soutsos, M.; Bungey, J. Introduction: Key issues in the non-destructive testing of concrete structures. In Non-Destructive Evaluation of Reinforced Concrete Structures; Woodhead Publishing: Sawston, UK; Cambridge, UK, 2010; pp. 3–23. ISBN 9781845695606. [Google Scholar] [CrossRef]
- Al-Mattarneh, H. Electromagnetic quality control of steel fiber concrete. Constr. Build. Mater. 2014, 73, 350–356. [Google Scholar] [CrossRef]
- Kobaka, J.; Katzer, J.; Ponikiewski, T. A Combined Electromagnetic Induction and Radar-Based Test for Quality Control of Steel Fibre Reinforced Concrete. Materials 2019, 12, 3507. [Google Scholar] [CrossRef] [PubMed]
- Handbook of Materials Failure Analysis; Elsevier: Amsterdam, The Netherlands, 2018; ISBN 9780081019283.
- Ďubek, M.; Makýš, P.; Ďubek, S.; Petro, M. The Evaluation of the Content of Fibers in Steel Fiber Reinforced Structures and Image Analysis. J. Civ. Eng. Manag. 2018, 24, 183–192. [Google Scholar] [CrossRef]
- Gregorová, V.; Ďubek, M.; Ďubek, S.; Štefunková, Z. An experimental preparation of fibre concrete to software’s detection of fibres. In Proceedings of the IOP Conference Series: Materials Science and Engineering, XXV International Conference and Meeting of Departments, CONSTRUMAT 2019, Zuberec, Slovakia, 29–31 May 2019; Volume 549, pp. 1–8. [Google Scholar] [CrossRef]
- Štoller, J.; Zezulová, E. The Application of Fibre Reinforced Concrete for Protective Shelter from Auxiliary Material. Key Eng. Mater. 2017, 755, 374–381. [Google Scholar] [CrossRef]
- Štoller, J.; Zezulová, E. The Basic Properties of Materials Suitable for Protective Structures and Critical Infrastructure. In Durability of Critical Infrastructure, Monitoring and Testing; Kravcov, A., Cherepetskaya, E., Pospichal, V., Eds.; Lecture Notes in Mechanical Engineering; Springer: Singapore, 2017; pp. 211–221. ISBN 978-981-10-3246-2. [Google Scholar] [CrossRef]
- Komárková, T. Design of Methodology for Non-Destructive Testing of Steel-Reinforced-Fiber-Concrete. Key Eng. Mater. 2016, 714, 179–185. [Google Scholar] [CrossRef]
- Fiala, P.; Szabo, Z.; Londak, P.; Gescheidtova, E.; Dohnal, P. A Non-Destructive Impedance Method to Measure Semi-Periodic Structures. In Proceedings of the 2019 PhotonIcs & Electromagnetics Research Symposium-Spring (PIERS-Spring), Rome, Italy, 17–20 June 2019; IEEE: Piscataway, NJ, USA, 2019; pp. 3745–3750, ISBN 978-1-7281-3403-1. [Google Scholar] [CrossRef]
- Anton, O.; Komarkova, T.; Lanik, J.; Hermankova, V. Development of new methods for determining the distribution of steel fibres in the hardened steel fibre reinforced concrete—Possibilities of production and verification of test specimens. In Proceedings of the IOP Conference Series: Materials Science and Engineering, Construmat 2018, Herlany, Slovakia, 13–15 June 2018; Volume 385, ISSN 1757-8981. [Google Scholar] [CrossRef]
- Zezulová, E.; Komárková, T. Techniques of Non-Destructive Testing of Steel Fiber Reinforced Concrete. Key Eng. Mater. 2017, 755, 153–158. [Google Scholar] [CrossRef]
- Hajek, R.; Fladr, J.; Pachman, J.; Stoller, J.; Foglar, M. An experimental evaluation of the blast resistance of heterogeneous concrete-based composite bridge decks. Eng. Struct. 2019, 179, 204–210. [Google Scholar] [CrossRef]
- Czech Technical Standard 73 1371. Ultrasound Pulse Method of Concrete Testing; ÚNM Publishing: Prague, Czech Republic, 1982. [Google Scholar]
- The European Standard EN 12504-1:2000. Testing Concrete in Structures—Part 1: Cored Specimens—Taking, Examining and Testing in Compression ÚNMZ; ÚNM Publishing: Prague, Czech Republic, 2001. [Google Scholar]
- Benaicha, M.; Jalbaud, O.; Hafidi Alaoui, A.; Burtschell, B. Correlation between the mechanical behavior and the ultrasonic velocity of fiber-reinforced concrete. Constr. Build. Mater. 2015, 101, 702–709. [Google Scholar] [CrossRef]
- Hobst, L.; Bílek, P. Non-destructive identification of material properties of fibre concrete: A stationary magnetic field. AIP Conf. Proc. 2016, 1738, 380010. Available online: https://aip.scitation.org/doi/abs/10.1063/1.4952171 (accessed on 23 June 2016). [CrossRef]
- Hobst, L. Important Role of Radiography for determination of Conditions in Reinforced Concrete Structures. In Engenharia Estudo e Pesquisa; Universidade Federal Fluminense: Niterói, Brazil, 2007; Volume 9, p. 7. ISSN 1415-3025. [Google Scholar]
- Ohdaira, E.; Masuzawa, N. Water content and its effect on ultrasound propagation in concrete—The possibility of NDE. Ultrasonics 2000, 38, 546–552. [Google Scholar] [CrossRef]
- R Core Team. R: A Language and Environment for Statistical Computing; R Foundation for Statistical Computing: Vienna, Austria, 2020; Available online: https://www.R-project.org (accessed on 25 October 2020).
Figure 1.
The Flexural Strength Measurements for Samples Made of SFCR.
Figure 1.
The Flexural Strength Measurements for Samples Made of SFCR.
Figure 2.
Preparation of Samples for Measurement using the Ultrasonic Testing Method: (a) The Template for Plotting Testing Slab; (b) Drawn and Prepared Sample.
Figure 2.
Preparation of Samples for Measurement using the Ultrasonic Testing Method: (a) The Template for Plotting Testing Slab; (b) Drawn and Prepared Sample.
Figure 3.
Representation of Ultrasonic Measurement Results using the Program for Creation of Isovels Named 3D Filed Pro 64 bit.
Figure 3.
Representation of Ultrasonic Measurement Results using the Program for Creation of Isovels Named 3D Filed Pro 64 bit.
Figure 4.
Comparison of radiography results and the ultrasonic testing method for Slab A2-1. (a) The marked points with A show a place with a locally lower density of steel fibers, and at the same time, the places marked with the letters B show the bundles of fibers that have remained connected; (b) the isovels shows ultrasonic wave transit time [µs]. The blue color of the isovels around points B4 and C4 shows almost twice the times of ultrasound passing through the material.
Figure 5.
Testing of the influence of rainwater on the results of the measurement using the ultrasonic method. (a) The V3 slab in container, prepared for rainfall simulation, (b) the V3 slab measurements.
Figure 5.
Testing of the influence of rainwater on the results of the measurement using the ultrasonic method. (a) The V3 slab in container, prepared for rainfall simulation, (b) the V3 slab measurements.
Figure 6.
Test plates ready for radiography. (a) Testing Slab A2-2, the layout of lead orientation markings is visible on the back; (b) Testing Slab A2-3, right X-ray YXLON SMART 300 HP, placed in a special stand allowing easy fixation of the X-ray in any position.
Figure 6.
Test plates ready for radiography. (a) Testing Slab A2-2, the layout of lead orientation markings is visible on the back; (b) Testing Slab A2-3, right X-ray YXLON SMART 300 HP, placed in a special stand allowing easy fixation of the X-ray in any position.
Figure 7.
Schematic representation of the distribution of six radiograms (1 to 6) on the surface of the test plate [mm]. (a) Films assembling on the testing slab; (b) put films on the testing slab.
Figure 7.
Schematic representation of the distribution of six radiograms (1 to 6) on the surface of the test plate [mm]. (a) Films assembling on the testing slab; (b) put films on the testing slab.
Figure 8.
The result of the radiography of plate A2-2, six radiograms that overlapped in the surface of the slab.
Figure 8.
The result of the radiography of plate A2-2, six radiograms that overlapped in the surface of the slab.
Figure 9.
Boxplots of the ultrasonic wave transmission time for Slab V1 and all rain levels (r0, r1 and r7).
Figure 9.
Boxplots of the ultrasonic wave transmission time for Slab V1 and all rain levels (r0, r1 and r7).
Figure 10.
Boxplots of the ultrasonic wave transmission for Slab V2 and all rain levels (r0, r1 and r7).
Figure 10.
Boxplots of the ultrasonic wave transmission for Slab V2 and all rain levels (r0, r1 and r7).
Figure 11.
Boxplots of the ultrasonic wave transmission for Slab V3 and all rain levels (r0, r1 and r7).
Figure 11.
Boxplots of the ultrasonic wave transmission for Slab V3 and all rain levels (r0, r1 and r7).
Figure 12.
The comparison of results of ultrasonic testing method measuring and radiography for Slab A2-2: (a) the Slab A2-2, the steel fibers are distributed homogeneously, areas with locally higher or lower concentration are negligible; (b) isovels distribution the SFRC tested Slab A2-2. It indicates no significant discontinuity in the slab.
Figure 13.
The comparison of results of measuring of ultrasonic testing method and radiography for Slab A2-3: (a) Slab A2-3, the steel fibers are distributed homogeneously, areas with locally higher or lower concentration are negligible. The predominant unidirectional orientation of the steel fibers occurs only in the lower part of the slab, as a marginal effect during concreting; (b) isovels distribution the SFRC tested Slab A2-3. It indicates no significant discontinuity in the slab.
Table 1.
Mixture of the Steel Fiber Reinforced Concrete (SFRC) in kg for 1 m3.
Table 1.
Mixture of the Steel Fiber Reinforced Concrete (SFRC) in kg for 1 m3.
| Cement | Water | Aggregates Fraction | Superplasticizer | Fibers DRAMIX RC 65/60BN |
|---|
| 0–4 | 4–8 | 8–16 |
|---|
| 455 | 165 | 870 | 220 | 655 | 4.55 | 60 |
Table 2.
Material Characteristics of the SFRC.
Table 2.
Material Characteristics of the SFRC.
| Density | Compressive Strength | Flexural Strength |
|---|
| [kg/m3] | [MPa] | [MPa] |
| 240 | 70 | 8.5 |
Table 3.
Results of the analysis of variance (ANOVA) for Slab V1.
Table 3.
Results of the analysis of variance (ANOVA) for Slab V1.
| | df
Degrees of Freedom | SS
Sum of Squares | MS
Mean Sum of Squares | F-Statistics | p-Value |
|---|
| factor (rain) | 2 | 2.330 | 1.1649 | 13.26 | 1.25·10−5 |
| residuals | 72 | 6.326 | 0.0879 | | |
| Bartlett test of homogeneity of variances: K = 0.4492, p-value = 0.7989 |
Table 4.
Tukey multiple comparison of means for Slab V1.
Table 4.
Tukey multiple comparison of means for Slab V1.
| Levels Compared | Difference | Confidence Interval | p-Value |
|---|
| r1–r0 | 0.308 | (0.1074, 0.5086) | 0.00131 |
| r7–r0 | −0.108 | (−0.3086, 0.0926) | 0.40639 |
| r7–r1 | −0.416 | (−0.6166, −0.2154) | 0.00001 |
Table 5.
Results of the ANOVA for Slab V2.
Table 5.
Results of the ANOVA for Slab V2.
| | df
Degrees of Freedom | SS
Sum of Squares | MS
Mean Sum of Squares | F-Statistics | p-Value |
|---|
| factor (rain) | 2 | 0.315 | 0.1575 | 1.259 | 0.294 |
| residuals | 45 | 5.628 | 0.1251 | | |
| Bartlett test of homogeneity of variances: K = 1.178, p-value = 0.5549 |
Table 6.
Results of the ANOVA for Slab V3.
Table 6.
Results of the ANOVA for Slab V3.
| | df
Degrees of Freedom | SS
Sum of Squares | MS
Mean Sum of Squares | F-Statistics | p-Value |
|---|
| factor (rain) | 2 | 0.765 | 0.3825 | 2.97 | 0.0576 |
| residuals | 72 | 9.274 | 0.1288 | | |
| Bartlett test of homogeneity of variances: K = 1.7547, p-value = 0.4159 |
| Publisher’s Note: MDPI stays neutral with regard to jurisdictional claims in published maps and institutional affiliations. |
© 2020 by the authors. Licensee MDPI, Basel, Switzerland. This article is an open access article distributed under the terms and conditions of the Creative Commons Attribution (CC BY) license (http://creativecommons.org/licenses/by/4.0/).

 ,
, 


