Abstract
There is a consistent rise in chronic diseases worldwide. These diseases decrease immunity and the quality of daily life. The treatment of these disorders is a challenging task for medical professionals. Dimensionality reduction techniques make it possible to handle big data samples, providing decision support in relation to chronic diseases. These datasets contain a series of symptoms that are used in disease prediction. The presence of redundant and irrelevant symptoms in the datasets should be identified and removed using feature selection techniques to improve classification accuracy. Therefore, the main contribution of this paper is a comparative analysis of the impact of wrapper and filter selection methods on classification performance. The filter methods that have been considered include the Correlation Feature Selection (CFS) method, the Information Gain (IG) method and the Chi-Square (CS) method. The wrapper methods that have been considered include the Best First Search (BFS) method, the Linear Forward Selection (LFS) method and the Greedy Step Wise Search (GSS) method. A Decision Tree algorithm has been used as a classifier for this analysis and is implemented through the WEKA tool. An attribute significance analysis has been performed on the diabetes, breast cancer and heart disease datasets used in the study. It was observed that the CFS method outperformed other filter methods concerning the accuracy rate and execution time. The accuracy rate using the CFS method on the datasets for heart disease, diabetes, breast cancer was 93.8%, 89.5% and 96.8% respectively. Moreover, latency delays of 1.08 s, 1.02 s and 1.01 s were noted using the same method for the respective datasets. Among wrapper methods, BFS’ performance was impressive in comparison to other methods. Maximum accuracy of 94.7%, 95.8% and 96.8% were achieved on the datasets for heart disease, diabetes and breast cancer respectively. Latency delays of 1.42 s, 1.44 s and 132 s were recorded using the same method for the respective datasets. On the basis of the obtained result, a new hybrid Attribute Evaluator method has been proposed which effectively integrates enhanced K-Means clustering with the CFS filter method and the BFS wrapper method. Furthermore, the hybrid method was evaluated with an improved decision tree classifier. The improved decision tree classifier combined clustering with classification. It was validated on 14 different chronic disease datasets and its performance was recorded. A very optimal and consistent classification performance was observed. The mean values for accuracy, specificity, sensitivity and f-score metrics were 96.7%, 96.5%, 95.6% and 96.2% respectively.
1. Introduction
Chronic related disorders tend to create long term health issues in patients where the immune system and related body functionalities are weakened, and it usually ends in restricting their autonomy and freedom [1]. Normal lifestyle gets severely affected and the cost of healthcare steadily rises. Apart from this, it also affects the emotional stability of the patients. Provided a proper diagnosis, some chronic disorders are curable, but the treatment is usually very lengthy and painful [1]. Nevertheless, the majority of these diseases are not yet curable. The available drugs help palliate the symptoms. Consequently, the patient’s lifespan can be increased [2]. Effective diagnosis and treatment is required for better public health. Among all the chronic diseases found in India, diabetes, breast cancer and heart disease are relatively common [3]. However, the treatment of these diseases is a challenging task due to the exponential rise in population. Moreover, the regular manual analysis of these diseases has led to inefficient medical decisions, given the large number of patients. Diagnosing a large number of patients with a potential chronic disease can be extremely hectic and time consuming. Further, the manual detection and diagnosis of symptoms may lead to errors. Consequently, machine learning technologies are critical to the successful mitigation of this problem [4]. The automatic classification of patients on the basis of symptoms is being gradually explored using machine learning [3,4]. Disease-related datasets can be analysed and the main symptoms that underlie a specific chronic disease can be uncovered through machine learning [4]. However, extracting the most common symptoms from raw unstructured data records is a significant challenge since this type of data reduces the efficiency of machine learning algorithms.
Attribute selection is a reliable pre-processing technique where less relevant data in an unstructured raw dataset is eliminated [5]. It acts as an optimizing tool that reduces the data size by selecting the relevant attributes [6]. This improves classification performance, reducing latency and increasing accuracy [7]. The main reasons for applying attribute selection techniques are that they:
- ➢
- Enable faster execution of data mining algorithms,
- ➢
- minimize the model complexity and enhance its interpretability,
- ➢
- enhance the classification/prediction accuracy rate,
- ➢
- reduce over-fitting,
In general, an attribute selection process is divided into four phases which include the following [8].
- ➢
- Generation of subsets,
- ➢
- evaluation of subsets,
- ➢
- termination condition,
- ➢
- validation of results.
In the first phase, a candidate attribute subset is generated using an effective search algorithm. In the next phase, every subset is evaluated on the basis of a predefined evaluation condition and verified with the previous optimal subset. It is replaced with the previous subset if it is found to be a better subset. This subset generation and evaluation procedure continues until a termination factor is reached. Finally, the selected attribute subset is verified and validated with predetermined testing data samples. The overall process is illustrated in Figure 1.
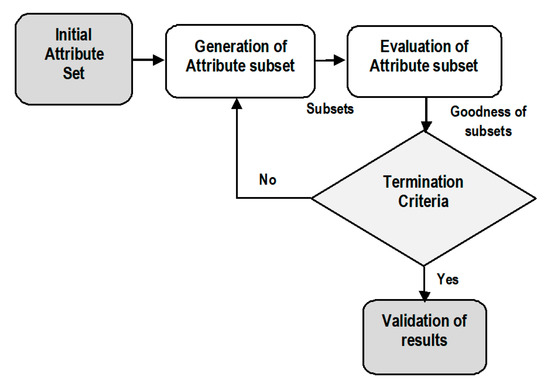
Figure 1.
Attribute Selection Process.
After the generation of attribute subsets, the evaluation of these subsets is conducted on the basis of predefined criteria to compute their performance. Usually, the performance of an attribute set is determined by its ability to differentiate the distinct classes. In terms of dependency on learning classification algorithms, attribute selection is categorized into two distinct types which include wrappers and filters.
The two categories of attribute selection are Wrappers and Filters based on dependency and interrelation with the inductive learning algorithms. On the one hand, Wrapper methods compute the attributes on the basis of the accuracy of the target classification algorithm [9]. On the other hand, Filter methods calculate attributes using statistical interrelationship between an attribute subset and the target class [10]. Every attribute is assigned a rank by a scoring value. Using the ranking of attributes, the ones with the lowest ranking are eliminated from the dataset. The prediction accuracy of an induced data mining algorithm is utilized to evaluate an attribute subset in case of Wrappers. The performance of every subset of attributes is evaluated by the use of an induced classifier to the dataset with all attributes. Wrappers are implemented to generate a subset of attributes and to obtain high prediction accuracy rate. This is achieved by considering the most relevant attributes. A system model is trained by using an attribute subset that are inserted or deleted from the subset on the basis of evaluation of previous model. Therefore, it is a search problem that is computationally expensive. Figure 2 presents the wrapper model where a predictive approach is used to compute the attribute subsets.
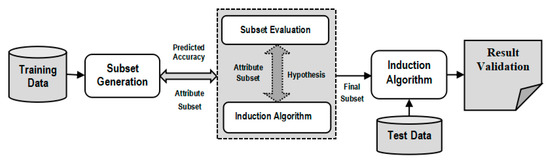
Figure 2.
Wrapper Approach for Attribute Selection.
Unlike Wrappers, Filter techniques for attribute selection do not depend on an induction classifier. These techniques do not make an attribute subset. They simply used to evaluate each attribute independently and choose the best attribute set.
The intrinsic properties of data samples are used for the evaluation of attribute subsets. Figure 3 shows the filter approach for attribute selection.
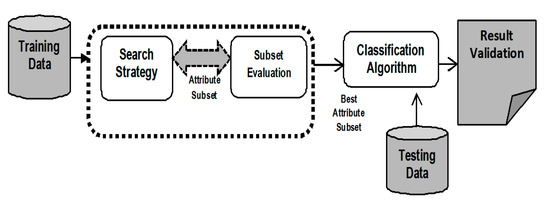
Figure 3.
Filter Method for Attribute Selection.
Attributes are characterized by their relevance with respect to target class. Since induction is not applied to determine the attribute subset, the prediction accuracy rate is comparatively lower than that of Wrappers. Filters are more generalized than Wrappers since they do not depend on any induction technique for classification. In Filters, the attributes are selected on the basis of their ranking achieved in several test conditions for their association with the resultant labelled class.
This attribute selection technique can be implemented for effective disease diagnosis [11]. Inconsistencies are usually detected in the collected chronic disease datasets. Datasets of diseases such as hepatitis, lung- and heart-related diseases, breast cancer and diabetes are highly unstructured. This means that the data require pre-processing which will remove redundant and noisy features [11]. The presence of noisy features and outliers hampers the classification mining task. Sometimes, not all the symptoms present in the datasets are required for the disease classification task. Thus, the less relevant symptoms should be excluded from the final datasets. By selecting the most relevant attributes, it is possible to improve accuracy and reduce processing time [12]. In addition, in some situations, the structure of attributes is difficult to interpret. A suitable attribute optimization approach is need for accurate the accurate treatment of diseases.
The main objective of this work is to analyse popular attribute selection techniques and the impact of filter and wrapper approaches on the evaluation of the classification of chronic diseases from datasets. Common chronic disease datasets like diabetes, heart disease and breast cancer are used to determine the impact of filters and wrappers on classification performance. The benefits and limitations of wrappers and filters are presented through experimental demonstration using the WEKA software [13], Due to its ease of use and versatile nature, decision tree is used as classifier in the research. On the one hand, correlation feature selection (CFS), information gain (IG) and chi-square are used as filters in analysis. On the other hand, the best first search (BFS), greedy step wise search (GSS) and linear forward selection (LFS) methods are the wrappers used. Ranker algorithm is the predefined search scheme applied to filter approach while WrapperSubsetEval is the predefined search method used in combination with wrapper methods. Furthermore, on the basis of the outcome of this analysis, it was observed that CFS method provided better outcome than others while among wrapper methods, BFS performed better results compared to others. Based on this, a new hybrid three step attribute evaluator was proposed. It integrated CFS as the filter approach, BFS as the wrapper and it used a new variant of K-Means named Integrated Supervised K-Means for outliers detection. Based on the evaluated attributes, a classification model using an improved decision tree is presented. The implemented results are recorded and further analysed.
This study is divided into specific sections. This section introduces the overall theme, motivation and objective of the research work. It presents the current scenario of chronic disease treatment in India and emphasizes the importance of attribute selection in the diagnosis of chronic disorders. Section 2 presents relevant research work that has been carried out by several renowned researchers and academicians in this domain. Some widely spread chronic disease dataset details are presented in Section 3. Information on the diabetes, heart disease and breast cancer datasets is depicted in this section. The computational methods and software packages that have been used are discussed. A graphical illustration of a classification model using the filter and wrapper approach is highlighted. The results obtained from implementing filters and wrappers are also described in detail. Section 4 presents the proposal of a new hybrid and integrated Attribute Evaluator method that can be used with an improved clustering-based decision tree for the classification of chronic disease risk disorders. The impact of the proposed attribute selection method is analysed through its implementation. Various performance parameters such as accuracy rate, latency and f-score are used to evaluate the effectiveness of classification using wrapper and filter techniques. Finally, Section 5 concludes the research by summarizing the obtained results and highlighting the most significant findings of the study.
2. Literature Survey
Chronic disease datasets are collected in numerous ways. Medical experts save massive quantities of patient-related data in unstructured samples [13]. Qualitative Research is conducted using various analyses based on statistics and machine learning methods. The objective of such research is to support medical decision-making. Several possible symptoms that are responsible for chronic diseases are identified. Vital factors include age, hypertension [14], total cholesterol [15], diabetes [16], hypertension, inherent heart risk factors [17], obesity, and lack of physical activity [18]. It is critical to have a practical idea of the risk parameters associated with the specific disease to support decision-making. These symptoms are extracted from datasets using attribute selection techniques such wrappers and filters. Different analyses require specific attribute selection approaches. There are numerous studies in the scope of disease diagnosis and symptom analysis using attribute selection. Different filter and wrapper methods are used to rank and select relevant attributes and eliminate less relevant attributes from disease datasets, such as lung cancer, thyroid, diabetes, kidney disease and heart disorders. In this section, the recent and relevant research applying the filter and wrapper approach to disease datasets are discussed and presented. Primarily, the classification accuracy is the criterion used for the detailed survey of different works. This literature survey analyses several relevant studies focusing on the use of filters and wrappers for the selection of relevant symptoms from chronic disease datasets. Special attention has been paid to evaluation metrics, such as accuracy rate, precision and execution time.
L.A. Simons et al. [19], applied various machine learning techniques such as decision table, RBF classifier, Multi-layer perceptron, support vector machine to coronary heart disease dataset and was able to successfully predict a Framingham risk disorder in heart disease for senior citizens in Australia. Surekha S. et al. [20], discussed the impact of wrapper methods on thyroid disease diagnosis. They compared the performance of genetic algorithm and particle swarm optimization algorithm with that of quick reduction and Johnson’s reduction methods of rough set theory. Classifiers like naive Bayes and decision tree were used for thyroid classification. Results demonstrated that evolutionary approaches outperformed rough set theory methods in terms of attribute selection accuracy and minimum attribute subsets. Moreover, Rahul Deo Sah [21], evaluated the performance of vital computational techniques like support vector machine (SVM) and K Nearest neighbours (KNN) in the prediction of liver, cancer and heart disorders from healthcare disease datasets. It has been observed that SVM achieved better classification performance than the KNN algorithm. Li-Yeh Chuang et al. [22], integrated an information gain method for feature ranking with binary PSO for the generation of feature subsets and selection of gene subsets. The evaluation of the performance indicated that the developed approach selected minimal subsets of genes thereby obtaining a good classification accuracy rate. In [23], Sushruta et al., have discussed and applied vital bio-inspired optimization methods to classify various types of tumours. It used a genetic algorithm and a PSO algorithm as wrappers and implemented an MLP classifier for the categorization of tumours.
Félix Fernando González-Navarro [24], discussed an attribute selection approach to be applied to a brain tumour dataset. When evaluated according to a series of performance metrics, it was noted that a quantity of repetitive metabolisms helped in the enhancement of class label separability and its classification accuracy. Anurag Kumar Verma et al. [25], presented a new approach to computational learning for effective prediction of skin diseases. The classification models used were Adaboost, bagging and gradient boosting methods. A new feature selection method that selects 15 most relevant attributes was used to determine an optimal feature subset. The result showed an improvement in the prediction accuracy of dermatological testing data samples. Ibrahim M. El-Hasnony [26], introduced a comparison among different data reduction methods. These data reduction methods were tested against classification algorithms like MLP and KNN algorithms for accuracy. The observation noted that the fuzzy rough feature selection method performed much better than correlation feature selection, gain ratio and principal component analysis methods. B.M. Patil [27], developed a hybrid machine learning model to predict diabetes risk disorders. It used K-Means clustering, followed by the C4.5 algorithm for classification. A very high 92.38% accuracy was obtained with this hybrid model. A predictive model for knee joint disorder detection using VAC signals was proposed by [28]. The a priori algorithm and the genetic algorithm were used as feature evaluators while LS-SVM were the classifiers used for the study. A classification accuracy of 94.31% was the outcome when LS-SVM had been integrated with the a priori algorithm and the genetic approach. Selwyn Piramuthu [29], demonstrated various inter class and probabilistic attribute selection methods based on distance computation. It was used as a pre-processing approach to induce decision trees. The results indicated that the inter class distance parameter generated optimum performance in comparison to probabilistic metrics.
Karegowda AG et al. [30], developed a hybrid classification model using the genetic algorithm as the wrapper method and the back-propagation algorithm as the classifier in detecting the presence of PIMA Indian diabetes. The hybrid model outperformed the back-propagation algorithm in classification. In [31], a cardiac arrhythmia dataset was used with Information Gain and Relief-F as filter methods. SVM and regression were the classifiers used. The performance was evaluated with accuracy, precision and recall metrics. It was observed that the Relief-F filter method combined with the SVM algorithm produced optimum result. Saeid Fallahpour et al. [32], presented a sequential floating forward selection (SFFS) wrapper method to identify an optimal feature set in mental stress dataset. SVM was used for classification and it was observed that the SFFS method combined with the SVM achieved very good accuracy when compared to other algorithms such as the genetic algorithm and information gain. The combination of Principal component analysis (PCA) with the Relief-F method was applied to a breast cancer and diabetes dataset in [33] and evaluated with the KNN algorithm. The classification performance was compared with other filter methods like correlation-based feature selection and information gain. The hybrid combination of PCA and Relief-F methods achieved a higher accuracy than others. Burak Kolukisa et al. [34], used a coronary artery disease dataset and applied an embedded model of gain ratio and chi-square filter approaches to rank attributes and remove the irrelevant features. Then, the attributes are classified with Random Forest, SVM and bagging algorithms. It was noted that the hybrid model produced an impressive result while classification with random forest achieved the highest accuracy with lowest execution time. The authors of [35], presented four different filter approaches such as gain ratio, Relief-F, information gain and chi-square methods on a tumour dataset, to select the most relevant attributes for the SVM algorithm. Classification with SVM and gain ratio gave the best performance in terms of accuracy rate and precision value.
Jianli Ding et al. [36], proposed a new embedded model that integrates information gain and a wrapper approach which used a decision tree classifier on various disease datasets like diabetes, lung disease, hepatitis and heart disease. A classification accuracy of 92.86% was achieved with the reduced attribute set. A hybrid combination of the PCA-LDA model was presented in [37], for the classification of neuron-generative diseases. Statistical attributes were ranked and optimized, and it achieved a credible accuracy rate. The authors in [38], discussed a Sequential Forward Selection (SFS) approach using 10-fold cross validation on a lung disease dataset. It was validated with SVM for classifying and it showed an impressive result with the lowest execution time on an even larger set of data samples. An extensive literature review has been carried out to analyse the existing studies associated with the scope of this research. Different authors have presented numerous attribute selection techniques for disease diagnosis. Similarly, common wrapper methods such as BFS, GSS, Particle swarm optimization and genetic algorithm have also been discussed. The relevant studies on the use of wrappers in the classification of diseases are summarized in Table 1.

Table 1.
An outline of relevant study on wrapper based attribute selection.
Furthermore, numerous filter methods such as One-R, Relief-F, Chi-square, CFS and Gain ratio have been used in different studies. Based on different datasets, appropriate filter techniques have been employed to evaluate the goodness of attribute set. Table 2 highlights some vital research works using filter approach of attribute selection process.
Table 2.
An outline of relevant study on wrapper based attribute selection.
Our extensive literature survey highlights some important research in the field of disease diagnosis using machine learning. Several researchers and academicians used different computational techniques to tackle the complexity of disease datasets. Among the different studies discussed in this section, various filter, wrapper and hybrid attribute selection methods were implemented for dimensionality reduction in chronic disease datasets. Figure 4 summarizes the overall use of these attribute selection methods discussed in our analysis.
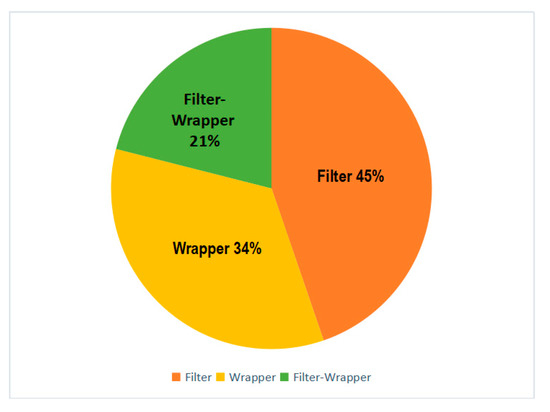
Figure 4.
Distribution graph of the Filter and Wrapper approach in our literature survey.
3. Demonstration of Filter-Wrapper Approach in Evaluating Chronic Disease Datasets
The objective of this study is to determine the impact of the filter and wrapper approach for attribute selection on the classification performance. In this case, the focus was on the classification of disease datasets. This section presents popular chronic disease datasets used in research. System configuration requirements are provided in this section. The implemented computational techniques are presented along with the software packages. Graphs illustrating the impact of filters and wrappers on classification performance are presented. The results obtained upon the implementation of the proposed graphical data flow model are discussed.
Chronic diseases are a critical worldwide public health challenge [76]. Diabetes, hepatitis, liver disorders, lung cancer, breast cancer and heart disease are the most common chronic diseases [77]. Therefore, there is a significant number of patients suffering from these chronic diseases. Consequently, it is crucial to have a faster mechanism for effective patient support. In this study, three chronic disease datasets are used. These include diabetes, breast cancer and heart disease datasets. These are the most widely observed chronic diseases [78]. The datasets have been collected, extracted and aggregated from the UCI repository, the University of California. The PIMA Indian diabetes dataset utilized in our research constitutes a total of 8 distinct attributes along with 768 instances [79], as shown in Table 3; Table 4 depicts the breast cancer data used in this study. There was a total of 10 distinct attributes with 286 unique records [79].
Table 3.
PIMA Indian dataset details [79].
Table 4.
Breast Cancer dataset details [79].
The heart disease dataset, as shown in Table 5, is implemented in this analysis. It consists of 270 instances with two different class labels to detect the presence and absence of heart disease in patients [79]. The data record contains 13 unique symptom attributes.
Table 5.
Heart Disease dataset details [79].
Our experiment has been conducted with 10-fold cross-validation using the attribute selection function of the Waikato Environment for Knowledge Analysis (WEKA) tool [80]. This software tool supports distinct functionalities like data visualization, data pre-processing, data classification, cluster analysis and pattern mining. The dataset which has been input in the WEKA software is in Attribute-Relation File Format (.arff) format [81,82]. A 64-bit Windows Operating system with a Quad-core processor and a minimum of 8 GB RAM is a key requirement. Moreover, Java 1.7 version or higher is required to install WEKA software. Several algorithms and methods have been used in this analysis. The algorithms used in the study have been made available in the WEKA software in the form of different packages and libraries. These packages are shown in Table 6 to give a brief introduction to the computational techniques and methods used in the study. Table 7 highlights the important packages of the WEKA software used in this analysis.
Table 6.
Computational Methods used in the study.
Table 7.
Algorithms and their packages in WEKA tool.
Figure 5 demonstrates the general workflow model of the framework proposed in this study. Chronic disease datasets are the input file to which pre-processing is applied to detect and eliminate irrelevant features. Moreover, the missing values in datasets or occurrence of repetitive values are handled through data pre-processing. Missing and repetitive values are substituted with the mean value from that column. Finally, the data is ready to be processed using the attribute selection tool.
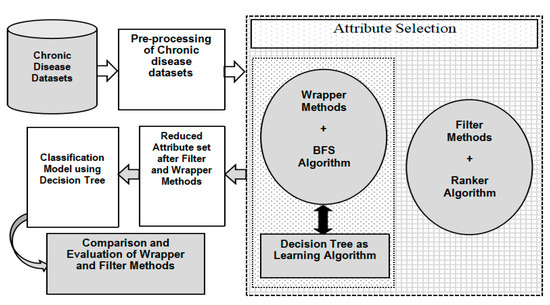
Figure 5.
The Work-flow Model of Wrapper-Filter Methodology.
In this study the procedure is partitioned into two different stages. The first part is the attribute evaluator through which attribute subsets are evaluated. The second part includes the search scheme that enables the attributes to search the space of possible subsets and find the most relevant attribute subset. The attribute evaluator section is further partitioned into two different steps: the filter approach method and the wrapper approach. On the one hand, in the filter approach, attribute selection does not depend on classification algorithms. The attributes are selected on the basis of their ranking in statistical tests. This study includes three popular filter methods, namely, CFS, IG and Chi-square methods. These filter methods are used to select relevant attributes from pre-processed chronic disease datasets. Then, the attributes are ranked by the Ranker algorithm in WEKA. The Ranker method is responsible for generating a ranked attribute list for attribute evaluators. The output of this method is the reduced and optimized attribute set which is used for classification using the Decision Tree algorithm.
The second part of the attribute evaluator is the wrapper approach where a wrapper method in combination with a suitable search algorithm generates an optimal set of attributes. In wrapper methods, an attribute subset is employed in the training of a system prototype that will use those attributes. Once the predecessor model has obtained a result, further decisions are made regarding the inclusion or exclusion of attributes from the candidate subset. BFS, LFS and GSS are the three popular wrapper methods used in this analysis. These methods have been combined with WrapperSubsetEval which acts as a predefined search algorithm in WEKA. The combination of these three components generates a reduced attribute set. Once the reduced attribute set is generated through the application of the filter and wrapper approach, the next phase is the classification process where the reduced chronic disease datasets are subjected to classification using the Decision Tree algorithm. The Decision Tree algorithm has been tested on diabetes, breast cancer, and heart disease datasets.
The authors have analyzed the impact of the filter wrapper approach on the attribute selection process and its impact on the efficiency of chronic disease classification. Three filter methods have been used in this study, including the Information gain method, the Correlation feature selection method and the Chi-square method. The ranker algorithm was the predefined search algorithm in this approach. In the case of the wrapper approach, WrapperSubsetEval was the used attribute evaluator while the best first search, the linear forward selection method and the greedy step wise search method were used as search algorithms. This section presents the results obtained after implementing the proposed model in the WEKA software. This section is divided into two subsections. Firstly, the attribute significance graph has been presented to highlight the importance of individual symptoms upon the application of both filters and wrappers. The attributes are ranked on the basis of their relevance and priority. On the basis of the importance of the symptoms, the attribute significance graphs have been developed to identify the relevant and irrelevant symptoms in the dataset. Every attribute is assigned a score level out of 10 on the attribute significance graph. The X-axis represents the attributes of a chronic disease dataset while the Y-axis denotes the score level of the individual attributes that have been obtained after the application of an attribute evaluator. According to the results shown in the graphs, the less relevant symptoms have been eliminated from the dataset. The obtained results are discussed throughout this section.
3.1. Comparison of Filter Approach
This subsection highlights the importance of the filter approach for chronic disease datasets. The filter approach was used to generate a reduced attribute set for different chronic disease datasets, where the attributes were the relevant symptoms. 270 heart disease dataset instances have been collected with 13 distinct attributes initially present. These samples were subjected to the filter approach. Individual attribute score can be seen from the attribute significance graph and as seen ‘ca’ and ‘Exang’ are the least relevant attributes according to the filter approach. Figure 6 highlights the attribute significance analysis concerning heart disease data. Figure 7 depicts the attribute significance graph of the Diabetes dataset that has a total 768 instances with 8 attributes. The attribute ‘skin’ generated a comparatively lower score of 0.3 with filter approach. Similarly, the filter approach was evaluated on a breast cancer dataset. The attribute significance graph is presented below. The significance score of the attribute ‘irradiat’ was the lowest, with only 0.3, in comparison to other attributes. It is highlighted in Figure 8.
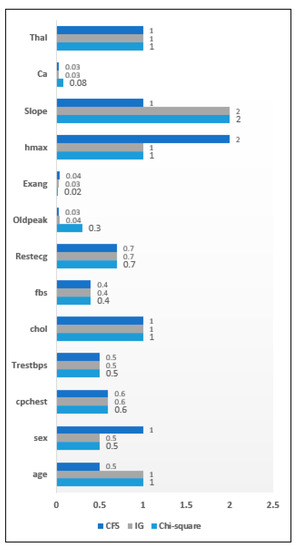
Figure 6.
Attribute Significance Graph for the Heart disease dataset with Filters.
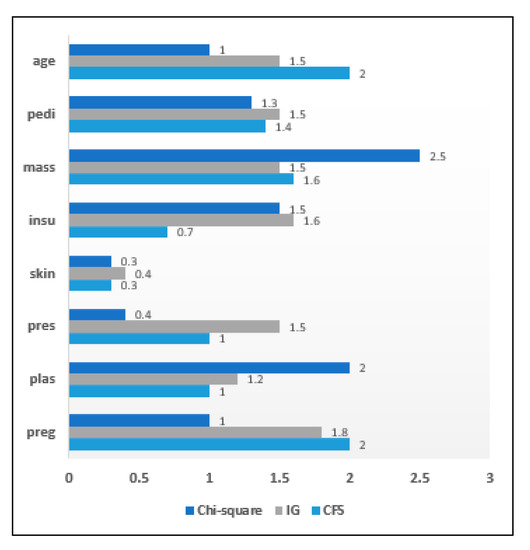
Figure 7.
Attribute Significance Graph for the Diabetes dataset with Filters.
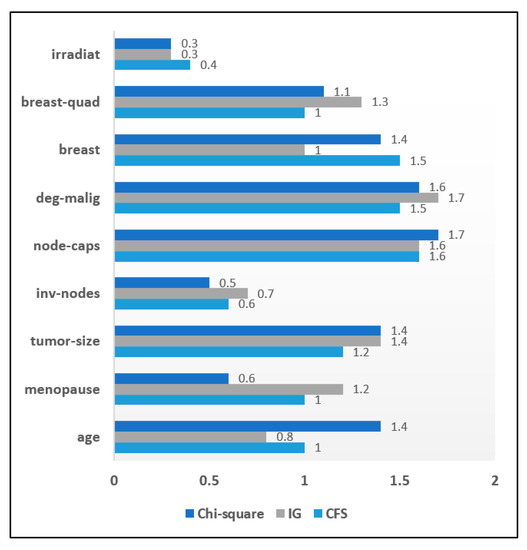
Figure 8.
Attribute Significance Graph for the Breast Cancer dataset with Filters.
An attribute significance analysis was performed on all three datasets based on ranking of attributes. The low ranked attributes are given less priority. The set of relevant attributes obtained by the CFS method from the heart disease dataset was 11 while in the IG method and the chi-square method it has been reduced to 10 attributes. When filter methods were applied to diabetes data, it was seen that both the CFS and the IG methods included 7 attributes in the optimized attribute set on the basis of a priority ranking. The chi-square method included 6 attributes in the resulting set. It is observed that the CFS and chi-square methods included 7 attributes in the reduced sets of attributes while the IG filter method of evaluation included 8 attributes in the resulting attribute set. When filter methods were applied to the breast cancer dataset, it was found that 2 attributes had less importance for both the CFS and Chi-square methods, while only 1 attribute was irrelevant for the IG method. Table 8 shows an overall analysis of the impact of filter methods on disease datasets and the sets of selected attributes.
Table 8.
Impact of filter methods on disease datasets.
After determining the relevant score level of all attributes of the chronic disease datasets, the reduced and optimized attribute set is classified using the Decision Tree algorithm. The classification process has been conducted to detect the presence or absence of the chronic disorder in patients. The filter methods have been applied to classify the chronic disease datasets using the Decision Tree classifier; the obtained results are interesting. It was observed that the CFS method outperformed other filter methods concerning the accuracy rate and execution time. In this work, accuracy rate is selected as the heuristic function to rank attributes. CFS method performed better than others as it evaluates the attribute subsets which exhibit strong association with class label but least dependence on each other. Thus, weekly correlated attributes are less significant and thus dropped. With heart disease dataset, the CFS method achieved an accuracy of 93.8%. Furthermore, this method produces an 89.5% accuracy rate and only a 1.02 s delay in execution with the diabetes dataset. The CFS method also provided 96.8% accuracy and a minimum execution time delay of only 1.01 s when classified with breast cancer data. Table 9 presents a tabular view of classification accuracy and latency analysis using filter methods.
Table 9.
Analysis of classification accuracy and latency with filter methods on disease datasets.
3.2. Comparison of the Wrapper Approach
The result of the application of the wrapper approach to the chronic disease datasets is summarized in this section. The attribute significance graph was developed for all three chronic datasets. The evaluation of wrapper methods was carried out on the heart disease data instances. The selected attribute list is shown in Figure 9 in the form of an attribute significance graph. In total 3 attributes which include ‘Ca’, ‘Exang’, ‘Oldpeak’ were found to be least relevant. The attribute ‘skin’ was recorded with a significance score of 0.3 in the diabetes dataset and hence eliminated. Figure 10 shows an attribute significance graph for diabetes data. The wrapper approach was evaluated on the breast cancer dataset and its attribute significance graph is depicted in Figure 11. Every method achieved a score level of around 0.3, ‘irradiat’ has been found to be the least relevant attribute. It can be clearly seen in the graphical analysis that three attributes were relatively less relevant than the others in case of the heart disease dataset. In the diabetes dataset, only one attribute was less important with both diabetes and breast cancer dataset samples.
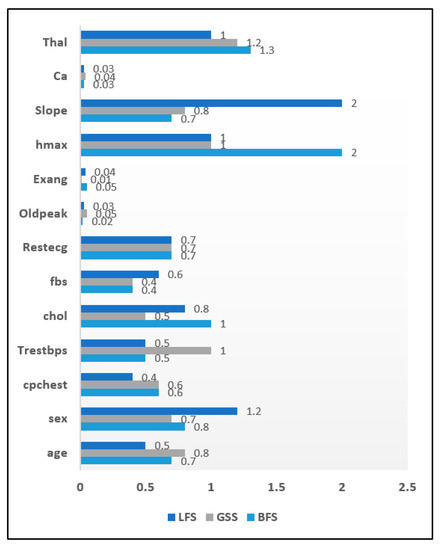
Figure 9.
Attribute Significance Graph for the Heart disease dataset with Wrappers.
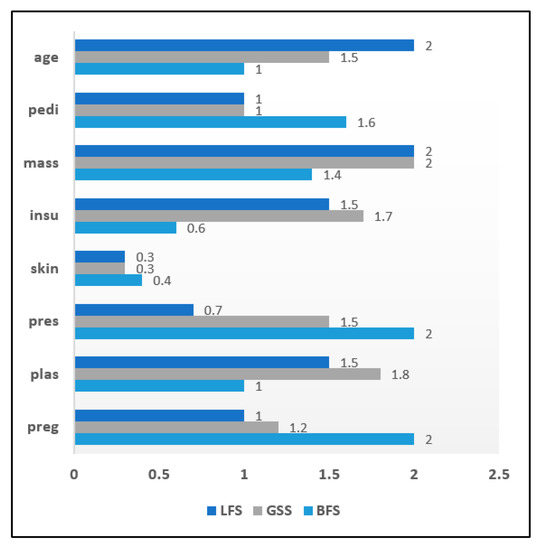
Figure 10.
Attribute Significance Graph for the Diabetes dataset with Wrappers.
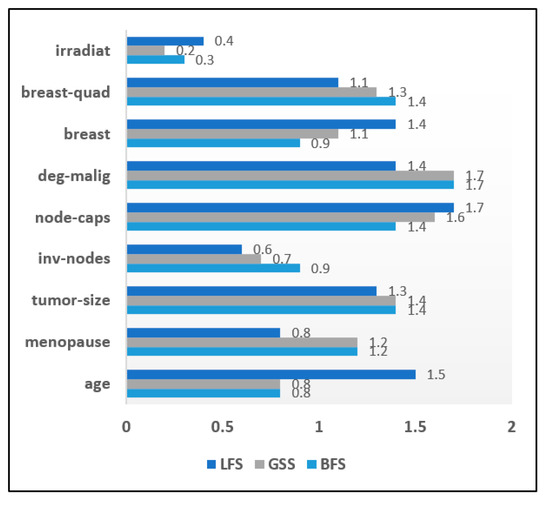
Figure 11.
Attribute Significance Graph for the Breast cancer dataset with Wrappers.
The reduced sets of attributes obtained by the BFS, LFS and GSS methods were identical, which constitutes 10 attributes while eliminating 03 irrelevant attributes. Wrapper methods were evaluated with the diabetes dataset to get an optimized attribute set. It has been observed that among eight attributes, only one attribute was identified as irrelevant. Consequently, it was eliminated from the resulting set in all three wrapper methods. The BFS and LFS methods obtained reduced sets of attributes for breast cancer data that contained eight attributes in total. The GSS method included only seven attributes in its reduced set. Table 10 depicts the tabular analysis of the reduced attribute sets after using the wrapper approach.
Table 10.
The impact of the wrapper methods on disease datasets.
The reduced attribute set is further classified using the decision tree algorithm. In heart disease prediction, it was observed that the best first search method generates an optimal accuracy rate of 94.7%. The greedy step wise search achieves a 94.2% accuracy and linear forward selection method lies in between these two methods with an accuracy of 92.6%. When the wrapper approach was applied to diabetes datasets, an accuracy of 95.6% was achieved with the greedy step wise search and the overall time delay was 1.97 s. Linear forward selection search had an accuracy of 90.6% with a latency delay of 1.56 s. The best first search method was relatively faster than the linear forward selection search method with only a 1.56 s execution delay, thereby achieving a 90.6% accuracy rate. In case of breast cancer classification, the greedy step wise method shows an impressive accuracy rate of 96.8% while the best first search method produces a lower accuracy of 92.8%. The latency delay with the greedy step wise search is also much lower, with 1.08 s, in comparison to the other two wrapper methods. In general, it was noted that BFS method offered better result than others. Reason for this good performance by BFS method was due to the fact that it is able to switch among different paths to solution with ease. It is able to find a good solution without figuring out all nodes and not being trapped at dead ends. Moreover, the time complexity of BFS method is quite less compared to others. The results are summarized in Table 11.
Table 11.
An analysis of the classification accuracy and latency of the wrapper methods on disease datasets.
The experimental evaluation was successfully conducted on three chronic disease datasets. Both filter and wrapper methods for attribute selection were implemented in the analysis. The results show that in wrapper approach, interaction with the classifier is high. However, it is more computationally intensive. The filter approach is independent of the classification algorithm. Consequently, it requires less computational cost. Furthermore, the classification accuracy rate of the wrapper approach was better than that of the filter approach.
However, the latency rate is minimal with the filter approach. Table 10 summarizes the differentiating elements between both wrapper and filter approaches for attribute selection. It is worth noting that CFS method emerged as the best filter method while BFS clearly outperformed other wrapper methods.
4. A Hybrid Classification Model Using 3-Step Attribute Evaluator and Improved Decision Tree to Enhance Classification Performance of Chronic Disease Datasets
Today, the clinical sector faces many obstacles in analyzing heaps of the medical data of different patients. The detailed processing of such medical records is a big challenge due to the presence of unstructured and heterogeneous data in the records. There is an urgent need for the evolution of the clinical industry so as to address the issue of data processing and management. Identifying an appropriate attribute set from raw and unstructured data records is the main challenge. Any good machine learning model depends on the attributes that it is fed as input to the system. If the selected attribute set is more relevant, then the subsequent classification and prediction task will also be more efficient and accurate. Identifying the characteristics of attributes to discover their relevance in a dataset is a very critical issue. The majority of existing attribute selection methods overlook the structure of attributes. Recently some studies applied clustering methods to attribute sets, to enhance the overall performance of a computational model and demonstrate it is more effective than conventional attribute selection approaches. Krier et al. [83], successfully developed a hybrid model using hierarchical clustering on spectral features and then selecting an optimal attribute set by means of the mutual information method. Van Dijck and Van Hulle [84], worked on the same model as developed in [83], with the exception that the former model forced each cluster to select successive attributes. Song et al. [85], presented a Fast clustering-based attribute reduction method (FAST) which generated a more useful and independent set of attributes that enhanced the performance of machine learning algorithms. Xu et al. [86], discussed the importance of the clustering approach in simplifying the computation in a machine learning task.
Moreover, recent studies have concluded that the structure of attributes can be effectively interpreted, and noisy variables can be removed from data records by means of the clustering approach [87,88]. In the previous section, it has been observed that the CFS filter method and the BFS wrapper method generated most optimal results. The proposed attribute evaluator makes use of BFS and CFS method for generating reduced attribute set.
In this era of advanced technology, users face the hurdle of datasets especially if they comprise of large number of attributes and instances. Though decision tree is quite efficient in classification tasks, still it is susceptible to noisy datasets. Certain datasets are tedious to handle since sometime decision trees is dependent on various metrics such as topological configuration of decision tree itself and the type of dataset used. Cluster analysis is widely applied in various domains but is rarely been used with decision tree. In this proposed work of chronic disease diagnosis, clustering approach is integrated with decision tree classifier to enhance the accuracy of classification. A suitable clustering technique like K-Means algorithm can be used to filter the data samples of training set which can help in reducing noise from decision tree thereby elevating the classification accuracy rate.
4.1. Description of the Proposed Hybrid Classification Model
In this section, a new hybrid classification model for chronic disease datasets is presented. Figure 12 illustrates the proposed machine learning model using the integrated 3-step attribute evaluator method and an improved decision tree classifier. A chronic disease dataset collected from a suitable and reliable source is the input to the model. Many times, these raw datasets are in unstructured form and thus it needs to be filtered and pre-processed to get it in proper format. The pre-processing of chronic disease data samples is the next step. The data records are scanned and the presence of unintended delimiters, commas or any other symbols is identified and removed. Inconsistencies like missing values or repetitive instances are detected and are replaced with the mean value in the corresponding column. Once the dataset is made free from any ambiguity and thoroughly pre-processed, it is pushed into the skewed data minimizer. The pre-processed data samples are usually unbalanced and uneven. Due to this uneven distribution of data instances the data visualization does not follow a normal distribution thereby its classification performance gets hampered. In this model this skewed data is effectively handled by using box cox transformation. It is a transformation that transforms a random dependent features into normal forms. It enables the predictors to execute the datasets with a wide range of use cases. The core part of box cox transformation is an exponential value which ranges in between −5 to 5. values within the specified range are taken into consideration and its optimum value is chosen. The optimum value denotes the value that creates the best normal distribution curve. It can be represented as in Equation (1).
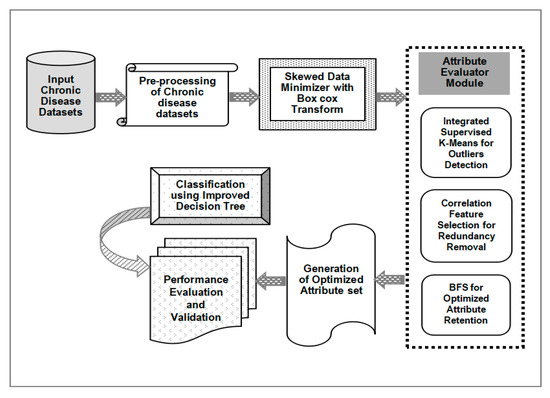
Figure 12.
Illustration of the Hybrid Classification Model based on 3-Step Attribute Evaluator.
The normalized data obtained is made input to Attribute Evaluator Module. It takes advantage of a clustering approach, which helps it obtain a more accurate selection of attributes form a chronic disease dataset. This ‘Attribute Evaluator’ module integrates K-Means clustering with the CFS method used as a filter method and the BFS method as a wrapper. Clustering with K-Means is the first step in this module. The attribute set is the input and multiple clusters are formed on the basis of similarity among attributes. K-Means clustering selects ‘K’ attributes as its cluster centers from the initial disease dataset. On the basis of the similarity measure, distances between the cluster mean and the attributes are computed. Updated mean value is calculated for every cluster. The most similar attribute is allotted to the corresponding cluster. Euclidean distance is used in our proposed model to determine the attributes that exhibit similarity, as shown in Equation (2). The squared distance between two vectors p = (p1, p2) and q = (q1, q2) is denoted as the sum of squared differences in their coordinates in Equation (3).
A new variation of K-Means algorithm referred to as ‘Integrated Supervised K-Means’ is presented and implemented. The main idea behind this new variant is to perform logistic regression in every iteration. Since regression approach is combined with unsupervised clustering hence it is named as Integrated Supervised K-Means. Regression generates a cluster member probability and it is used to eliminate appropriate samples from participating in finding cluster mean process. It is useful in dealing with real time datasets which comprises of heterogeneous instances with overlapping samples. Here the K-Means algorithm initializes with K initial cluster means. Then the process is iterated thereby allotting samples to its nearest cluster and the cluster means is recomputed. Basic notations used in the algorithm are listed in Table 12.
Table 12.
Parameters used in Integrated Supervised K-Means.
Squared Euclidean distance to the mean is calculated for every sample observation. Every sample is assigned to the nearest cluster. It is followed by solving logistic regression equations represented in Equations (4)–(7).
Here the predicted value of regression is used to predict cluster member probability for every sample in all clusters. This probability value is reordered in descending order to determine the proportion of the two highest probabilities. Cluster means is recomputed, and cumulative summation of total distance is determined. Variation in cumulative sum of square distances from predecessor round is measured and compared with the converging factor.
After cluster formation, the left-over attributes which do not belong to any cluster are identified as outliers and are eliminated. Then, the Correlation Feature Selection (CFS) method is applied. It computes correlation among a set of attributes by ranking all attributes in descending order. Correlation among attributes is computed using Pearson’s linear correlation coefficient, as in Equation (8). A has a values and class labels R with r values where A and R are assumed to be random variables.
φ(A,R) is regarded as 0 when there is no correlation or as 1 when A and R exhibit linear dependency. An error function is used to estimate the correlation between the two attributes as shown in Equation (9).
The pseudo code highlighting integrated supervised k-means is presented in Figure 13.
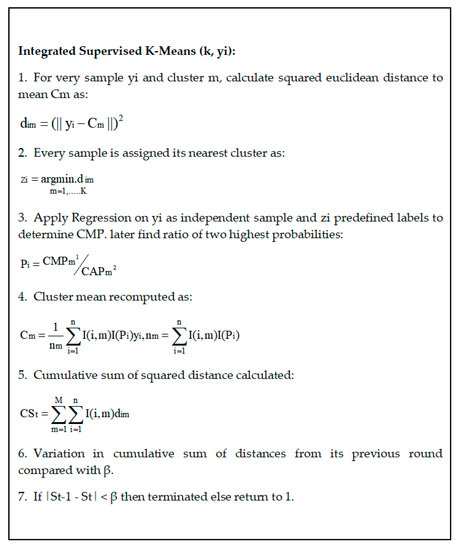
Figure 13.
Pseudo code of Integrated Supervised K-Means.
The list of attributes ranked in terms of decreasing order of P (A ≈ R) serves as an attribute ranking order. Highly correlated and redundant attributes have been detected and eliminated. Furthermore, the non-redundant attributes have been input to the BFS method which explored all attributes and found a reduced optimal attribute subset. The output of the ‘Attribute Evaluator’ led to the generation of a better and reduced attribute set which constitutes only the relevant attributes that can be considered in the diagnosis process. Subsequently, the classification has been performed using an improved decision tree on the attribute set to determine the risk level of a person being affected by a chronic disease. Finally, performance of the developed model has been assessed according to vital performance parameters, determining the effectiveness of the classification.
A new improved decision tree-based model is developed and implemented. It combines both clustering and classification techniques. In this work a novel hybrid model is proposed to improve accuracy of decision tree using clustering approach. This integrated system is formed by a clustering algorithm, a decision tree and a parameter generation module to identify and select suitable and best parameters for the clustering algorithm. These three modules working together are capable to increase the accuracy of the solutions. Clustering acts both as a data instance selection method as well as for classification at front end. As a result, data instances which are not classified by clustering are input to the decision tree for further classification. This approach is helpful while dealing with complex datasets with noisy environments.
The proposed classification model makes use of the cluster analysis in decision tree classifier as presented in Figure 14. The hybrid model presented here comprises of three units which include the following.
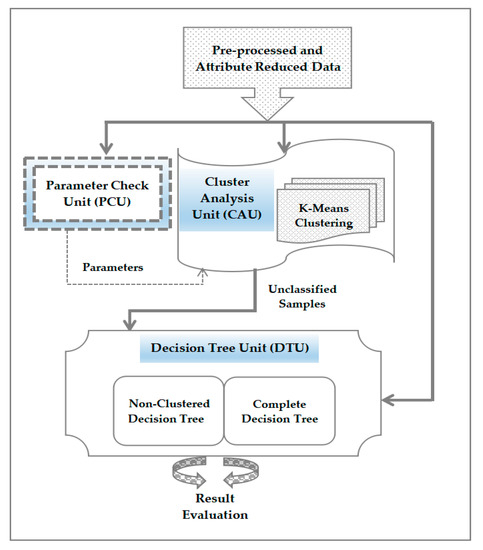
Figure 14.
Functioning workflow of Improved decision Tree Model.
- ❖
- Cluster Analysis Unit (CAU): It is used to develop a clustering method with K-Means algorithm.
- ❖
- Decision Tree Unit (DTU): It is to create two separate decision tree modules which include complete decision tree and non-clustered decision tree. Complete decision tree utilizes the entire dataset while the non-clustered decision tree operates with only the data samples which are not classified to any cluster.
- ❖
- Parameter Check Unit (PCU): It functions as an automated parameter generator which provides relevant parameters for cluster analysis unit without the need to develop the complete model. Dataset is the input too this unit and an appropriate parameter set for cluster analysis unit is the output produced.
4.1.1. Functioning of Cluster Analysis Unit (CAU)
Training data samples are used to build a cluster-based model with removal of the class label from dataset. Every cluster is verified as to determine if it constitutes a larger instances of a class label. It is done by counting the data instances for every class which is allotted to a cluster. If it is beyond the threshold value, then it is inferred that the specific cluster is sorted and classified. A particular cluster is tagged as non-classified if no class is exceeding the threshold value. So, an instance is classified by passing it through the CAU where that instance is assigned a cluster using K-Means algorithm. Then that instance is tagged as classified or non-classified based on the value in the table built during model creation. Accordingly, the instance is categorized with the same class label of cluster else it is identified as unclassified instance. If it is found to be unclassified then it is left out without any class label.
4.1.2. Functioning of Decision Tree Unit (DTU)
DTU is responsible to build the decision tree classifier. Here two distinct models are built which is being used to function four classifiers. The first model is called complete decision tree which is used to train the complete training set of data samples. The second model called non-clustered decision tree is applicable on the training samples which failed to be classified by CAU. Both decision tree models are subsequently validated with both testing dataset as well as the unclassified data samples of CAU. Thus, the four classifiers created in the process are listed here.
- ➢
- Decision tree classifier which forms the base of comparative analysis.
- ➢
- Decision tree which functions on only unclassified data of CAU but is used to categorize all data samples.
- ➢
- Decision tree which functions on all data samples but used to categorize only unclassified CAU data.
- ➢
- Decision tree which functions on unclassified CAU data samples and is also used to classify unclassified data from CAU.
Among these four models used in the research work, first model is the usual decision tree classifier. Second model is mainly utilized to minimize the number of data samples which are used for training the classifier. It is the third and fourth model which are the newly developed ones of our study which intermix clustering with classification to provide decision tree optimum classification capability. Use of clustering algorithm in CAU to categorize data samples and assign them into classified and unclassified data is highlighted in Figure 15.
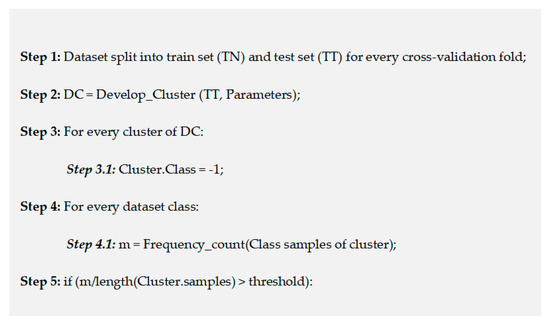
Figure 15.
Pseudo code for Clustering process in Improved decision tree model.
4.1.3. Functioning of Parameter Check Unit (PCU)
This unit is responsible for validating the parameters which are significant and adequate for a dataset without executing the entire decision tree classifier. A simple yet effective heuristic is used on the training set result which takes into account correctly and incorrectly classified data to achieve the task. PCU utilizes a parameter list like number of clusters created and employs K-Means algorithm. Then a clustering model is developed with this data values for every testing values. This unit then computes the classified clusters for every model built. It is followed by evaluation of training data for all resultant models is performed. Eventually a heuristic is used with the results obtained. Parameters having maximum heuristic value is chosen as a potential candidate to be used for classification. This approach generates parameters for the clustering process and the threshold determined as the deserving candidate.
Heuristic value (h) is calculated by considering the number of correctly classified samples (SC), incorrectly classified samples (SIC), total data samples (S), parameter (P) and cluster count (MC) as denoted in Equation (10).
Prime purpose of using this heuristic is to enhance the correctly classified data and at the same time to reduce the error while classification. The best parameter generation procedure is depicted in Figure 16.
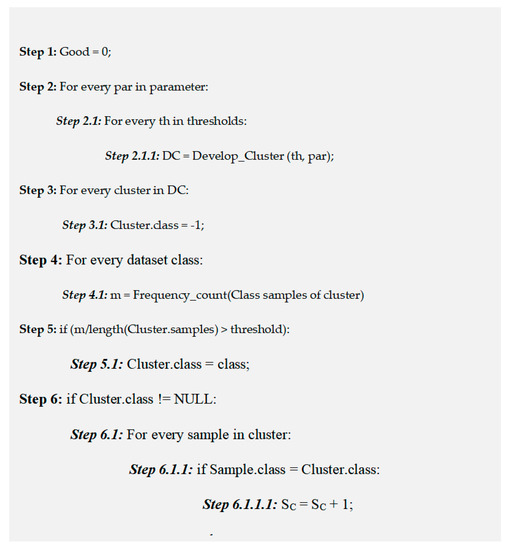
Figure 16.
Pseudo code for parameter adjustment and generation in Improved decision tree model.
4.2. Results and Analysis
The effectiveness of a machine learning model is determined in terms of its uniformity and scalability. Various performance metrics are available to figure out the efficiency of any newly developed predictive model. In this subsection, our proposed model using ‘Attribute Evaluator’ was evaluated on several chronic disease datasets and its performance has been assessed according to a series of vital performance parameters. The obtained Results are discussed in detail further on in this subsection.
The proposed ‘Attribute Evaluator’ comprising K-Means clustering, the CFS method and the BFS method, was used to generate an optimized attribute subset. It was used as a dimension reduction approach on 15 disease datasets collected from the UCI data repository. It was further compared with the CFS filter method and the BFS wrapper method in selecting the reduced attribute set. The result is shown in the table. The difference in performance is quite evident, especially on datasets with a higher number of attributes. The proposed model (K-Means, CFS and BFS) performs very well in generating a reduced attribute set for almost all disease dataset. With a relatively lower attribute set, the proposed model performs marginally better. The Arrhythmia data samples initially contained 279 attributes, the proposed model removed outliers and redundancies, reducing the number of attributes to 262. However, when optimizing diabetes data which contained only 8 attributes, the distinction was not as evident, as the attribute set was reduced to 6. This set is identical to the reduced set using wrapper and filter approach taken alone. Hence, it can be inferred that the dimensionality reduction of the proposed ‘Attribute Evaluator’ is optimal and beneficial when the analysed disease data samples are large and have a relatively higher number of attributes. On the contrary, when smaller datasets are evaluated the model’s performance is equivalent to the wrapper or filter approach. Table 13 gives a summary of the results.
Table 13.
The Impact of Proposed Attribute Evaluator Method on disease datasets.
The proposed ‘Attribute Evaluator’ approach is combined with decision tree for the classification of datasets. Its performance is assessed according to performance indices, such as accuracy rate, specificity, sensitivity and F-Score. Figure 17 shows the evaluation result. It has been observed that classification with decision tree yielded a very impressive result and the performance was very consistent on almost all disease datasets. The classification of cervical cancer data generated the highest accuracy of 98.4% while the lowest accuracy was 94.8% with the Parkinson disease dataset.
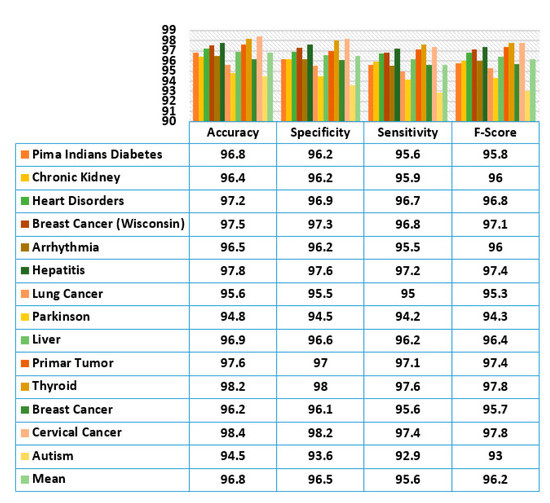
Figure 17.
Evaluation of the Classification Performance of the Proposed Attribute Evaluator Method.
A maximum specificity value of 98.2% was achieved on cervical cancer data and a minimum specificity value of 93.6% was achieved on autism disorder dataset. Similarly, a very high sensitivity rate of 97.6% was achieved on thyroid data and the lowest sensitivity of 92.9% on autism data. Harmonic mean of specificity and sensitivity called the F-Score metric was also evaluated. Both thyroid and cervical cancer recorded the highest F-Score value of 97.8% while autism gave a comparatively low value of 93%. In general, the generated mean values for accuracy, specificity, sensitivity and f-score were 96.8%, 96.5%, 95.6% and 96.2%, respectively using the proposed attribute evaluator approach.
The classification accuracy of the decision tree with proposed attribute optimization model was evaluated with some popular filter approaches to determine the preciseness of the generated attribute set. The result is illustrated in Figure 18. CFS, IG and Chi-square methods were used as filter methods. Highly consistent performance was observed with the proposed model on almost all disease datasets with the exception of lung cancer and Parkinson disease. While the accuracy of the CFS filter method for lung cancer and Parkinson was noted to be 95.7% and 95.2%, slightly lower values of 95.6% and 94.8% were obtained using the proposed model. Overall, the proposed classification model outperformed other filter approaches.
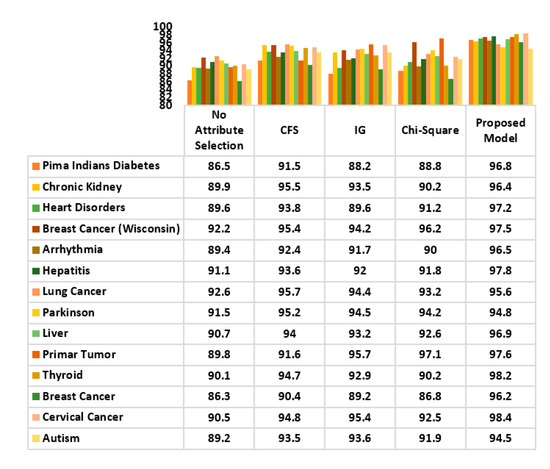
Figure 18.
Comparative Study of the Classification Accuracy of the Proposed Attribute Evaluator Method and Other Filter Methods.
A comparative analysis of the accuracy achieved by the proposed model and the wrapper approach has also been carried out, using decision tree as classifier. The wrapper methods considered in the comparison were: BFS, LFS and GSS. The result is analysed in Figure 19. A highly optimal classification performance was recorded. Except the classification of breast cancer data, other disease datasets generated a very high accuracy rate has been achieved by compared to its wrapper approaches. Only in breast cancer data, the BFS method 96.8% of accuracy while the proposed model slightly lagged behind with 96.2%. Overall, the use of the proposed model for classification has yielded optimal performance; superior to that of wrappers.
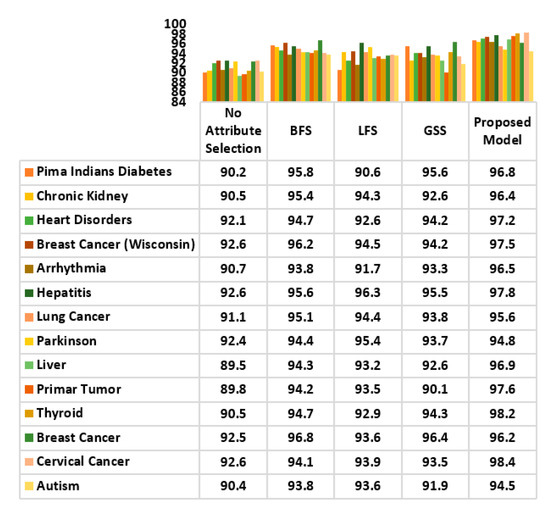
Figure 19.
Comparative Study of the Classification Accuracy of the Proposed Attribute Evaluator Method and Other Wrapper Methods.
The proposed attribute evaluator approach was further compared with the Minimum Redundancy Maximum Relevance (MRMR) method which is a widely popular attribute selection technique being applied to several datasets in different domains [89]. It is used as a heuristic method and is applicable for both discrete as well as continuous data samples. It computes the most promising attributes by measuring the relevance and redundant attributes. The MRMR method was evaluated against the proposed attribute evaluator using decision tree as classifier. 14 chronic disease datasets as mentioned in Table 13 were used for analysis. MRMR method gave a very good performance but the proposed attribute evaluation approach generated a better outcome with almost all datasets. A mean accuracy rate of 96.7% was recorded with the proposed approach while a slightly less accuracy of 94.5% was observed with MRMR method as observed in Figure 20.
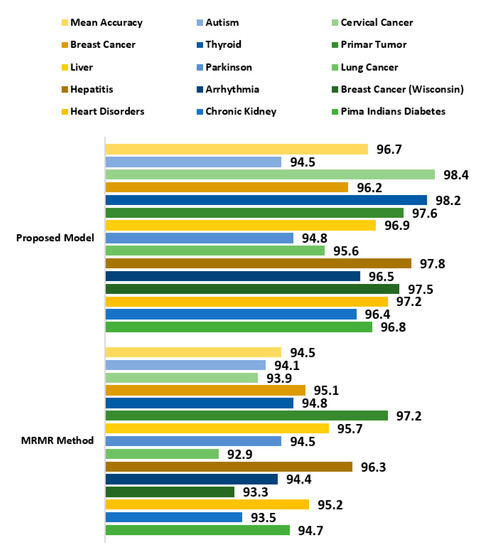
Figure 20.
Comparative Study of the Classification Accuracy of the Proposed Attribute Evaluator Method and MRMR method.
The data from the datasets is partitioned before being used, using a 10% of the data for adjusting the parameter, and the rest for a 10-fold cross-validation [90], which implies that each fold uses 81% of the total data of the data set for training and 9% for testing. The chronic disease datasets under use is divided before being implemented. Among the data samples, 15% instances were utilized to adjust and generate best parameters. Remaining 85% data were used for cross-validation where 75% data samples were used as training set while the rest 10% instances were used for testing.
Classification accuracy analysis was done between the newly developed hybrid classifier model and decision tree alone. A maximum 98.4% accuracy was generated using cervical cancer dataset while the mean accuracy recorded was 96.8% with the hybrid classification model [91,92]. Decision tree too gave a good accuracy performance but slightly less than the hybrid model as seen in Figure 21.
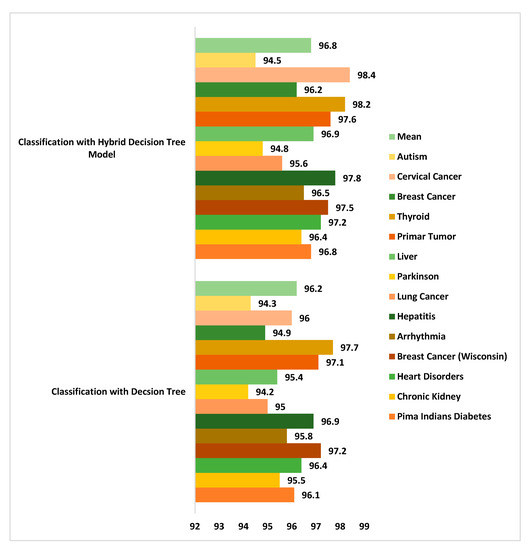
Figure 21.
Comparison of accuracy rate between the Proposed Hybrid Decision Tree and the classical decision tree method on chronic disease datasets.
The performance of the proposed hybrid clustering based decision tree classification model was compared with the general decision tree classifier with respect to the model prone to error in Figure 22. It was observed that a least error rate generated was 0.116 with diabetes dataset when used with the new hybrid classification model. An error rate of 1.84 was noted with breast cancer data samples. Similarly, the hybrid decision tree model generated less error rate when compared to the decision tree classifier taken alone. The mean error rate recorded with the new improved hybrid model was just 0.642 as compared to 1.73 with decision tree classifier.
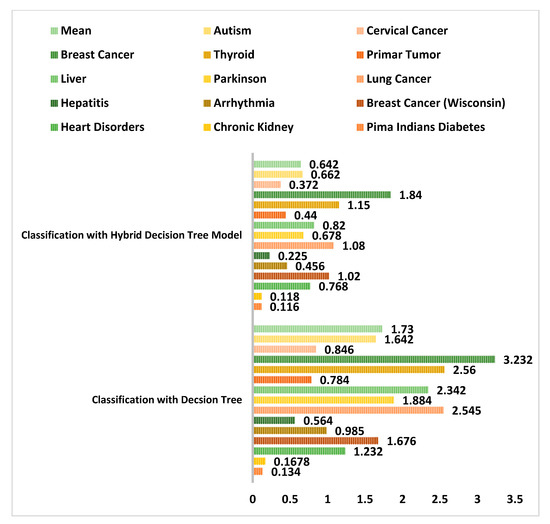
Figure 22.
Comparison of error rate between the Proposed Hybrid Decision Tree and the classical decision tree method on chronic disease datasets.
Thus, in this section, a new integrated attribute evaluator approach using an enhanced K-Means clustering, the CFS filter method and the BFS wrapper method has been presented and evaluated on 14 different chronic disease datasets. The impact of the proposed model was clearly visible on datasets with higher numbers of attributes. As the number of attributes increased, the relevance of attributes was more evident, and outliers were eliminated. Various performance indicators have been used to determine its classification performance. Impressive maximum metric values were recorded. 96.7%, 96.5%, 95.6% and 96.2% were the mean percentages for accuracy, specificity, sensitivity and f-score, respectively. Performance of improved decision tree model was also compared with decision tree classifier taken alone and it was noted that the improved decision tree performed much better in terms of accuracy rate and error rate. It is due to the fact that clustering approach in improved decision tree classifies majority of data samples. Only the left-over unclassified instances were fed into decision tree unit for further classification. Hence it is more effective and less prone to error.
5. Conclusions and Future Scope
This paper has presented a comparative analysis of wrapper and filter selection while determining its impact on prediction performance in different chronic disease datasets. The Decision Tree algorithm has been used as a classifier for this analysis and is implemented through the WEKA tool. The overall research analysis can be bifurcated into two parts. In the first part, a comparative analysis of wrappers and filters has been carried out and its impact on three chronic disease datasets was analysed. Heart disease, diabetes and breast cancer data were contained in the datasets. CFS, IG and Chi-Square were the filter methods used while BFS, LFS and GSS were the wrapper methods used in the research. An optimum accuracy of 93.8%, 89.5% and 96.8% was recorded for heart disease, diabetes and breast cancer, respectively, using the CFS method. Latency delays of 1.08 s, 1.02 s and 1.01 s were observed using the same method on the respective datasets. Among wrapper methods, BFS gave the best classification performance. Maximum accuracy of 94.7%, 95.8% and 96.8% were achieved for heart disease, diabetes and breast cancer, respectively. Latency delays of 1.42 s, 1.44 s and 132 s were observed using the same method on the respective datasets. Moreover, it was noted that though wrappers generated maximum classification accuracy, they were compute-intensive. Classifications with filter methods incurred less computational cost and their execution time was lower than that of wrapper methods. It was inferred that many attribute selection methods did not give much importance to the structure of attributes and the possible outliers were ignored during the generation of an optimized attribute set.
In the second part of the paper, an integrated hybrid attribute evaluation method has been proposed. It combined a new variant of K-Means cluster analysis named Integrated Supervised K-Means along with the CFS and BFS methods. This new variant of k-means algorithm used regression approach to generate cluster member probabilities which is used to detect less relevant instances from participating in finding cluster mean. Classification with the proposed method using an improved decision tree maximise the performance. The improve decision tree used clustering approach which classifies majority instances. The remaining instances were input to the decision tree unit which classifies them into respective classes. It was evaluated on 14 different chronic disease datasets using various performance metrics. Optimum mean values of 96.8%, 96.5%, 95.6% and 96.2% were recorded for accuracy, specificity, sensitivity and f-score. The use of the newly proposed integrated attribute evaluator model along with improve decision tree classifier generated a mean accuracy of 96.85 which is more than 96.1% accuracy rate generated by using decision tree alone. The mean error rate recorded with the hybrid classification model is as low as 0.642. Thus, it can be suggested for chronic disease assessment which can assist medical experts, acting as a decision support system. Furthermore, this analysis can support future research initiatives using machine learning for chronic disease classification. Future lines of research involve the application of the proposed model to image related datasets. Moreover, assessing impact of ensemble learning and image datasets on attribute evaluators will be an important element of future research.
Author Contributions
All authors have designed the study, developed the methodology, performed the analysis, and written the manuscript. All authors have read and agreed to the published version of the manuscript.
Funding
This research received no external funding.
Conflicts of Interest
The authors declare no conflict of interest.
References
- Jain, D.; Singh, V. Feature selection and classification systems for chronic disease prediction: A review. Egypt. Inform. J. 2018, 19, 179–189. [Google Scholar] [CrossRef]
- Ganiger, S.; Rajashekharaiah, K. Chronic Diseases Diagnosis using Machine Learning. In Proceedings of the International Conference on Circuits and Systems in Digital Enterprise Technology (ICCSDET), Kottayam, India, 21–22 December 2018; pp. 1–6. [Google Scholar]
- Apoorva, R. All about the Top 5 Chronic Diseases in India, Medlife Blog: Health and Wellness Tips. 2018. Available online: https://www.medlife.com/blog/top-5-chronic-diseases-india/ (accessed on 4 November 2020).
- Canlas, R.D. Data Mining in Healthcare: Current Applications and Issues. Master’s Thesis, School of Information Systems & Management, Carnegie Mellon University, Australia, 2009; pp. 1–11. [Google Scholar]
- Chandrashekar, G.; Sahin, F. A survey on feature selection methods. Comput. Electr. Eng. 2014, 40, 16–28. [Google Scholar] [CrossRef]
- Sarojini, B.; Ramaraj, N. Enhancing Medical Prediction using Feature Selection. Int. J. Artif. Intell. Expert Syst. 2011, 1, 1–9. [Google Scholar]
- Novakovic, J.; Strbac, P.; Bulatovic, D. Toward optimal feature selection using ranking methods and classification algorithms. Yugosl. J. Oper. Res. 2011, 21, 119–135. [Google Scholar] [CrossRef]
- Dash, M.; Liu, H. Feature Selection for Classification. Intell. Data Anal. 1997, 1, 131–156. [Google Scholar] [CrossRef]
- Mishra, S.; Mishra, B.K.; Sahoo, S.; Panda, B. Impact of swarm intelligence techniques in diabetes disease risk prediction. Int. J. Knowl. Discov. Bioinform. (IJKDB) 2016, 6, 29–43. [Google Scholar] [CrossRef]
- Zhao, Z.; Wang, L.; Liu, H.; Ye, J. On Similarity Preserving Feature Selection. IEEE Trans. Knowl. Data Eng. 2011, 25, 619–632. [Google Scholar] [CrossRef]
- Guyon, I.; Elisseeff, A. An introduction to variable and feature selection. J. Mach. Learn. Res. 2003, 3, 1157–1182. [Google Scholar]
- Top5 Advantages and Disadvantages of Decision Tree Algorithm. Available online: https://medium.com/@dhiraj8899/top-5-advantages-and-disadvantages-of-decision-tree-algorithm-428ebd199d9a (accessed on 4 November 2020).
- Awang, R.; Palaniappan, S. Web-based Heart Disease Decision Support System using Data Mining Classification Modeling techniques. In Proceedings of the 9th International Conference on Information Integration and Web-Baseed Application & Services, Jakarta, Indonesia, 3–5 December 2007; pp. 177–187. [Google Scholar]
- Tu, M.C.; Shin, D.; Shin, D. Effective Diagnosis of Heart Disease through Bagging Approach. In Proceedings of the 2nd International Conference on Biomedical Engineering and Informatics, Tianjin, China, 17–19 October 2009; pp. 1–4. [Google Scholar]
- Benkaci, M.; Jammes, B.; Doncescu, A. Feature Selection for Medical Diagnosis Using Fuzzy Artmap Classification and Intersection Conflict. In Proceedings of the 24th International Conference on Advanced Information Networking and Applications Workshops, Perth, Australia, 20–23 April 2010; pp. 790–795. [Google Scholar]
- Heller, R.F.; Chinn, S.; Pedoe, H.D.; Rose, G. How well can we predict coronary heart disease? Findings in the United Kingdom Heart Disease Prevention Project. BMJ 1984, 288, 1409–1411. [Google Scholar] [CrossRef]
- Wilson, P.W.F.; D’Agostino, R.B.; Levy, D.; Belanger, A.M.; Silbershatz, H.; Kannel, W.B. Prediction of Coronary Heart Disease Using Risk Factor Categories. Circulation 1998, 97, 1837–1847. [Google Scholar] [CrossRef]
- Wang, H.; Khoshgoftaar, T.M.; Van Hulse, J. A Comparative Study of Threshold-Based Feature Selection Techniques. In Proceedings of the 2010 IEEE International Conference on Granular Computing, San Jose, CA, USA, 14–16 August 2010; pp. 499–504. [Google Scholar]
- Simons, L.; Simons, J.; Palaniappan, L.; Friedlander, Y.; McCallum, J. Risk functions for prediction of cardiovascular disease in elderly Australians: The Dubbo Study. Med. J. Aust. 2003, 178, 113–116. [Google Scholar] [CrossRef] [PubMed]
- Surekha, S.; JayaSuma, G. Comparison of Feature Selection Techniques for Thyroid Disease. In Proceedings of the International Conference on Intelligent Systems, Control & Manufacturing Technology (ICICMT 2015), Abu Dhabi, UAE, 16–17 March 2015; pp. 20–26. [Google Scholar]
- Sah, R.D.; Sheetalani, J. Review of Medical Disease Symptoms Prediction Using Data Mining Technique. IOSR J. Comput. Eng. 2017, 19, 59–70. [Google Scholar] [CrossRef]
- Chuang, L.-Y.; Ke, C.-H.; Yang, C.-H. A Hybrid Both Filter and Wrapper Feature Selection Method for Microarray Classification. In Proceedings of the International MultiConference of Engineers and Computer Scientists, Hong Kong, China, 19–21 March 2008; pp. 146–150. [Google Scholar]
- Mishra, S.; Tripathy, H.K.; Mishra, B.K. Implementation of biologically motivated optimisation approach for tumour categorisation. Int. J. Comput. Aided Eng. Technol. 2018, 10, 244–256. [Google Scholar] [CrossRef]
- González-Navarro, F.F.; Munoz, L.A.B. Feature Selection for the Prediction and Visualization of Brain Tumor Types Using Proton Magnetic Resonance Spectroscopy Data. Comput. Vis. 2012, 83–97. [Google Scholar] [CrossRef]
- Verma, A.K.; Pal, S.; Kumar, S. Comparison of skin disease prediction by feature selection using ensemble data mining techniques. Inform. Med. Unlocked 2019, 16, 100202. [Google Scholar] [CrossRef]
- El-Hasnony, M.I.; El Bakry, H.M.; Saleh, A.A. Comparative Study among Data Reduction Techniques over Classification Accuracy. Int. J. Comput. Appl. 2015, 122, 9–15. [Google Scholar] [CrossRef]
- Patil, B.; Joshi, R.; Toshniwal, D. Hybrid prediction model for Type-2 diabetic patients. Expert Syst. Appl. 2010, 37, 8102–8108. [Google Scholar] [CrossRef]
- Nalband, S.; Sundar, A.; Prince, A.A.; Agarwal, A. Feature selection and classification methodology for the detection of knee-joint disorders. Comput. Methods Progr. Biomed. 2016, 127, 94–104. [Google Scholar] [CrossRef]
- Piramuthu, S. Evaluating feature selection methods for learning in data mining applications. Eur. J. Oper. Res. 2004, 156, 483–494. [Google Scholar] [CrossRef]
- Karegowda, A.G.; Manjunath, A.; Jayaram, M. Application of Genetic Algorithm Optimized Neural Network Connection Weights for Medical Diagnosis of PIMA Indians Diabetes. Int. J. Soft Comput. 2011, 2, 15–23. [Google Scholar] [CrossRef]
- Elsayyad, A.; Al-Dhaifallah, M.; Nassef, A.M. Features selection for arrhythmia diagnosis using Relief-F algorithm and support vector machine. In Proceedings of the 2017 14th International Multi-Conference on Systems, Signals & Devices (SSD), Marrakech, Morocco, 28–31 March 2017; pp. 461–468. [Google Scholar]
- Fallahpour, S.; Lakvan, E.N.; Zadeh, M.H. Using an ensemble classifier based on sequential floating forward selection for financial distress prediction problem. J. Retail. Consum. Serv. 2017, 34, 159–167. [Google Scholar] [CrossRef]
- D Jain, D.; Singh, V. Diagnosis of Breast Cancer and Diabetes using Hybrid Feature Selection Method. In Proceedings of the 2018 5th International Conference on Parallel, Distributed and Grid Computing (PDGC), Solan Himachal Pradesh, India, 20–22 December 2018; pp. 64–69. [Google Scholar]
- Kolukisa, B.; Hacilar, H.; Goy, G.; Kus, M.; Bakir-Gungor, B.; Aral, A.; Gungor, V.C. Evaluation of Classification Algorithms, Linear Discriminant Analysis and a New Hybrid Feature Selection Methodology for the Diagnosis of Coronary Artery Disease. In Proceedings of the 2018 IEEE International Conference on Big Data (Big Data), Seattle, WA, USA, 10–13 December 2018; pp. 2232–2238. [Google Scholar]
- Tengku Mazlin, T.A.H.; Sallehuddin, R.; Zuriahati, M.Y. Utilization of Filter Feature Selection with Support Vector Machine for Tumours Classification. In Proceedings of the Joint Conference on Green Engineering Technology & Applied Computing, Bangkok, Thailand, 4–5 February 2019. [Google Scholar]
- Mishra, S.; Tripathy, H.K.; Mishra, B.; Sahoo, S. Implementation of Classification Rule Mining to minimize Liver Disorder risks. Int. J. Control Theory Appl. 2017, 10, 117–124. [Google Scholar]
- Amin, S.; Singhal, A. Identification and classification of neuro-degenerative diseases using feature selection through PCA-LD. In Proceedings of the 2017 4th IEEE Uttar Pradesh Section International Conference on Electrical, Computer and Electronics (UPCON), Mathura, India, 26–28 October 2017; pp. 578–586. [Google Scholar]
- Narayanan, B.N.; Hardie, R.C.; Kebede, T.M. Performance Analysis of Feature Selection Techniques for Support Vector Machine and its Application for Lung Nodule Detection. In Proceedings of the NAECON 2018 IEEE National Aerospace and Electronics Conference, Dayton, OH, USA, 26–26 July 2018; pp. 262–266. [Google Scholar]
- El Akadi, A.; Amine, A.; El Ouardighi, A.; Aboutajdine, D. A two-stage gene selection scheme utilizing MRMR filter and GA wrapper. Knowl. Inf. Syst. 2010, 26, 487–500. [Google Scholar] [CrossRef]
- Quanz, B.; Huan, J.; Mishra, M. Knowledge Transfer with Low-Quality Data: A Feature Extraction Issue. IEEE Trans. Knowl. Data Eng. 2012, 24, 1789–1802. [Google Scholar] [CrossRef]
- Hafizah, W.M.; Supriyanto, E.; Yunus, J. Feature Extraction of Kidney Ultrasound Images Based on Intensity Histogram and Gray Level Co-occurrence Matrix. In Proceedings of the 2012 6th Asia Modelling Symposium, Bali, Indonesia, 29–31 March 2012; pp. 115–120. [Google Scholar]
- Vieira, S.M.; Mendonça, L.F.; Farinha, G.J.; Sousa, J.M. Modified binary PSO for feature selection using SVM applied to mortality prediction of septic patients. Appl. Soft Comput. 2013, 13, 3494–3504. [Google Scholar] [CrossRef]
- Prasartvit, T.; Banharnsakun, A.; Kaewkamnerdpong, B.; Achalakul, T. Reducing bioinformatics data dimension with ABC-kNN. Neurocomputing 2013, 116, 367–381. [Google Scholar] [CrossRef]
- Mokeddem, S.A.; Atmani, B.; Mokaddem, M. Supervised Feature Selection for Diagnosis of Coronary Artery Disease Based on Genetic Algorithm. In Proceedings of the 1st International Conference on Computational Science and Engineering, Dubai, UAE, 18–19 May 2013; pp. 41–51. [Google Scholar]
- Chen, C.P.; Zhang, C.-Y. Data-intensive applications, challenges, techniques and technologies: A survey on Big Data. Inf. Sci. 2014, 275, 314–347. [Google Scholar] [CrossRef]
- Kora, P.; Krishna, K.S.R. Improved Bat algorithm for the detection of myocardial infarction. SpringerPlus 2015, 4, 666. [Google Scholar] [CrossRef]
- Priya, M.; Juliet, P.L.; Tamilselvi, P.R. Performance analysis of liver disease prediction using machine learning algorithms. Int. Res. J. Eng. Technol. 2018, 5, 206–211. [Google Scholar]
- Keerthi, P.; Hema Latha, N.; Hari Gokul, K.; Prasad, V.; Arun Kumar, T. Wrapper Based Feature Selection for Disease Diagnosis using Optimization Algorithms. Int. J. Eng. Res. Technol. 2018, 6, 1–10. [Google Scholar]
- Kanan, H.R.; Faez, K. An improved feature selection method based on ant colony optimization (ACO) evaluated on face recognition system. Appl. Math. Comput. 2008, 205, 716–725. [Google Scholar] [CrossRef]
- Erguzel, T.T.; Ozekes, S.; Tan, O.; Gultekin, S. Feature Selection and Classification of Electroencephalographic Signals. Clin. EEG Neurosci. 2014, 46, 321–326. [Google Scholar] [CrossRef] [PubMed]
- Guyon, I.; Weston, J.; Barnhill, S.; Vapnik, V. Gene Selection for Cancer Classification using Support Vector Machines. Mach. Learn. 2002, 46, 389–422. [Google Scholar] [CrossRef]
- Uzer, M.S.; Yilmaz, N.; Inan, O. Feature Selection Method Based on Artificial Bee Colony Algorithm and Support Vector Machines for Medical Datasets Classification. Sci. World J. 2013, 2013, 1–10. [Google Scholar] [CrossRef] [PubMed]
- Dogantekin, E.; Dogantekin, A.; Avci, D. Automatic hepatitis diagnosis system based on Linear Discriminant Analysis and Adaptive Network based on Fuzzy Inference System. Expert Syst. Appl. 2009, 36, 11282–11286. [Google Scholar] [CrossRef]
- Chen, L.-F.; Su, C.-T.; Chen, K.-H.; Wang, P.-C. Particle swarm optimization for feature selection with application in obstructive sleep apnea diagnosis. Neural Comput. Appl. 2011, 21, 2087–2096. [Google Scholar] [CrossRef]
- Karaboga, D.; Ozturk, C. A novel clustering approach: Artificial Bee Colony (ABC) algorithm. Appl. Soft Comput. 2011, 11, 652–657. [Google Scholar] [CrossRef]
- Mishra, S.; Tripathy, H.K.; Mallick, P.; Bhoi, A.K.; Barsocchi, P. EAGA-MLP—An Enhanced and Adaptive Hybrid Classification Model for Diabetes Diagnosis. Sensors 2020, 20, 4036. [Google Scholar] [CrossRef]
- Mishra, S.; Mallick, P.K.; Jena, L.; Chae, G.-S. Optimization of Skewed Data Using Sampling-Based Preprocessing Approach. Front. Public Heal. 2020, 8, 274. [Google Scholar] [CrossRef]
- Kohavi, R.; John, G.H. Wrappers for feature subset selection. Artif. Intell. 1997, 97, 273–324. [Google Scholar] [CrossRef]
- Uğuz, H. A two-stage feature selection method for text categorization by using information gain, principal component analysis and genetic algorithm. Knowl. Based Syst. 2011, 24, 1024–1032. [Google Scholar] [CrossRef]
- Gandhi, K.K.; Prajapati, N.B. Study of Diabetes Prediction using Feature Selection and Classification. Int. J. Eng. Res. Technol. 2014, 3, 1–7. [Google Scholar]
- Jabbar, M.A.; Deekshatulu, B.L.; Chandra, P. Prediction of Heart Disease Using Random Forest and Feature Subset Selection. Adv. Intell. Syst. Comput. 2015, 187–196. [Google Scholar]
- Peker, M.; Arslan, A.; Sen, B.; Celebi, F.V.; But, A. A novel hybrid method for determining the depth of anesthesia level: Combining ReliefF feature selection and random forest algorithm (ReliefF+RF). In Proceedings of the 2015 International Symposium on Innovations in Intelligent SysTems and Applications (INISTA), Madrid, Spain, 2–4 September 2015; pp. 1–8. [Google Scholar]
- Wagih, M.; Abou-Chadi, F.; El-Din, H.; Mekky, N. Classification of Ultrasound Kidney Images using PCA and Neural Networks. Int. J. Adv. Comput. Sci. Appl. 2015, 6, 53–57. [Google Scholar] [CrossRef][Green Version]
- Kavitha, R.; Kannan, E. An efficient framework for heart disease classification using feature extraction and feature selection technique in data mining. In Proceedings of the 2016 International Conference on Emerging Trends in Engineering, Technology and Science (ICETETS), Pudukkottai, India, 24–26 February 2016; pp. 1–5. [Google Scholar]
- Tolkacheva, E.G.; Zhao, X.; Zlochiver, S.; Mori, Y. Computational and Mathematical Methods in Cardiovascular Diseases. Comput. Math. Methods Med. 2017, 2017, 1–2. [Google Scholar] [CrossRef] [PubMed]
- Haq, A.U.; Li, J.P.; Memon, M.H.; Nazir, S.; Sun, R. A Hybrid Intelligent System Framework for the Prediction of Heart Disease Using Machine Learning Algorithms. Mob. Inf. Syst. 2018, 2018, 1–21. [Google Scholar] [CrossRef]
- Gutlein, M.; Frank, E.; Hall, M.A.; Karwath, A. Large-scale attribute selection using wrappers. In Proceedings of the 2009 IEEE Symposium on Computational Intelligence and Data Mining, Nashville, TN, USA, 30 March–2 April 2009; pp. 332–339. [Google Scholar]
- Battiti, R. Using mutual information for selecting features in supervised neural net learning. IEEE Trans. Neural Netw. 1994, 5, 537–550. [Google Scholar] [CrossRef]
- Verma, L.; Srivastava, S.; Negi, P.C. A Hybrid Data Mining Model to Predict Coronary Artery Disease Cases Using Non-Invasive Clinical Data. J. Med. Syst. 2016, 40, 1–7. [Google Scholar] [CrossRef]
- Yu, L.; Liu, H. Feature selection for high-dimensional data: A fast correlation-based filter solution. In Proceedings of the 20th International Conference on Machine Learning, Washington, DC, USA, 21–24 August 2003; Volume 3, pp. 856–863. [Google Scholar]
- Maldonado, S.; Weber, R. A wrapper method for feature selection using Support Vector Machines. Inf. Sci. 2009, 179, 2208–2217. [Google Scholar] [CrossRef]
- Yildirim, P. Filter Based Feature Selection Methods for Prediction of Risks in Hepatitis Disease. Int. J. Mach. Learn. Comput. 2015, 5, 258–263. [Google Scholar] [CrossRef]
- Jothi, G.; Inbarani, H. Soft Set Based Feature Selection Approach for Lung Cancer Images. Int. J. Sci. Eng. Res. 2010, 3, 1–7. [Google Scholar]
- Heshmati, A.; Amjadifard, R.; Shanbehzadeh, J. ReliefF-Based Feature Selection for Automatic Tumor Classification of Mammogram Images. In Proceedings of the 2011 7th Iranian Conference on Machine Vision and Image Processing, Teheran, Iran, 16–17 November 2011; pp. 1–5. [Google Scholar]
- Ding, J.; Fu, L. A Hybrid Feature Selection Algorithm Based on Information Gain and Sequential Forward Floating Search. J. Intell. Comput. 2018, 9, 93–101. [Google Scholar] [CrossRef]
- Jena, L.; Patra, B.; Nayak, S.; Mishra, S.; Tripathy, S. Risk Prediction of Kidney Disease Using Machine Learning Strategies. In Intelligent and Cloud Computing; Springer: Singapore, 2019; pp. 485–494. [Google Scholar]
- Ray, C.; Tripathy, H.K.; Mishra, S. Assessment of Autistic Disorder Using Machine Learning Approach. In Proceedings of the International Conference on Intelligent Computing and Communication, Hyderabad, India, 9–11 January 2019; pp. 209–219. [Google Scholar]
- Sahoo, S.; Mishra, S.; Mishra, B.K.K.; Mishra, M. Analysis and Implementation of Artificial Bee Colony Optimization in Constrained Optimization Problems. In Handbook of Research on Modeling, Analysis, and Application of Nature-Inspired Metaheuristic Algorithms; IGI Global: Pennsylvania, PA, USA, 2018; pp. 413–432. [Google Scholar]
- Dua, D.; Graff, C. UCI Machine Learning Repository. 2019. Available online: http://archive.ics.uci.edu/ml (accessed on 4 November 2020).
- Panda, B.; Mishra, S.; Mishra, B.K. A Meta-Model Implementation with Tabu Search Technique to Determine the Buying Pattern of Online Customers. Indian J. Sci. Technol. 2016, 9, 1. [Google Scholar] [CrossRef]
- Mishra, S.; Dash, A.; Jena, L. Use of Deep Learning for Disease Detection and Diagnosis. In Bio-Inspired Neurocomputing; Springer: Singapore, 2021; pp. 181–201. [Google Scholar]
- Mallick, P.K.; Mishra, S.; Chae, G.-S. Digital media news categorization using Bernoulli document model for web content convergence. Pers. Ubiquitous Comput. 2020, 1–16. [Google Scholar] [CrossRef]
- Krier, D.; Rossi, F.; Verleysen, M. Feature clustering and mutual information for the selection of variables in spectral data. In Proceedings of the European Symposium on Artificial Neural Networks Advances in Computational Intelligence and Learning, Bruges, Belgium, 25–27 April 2007; pp. 157–162. [Google Scholar]
- Van Dijck, G.; Van Hulle, M.M. Speeding Up the Wrapper Feature Subset Selection in Regression by Mutual Information Relevance and Redundancy Analysis. In Proceedings of the 16th International Conference on Artificial Neural Networks, Athens, Greece, 10–14 September 2006; pp. 31–40. [Google Scholar]
- Song, Q.; Ni, J.; Wang, G. A Fast Clustering-Based Feature Subset Selection Algorithm for High-Dimensional Data. IEEE Trans. Knowl. Data Eng. 2011, 25, 1–14. [Google Scholar] [CrossRef]
- Xu, Y.-M.; Wang, C.-D.; Lai, J.-H. Weighted Multi-view Clustering with Feature Selection. Pattern Recognit. 2016, 53, 25–35. [Google Scholar] [CrossRef]
- Chaudhury, P.; Mishra, S.; Tripathy, H.K.; Kishore, B. Enhancing the capabilities of Student Result Prediction System. In Proceedings of the 2nd International Conference on Information and Communication Technology for Competitive Strategies, Uidapur, India, 4–5 March 2016; pp. 1–6. [Google Scholar]
- Mishra, S.; Tripathy, H.K.; Panda, A.R. An Improved and Adaptive Attribute Selection Technique to Optimize Dengue Fever Prediction. Int. J. Eng. Technol. 2018, 7, 480–486. [Google Scholar] [CrossRef]
- Peng, H.; Long, F.; Ding, C. Feature selection based on mutual information criteria of max-dependency, max-relevance, and min-redundancy. IEEE Trans. Pattern Anal. Mach. Intell. 2005, 27, 1226–1238. [Google Scholar] [CrossRef]
- Sushruta, M.; Hrudaya, K.T.; Brojo, K.M. Filter Based Attribute Optimization: A Performance Enhancement Technique for Healthcare Experts. Int. J. Control Theory Appl. 2017, 10, 295–310. [Google Scholar]
- Mishra, S.; Tadesse, Y.; Dash, A.; Jena, L.; Ranjan, P. Thyroid Disorder Analysis Using Random Forest Classifier. In Intelligent and Cloud Computing; Springer: Singapore, 2019; pp. 385–390. [Google Scholar]
- Mishra, S.; Chaudhury, P.; Mishra, B.K.; Tripathy, H.K. An implementation of Feature ranking using Machine learning techniques for Diabetes disease prediction. In Proceedings of the Second International Conference on Information and Communication Technology for Competitive Strategies, Udaipur India, 4–5 March 2016; pp. 1–3. [Google Scholar]
Publisher’s Note: MDPI stays neutral with regard to jurisdictional claims in published maps and institutional affiliations. |
© 2020 by the authors. Licensee MDPI, Basel, Switzerland. This article is an open access article distributed under the terms and conditions of the Creative Commons Attribution (CC BY) license (http://creativecommons.org/licenses/by/4.0/).