Article

Study on Preparation and Properties of Intrinsic Super-Hydrophobic Foamed Magnesium Oxychloride Cement Material

College of Petrochemical engineering, Changzhou University, Changzhou 213164, China
*
Author to whom correspondence should be addressed.
Appl. Sci. 2020, 10(22), 8134; https://doi.org/10.3390/app10228134
Submission received: 27 October 2020 / Revised: 13 November 2020 / Accepted: 16 November 2020 / Published: 17 November 2020

Abstract

:
As we all know, magnesium oxychloride foamed cement material has poor water resistance, leading to a decline in application value. In our research, tetraethylorthosilicate (TEOS) and triethoxy-1H, 1H, 2H, 2H-tridecylfluoro-n-octylsilane (FAS) were pre-cohydrolyzed to prepare the overall super hydrophobic magnesium oxychloride cement (MOC) foamed material, and its structure and performances were systematically studied. The results show that adding organosilane can make it have overall hydrophobicity under the premise of maintaining the compressive strength. Mechanical abrading and chemical corrosion tests show its good engineering durability. The maximum moisture absorption rate dropped by 16.2%, and the quality can be restored to 98.1% of the original quality after dehumidification. All these properties show that the hydrophobic foamed magnesium oxychloride cement has potential engineering application value.

Graphical Abstract

1. Introduction

Magnesium oxychloride cement (MOC) is a gas-hardening gel material made of activated magnesium oxide powder and a certain concentration of magnesium chloride solution [1]. It has a short setting time, low alkalinity, fire resistance, heat resistance, and other properties [2]; after 28 days of curing, the compressive strength can reach 80–100 KPa and even 200 KPa after modification [3]. The above properties indicate that magnesium oxychloride cement is particularly suitable for foamed cement substrate and has application potential in light insulation board, composite wall panels, and other fields.
The pore structure is an important property of foam materials. It also determines bulk density, heat preservation, heat insulation, and sound insulation performance [4]. On the other hand, its compressive strength is much lower than that of dense bulk materials [5]. In the actual use process, the continuous pore structure of the porous material leads to its extremely high water absorption, which further reduces the insulation effect, especially in moist and rainy areas. In addition, the water absorbed by the pore structures causes secondary damage such as a freezing fracture and mold propagation [6]. The setting time of ordinary Portland foam cement is long, the pore structure is unstable, and the volume water absorption rate increased rapidly after 72 h of blistering [7]. Magnesium oxychloride foam cement is made of magnesium oxychloride gel material as a matrix, thus it also inherits the disadvantage of poor water resistance of magnesium oxychloride cement. The main strength phase of magnesium oxychloride cement is the 5Mg(OH)2·MgCl2·8H2O (five phase), which easily changes from a needle-like network structure to a loosely packed layered structure after blistering [8,9,10]. Phosphoric acid and other additives can significantly improve the water-resistance of magnesium oxychloride cement [11]. However, the natural hydrophilicity of inorganic materials still cannot prevent water vapor from adhering to the inside and the outside of the porous material and gradually eroding its gel structure. It has been found that, by controlling the pore structure, minimizing the connection between pores can significantly reduce the capillary water absorption of foamed cement [12]. Due to the high dopability of magnesium oxychloride cement, the addition of graphene and graphene oxide [13], Magnesium Oxychloride 5Mg(OH)2·MgCl2·8H2O [14], granulated Scrap tires andexpanded glass [15] can also increase its water resistance, but this is limited. The introduction of hydrophobic materials into foam materials can significantly improve the water absorption of foam cement. In the research of conventional silicate and sulfoaluminate foam materials, by dipping polystyrene into the material surface [16], silane-modified graphene oxide (GO) coating [17], organosilane coating [18], etc., can significantly reduce water absorption. The advantage of the surface dipping method is that the method is simple and does not affect the hydration reaction process of the cement material, but because the surface hydrophobic layer is only a few hundred nanometers, the hydrophobic layer wears easily. Therefore, improving the moisture resistance of foamed materials has become a key issue in the field of thermal insulation building materials.
If the porous material is given overall hydrophobic properties, it can avoid the reduction of hydrophobicity due to surface wear and long-term use. Adding organosilane to the cement system and using the hydrophobicity of the organosilane hydrolysate can achieve the overall hydrophobicity of Portland cement materials [19], but the hydration reaction of MOC materials is quite different from that of Portland cement. According to our knowledge, there is no literature report on the hydrophobicity of MOC materials. In this study, we used H2O2 as a blowing agent and introduced triethoxy-1H, 1H, 2H, 2H-tridecylfluoro-n-octylsilane (FAS) and tetraethyl orthosilicate (TEOS) into magnesium chloride solution. The co-hydrolyzed product was used as a hydrophobic agent and mixed with activated magnesium oxide to prepare an overall hydrophobic magnesium oxychloride cement foaming material. Finally, we systematically studied phase composition, pore size distribution, overall hydrophobicity, engineering durability, moisture resistance, dehydration performance, and other properties.

2. Materials and Methods

2.1. Experimental Materials

The three raw materials of magnesium oxychloride cement are magnesite powder, magnesium chloride, and water. The lightly burnt magnesite powder is produced in Haicheng City, Liaoning Province, and its chemical composition is shown in Table 1. The mass percentage of activated magnesium oxide (α-MgO) is 63%, and the average particle size is 75 μm. Magnesium chloride hexahydrate (MgCl2·6H2O purity = 98 wt %) and triethoxy-1H, 1H, 2H, 2H-tridecyl fluoride-n-octyl silane (FAS) are analytically pure reagents sourced from Aladdin Chemistry Test Agent Co., Ltd. Tetraethyl orthosilicate (TEOS), phosphoric acid (H3PO4), and 30% hydrogen peroxide (H2O2) are analytically pure reagents sourced from Sinopharm Chemical Reagent Co. Ltd., Shanghai, China.

2.2. Preparation of Foamed Hydrophobic Magnesium Oxychloride Cement Test Block

In this study, the initial raw material ratio of magnesium oxychloride cement was determined to be MgO:MgCl2:H2O = 6.5:1:13 (molar ratio) [20], and MgO was calculated as α-MgO. Firstly, we pre-hydrolyzed the organosilane in magnesium chloride solution, mixed magnesium chloride hexahydrate and distilled water at a molar ratio of MgCl2:H2O = 1:13, then added H2O2, FAS, and TEOS; the amount of H2O2 added was 4% to 12% of the mass of the magnesium oxide powder. Then, FAS and TEOS were added, and the amounts of FAS were 0.5%, 1%, 1.5%, 2%, and 2.5% of the mass of magnesium oxide powder. TEOS was added according to the molar ratio of FAS and TEOS with n: m (n = 0.5, 1, 1.5, 2, 2.5, m = 6, 8, 10, 12, 14). The mixed solution was stirred at 60 °C for 8 h to obtain the treated MgCl2 solution.
The H3PO4 was then mixed with the treated MgCl2 solution. The amount of H3PO4 added was 1% of the total MgO. This was mixed with magnesium oxide powder and stirred well to form magnesium oxychloride cement slurry. The slurry was cast in steel mold of 20 × 20 × 20 mm and 40 × 40 × 160 mm, vibrated, compacted, and cured at room temperature for 1 d. It was then demolded and air-cured. After curing for 1–28 d, the hydrophobic foamed magnesium oxychloride cement represented by F-MOC was finally obtained. N-MOC means that the blank control foamed magnesium oxychloride cement was added with H2O2, but FAS and TEOS were not added.

2.3. Characterization and Test Methods of Samples

2.3.1. Characterization of Pore Structure

The pore structure of porous materials is an important parameter to understand the performance of porous materials. At present, the methods for characterizing the pore structure of foam cement include optical method [21], mercury intrusion method [22], soaking medium method [23], etc. In this study, the optical image method was used to analyze the pore size distribution of foamed cement. Firstly, we selected the flat surface of the F-MOC and the N-MOC samples and then used a high-power magnifying glass to capture the surface morphology of the sample to obtain a photo. We then captured 9 regional planes (A1, A2, A3, A4, A5, A6, A7, A8, A9) with an area of 0.2 × 0.2 cm on the flat surface. We calculated the diameter of the holes in the 9 areas and classified the pore size interval (each 70 μm was classified as an interval). Finally, the pore size distribution of the entire sample surface was estimated based on the pore size of the statistical area.

2.3.2. Bulk Density Test

According to the JG/T 2,662,011 “Foam Concrete” standard, we first used an electric heating constant temperature drying oven to dry the samples at 60 °C. When the samples were measured at intervals of 4 h, the quality difference did not exceed 0.01 g. We then turned off the electric heating constant temperature drying oven, cooled the test piece to room temperature, and weighed it. The mass was accurately measured to 0.01 g, and the bulk density was calculated according to Formula (1).
ρ = M / V × 10 3
where ρ is the bulk density in kilograms per cubic meter (kg·m−3), accurate to 0.01 g; M is the weight of the sample under dry conditions (g); V is the volume of the sample (cm3).

2.3.3. Compressive Strength Test

According to JC/T 1062-2007 “Standard Test Method for Mechanical Properties of Foamed Concrete Blocks”, the strength was measured after 28 days using a sample with a size of 100 × 100 × 100 mm. Six specimens of each group were measured, and the average value was calculated.

2.3.4. X-Ray Diffractometer (XRD) Test

The crystalline phases of F-MOC and N-MOC samples were identified by a D/max-2500/PC X-ray diffractometer (XRD, CuKα, λ = 0.154 mm, tube voltage of 40 kV, tube current of 100 mA, made in Japan). Scanning at a speed of 3°/min and a scanning angle of 10 to 65°, a powder sample was prepared by crushing the cuboid specimens and passing the powder through a sieve with a 75 μm mesh. The XRD data were quantitatively analyzed, and the relative contents of the five-phase in F-MOC and N-MOC were calculated.

2.3.5. X-Ray Photoelectron Spectroscopy (XPS) Test

Thermo ESCALAB 250XI electronic spectrometer was used for high-resolution X-ray photoelectron spectroscopy (XPS) testing of F-MOC and N-MOC sample powders. Acquisition parameters were as follows. total acquisition time: 1 min 8.0 s; number of scans: 1; analyzer mode: CAE: pass energy 150.0 eV; energy step size:1.000 eV; number of energy steps:1361.

2.3.6. Fourier Infrared Spectrometer (FTIR) Test

American Nicolet-460 Fourier transform infrared spectrometer was used for testing. The experimental method was as follows: the samples were processed by KBr tableting method. The formed samples were dried under an infrared drying lamp to remove the absorbed water and then placed in a Fourier transform infrared spectrometer for testing. The test wavelength range was 400–4000 cm−1 followed by infrared analysis.

2.3.7. Water Contact Angle, Mechanical Abrading, and Chemical Corrosion Test

The test method for measuring the water contact angle of the sample was to select a foamed cement sample with a flat surface and then use a contact angle measuring instrument that met the HARKE-SPCA standard to measure.
The F-MOC was polished by a grinding machine with a grinding thickness of 0–10 mm, and the water contact angle was measured once for each 1 mm of grinding.
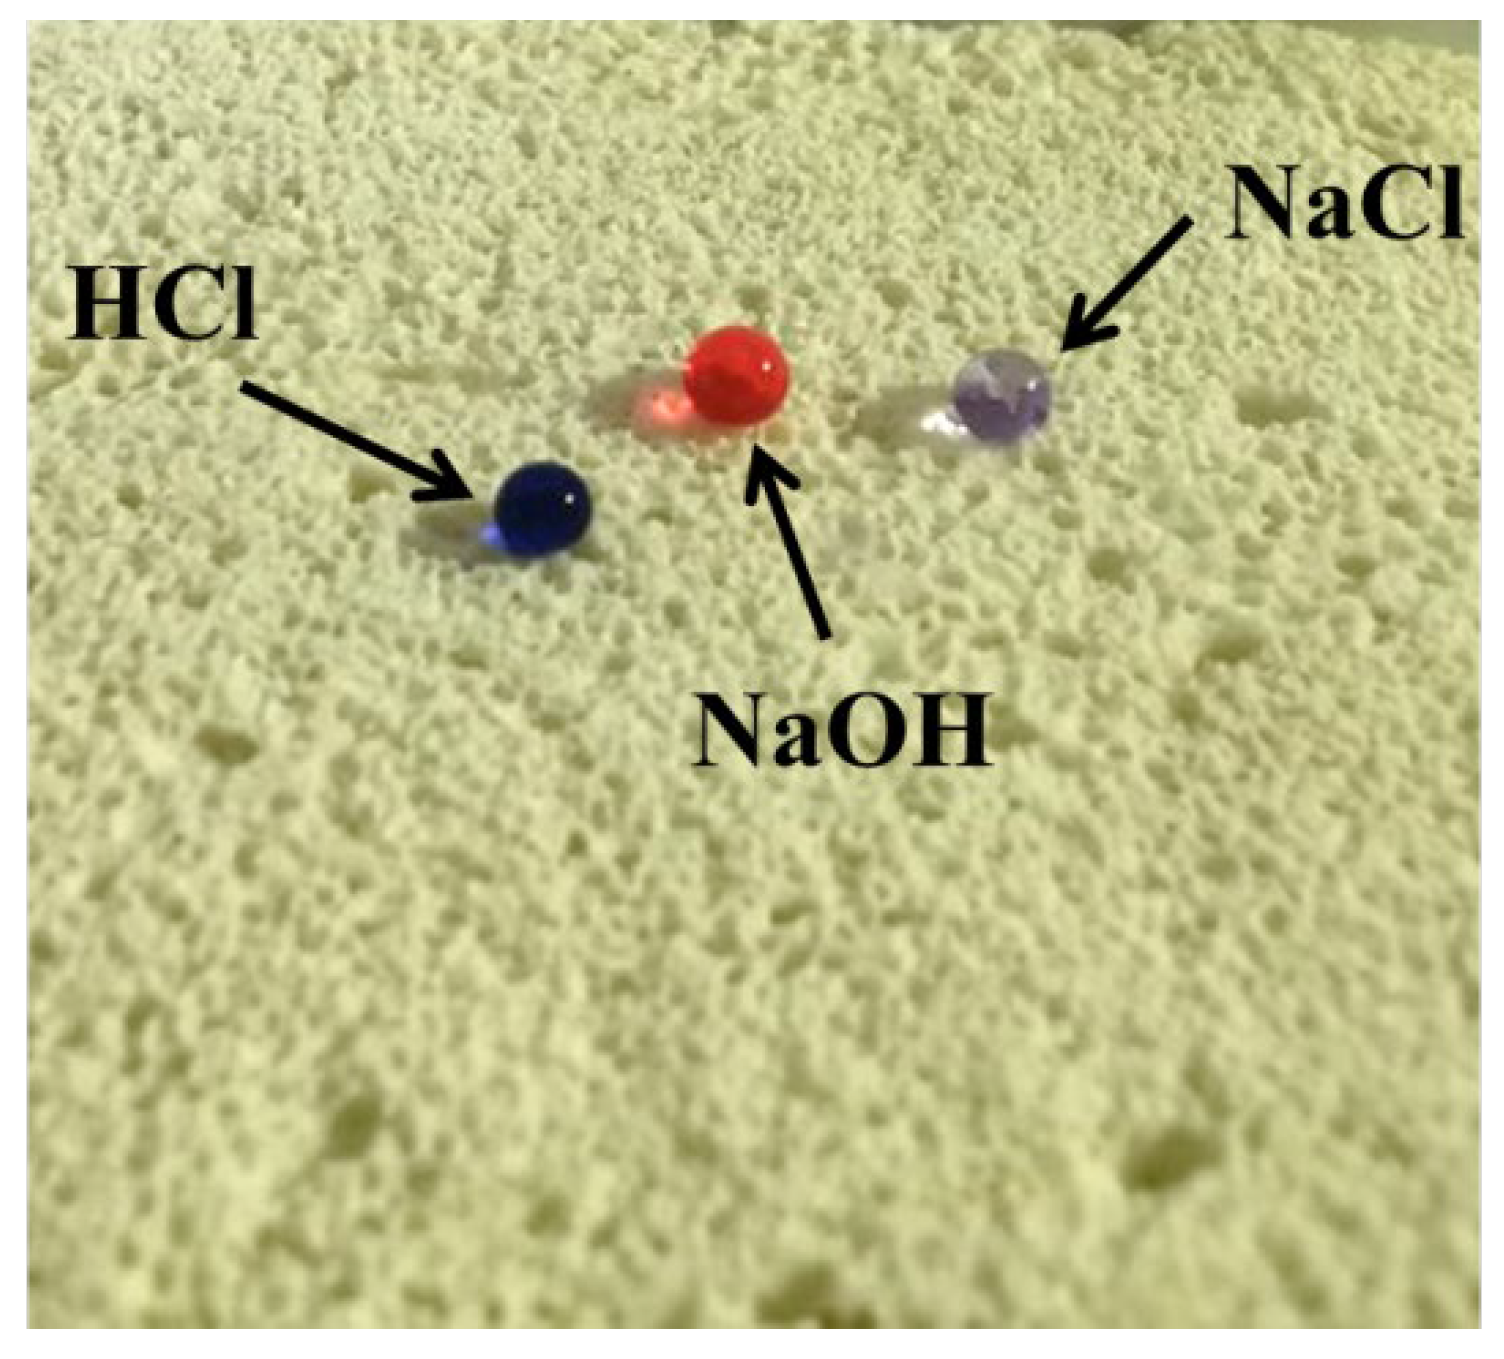
The F-MOC sample was soaked in solutions of 0.1 mol/L NaCl, 0.1 mol/L NaOH, and 0.1 mol/L HCl for three days, then taken out and dried in an electric heating constant temperature drying oven. Then, the water contact angle was measured again.

2.3.8. Moisture Resistance and Dehydration Performance Test

First, we put F-MOC and N-MOC in an electric heating constant temperature drying oven to dry to constant weight. Then, the samples were put in a constant temperature and humidity desiccator with a temperature of 30 °C and a relative humidity of 100% to absorb moisture. The samples were taken out after 120 h, moisture was wiped off the surface with a damp cloth, and then sample masses were immediately weighed to the nearest 0.0001 g. We calculated the moisture absorption rate of the sample mass according to Formula (2) and took the average value.
ω = m m 0 m 0   × 100 %                      
where ω is the mass moisture absorption rate (%), m0 is the mass of the sample after drying (g), and m is the mass of the sample after wiping off the moisture (g).
Then, the sample was dried in an oven at 30 °C to remove the water vapor distributed in the pores, and its mass was taken out and weighed every 20 min to monitor the evaporation of water in the whole process. A total of 120 min was monitored, and mass dehumidification rate was calculated according to Formula (3). F-MOC and N-MOC samples with different bulk densities were selected for parallel experiments.
ω 1 = m n m n + 1 m n + 1   × 100 %    
where ω1 is the mass dehumidification rate (%), mn is the mass when weighed after the nth dehumidification (g), and mn+1 is the mass when weighed after the (n + 1)th dehumidification (g) (n ≥ 0).

3. Results and Discussion

3.1. The Bulk Density and Pore Structure of Foam Material

From the bulk density of F-MOC and N-MOC obtained with different H2O2 content in Figure 1, it can be seen that the bulk density of F-MOC obtained with the same H2O2 content was greater than that of N-MOC. The standard deviation of the bulk density of F-MOC and N-MOC shows that, although the conditions for preparing the samples were the same, the bulk density of the samples was different, and the stability was poor when only H2O2 was used as the foaming agent. After adding FAS and TEOS, the standard deviation was reduced, and the stability was significantly improved. To a certain extent, the disadvantages of poor stability of the chemical foaming method can be improved.
When preparing the hydrophobic foamed MOC material, FAS with MgO mass of 0.5%–2.5 wt % was added, and the content of TEOS was (0.5–2.5):6 based on the molar ratio of FAS to TEOS. The mass of H2O2 was 10 wt % of the mass of MgO, and a series of foamed MOC materials were obtained. The bulk density of the material was maintained at 410–415 kg·m−3, indicating that the addition of FAS had little effect on the bulk density.
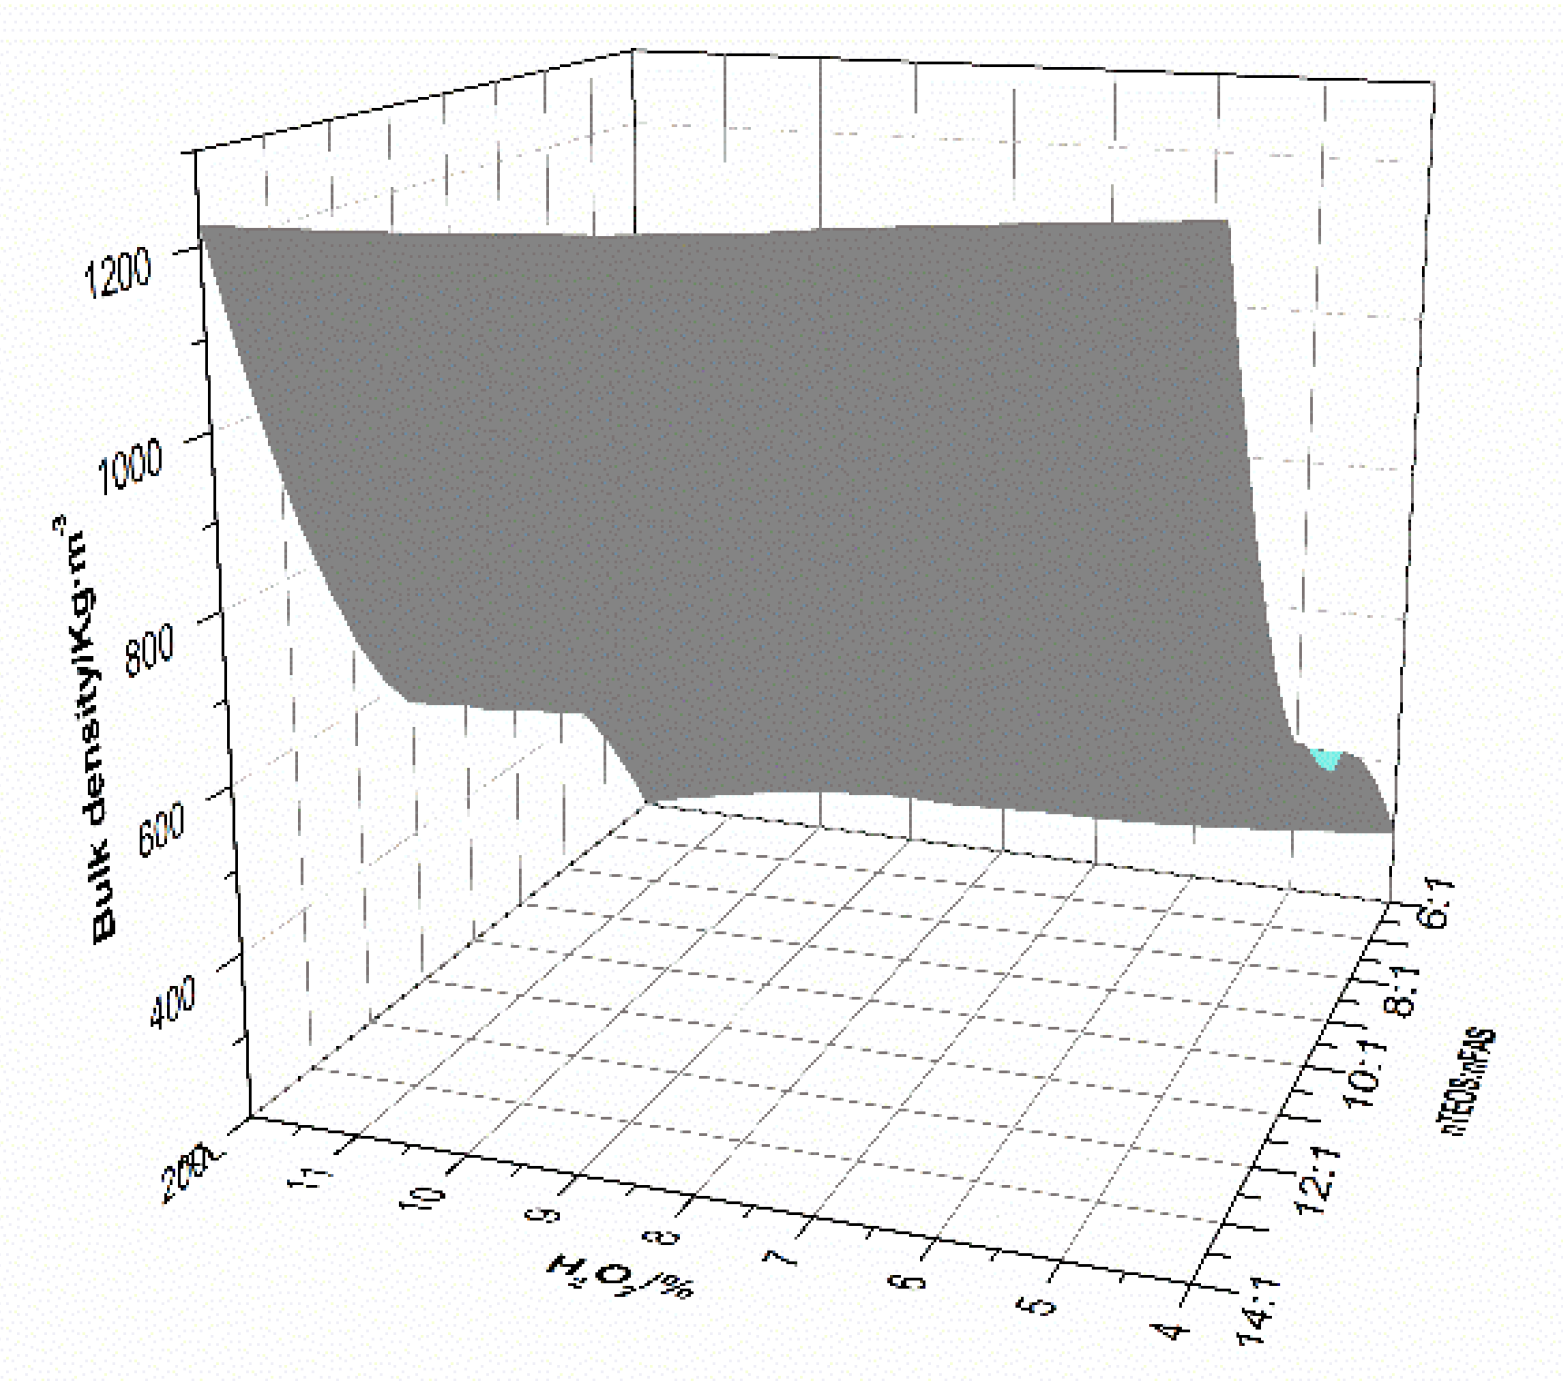
Based on hydrophobicity and economy, in subsequent experiments, the FAS addition amount was selected to be 1% of the mass of MgO to explore the influence of H2O2 and TEOS content on bulk density. From the three-dimensional graph of the influence of H2O2 and TEOS content on bulk density in Figure 2, it can be seen that, when the TEOS content was fixed and the H2O2 content increased from 4 wt % to 12 wt %, the bulk density decreased from 1200 kg·m−3 to 300 kg·m−3, thus the bulk density changed greatly. When the content of H2O2 was fixed, n(FAS):n(TEOS) increased from 1:6 to 1:14, the relative content of TEOS increased, and the bulk density of the sample increased, with an average increase of 70 Kg·m−3. This indicates that TEOS may cause partial decomposition of H2O2 during the pretreatment of the MgCl2 solution. The results show that the content of H2O2 had the greatest impact on the bulk density, followed by the content of TEOS, while the content of FAS had no effect.
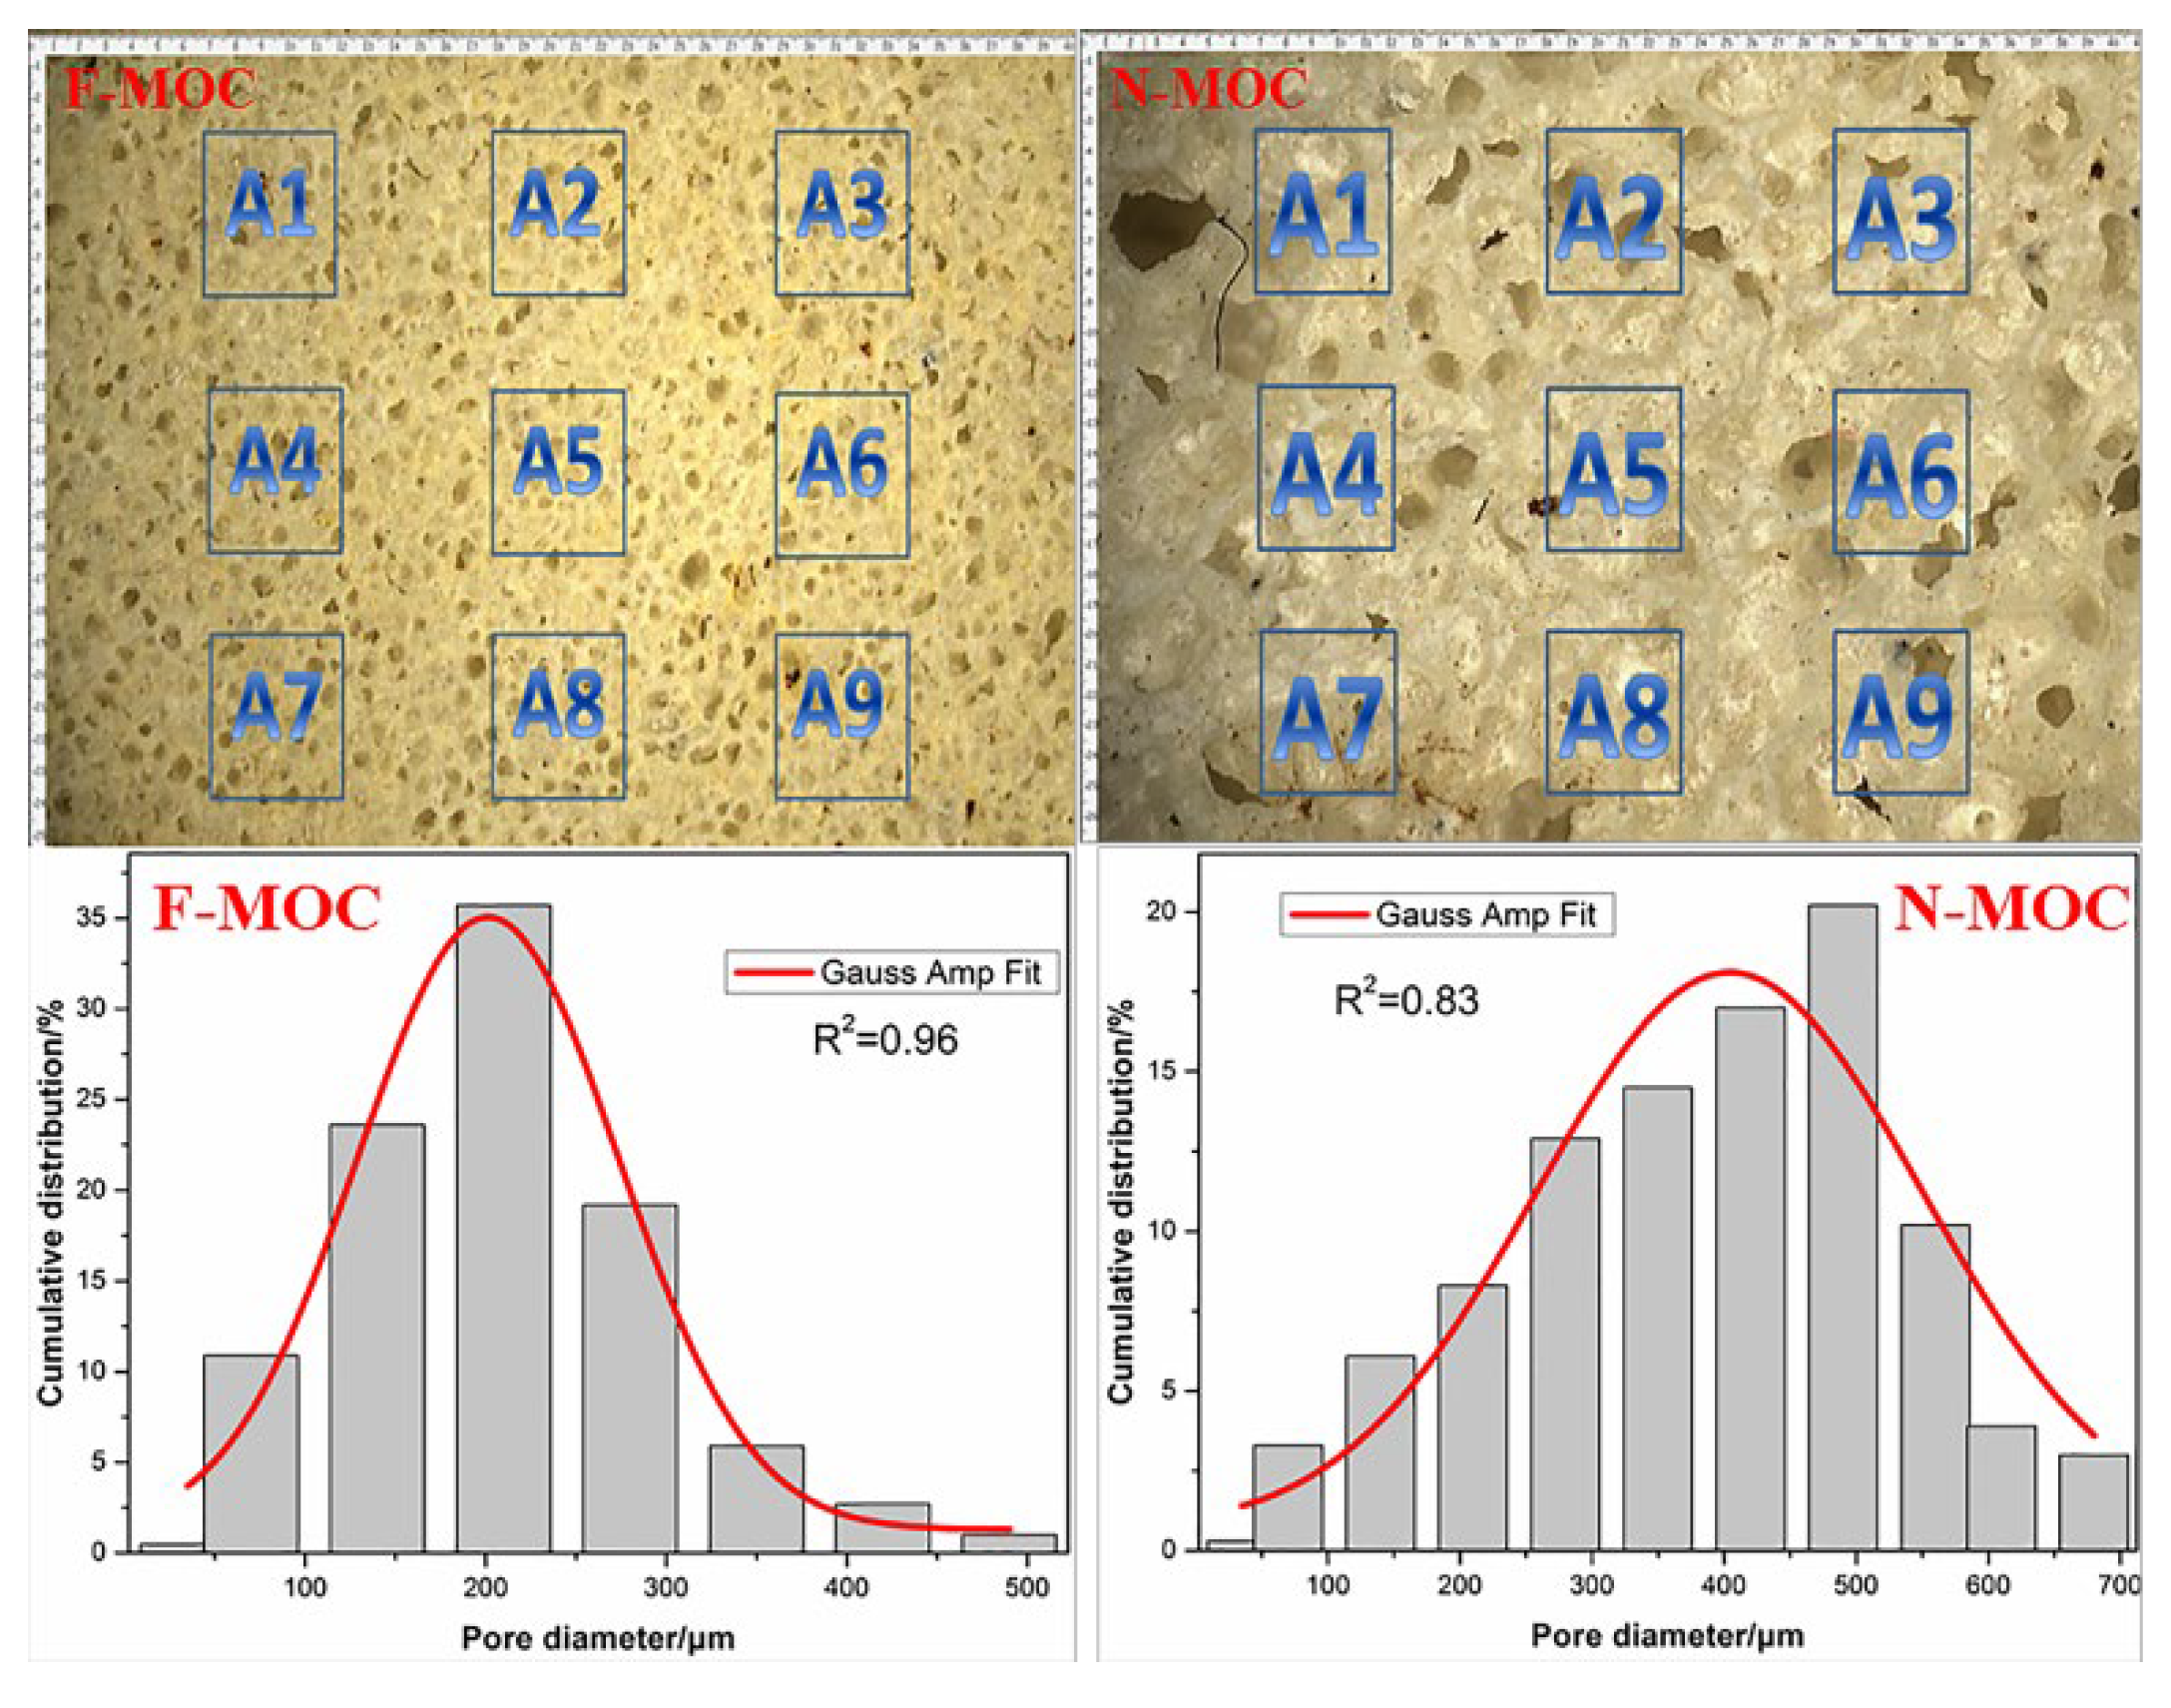
Generally, the density grade of foam concrete with good thermal insulation properties is 300–1200 Kg·m−3 [24] Therefore, this study selected MOC samples within the above-mentioned density range for subsequent experiments and analysis. When adding the same content of H2O2, the pore size distribution of F-MOC and N-MOC is shown in Figure 3 (F-MOC bulk density was 540 kg·m−3, N-MOC bulk density was 301 kg·m−3). The pore size of F-MOC was small, and the pore size distribution was very uniform, mainly concentrated in 210 ± 25 μm. On the contrary, N-MOC had a larger pore size and a wider distribution. The most easily achieved pore size distribution was 490 ± 25 μm, which indicates that the addition of FAS-TEOS copolymer can make the pore size of the foamed MOC foam smaller.
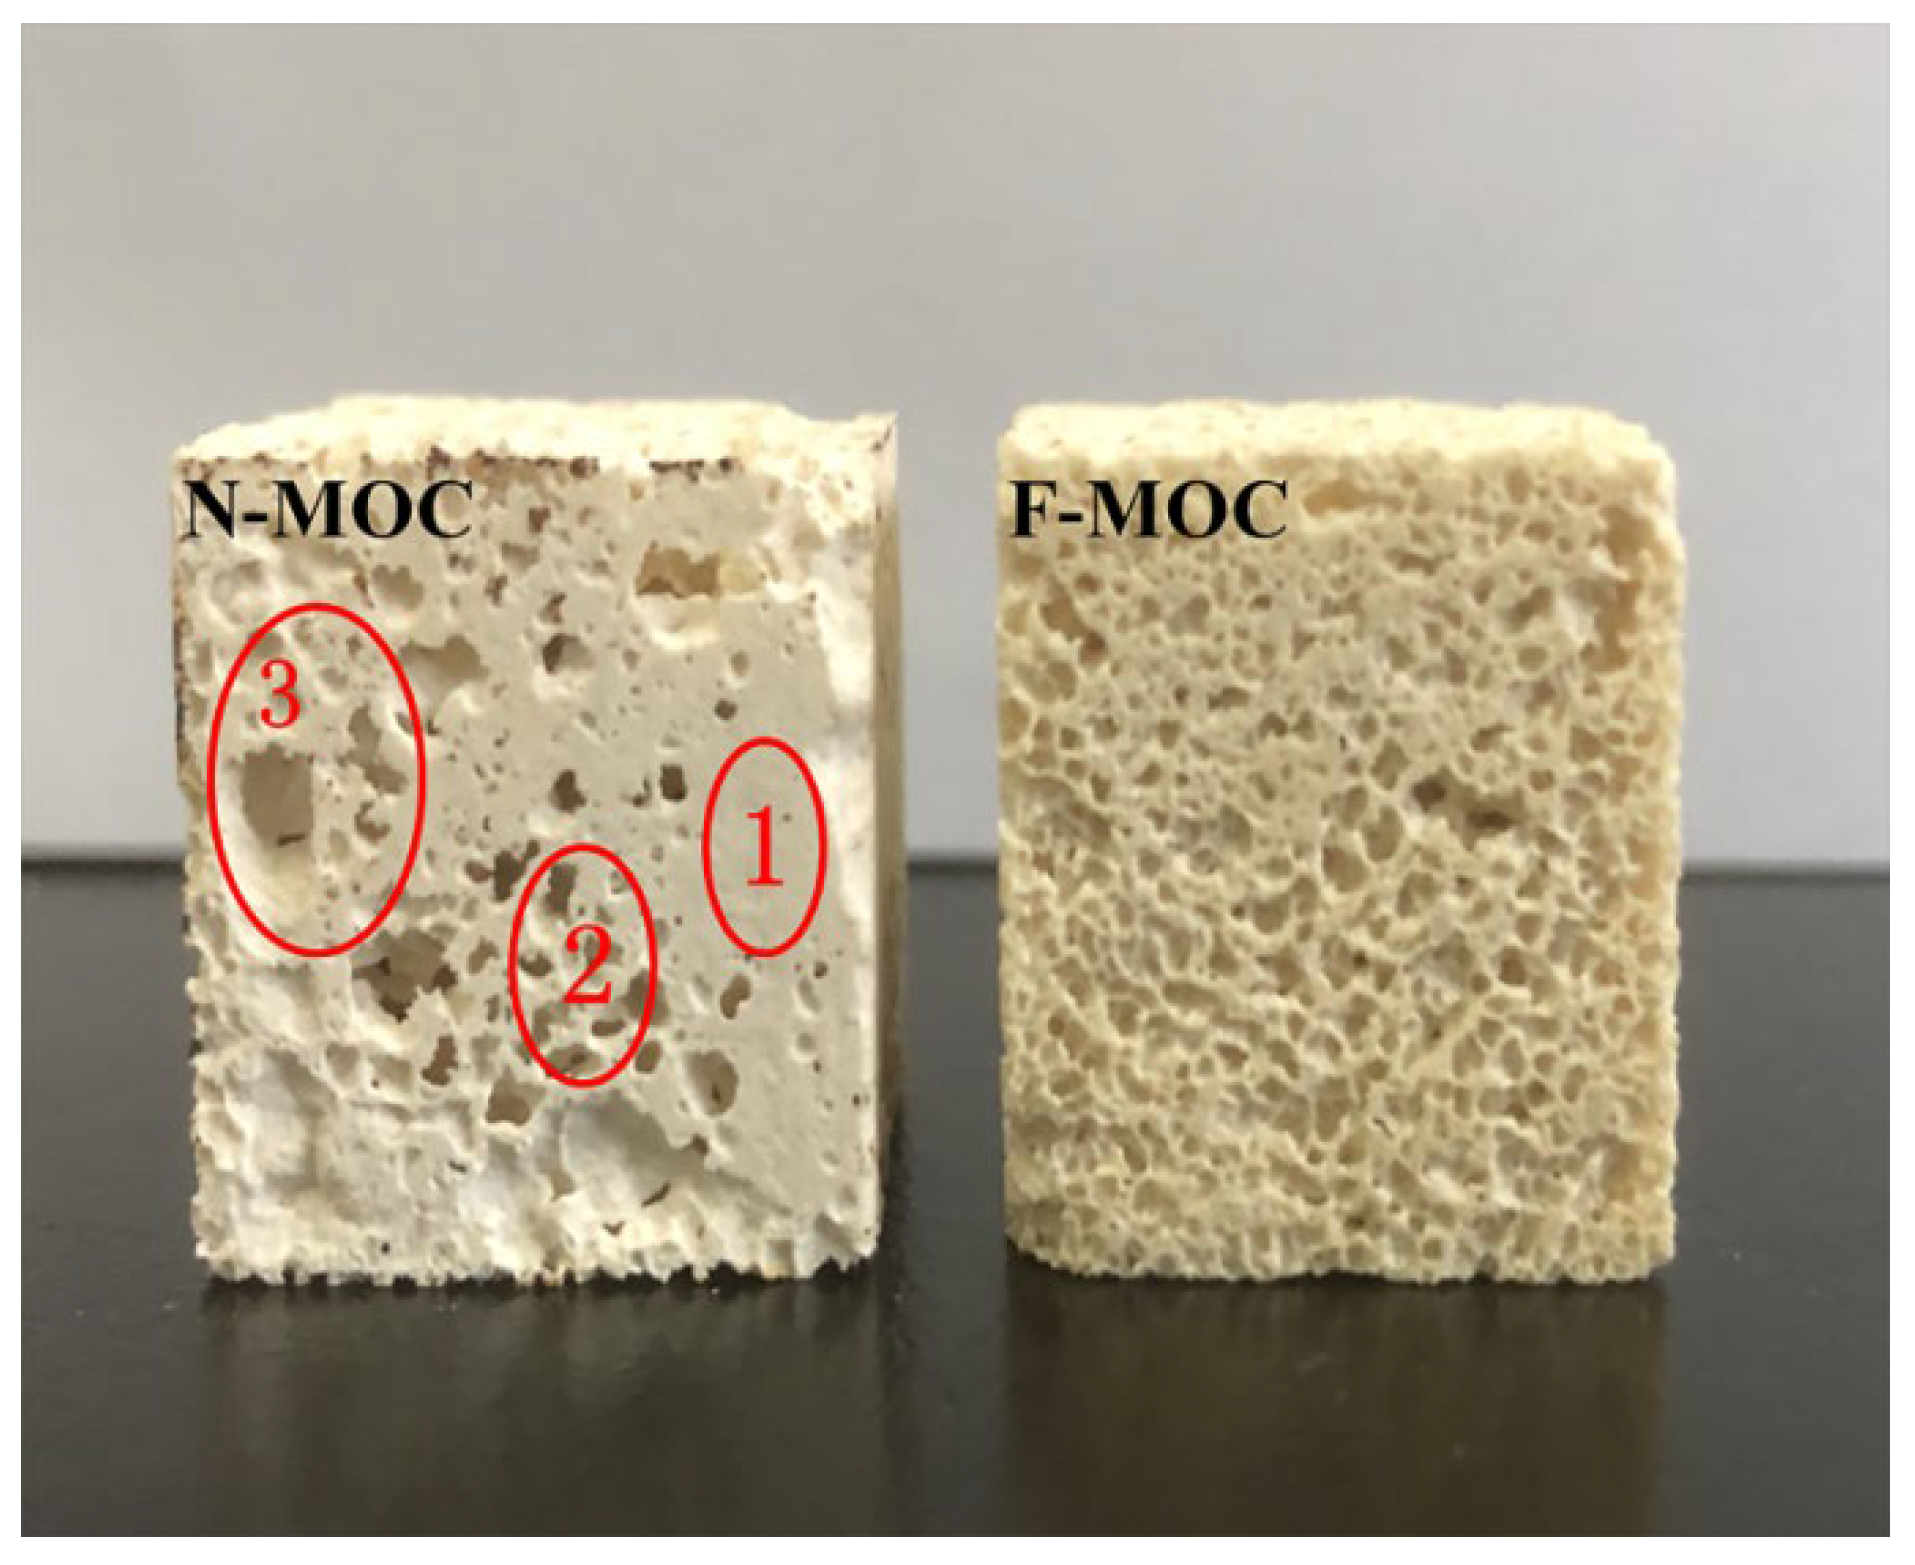
We chose F-MOC with a bulk density of 500–600 kg·m−3 to compare with N-MOC with similar bulk density (Figure 4). Although F-MOC and N-MOC had similar bulk densities, the pore size of N-MOC was significantly larger than that of F-MOC. The N-MOC sample had a large pore area and many solid parts, but the pores of the F-MOC foam material were very evenly distributed throughout the material. A common disadvantage of the chemical foaming method is the wide pore size distribution of the foam [25]. In our research, adding FAS-TEOS copolymer to the MOC foam system could significantly improve the stability and the uniformity of the pores. It shows that, in the same bulk density of foamed MOC material, an increase in the number of independent pores on F-MOC results in better thermal insulation performance [26].

3.2. Mechanical Properties and Phase Composition of Super-Hydrophobic Foamed MOC Materials

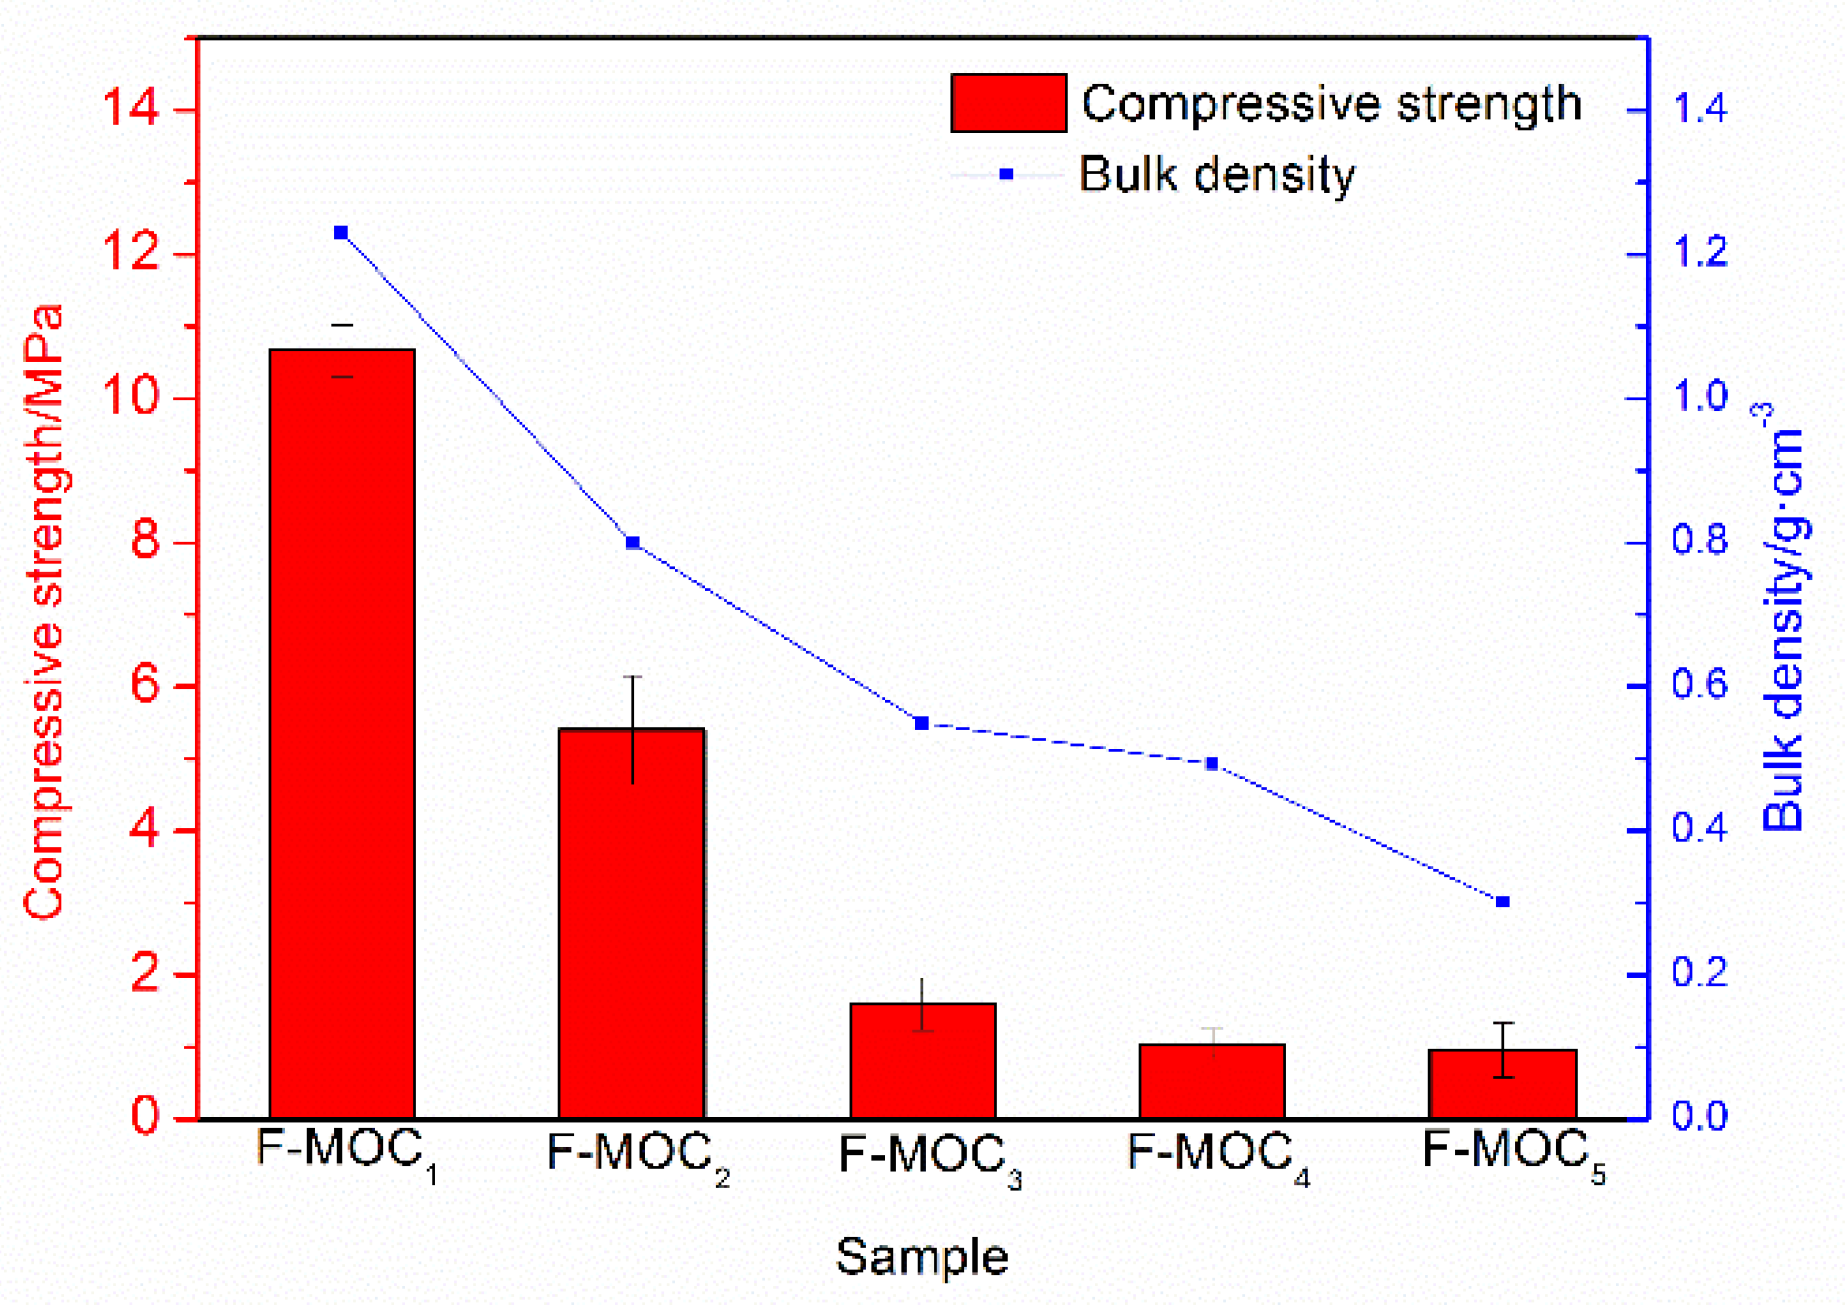
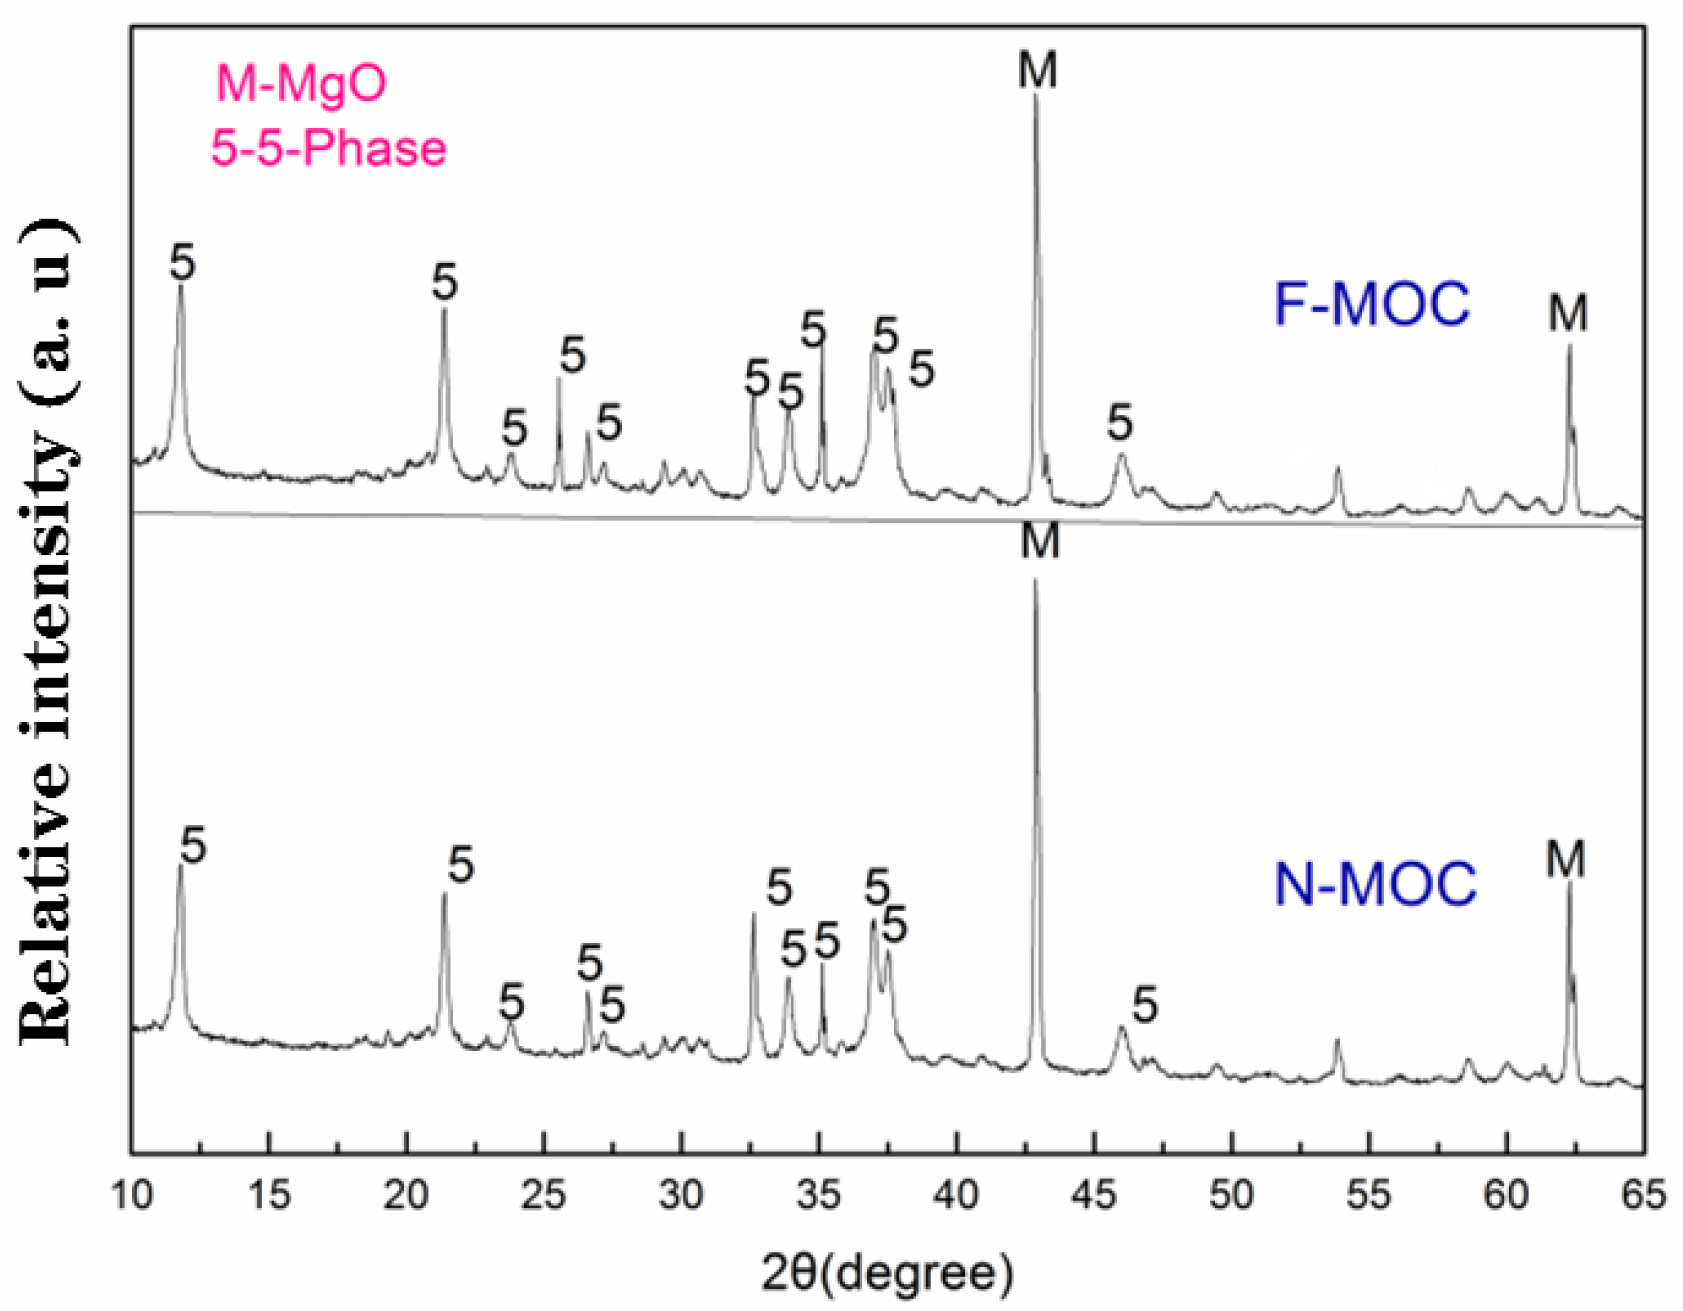
Figure 5 shows the corresponding compressive strength of F-MOC samples of different bulk density. It can be seen from the figure that, when the bulk density of the samples dropped from 1200 kg·m−3 to about 300 kg·m−3, the samples’ compressive strength also dropped from about 10 MPa to 0.8 MPa. Compared with the compressive strength of N-MOC corresponding to similar bulk density, the decrease was small or even negligible, and it was similar to the compressive strength of MOC foamed materials with similar bulk density in the literature. It can reach the compressive strength standard required in the application of thermal insulation materials [27]. The XRD analysis of F-MOC and N-MOC in Figure 6 also found that the main diffraction peaks of them were the same, indicating that the addition of FAS and TEOS had no effect on the phase composition of MOC. The five-phase relative of F-MOC calculated by jade software was 55.9%, and that of N-MOC was 59.4%, which was only a decrease of 3.5%. The P5 phase was retained as the main strength phase, indicating that the decrease in compressive strength was the result of the porous structure rather than the changes of the five-phase.

3.3. The Presence of Organosilane in MOC Foam Materials

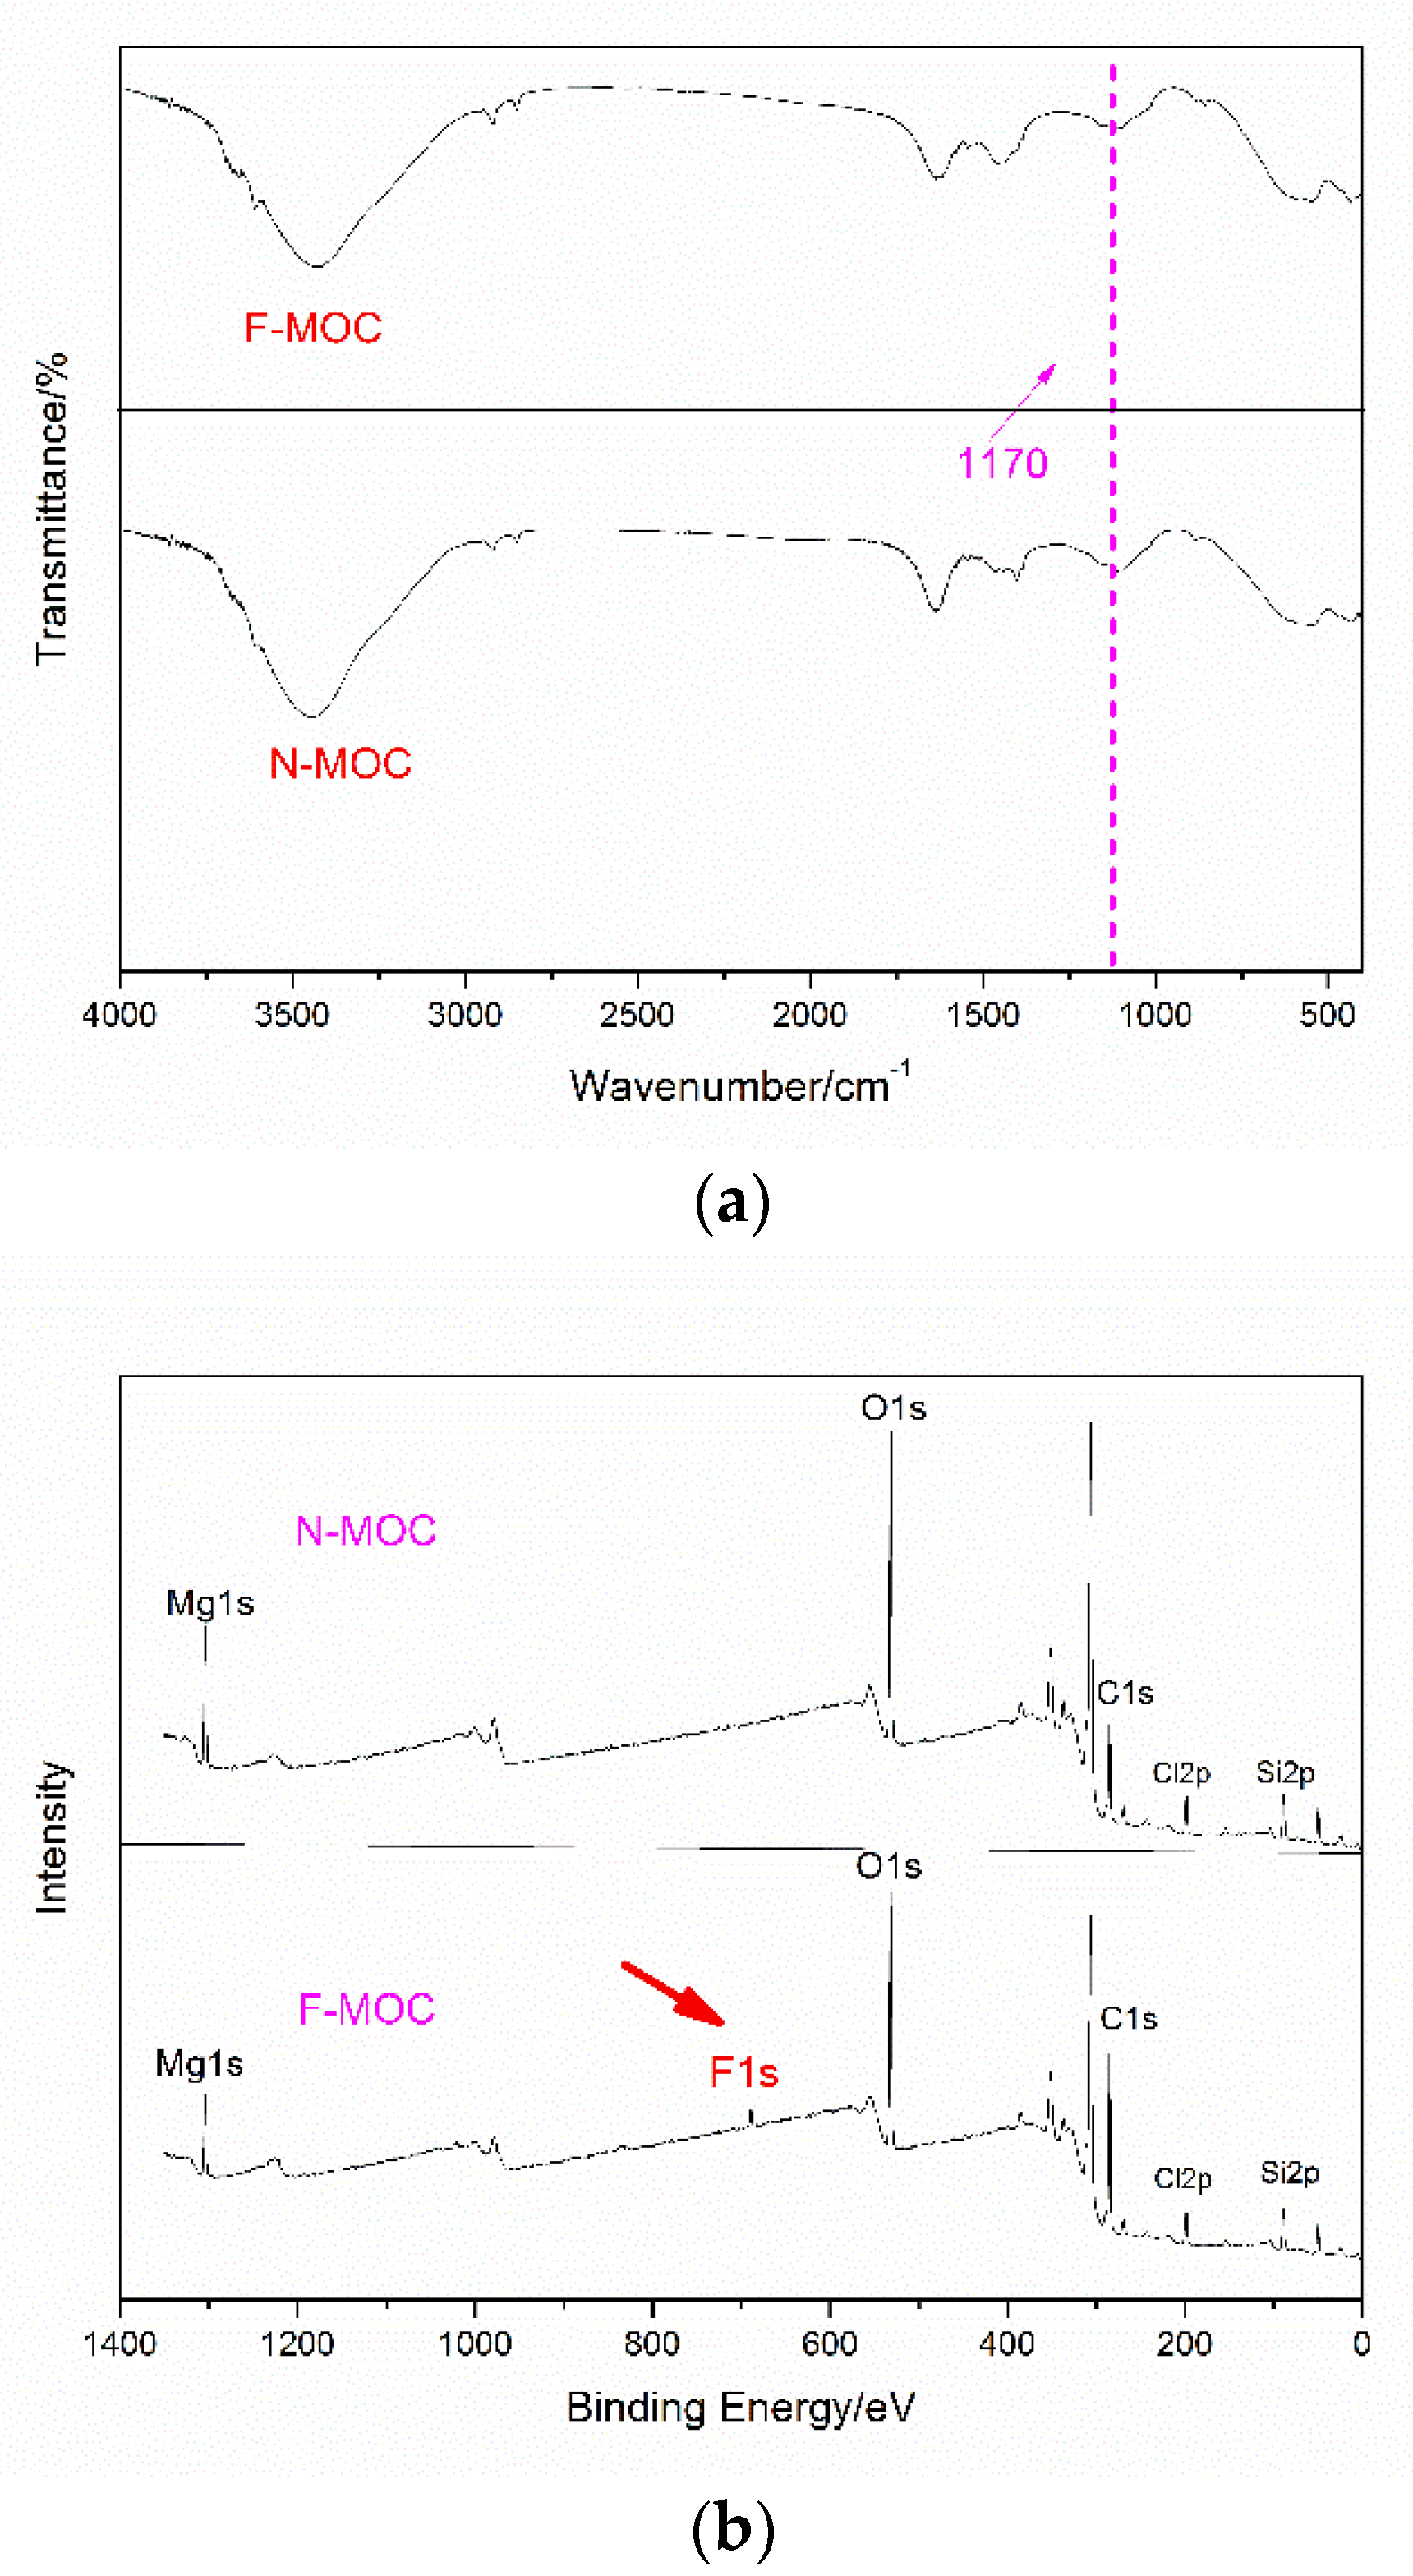
The comparison of the Fourier infrared test of F-MOC and N-MOC in Figure 7a showed that the characteristic C-F peak that should have appeared near 1170 cm−1 [28] was covered by the infrared peak of the magnesium oxychloride cement itself. However, in the XPS energy spectrum test of Figure 7b, it was found that the characteristic peak of the F element appeared at 690 eV [29], indicating that the F element entered the MOC foam material.
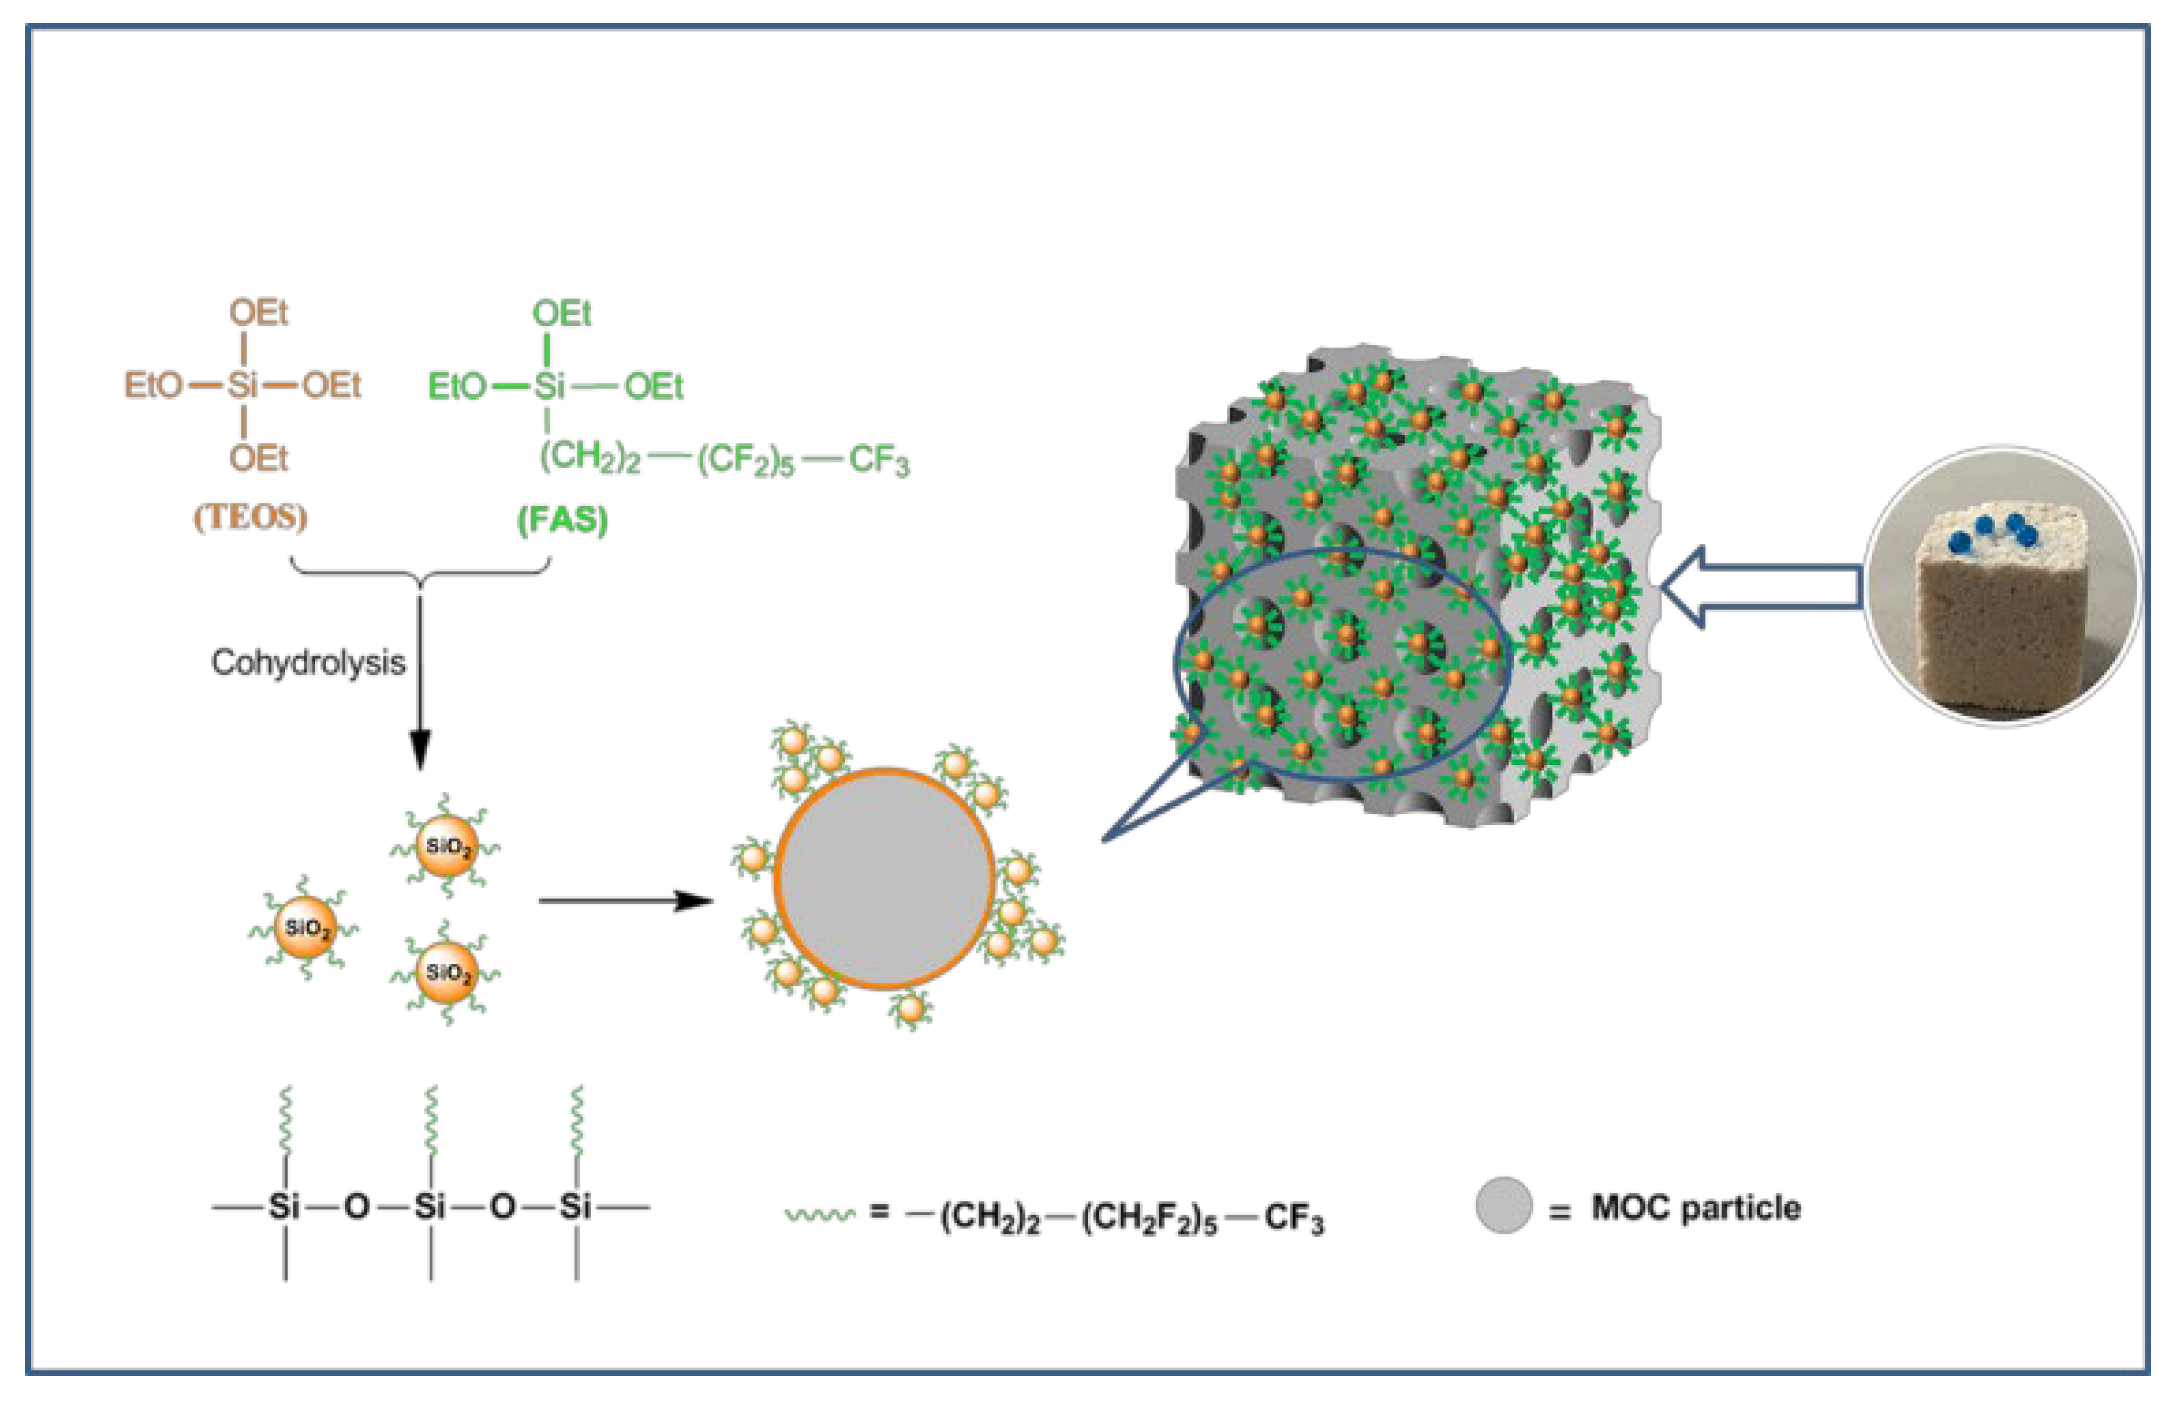
The pH of the magnesium chloride solution was about 6.3 to 6.5. In this near-neutral environment, the hydrolysis of FAS and TEOS was relatively slow. However, when adding H2O2, the content of hydroxyl radicals in MgCl2 solution increased [30], and hydroxyl radicals significantly promoted the hydrolysis and the condensation of silane [31], thus FAS and TEOS were added to the magnesium chloride solution. The first hydrolysis could make it more fully hydrolyzed. Due to the consumption of hydroxyl radicals, part of H2O2 was decomposed in the pre-hydrolysis stage. The more TEOS content there was, the more H2O2 was consumed. As TEOS increased, this resulted in the addition of the same H2O2. The content of F-MOC in the foamed material was higher than that of N-MOC. When the magnesium chloride solution containing organosilane was mixed with active MgO, the pH value of the MOC system increased to 8–9.5 [32], and the alkaline environment further promoted the polycondensation reaction of the pre-co-hydrolyzed product of TEOS and FAS. Studies have shown [33], under normal conditions, FAS and TEOS can be copolymerized into silica spheres with 40–200 nm fluoroalkyl chains. The silica spheres with fluoroalkyl chains were uniformly dispersed throughout the MOC gelling system, resulting in the overall hydrophobicity of the foamed MOC material (Figure 8).

3.4. Hydrophobicity of Foamed MOC Materials

When water was dropped on the surface of the N-MOC (we added a small amount of methylene blue to the water for easy observation), the water immediately penetrated the sample through the holes, and after adding TEOS copolymer with FAS and FS samples, the same volume of water droplets could stay on the material on the surface, and the contact angle of water droplets on the surface of the material was greatly increased.
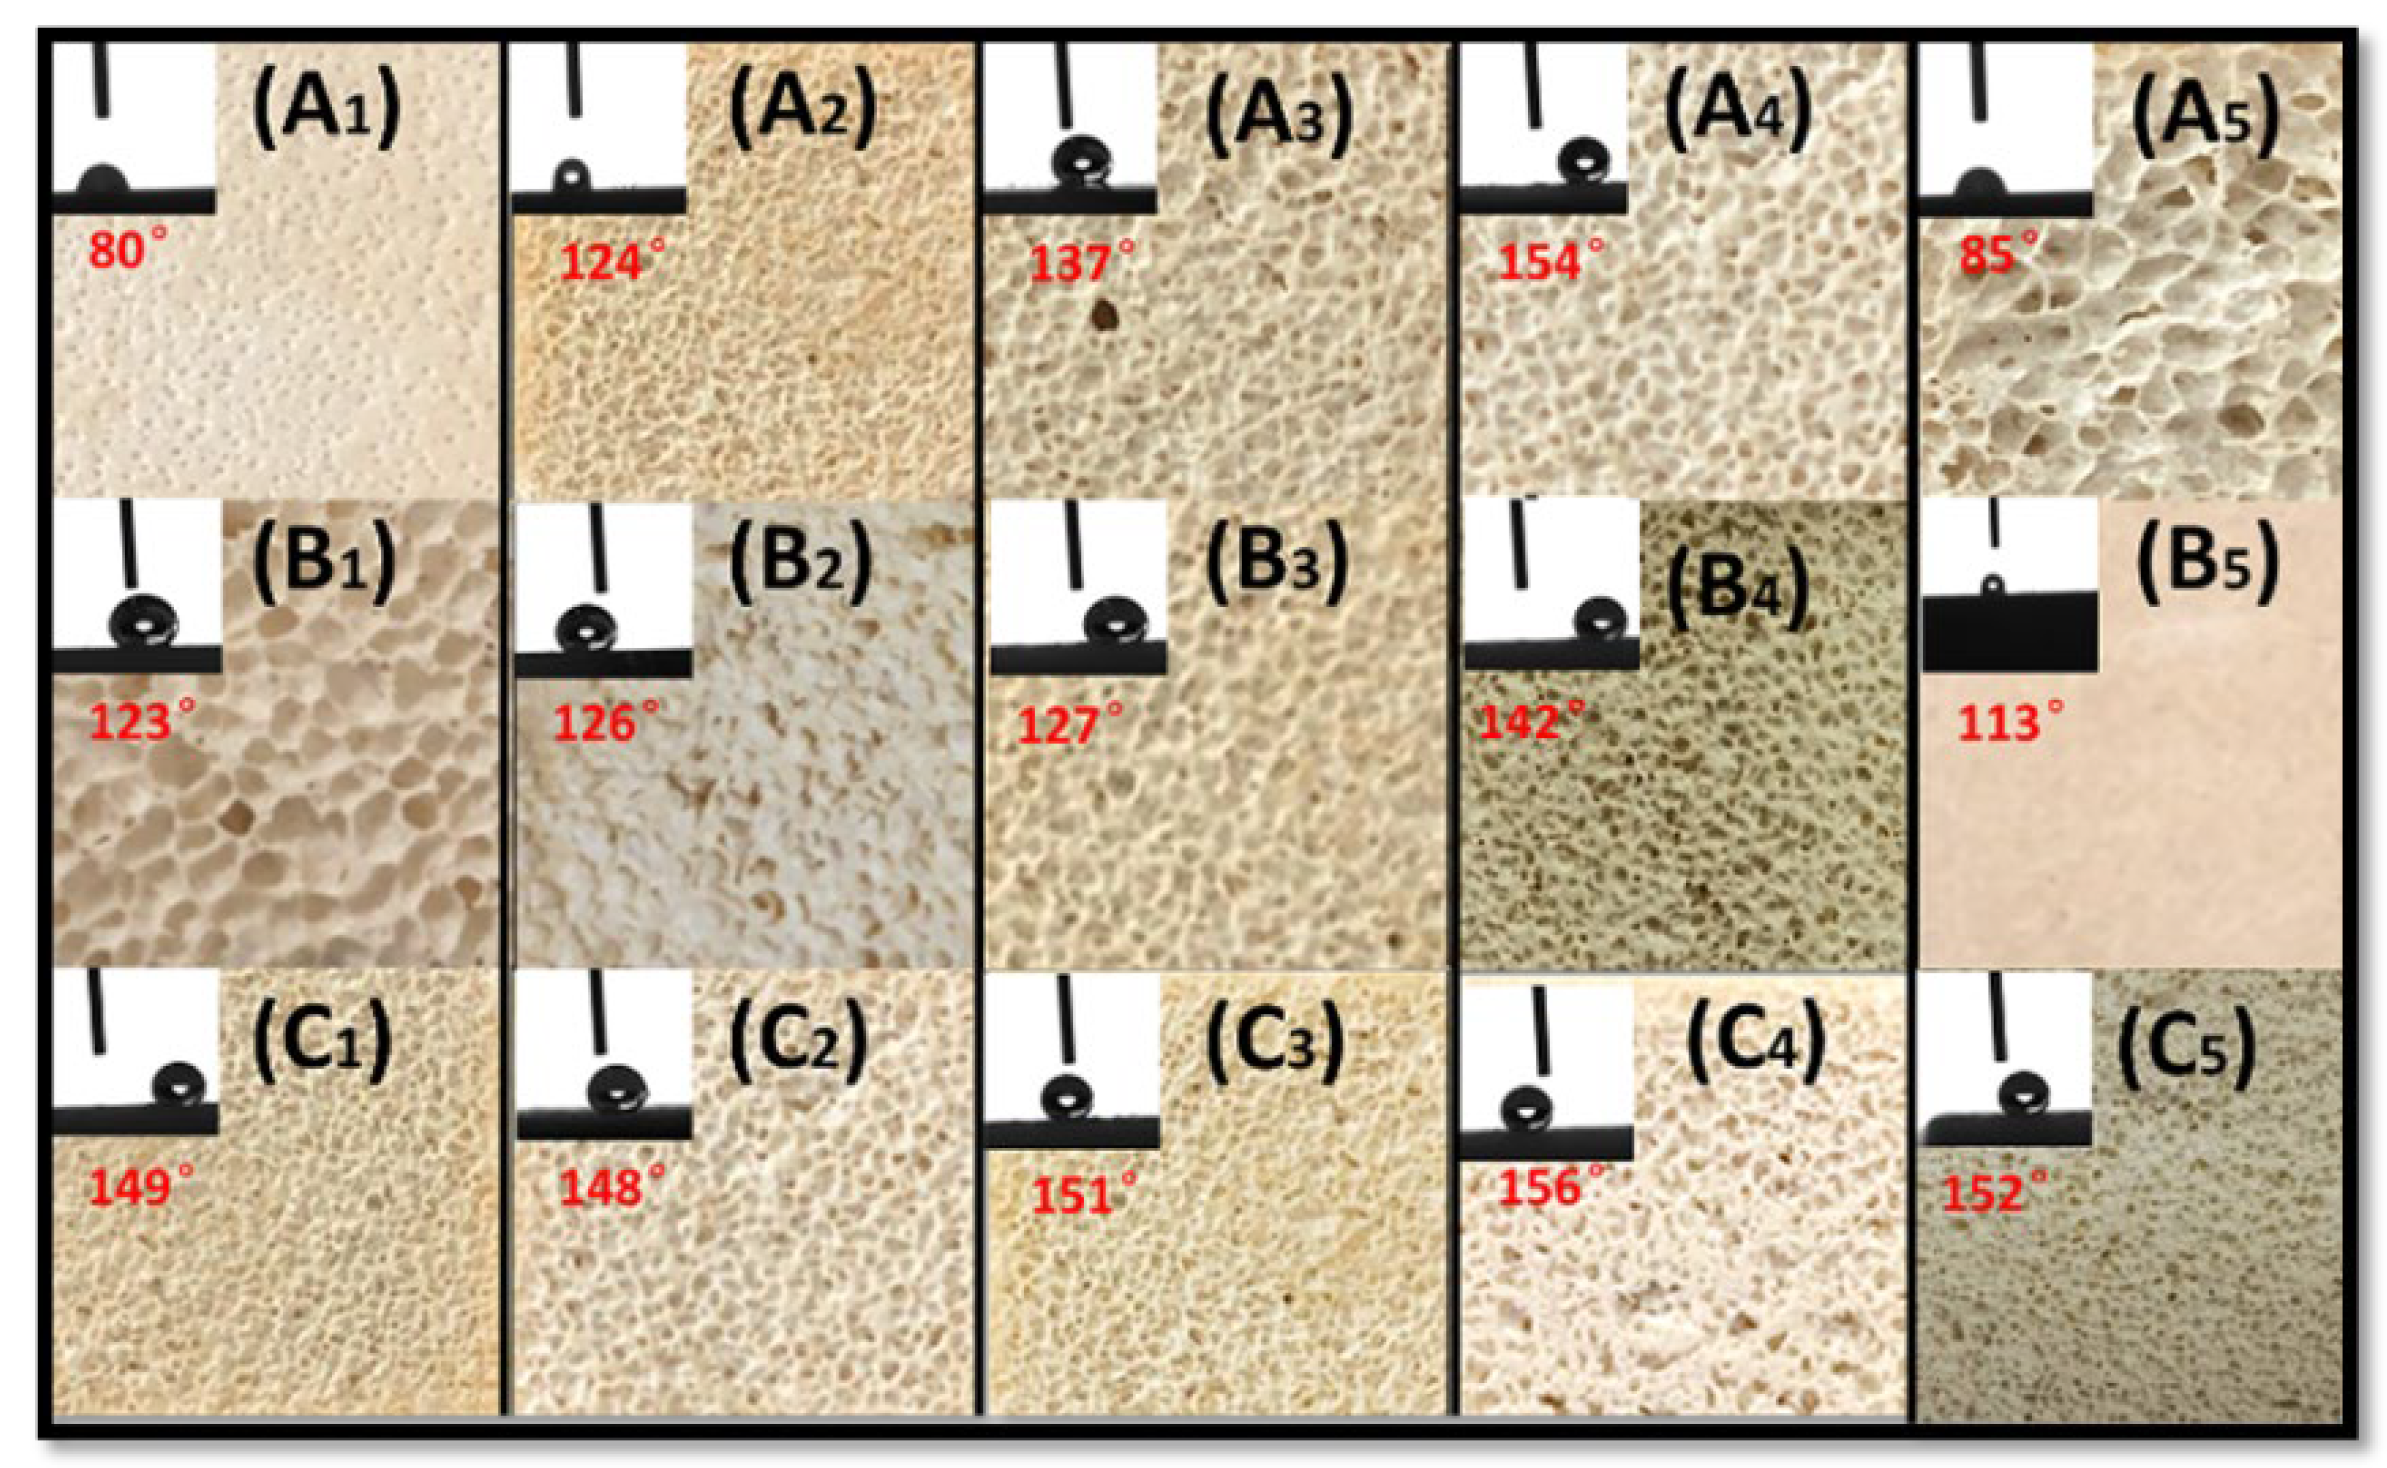
In Figure 9, the FAS content of A1–A5 was 1%, n (FAS): n (TEOS) = 1:8; when the content of H2O2 increased from 4% to 12%, the contact angle changed. The results show the bulk density of F-MOC was reduced from about 1200 Kg·m−3 to about 200 Kg·m−3. The water contact angle increased first and then decreased. When the H2O2 content was 10%, the water contact angle reached the highest 154°.
B1–B5 were the changes in contact angle when the additional amount of H2O2 was fixed at 10%, and the TEOS content increased from n (FAS): n (TEOS) = 1:6 to n (FAS):n (TEOS) = 1:14. The result showed that the water contact angle increased first and then decreased, reaching a maximum of 142° at n (FAS): n (TEOS) = 1:8.
C1–C5 were the fixed additional amounts of H2O2, which was 10%, n (FAS):n (TEOS) = 1:8; the FAS content increased from 0.5% to 2.5%. When the FAS content increased from 0.5% to 1%, the water contact angle ranged from 140° to 156° with a larger increase. When the FAS content continued to increase, the water contact angle remained above 150° and did not continue to increase.
Summarily, the additional amount of H2O2 was 10%, n (FAS):n (TEOS) = 1:8. When the FAS content was 1%, the F-MOC obtained had the highest water contact angle and had the best hydrophobic effect. The pores of the material provided suitable roughness on the surface of the material. Thus, low surface energy fluorinated alkyl chain and certain roughness make the hydrophobic effect of F-MOC the best.
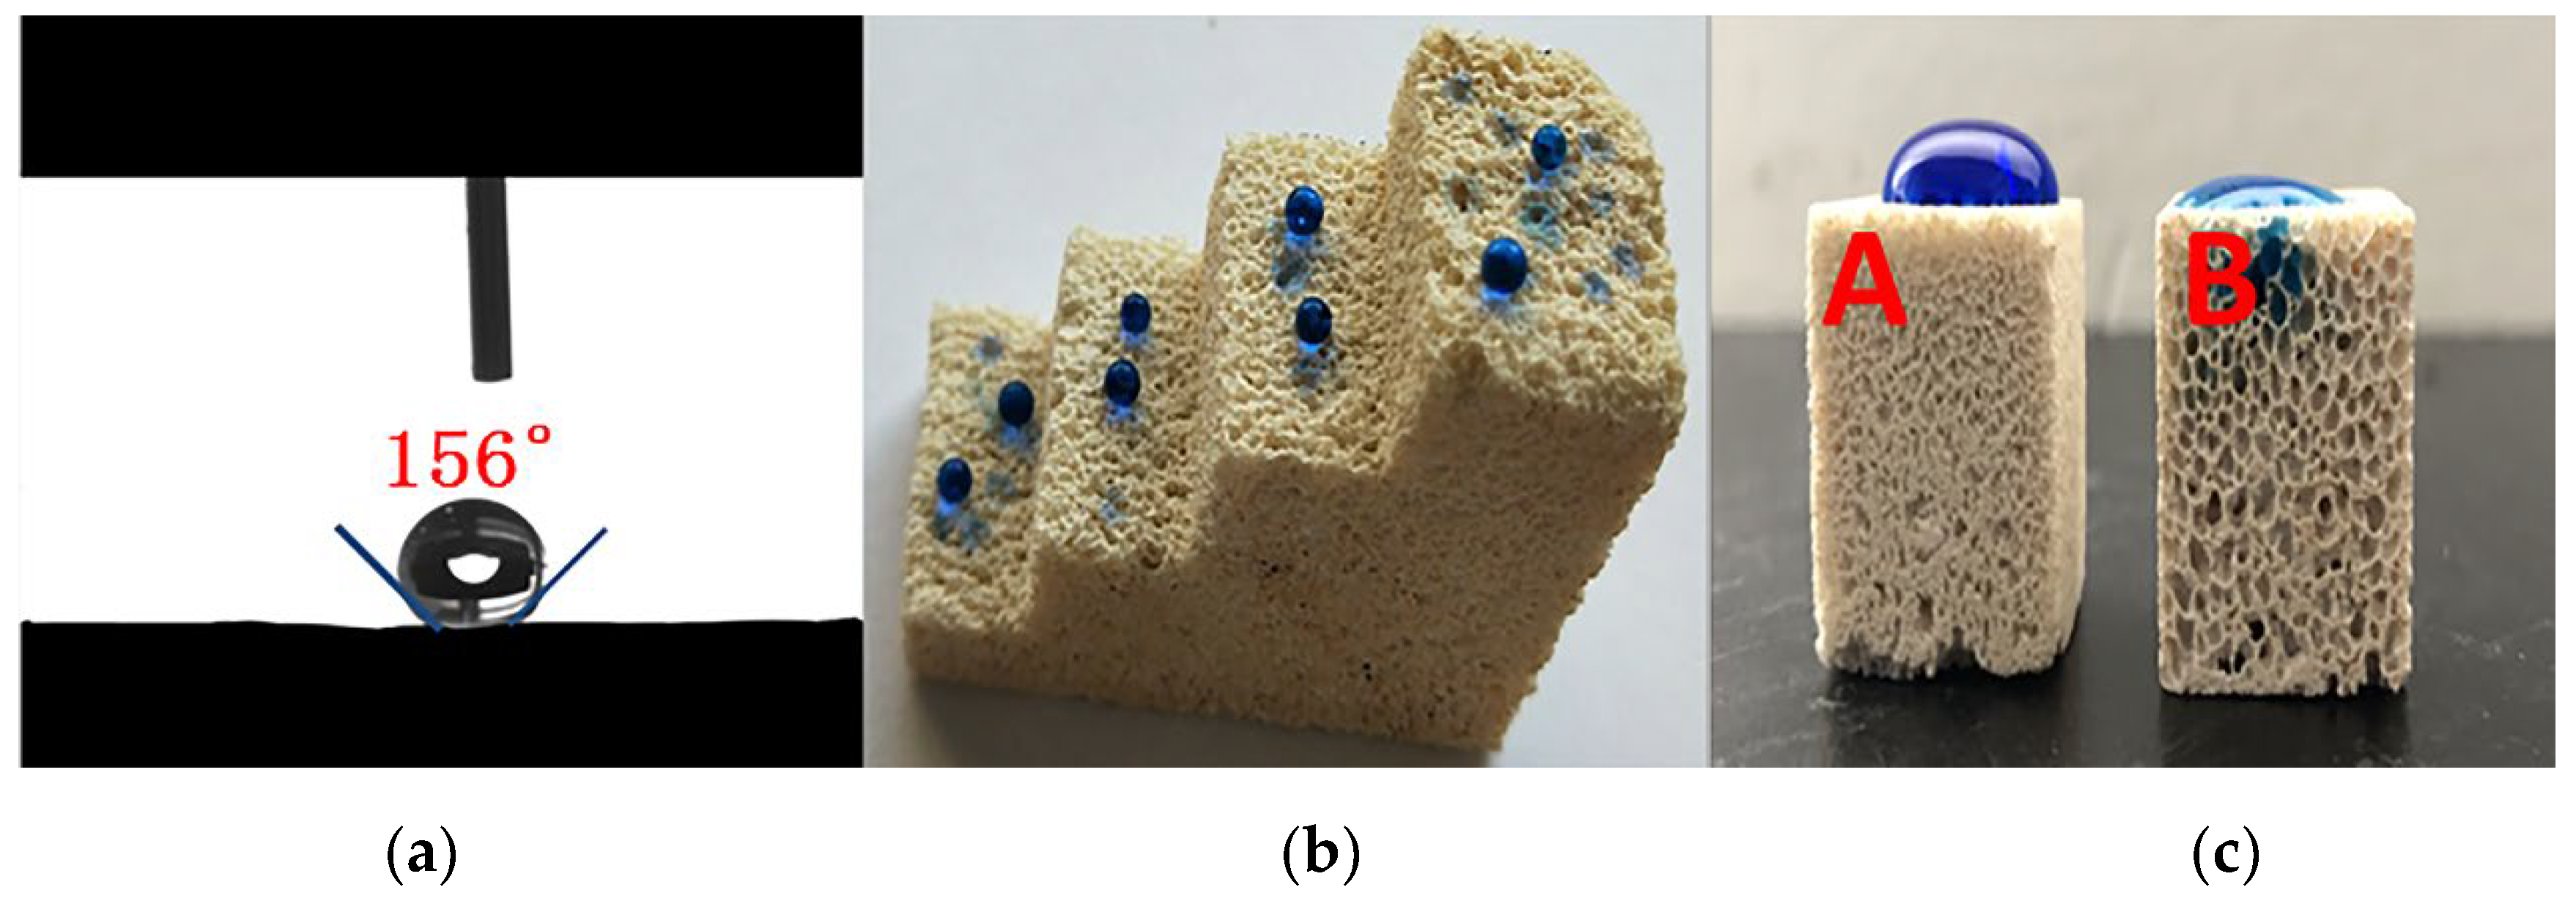
Through a series of tests, the samples with the largest water contact angle were selected (A is F-MOC, B is N-MOC). Water contact angle could reach 156°, as is shown in Figure 10a. As shown in Figure 10b, the sample was mechanically cut to retain the internal incision of the foam material. The water contact angle of all points on the surface of the foam material exceeds 150°,and the solution will always remain on the surface of the F-MOC without penetration as shown in Figure 10c.which achieved the inherent hydrophobic and has more advantages in applications than the hydrophobic modification of surface coating and dipping.

3.5. Engineering Durability of Foamed MOC Materials

Engineering durability is a key issue in the application of materials, thus the long-term stability of foamed hydrophobic materials in complex environments is very important. Therefore, we studied the influence of mechanical polishing and chemical corrosion on the hydrophobic properties of the samples. The result of the mechanical grinding experiment is shown in Figure 11. With the increase of the thickness of mechanical grinding, the water contact angle of the sample did not decrease significantly, indicating that the fluorine-containing alkyl chains were evenly distributed in the sample, giving the material overall hydrophobicity. The result of immersion in NaCl, NaOH, and HCl solutions in Figure 12 showed that the material still maintained a high water contact angle, indicating the chemical stability of the foamed hydrophobic MOC material in harsh environments such as acid-base and salt solutions, proving that composite materials have potential value in engineering applications.

3.6. The Moisture Absorption Rate and Dehumidification Rate of Foamed MOC Material

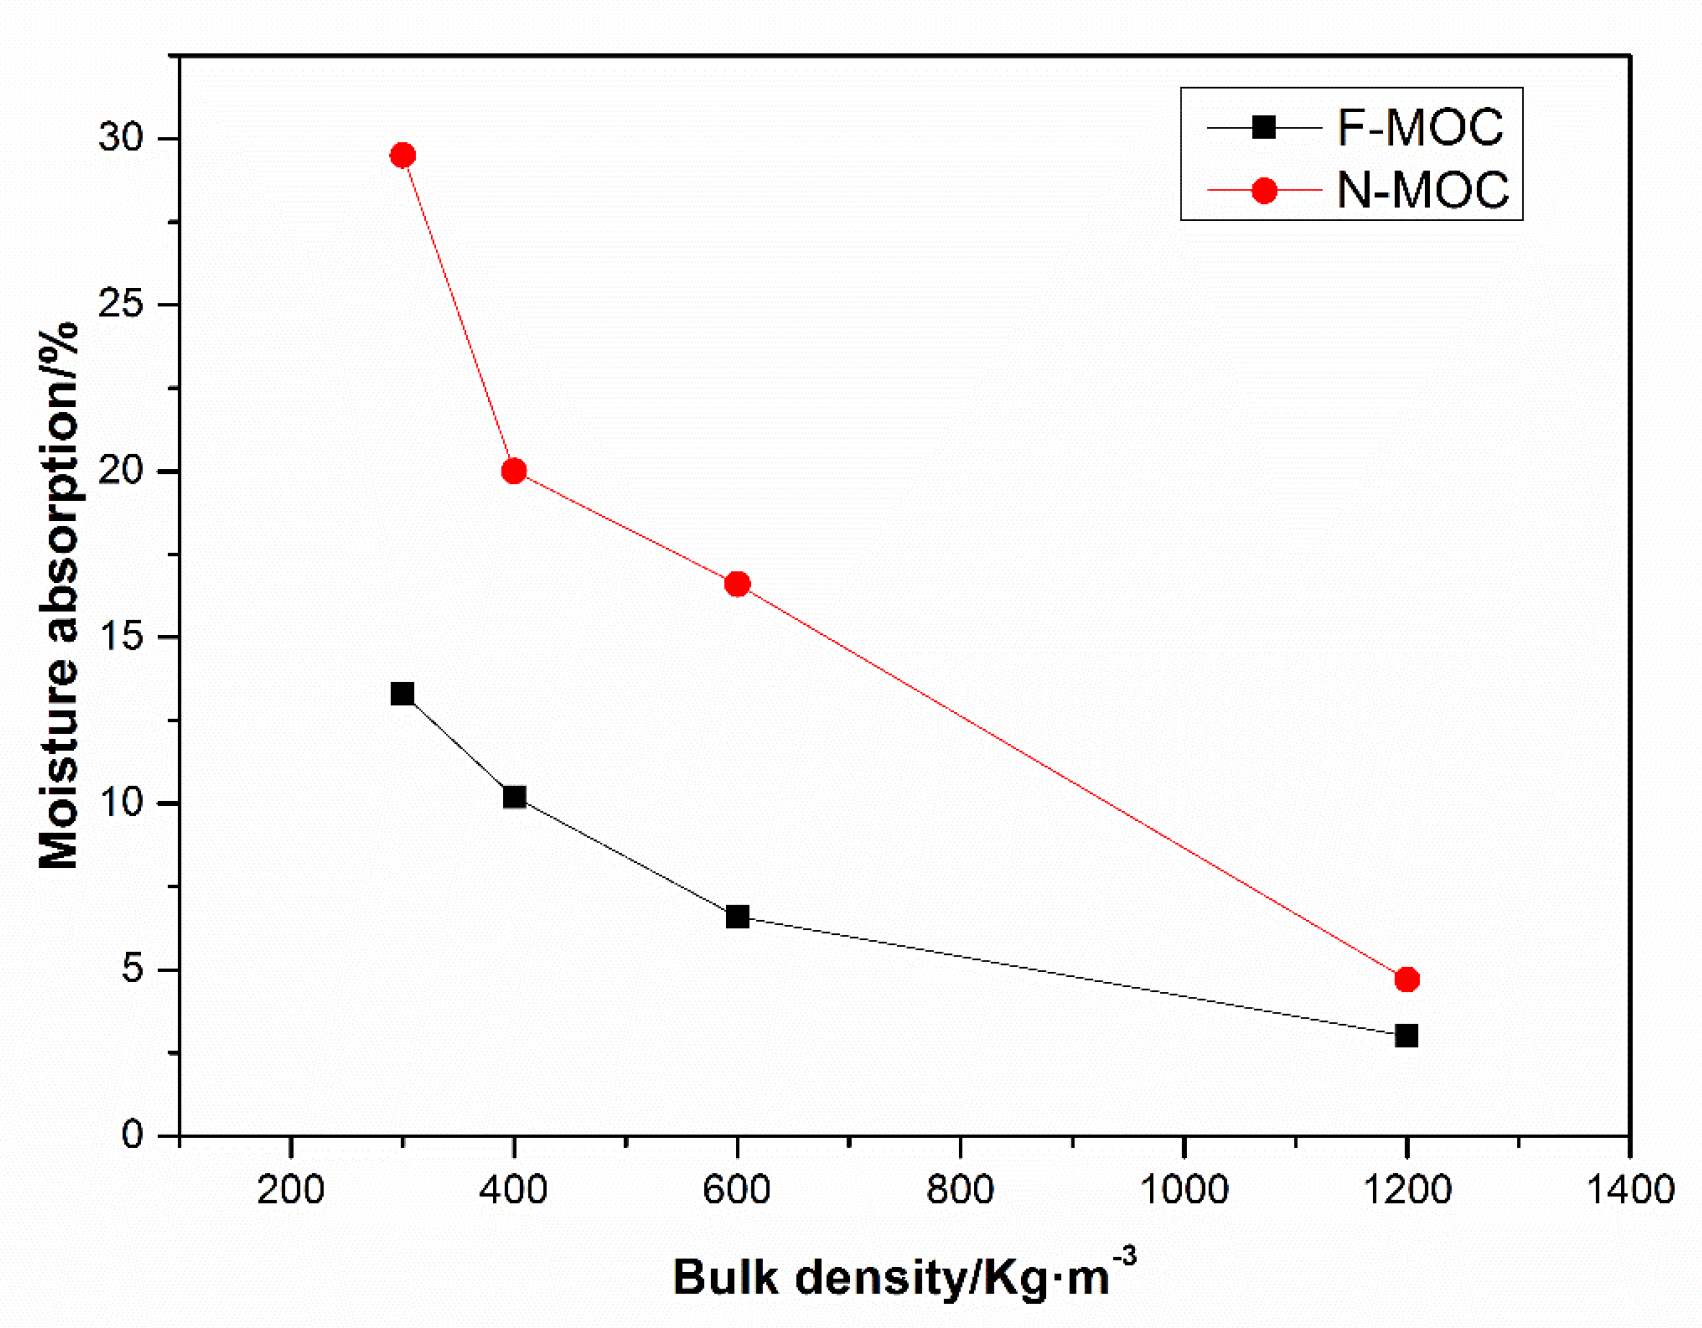
The thermal conductivity of air in the thermal insulation material was only 0.02 w/(m·K). When water vapor entered the cavity of foamed cement, the thermal conductivity of water was 0.59 w/(m·K), and its thermal insulation performance was greatly reduced. Therefore, hygroscopicity and water content had a significant impact on the thermal conductivity of foamed cement. The test environment was to simulate the temperature and the humidity of the material; the temperature was 30 °C, the relative humidity was 100%, and the moisture absorption rate tested with different densities of F-MOC and N-MOC is shown in Figure 13. The results show that, under the same density, the hygroscopic rate of F-MOC was less than that of N-MOC. When the bulk density was approximately 1200 Kg·m−3, it was difficult for water vapor to enter the sample due to the small pore size. After cleaning the surface, the moisture absorption rate of F-MOC and N-MOC was close, as it only decreased by 1.7%, but when the bulk density decreased to 300 Kg·m−3 due to the increase of the specific surface area, the moisture absorption rate of F-MOC was 13.3%, while that of N-MOC was up to 29.5%.
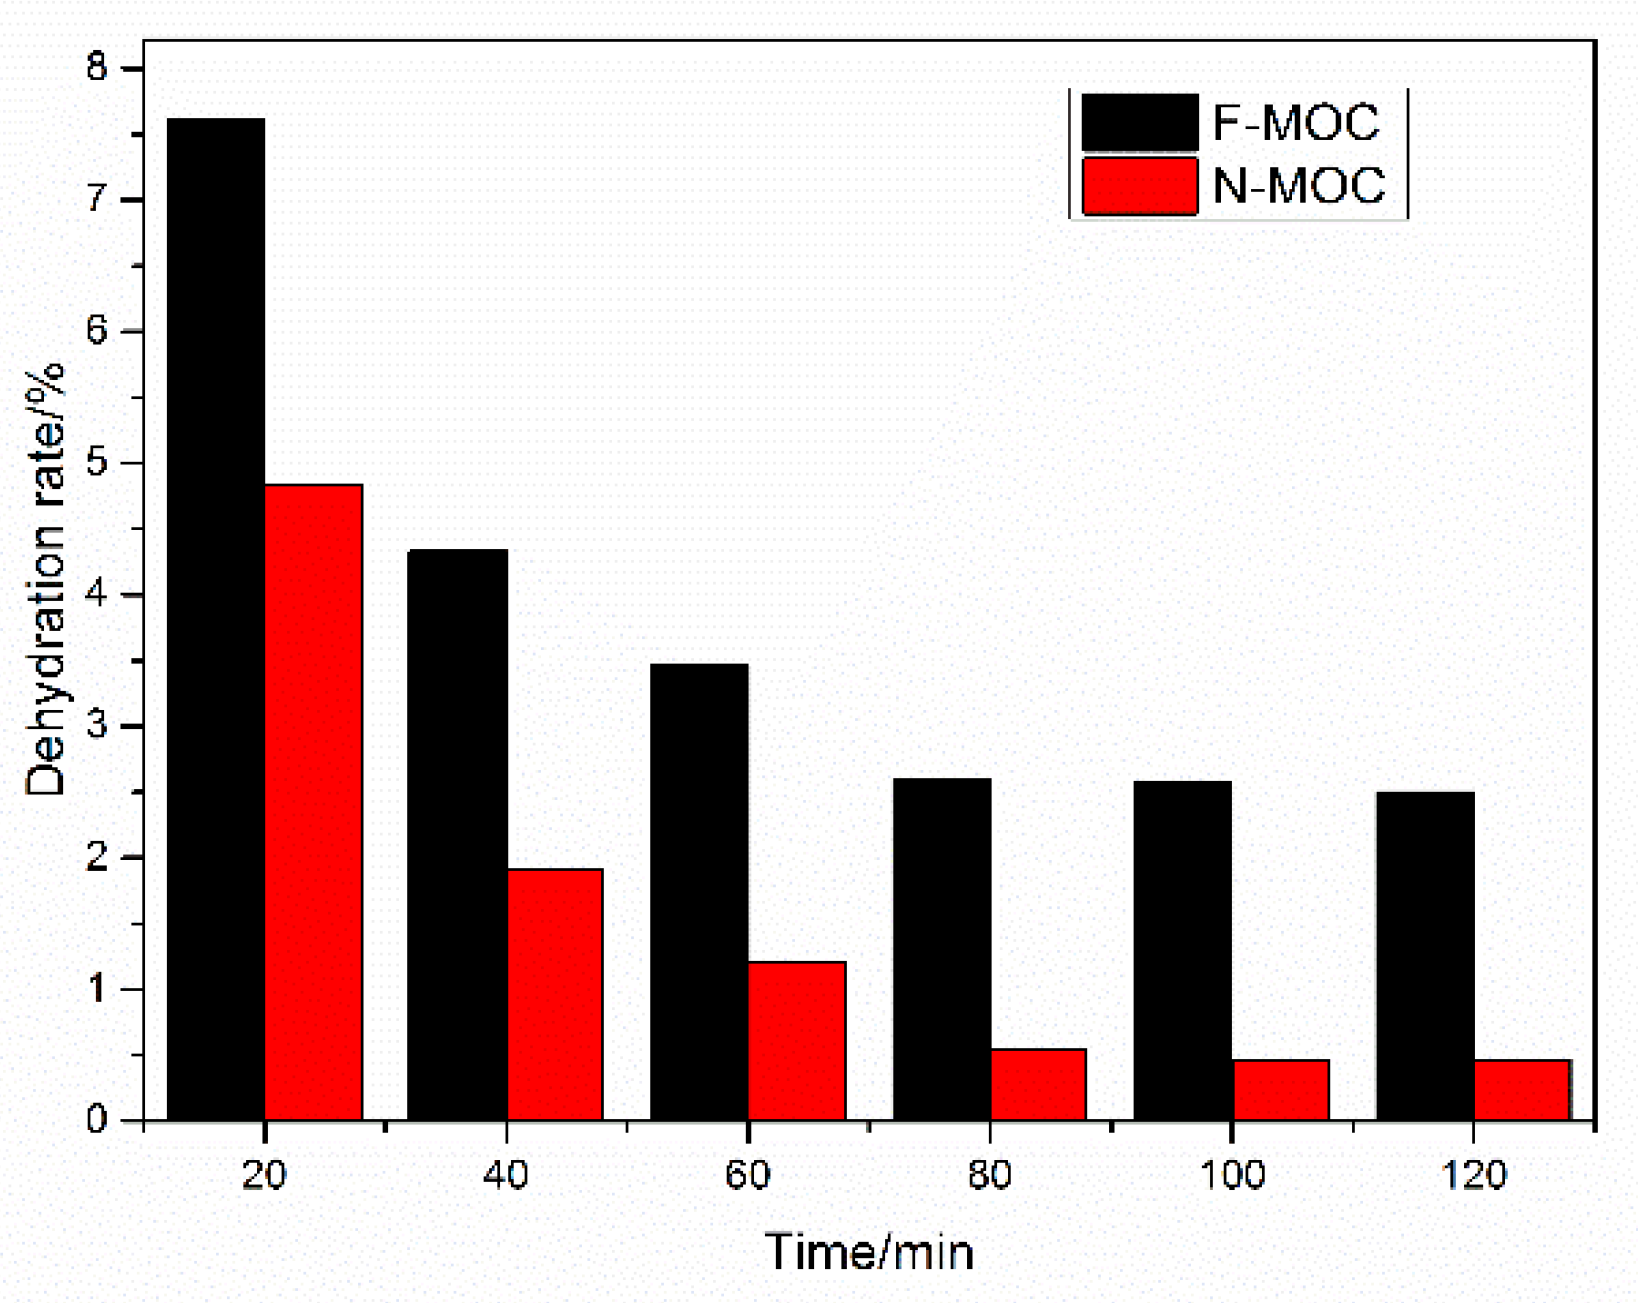
The dehydration rate of F-MOC and N-MOC is as follows in Figure 14. Dehydration experiments of F-MOC and N-MOC with a bulk density of approximately 600 Kg·m−3 after being blistered for 120 min at 30 °C showed that the quality of F-MOC could be restored to 98.1% of the original quality, while N-MOC only could be restored to 83.2% of the original quality. The high dehydration rate of F-MOC indicates that the water in the pores of the foamed material was the water that adhered to the surface, which was easy to evaporate and remove, while the low dehydration rate of N-MOC indicates that some of the water in the pores had been immersed in the MOC gelling material. Internally, we know that the mechanical properties of MOC materials decrease significantly in long-term blisters [34], which also indicates that F-MOC materials have better resistance to water vapor and can maintain their initial strength during long-term water vapor.

4. Conclusions

In this study, TEOS and FAS were prehydrolyzed in MgCl2 solution containing H2O2 as a blowing agent and then mixed with MgO powder to further hydrolyze and synthesize hydrophobic foamed magnesium oxychloride cement. The properties of cement were characterized and compared to ordinary foamed magnesium oxychloride cement. The results are the following:
  • Firstly, we pre-hydrolyzed TEOS and FAS in the MgCl2 solution. When the MgO and the MgCl2 solutions were mixed, the pH of the system rose to weakly alkaline, which further catalyzed the hydrolysis condensation of TEOS and FAS, and the XPS results demonstrate that the fluoroalkyl chain was successfully introduced into F-MOC. The presence of TEOS made the F-MOC normal pore size distribution curve obtained by adding the same H2O2 foaming agent content thinner than the N-MOC, and the pore structure of the material was more uniform.
  • The overall hydrophobic F-MOC with a bulk density of 300 kg·m−3–1200 kg·m−3 and a water contact angle of 156° was prepared by doping with an organosilane. The XRD result and the calculation of the relative content of five-phase show that the five-phase of F-MOC was the main strength phase, as its relative content was only 3.5% lower than that of N-MOC. Based on compressive strength retention, it prevented moisture intrusion and increased its resistance to water. It fundamentally solved the poor water-resistance of the foamed MOC.
  • With decreasing bulk density, although the moisture absorption rate of F-MOC increased, it was less than that of N-MOC. When the bulk density was 300 Kg·m−3, the moisture absorption rate of F-MOC was 13.3%, while in that of N-MOC, the moisture absorption rate of MOC was as high as 29.5%. In the high-temperature dehydration experiment, the F-MOC mass could be restored to 98.1% of the original mass, while the N-MOC mass could only be restored to 83.2%, indicating that the moisture invading the sample was more evaporated in the form of free water and did not participate in the MOC hydration reaction, effectively preventing the strength loss caused by the collapse of the pore structure caused by hydration.
  • The influence of mechanical polishing and chemical corrosion on the hydrophobic properties of F-MOC show that the composite material has good engineering durability and broad application prospects.

Author Contributions

Conceptualization, R.C. and H.W.; methodology, R.C.; software, S.G.; writing—original draft preparation, J.H.; project administration, R.C. and H.W.; funding acquisition, R.C. All authors have read and agreed to the published version of the manuscript.

Funding

This research received no external funding.

Acknowledgments

The authors gratefully acknowledge financial support from National Natural Science Foundation of China (21571024) and Major Special Science and Technology Projects in Qinghai Province (2018-NN-152).

Conflicts of Interest

The authors declare no conflict of interest.

References

  1. Guan, X.; Zhou, G.; Cui, Y.; Fei, J.; Fan, Y. Effect of different-sizes of hydroxyapatite on the water resistance of magnesium oxychloride cement for bone repair. RSC Adv. 2019, 9, 38619–38628. [Google Scholar] [CrossRef] [Green Version]
  2. Xu, B.; Ma, H.; Hu, C.; Li, Z. Influence of cenospheres on properties of magnesium oxychloride cement-based composites. Mater. Struct. 2015, 49, 1319–1326. [Google Scholar] [CrossRef]
  3. Li, Y.; Yu, H.; Zheng, L.; Wen, J.; Wu, C.; Tan, Y. Compressive strength of fly ash magnesium oxychloride cement containing granite wastes. Constr. Build. Mater. 2013, 38, 1–7. [Google Scholar] [CrossRef]
  4. Li, P.; Wu, H.; Liu, Y.; Yang, J.; Fang, Z.; Lin, B. Preparation and optimization of ultra-light and thermal insulative aerogel foam concrete. Constr. Build. Mater. 2019, 205, 529–542. [Google Scholar] [CrossRef]
  5. Azimi, A.H. Experimental investigations on the physical and rheological characteristics of sand–foam mixtures. J. Non-Newton. Fluid Mech. 2015, 221, 28–39. [Google Scholar] [CrossRef]
  6. Nguyen, T.T.; Bui, H.H.; Ngo, T.D.; Nguyen, G.D. Experimental and numerical investigation of influence of air-voids on the compressive behaviour of foamed concrete. Mater. Des. 2017, 130, 103–119. [Google Scholar] [CrossRef]
  7. He, X.; Zhou, J.; Wang, Z.; Zhang, L. Study on mechanics and water transport characteristics of sea-sand concrete based on the volume analysis of each solid composition. Constr. Build. Mater. 2020, 257, 119591. [Google Scholar] [CrossRef]
  8. Deng, D. The mechanism for soluble phosphates to improve the water resistance of magnesium oxychloride cement. Cem. Concr. Res. 2003, 33, 1311–1317. [Google Scholar] [CrossRef]
  9. Zhou, Z.; Chen, H.; Li, Z.; Li, H. Simulation of the properties of MgO-MgfCl2-H2O system by thermodynamic method. Cem. Concr. Res. 2015, 68, 105–111. [Google Scholar] [CrossRef]
  10. Li, Y.; Li, Z.; Pei, H.; Yu, H. The influence of FeSO4 and KH2PO4 on the performance of magnesium oxychloride cement. Constr. Build. Mater. 2016, 102, 233–238. [Google Scholar] [CrossRef]
  11. Chen, X.; Zhang, T.; Bi, W.; Cheeseman, C. Effect of tartaric acid and phosphoric acid on the water resistance of magnesium oxychloride (MOC) cement. Constr. Build. Mater. 2019, 213, 528–536. [Google Scholar] [CrossRef]
  12. Eiras, J.; Segovia, F.; Borrachero, M.; Monzó, J.; Bonilla, M.; Payá, J. Physical and mechanical properties of foamed Portland cement composite containing crumb rubber from worn tires. Mater. Des. 2014, 59, 550–557. [Google Scholar] [CrossRef]
  13. Jankovský, O.; Lojka, M.; Lauermannová, A.-M.; Antončík, F.; Pavlíková, M.; Záleská, M.; Pavlík, Z.; Pivák, A.; Sedmidubský, D. Towards novel building materials: High-strength nanocomposites based on graphene, graphite oxide and magnesium oxychloride. Appl. Mater. Today 2020, 20, 100766. [Google Scholar] [CrossRef]
  14. Jiříčková, A.; Lojka, M.; Lauermannová, A.-M.; Antončík, F.; Sedmidubský, D.; Pavlíková, M.; Záleská, M.; Pavlík, Z.; Jankovský, O. Synthesis, Structure, and Thermal Stability of Magnesium Oxychloride 5Mg(OH)2∙MgCl2∙8H2O. Appl. Sci. 2020, 10, 1683. [Google Scholar] [CrossRef] [Green Version]
  15. Pavlíková, M.; Pivák, A.; Záleská, M.; Jankovský, O.; Reiterman, P.; Pavlík, Z. Magnesium Oxychloride Cement Composites Lightened with Granulated Scrap Tires and Expanded Glass. Appl. Sci. 2020, 13, 4828. [Google Scholar] [CrossRef]
  16. Hsu, K.-L. Development of waste expanded polystyrene flexible coating material in concrete waterproofing. IOP Conf. Ser. Earth Environ. Sci. 2019, 351, 012021. [Google Scholar] [CrossRef]
  17. Geng, Y.; Li, S.; Hou, D.; Zhang, W.; Jin, Z.; Li, Q.; Luo, J. Fabrication of superhydrophobicity on foamed concrete surface by GO/silane coating. Mater. Lett. 2020, 265, 127423. [Google Scholar] [CrossRef]
  18. Yoon, H.-S.; Lim, T.-K.; Jeong, S.-M.; Yang, K.-H. Thermal transfer and moisture resistances of nano-aerogel-embedded foam concrete. Constr. Build. Mater. 2020, 236, 117575. [Google Scholar] [CrossRef]
  19. Song, J.; Zhao, D.; Han, Z.; Xu, W.; Lu, Y.; Liu, X.; Liu, B.; Carmalt, C.J.; Deng, X.; Parkin, I.P. Super-robust superhydrophobic concrete. J. Mater. Chem. A 2017, 5, 14542–14550. [Google Scholar] [CrossRef]
  20. Zhang, X.; Ge, S.; Wang, H.; Chen, R. Effect of 5-phase seed crystal on the mechanical properties and microstructure of magnesium oxychloride cement. Constr. Build. Mater. 2017, 150, 409–417. [Google Scholar] [CrossRef]
  21. Kus, H.; Carlsson, T. Microstructural investigations of naturally and artificially weathered autoclaved aerated concrete. Cem. Concr. Res. 2003, 33, 1423–1432. [Google Scholar] [CrossRef]
  22. Zhou, J.; Ye, G.; Van Breugel, K. Characterization of pore structure in cement-based materials using pressurization–depressurization cycling mercury intrusion porosimetry (PDC-MIP). Cem. Concr. Res. 2010, 40, 1120–1128. [Google Scholar] [CrossRef]
  23. Sun, Z.; Scherer, G.W. Pore size and shape in mortar by thermoporometry. Cem. Concr. Res. 2010, 40, 740–751. [Google Scholar] [CrossRef]
  24. Amran, Y.M.; Farzadnia, N.; Ali, A.A.A. Properties and applications of foamed concrete; a review. Constr. Build. Mater. 2015, 101, 990–1005. [Google Scholar] [CrossRef]
  25. Kaddami, A.; Pitois, O. A physical approach towards controlling the microstructure of metakaolin-based geopolymer foams. Cem. Concr. Res. 2019, 124. [Google Scholar] [CrossRef]
  26. She, W.; Zheng, Z.; Zhang, Q.; Zuo, W.; Yang, J.; Zhang, Y.; Zheng, L.; Hong, J.; Miao, C. Predesigning matrix-directed super-hydrophobization and hierarchical strengthening of cement foam. Cem. Concr. Res. 2020, 131, 106029. [Google Scholar] [CrossRef]
  27. She, W.; Zhang, Y.; Miao, C.; Hong, J.; Mu, S. Water transport in foam concrete: Visualisation and numerical modelling. Mag. Concr. Res. 2020, 72, 734–746. [Google Scholar] [CrossRef]
  28. Mousavi, M.; Hassanajili, S.; Rahimpour, M. Synthesis of fluorinated nano-silica and its application in wettability alteration near-wellbore region in gas condensate reservoirs. Appl. Surf. Sci. 2013, 273, 205–214. [Google Scholar] [CrossRef]
  29. Wang, H.; Fang, J.; Cheng, T.; Ding, J.; Qu, L.; Dai, L.; Wang, X.; Lin, T. One-step coating of fluoro-containing silicananoparticles for universal generation of surface superhydrophobicity. Chem. Commun. 2008, 7, 877–879. [Google Scholar] [CrossRef] [Green Version]
  30. Asghar, A.; Raman, A.A.A.; Daud, W.M.A.W. Advanced oxidation processes for in-situ production of hydrogen peroxide/hydroxyl radical for textile wastewater treatment: A review. J. Clean. Prod. 2015, 87, 826–838. [Google Scholar] [CrossRef] [Green Version]
  31. Wei, L.; Yonggang, W.; Shukun, S.; Shaofei, S.; Shukun, S. Ultraviolet Light Catalyzed Gelation of 3-Methacryloxypropyltrimethoxysilane via Altered Silicate Spatial Structure. J. Phys. Chem. B 2016, 120, 9513–9522. [Google Scholar] [CrossRef] [PubMed]
  32. Ye, Q.; Wang, W.; Zhang, W.; Li, J.; Chen, H. Tuning the phase structure and mechanical performance of magnesium oxychloride cements by curing temperature and H2O/MgCl2 ratio. Constr. Build. Mater. 2018, 179, 413–419. [Google Scholar] [CrossRef]
  33. Huang, Q.-Z.; Fang, Y.-Y.; Liu, P.-Y.; Zhu, Y.-Q.; Shi, J.-F.; Xu, G. A novel strategy for durable superhydrophobic coating on glass substrate via using silica chains to fix silica particles. Chem. Phys. Lett. 2018, 692, 33–37. [Google Scholar] [CrossRef]
  34. He, P.; Poon, C.S.; Tsang, D.C. Comparison of glass powder and pulverized fuel ash for improving the water resistance of magnesium oxychloride cement. Cem. Concr. Compos. 2018, 86, 98–109. [Google Scholar] [CrossRef]
Figure 1. Comparison of foamed magnesium oxychloride cement (F-MOC) and magnesium oxychloride cement without 2H-tridecylfluoro-n-octylsilane (FAS) or tetraethylorthosilicate (TEOS) (N-MOC) bulk density under different H2O2 content (FAS content was fixed at 1% of the mass of MgO; TEOS was added according to the molar ratio of FAS to TEOS of 1:6).
Applsci 10 08134 g001
Figure 2. Three-dimensional graph of the influence of H2O2 and TEOS content on bulk density (FAS content was fixed at 1% of MgO mass).
Applsci 10 08134 g002
Figure 3. F-MOC and N-MOC aperture test interval diagram and aperture distribution digram(F-MOC bulk density was 540 kg·m−3, N-MOC bulk density was 301 kg·m−3).
Applsci 10 08134 g003
Figure 4. Comparison of the morphology of F-MOC and N-MOC with a similar bulk density (the bulk density of F-MOC and N-MOC is 500–600 kg·m−3).
Applsci 10 08134 g004
Figure 5. The compressive strength and the bulk density of F-MOC.
Applsci 10 08134 g005
Figure 6. X-ray patterns of F-MOC and N-MOC.
Applsci 10 08134 g006
Figure 7. Fourier infrared test (a) and XPS spectrum (b) of F-MOC and N-MOC.
Applsci 10 08134 g007
Figure 8. Triethoxy-1H, 1H, 2H, 2H-tridecylfluoro-n-octylsilane (FAS), and tetraethyl orthosilicate (TEOS) co-hydrolysis mechanism.
Applsci 10 08134 g008
Figure 9. The water contact angle of different ratios of F-MOC ((A1)–(A5) are FAS content of 1%, n (FAS): n (TEOS) = 1:8, the addition of H2O2 increased from 4% to 12%, (B1)–(B5) were when the additional amount of H2O2 was fixed at 10%, and the TEOS content increased from n (FAS): n (TEOS) = 1:6 to n (FAS): n (TEOS) = 1:14, (C1)–(C5) were the additional amounts of H2O2 fixed at 10%, n (FAS):n (TEOS) = 1:8, the FAS content increased from 0.5% to 2.5%).
Applsci 10 08134 g009
Figure 10. F-MOC hydrophobic effect: (a) is the water contact angle test graph, (b) is the overall hydrophobic effect graph of F-MOC, and (c) is the comparison graph of F-MOC and N-MOC.
Applsci 10 08134 g010
Figure 11. The influence of different mechanical polishing thickness on the water contact angle of F-MOC.
Applsci 10 08134 g011
Figure 12. The effect of soaking in different solutions on the chemical stability of F-MOC.
Applsci 10 08134 g012
Figure 13. Moisture absorption rate of F-MOC and MOC with a different bulk density.
Applsci 10 08134 g013
Figure 14. The dehydration rate of F-MOC and MOC (F-MOC and N-MOC bulk density are both around 600 Kg·m−3, blistering time is 120 Min, the temperature is 30 °C).
Applsci 10 08134 g014
Table 1. The chemical compositions of the magnesia powder.
ComponentsMgOSiO2CaOFe2O3Al2O3Loss on Ignition
Mass fraction: %84.276.251.680.280.576.95
Publisher’s Note: MDPI stays neutral with regard to jurisdictional claims in published maps and institutional affiliations.