Abstract
The microwave electric field intensity is precisely measured by the Autler–Townes splitting of electromagnetically induced transparency spectrum in a four-level ladder-type Rb atomic system. A robust multi-carrier modulation scheme is employed to improve the spectral signal-to-noise ratio, which determines the optical readout of Rydberg atom-based microwave electrometry. As a result, a factor of 2 measurement sensitivity improvement is clearly achieved compared with the on resonant Autler–Townes splitting case credit to the advantage of matched filtering. This research paves the way for building a high sensitivity, portable sensor and offers a platform for achieving compact and sensitive receiver.
1. Introduction
Atom-based measurements have been successfully used as time, length, and frequency standards due to the unique properties of atoms and molecules [,]. The measurement of microwave electric field (E-field) based on a Rydberg atom demonstrates advantages of traceability and self-calibration [,,,,] by using the concept of electromagnetically induced transparency (EIT) [,] in a room temperature vapor cell. The EIT spectroscopy is obtained by applying the coupling laser excites the atoms to Rydberg state when the probe laser is used to detect the response of the atom, which results in the transparency of the atoms. The microwave E-field measurement has widespread applications in the fields of antenna calibration [], terahertz sensing [], and the characterization of electronics [,].
The E-field measurement method with dipole antenna [] inevitably has the calibration drawbacks. The calibration error is introduced when the probe is calibrated in a reference field. The Autler–Townes (AT) splitting spectrum of Rydberg atoms effectively solves this problem [] with the advantage of the consistent frequency of atomic transition. At the same time, it is possible to achieve the broadband microwave E-field measurement by using different Rydberg states due to the numerous available resonant frequencies from 100 MHz to sub THz. The AT splitting interval is proportional to the microwave field intensity (E), which can be expressed as , in which is the Rabi frequency of the field, is the Rydberg atoms transition dipole matrix element, ℏ is Planck constant. The AT splitting spectroscopy provides a link to direct International System of Units (SI) traceable, where the Planck’s constant ℏ is the heart of this traceable method, and the measurement of the microwave field intensity is bridged to the determination of Autler–Townes splitting interval. Therefore, the E-field measurement based on the Rydberg atoms can be developed as a broadband, direct SI-traceable, and self-calibrating sensor.
At present, the microwave E-field measurement based on the Rydberg atoms has widely application prospects [,,] in the fields of self-calibrated measurements, sub-wavelength imaging, and electronic communication, which has shown promise to measure moderate to strong field intensity with a magnitude of ∼Vm. However, the measurement by Rydberg atoms poses some difficulties for weak field intensity measurement lower than ∼Vcm. In those cases, there is a pressing need to develop an experiment scheme, which is not only self-calibrating but also with high sensitivity.
To improve the sensitivity of the microwave field measurement, several methods were employed including the primary methods of geometry structure of vapor cell [] and frequency detuning []. Just recently, the advanced detection methods [] and improved modulation approaches [,] are reported. On the basis of this preliminary work, more effective methods are still needed to improve the measurement sensitivity of a microwave E-field. A multiple modulation scheme was used for digital frequency division multiplexing communication with the advantages of small size and low power consumption []. Here, a robust multi-carrier modulation (MCM) method is employed to improve spectral SNR, which is used to evaluate the resolving ability of the microwave E-field measurement.
In this work, we demonstrate the improvement performance of the microwave E-field measurement sensitivity by using the MCM scheme in a four-level atomic system. The experiment scheme is conducted by using two laser fields and a microwave E-field, which couples nearby Rydberg transition () and causes the AT splitting of the Rydberg EIT spectrum. In addition, the variation of spectra with the evolution of this scheme is discussed in detail when the microwave frequency is detuned. This work is helpful to improve the measurement sensitivity and contribute to the potential application of quantum sensing.
2. Experiment Setup
A four-level ladder-type atomic configuration with transition of Rb atoms is employed in this experiment, which is shown in Figure 1a. The 780 nm probe laser drives hyperfine transition, while the coupling laser excites atoms from to Rydberg state. Then, a microwave E-field at a frequency of 11.36 GHz induces the to Rydberg transition.
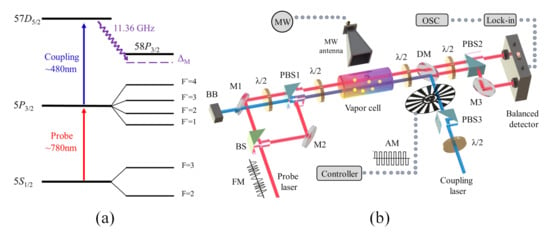
Figure 1.
(a) illustration of a four-level system of Rb; (b) sketch of the experiment setup. MW, microwave source; BB, beam block; BS, beam splitter; /2 , half-wave plate; PBS, polarizing beam splitter; M, mirror; DM, dichroic mirror; Lock-in, lock-in amplifier; OSC, oscilloscope; AM, amplitude modulation; FM, frequency modulation.
Figure 1b schematically depicts the experiment setup for the MCM scheme. The probe laser (780 nm) is provided by an external cavity diode laser (DL pro, Toptica, Munich, Germany), which is frequency locked on transition by the saturation absorption spectroscopy (SAS) method. The frequency modulation (FM) is applied to the current modulation port of the probe laser. The coupling laser (480 nm) is generated by a frequency doubled amplified diode laser system (TA-SHG pro, Toptica, Munich, Germany), which is scanned across the hyperfine transition and real-time monitored by a wavelength meter (WS-7, Highfiness, Tubingen, Germany). The amplitude modulation (AM) of the coupling laser is achieved by an optical chopper (SR540, Stanford Research Systems, Sunnyvale, CA, USA) with frequency of 600 Hz before it is reflected by the dichroic mirror (DM). The coupling laser beam is overlapped with the main probe laser at a rubidium cylindrical vapor with 75 mm length and 25 mm diameter by the counter-propagating configuration, and the Doppler-broadening is effectively reduced.
Then, a microwave E-field with 11.36 GHz is emitted by a standard gain horn antenna, and its direction is perpendicular to the propagation direction of the both lasers. The antenna is fed by a vector signal generator (SMB100A, Rohde & Schwarz, Munich, Germany), which is synchronized with a GPS disciplined oscillator with Rubidium timebase (GPSDO). The frequency of the microwave E-field can be precisely controlled with the accuracy of 0.1 Hz. The distance between the antenna and the Rb vapor cell is about 270 mm, which satisfies the far-field regime. A balanced detector (2307, New Focus, Santa Clara, CA, USA) is used to simultaneously detect the probe laser beam passing through the vapor and the reference beam, which can effectively cancel the noise from the laser itself. In addition, the output signal is demodulated by a lock in amplifier (SR830, Stanford Research Systems, Sunnyvale, CA, USA) with the corresponding modulation signal. With the help of these two methods, the 1/f noise of the spectrum is significantly suppressed in this process, thus the signal-to-noise ratio of the spectrum has been effectively improved.
3. Results and Discussion
When the coupling laser frequency is scanned over the transition and the probe laser frequency resonates at the hyperfine transition of , a typical EIT signal, corresponding to transition with the full width at half maximum (FWHM) about 7.36 MHz, appears in Figure 2a (blue dots). The powers of the probe and coupling lasers are 15 W and 23 mW, respectively. A microwave E-field, with the frequency at 11.36 GHz and the power at dBm, resonates with the adjacent Rydberg transition and results in a resonant dark state with all of the population in the ground state (the AT splitting) as shown in black dots of Figure 2a. The AT splitting interval gradually decreases when the microwave E-field power reduces; Figure 2b shows the AT splitting spectrum with a microwave field of dBm, which is close to the indistinguishable intensity. In Figure 2c, the AT splitting peaks becomes more difficult to identify when the microwave power is dBm.
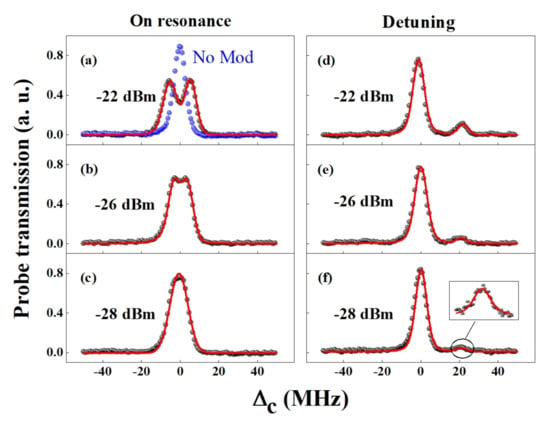
Figure 2.
(a–c) are the AT splitting spectra as a function of the coupling laser frequency detuning with microwave E-field powers of dBm, dBm, dBm, respectively. The microwave E-field frequency is resonance with the – transition. The blue dots in Figure 2a is the EIT spectrum without the microwave E-field. (d–f) are corresponding the AT splitting spectra with the microwave E-field frequency blue detuning 20 MHz from the – transition. The black dots represent the experimental results. The experimental data are fitted with the Voigt profiles.
The microwave frequency detuning is introduced to realize the reappearance of the AT splitting even in the case of low microwave E-field power. Compared with the resonant transition, the AT splitting peaks are non-symmetric, the left peak is higher than the right if the microwave frequency is blue detuning; otherwise, it is the opposite. The AT splitting interval of the two peaks can be given by []:
where is the frequency detuning of the microwave E-field (, is the on-resonance frequency, is the actual frequency of the microwave E-field), and is the splitting interval induced by the resonant microwave E-field.
We measured the AT splitting interval with different microwave frequency detunings . It can be found that the relative intensity ratio of two AT splitting peaks increase as the increases. Additionally, the change of the AT splitting interval versus has similar trend. The intensity ratio of two AT splitting peaks is optimal for measurement when the microwave frequency blue detuning is 20 MHz. Figure 2d–f show the AT splitting spectra in this case; meanwhile, the microwave E-field powers remain consistent in Figure 2a–c. It can be found that the distinguishing ability is significantly improved with frequency detuning compared to that of the resonance frequency, which is obviously observed with a weak microwave E-field power of dBm.
From Figure 2e, we can find that the spectral SNR is relatively low, but the resolution of AT splitting interval is determined by the identification of the right transmission peak. As the microwave E-field power continues to decrease, the right transmission peak is gradually difficult to distinguish. We adopt the MCM scheme, which is composed by FM and AM, to improve the measurement sensitivity. Figure 3 shows the right transmission peaks recorded under different modulation schemes when the microwave E-field power is dBm. Figure 3b shows the right transmission signal with the modulation frequency of 12 kHz. The resulting SNR has an improvement of about 4.2 times compared with Figure 3a. Then, the AM is acted on the coupling laser by an optical chopper with 600 Hz modulation, and the optimal SNR is 16.6, which is shown in Figure 3c. Furthermore, the MCM scheme is employed to improve the spectral SNR in Figure 3d, and the spectral SNR is found to be 25.7. Finally, a 5.8 times improvement is obtained with MCM compared with Figure 3a.
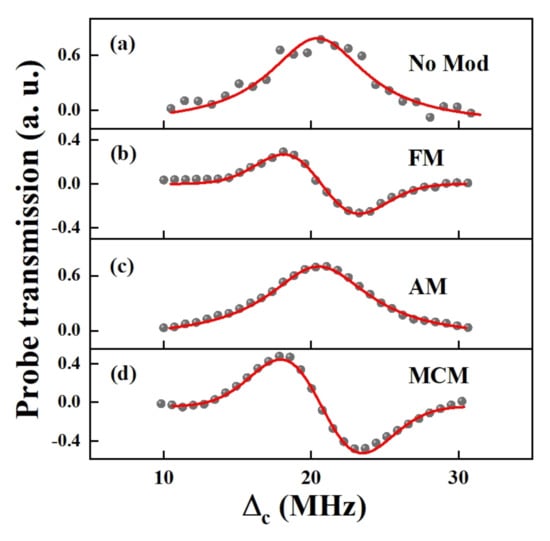
Figure 3.
The right transmission signals of the AT splitting as a function of the coupling laser frequency detuning in Figure 2e. (a) no modulation (No mod); (b) frequency modulation (FM); (c) amplitude modulation (AM); (d) multi-carrier modulation (MCM). The black dots are the experimental results and the red lines are the fitting results with Voigt profiles.
In order to evaluate the effectiveness of the MCM scheme, a series of spectra measurements are performed. The SNR of the right transmission signals are measured with different microwave powers from dBm to dBm, which can be seen from Figure 4. The experimental data are averaged from three measurements. The error bars are the standard deviations. When the power of microwave E-field power is dBm, the spectral SNR measured by AM scheme (blue dots) shows a factor of 2.4 improvement compared with the modulation-free case in black dots. In addition, the spectral SNR also has an improvement of about 3.2 times by using FM (red dots) compared with a modulation-free signal. A spectrum with higher SNR can be effectively obtained by adopting a MCM scheme (green dots), which has a 4.8 times improvement. Therefore, the MCM scheme can efficiently achieve a high SNR spectral measurement of transmission signals.
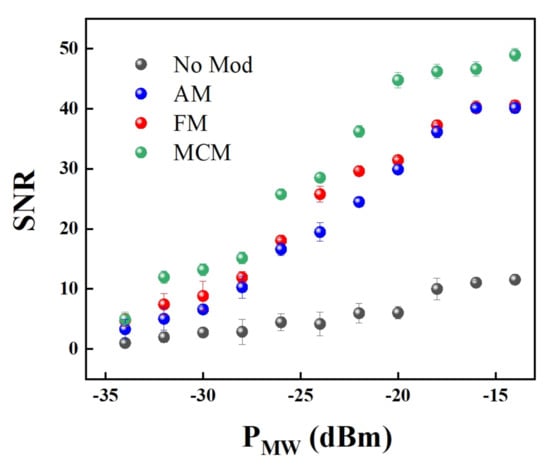
Figure 4.
The SNR of right transmission signals of the AT splitting versus the microwave E-field power with different modulation methods.
Figure 5 shows the right transmission signals of the AT splitting with microwave E-field powers decreasing from dBm to dBm under the experimental parameters of Figure 3d. The linewidth and the amplitude of the transmission signals gradually decrease as the microwave E-field power decreasing. The minimum detectable microwave power is dBm by MCM scheme as shown in Figure 5d, corresponding to the AT splitting interval MHz (calculated by Equation (1)), which can be found about a factor of 2 smaller compared with on resonance case. As far as we know, the minimum AT splitting measured previously by the frequency detuning method is 6 MHz []. We know that the minimum AT splitting of EIT is limited by the linewidth [], so the narrow linewidth EIT can be considered to measure the weaker microwave E-field. Therefore, a more weaker microwave E-field can be measured with a narrower EIT linewidth.
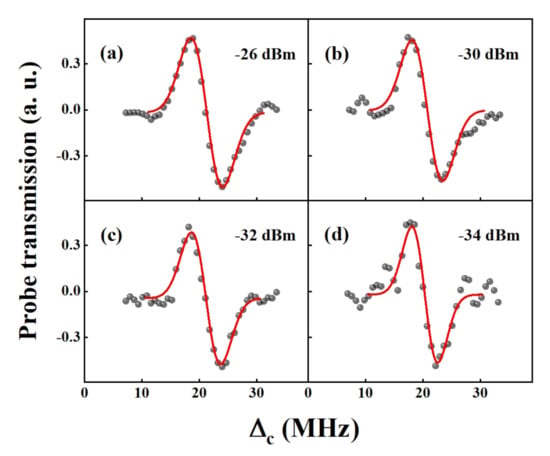
Figure 5.
The right transmission signals of the AT splitting with different microwave E-fields. (a) dBm; (b) dBm; (c) dBm; (d) dBm. The black dots are the experimental results and the red lines are the fittings with Voigt profiles.
4. Conclusions
In conclusions, we demonstrated an effective MCM scheme for improving sensitivity of the weak microwave E-field measurement by using AT splitting of Rydberg atoms. By utilizing MCM scheme and optimization of the experimental parameters, the AT splitting is measured (3.7 MHz), which is the minimum splitting and E-field intensity for the weak field level we can achieve. It is improved about two times compared with the on-resonance AT splitting. It is possible to optimize the parameters of the system for a smaller AT splitting measurement now that the Rydberg atom-based sensing is well-poised to become a traceable microwave electric field standard, particularly useful for calibration of radio frequency and terahertz devices, from GHz to THz.
Author Contributions
Conceptualization, S.L. and J.Y.; investigation, S.L. and J.Y.; software, S.L.; validation, S.L., J.Y. and L.W.; formal analysis, S.L. and J.Y.; Writing—Original draft, S.L.; writing—Review and editing, J.Y. and L.W.; project administration, J.Y. and L.W.; and funding acquisition, J.Y. and L.W. All authors have read and agreed to the published version of the manuscript.
Funding
This work is supported by the National Key R&D Program of China under Grant No. 2017YFA0304203; the NSFC under Grants No. 61875112, No. 61705122, No. 62075121, No. 91736209; the Program for Sanjin Scholars of Shanxi Province; Key Research and Development Program of Shanxi Province for International Cooperation under Grant No. 201803D421034; Research Project Supported by Shanxi Scholarship Council of China under Grant No. 2020-073 and 1331KSC.
Conflicts of Interest
The authors declare no conflict of interest.
References
- Ramos, R.; Spierings, D.; Racicot, I.; Steinberg, A.M. Measurement of the time spent by a tunnelling atom within the barrier region. Nature 2020, 583, 529–532. [Google Scholar] [CrossRef] [PubMed]
- Yuan, J.P.; Wu, C.H.; Wang, L.R.; Chen, G.; Jia, S.T. Observation of diffraction pattern in two-dimensional optically induced atomic lattice. Opt. Lett. 2019, 44, 4123. [Google Scholar] [CrossRef] [PubMed]
- Sedlacek, J.A.; Schwettmann, A.; Kubler, H.; Shaffer, J.P. Atom-based vector microwave electrometry using rubidium Rydberg atoms in a vapor cell. Phys. Rev. Lett. 2013, 111, 63001. [Google Scholar] [CrossRef] [PubMed]
- Simons, M.T.; Haddab, A.H.; Gordon, J.A.; Holloway, C.L. A Rydberg atom-based mixer: Measuring the phase of a radio frequency wave. Appl. Phys. Lett. 2019, 114, 114101. [Google Scholar] [CrossRef]
- Kinoshita, M.; Shimaoka, K.; Shimada, Y. Optimization of the atomic candle signal for the precise measurement of microwave power. IEEE T. Instrum. Meas. 2013, 62, 1807. [Google Scholar] [CrossRef]
- Holloway, C.L.; Simons, M.T.; Kautz, M.D.; Haddab, A.H.; Gordon, J.A.; Crowley, T.P. A quantum-based power standard: Using Rydberg atoms for a SI-traceable radiofrequency power measurement technique in rectangular waveguides. Appl. Phys. Lett. 2018, 113, 094101. [Google Scholar] [CrossRef]
- Yuan, J.P.; Dong, S.C.; Wu, C.H.; Wang, L.R.; Xiao, L.T.; Jia, S.T. Optically tunable grating in a V + Ξ configuration involving a Rydberg state. Opt. Express 2020, 28, 23820. [Google Scholar] [CrossRef]
- Fleischhauer, M.; Imamoglu, A.; Marangos, J.P. Electromagnetically induced transparency: Optics in coherent media. Rev. Mod. Phys. 2005, 77, 633–673. [Google Scholar] [CrossRef]
- Zhang, H.F.; Yuan, J.P.; Dong, S.C.; Wu, C.H.; Wang, L.R. Observation of an electromagnetically induced grating in cold 85Rb atoms. Appl. Sci. 2020, 10, 5740. [Google Scholar] [CrossRef]
- Holloway, C.L.; Gordon, J.A.; Jefferts, S.; Schwarzkopf, A.; Anderson, D.A.; Miller, S.A.; Thaicharoen, N.; Raithel, G. Broadband Rydberg atom-based electric-field probe for SI-traceable, Self-calibrated measurements. IEEE T. Antenn. Propag. 2014, 62, 6169. [Google Scholar] [CrossRef]
- Downes, L.A.; MacKellar, A.R.; Whiting, D.J.; Bourgenot, C.; Adams, C.S.; Weatherill, K.J. Full-field terahertz imaging at kilohertz frame rates using atomic vapor. Phys. Rev. X 2020, 10, 011027. [Google Scholar] [CrossRef]
- Holloway, C.L.; Simons, M.T.; Gordon, J.A.; Wilson, P.F.; Cooke, C.M.; Anderson, D.A.; Raithel, G. Atom-based RF electric field metrology: from self-calibrated measurements to subwavelength and near-field imaging. IEEE Trans. Electromagn. C 2017, 59, 717. [Google Scholar] [CrossRef]
- Pi, Z.; Khan, F. An introduction to millimeter-wave mobile broadband systems. IEEE Commun. Mag. 2011, 49, 101. [Google Scholar] [CrossRef]
- Sedlacek, J.A.; Schwettmann, A.; Kübler, H.; Löw, R.; Pfau, T.; Shaffer, J.P. Microwave electrometry with Rydberg atoms in a vapour cell using bright atomic resonances. Nat. Phys. 2012, 8, 819. [Google Scholar] [CrossRef]
- Fan, H.Q.; Kumar, S.; Daschner, R.; Kübler, H.; Shaffer, J.P. Subwavelength microwave electric-field imaging using Rydberg atoms inside atomic vapor cells. Opt. Lett. 2014, 39, 3030. [Google Scholar] [CrossRef]
- Simons, M.T.; Gordon, J.A.; Holloway, C.L. Simultaneous use of Cs and Rb Rydberg atoms for dipole moment assessment and RF electric field measurements via electromagnetically induced transparency. J. Appl. Phys. 2016, 120, 123103. [Google Scholar] [CrossRef]
- Anderson, D.A.; Paradis, E.G.; Raithel, G. A vapor-cell atomic sensor for radio-frequency field detection using a polarization-selective field enhancement resonator. Appl. Phys. Lett. 2018, 113, 073501. [Google Scholar] [CrossRef]
- Fan, H.Q.; Kumar, S.; Kübler, H.; Shaffer, J.P. Dispersive radio frequency electrometry using Rydberg atoms in a prism-shaped atomic vapor cell. J. Phys. B At. Mol. Opt. Phys. 2016, 49, 104004. [Google Scholar] [CrossRef]
- Simons, M.T.; Gordon, J.A.; Holloway, C.L.; Anderson, D.A.; Miller, S.A.; Raithel, G. Using frequency detuning to improve the sensitivity of electric field measurements via electromagnetically induced transparency and Autler–Townes splitting in Rydberg atoms. Appl. Phys. Lett. 2016, 108, 174101. [Google Scholar] [CrossRef]
- Kumar, S.; Fan, H.Q.; Kübler, H.; Sheng, J.; Shaffer, J.P. Atom-based sensing of weak radio frequency electric fields using homodyne readout. Sci. Rep. 2017, 7, 42981. [Google Scholar] [CrossRef]
- Kumar, S.; Fan, H.Q.; Kübler, H.; Jahangiri, A.J.; Shaffer, J.P. Rydberg-atom based radio-frequency electrometry using frequency modulation spectroscopy in room temperature vapor cells. Opt. Express 2017, 25, 8625. [Google Scholar] [CrossRef] [PubMed]
- Jing, M.Y.; Hu, Y.; Ma, J.; Zhang, H.; Zhang, L.J.; Xiao, L.T.; Jia, S.T. Atomic superheterodyne receiver based on microwave-dressed Rydberg spectroscopy. Nat. Phys. 2020, 16, 911. [Google Scholar] [CrossRef]
- Zou, H.Y.; Song, Z.F.; Mu, H.H.; Feng, Z.G.; Qu, J.F.; Wang, Q.L. Atomic receiver by utilizing multiple radio-frequency coupling at Rydberg states of rubidium. Appl. Sci. 2020, 10, 1346. [Google Scholar] [CrossRef]
- Berman, P.R.; Malinovsky, V.S. Principles of Laser Spectroscopy and Quantum Optics; Princeton University Press: Princeton, NJ, USA, 2011. [Google Scholar]
- Hao, L.P.; Xue, Y.M.; Fan, J.B.; Jiao, Y.C.; Zhao, J.M.; Jia, S.T. Nonlinearity of microwave electric field coupled Rydberg electromagnetically induced transparency and Autler–Townes splitting. Appl. Sci. 2019, 9, 1720. [Google Scholar] [CrossRef]
Publisher’s Note: MDPI stays neutral with regard to jurisdictional claims in published maps and institutional affiliations. |
© 2020 by the authors. Licensee MDPI, Basel, Switzerland. This article is an open access article distributed under the terms and conditions of the Creative Commons Attribution (CC BY) license (http://creativecommons.org/licenses/by/4.0/).