Article

Analysis of Influencing Mechanism of Subgrade Frost Heave on Vehicle-Track Dynamic System

School of Civil Engineering, Beijing Jiaotong University, Beijing 100044, China
*
Authors to whom correspondence should be addressed.
Appl. Sci. 2020, 10(22), 8097; https://doi.org/10.3390/app10228097
Submission received: 23 September 2020 / Revised: 9 November 2020 / Accepted: 11 November 2020 / Published: 16 November 2020

Abstract

:
Uneven subgrade frost heave has been a severe problem for the operation of high-speed railways in cold regions. In order to reveal the influencing mechanism of frost heave on the vehicle-track system, a novel FEM (finite element method) model based on an explicit algorithm was proposed. In the novel model, the existence of the leverage effect in slab track, which was caused by frost heave, was realistically reproduced at first, and then the vehicle model started running for evaluating the influence of the frost heave on the whole dynamic system. Results show that the leverage effect plays a key role in analyzing the influence of frost heave on the vehicle-track system, besides for track irregularity and contact loss. Specifically, the leverage effect decreases the stability of the slab track and causes an increase in dynamic irregularity. The roles of the track irregularity and the contact loss in the influencing mechanism were also revealed. With the ratio of wavelength to amplitude increasing, the track irregularity is gradually dominant in the influence mechanism of frost heave on the vehicle-track system. The research could provide a reference for the management and maintenance of the slab track in cold regions.

1. Introduction

In recent years, Northeast China’s high-speed railway has entered a period of large-scale development [1], with the operating mileage over 2000 km, the majority of which covers seasonally frozen ground [2]. Field tests (shown in Figure 1) demonstrated that the water in the surface layer of the bed is frozen in winter, which makes subgrade heave [3]. The operation experience of the Harbin-Dalian high-speed railway shows that subgrade frost heave makes it difficult to maintain the stability and safety of vehicles [4,5,6,7]. Specifically, subgrade frost heave causes deformation of rails, which deteriorates the regularity state of the track system [8] and increases the dynamic response of wheels and rails. Then, both the deformation from the subgrade and the increased dynamic response aggravate the structural damage, which further affects the operation state of the whole system. To accurately evaluate the service state of high-speed railways in cold regions, it is necessary to clarify the influences of frost heave on the vehicle-track system [9,10,11].
To date, several studies have investigated the effect of subgrade frost heave on slab track; according to existing research, slab track is a typical three-dimensional belt-shaped structure [12,13]. Subgrade frost heave could be simplified as a displacement boundary condition on the surface of the subgrade [14]. Based on the actual monitoring results [15,16,17,18,19], uneven subgrade frost heave could be simulated with an upper convex cosine curve in most research, as shown in Equation (1) and Figure 2. With this calculation hypothesis, many researchers have evaluated the service states of different ballastless tracks under subgrade frost heave. Zhao [20] analyzed the influence of frost heave deformation on the mechanical characteristics of the CRTS (China Railway Track System) I slab track, and a management standard of the ballastless track on the high-speed railway (HSR) was proposed. Zhao et al. [14] calculated the mechanical characteristics of different types of ballastless tracks under frost heave and proposed suggestions to optimize the CRTS Ⅲ slab track. Cai et al. [21] studied the deformations and interlayer separation fractures of CRTS I slab track under frost heave deformation. Cai et al. [22] also developed a flexible track system model to calculate the dynamic response of the vehicle-track system, and the upper convex cosine curve was used as an indicator of the track irregularity to reveal the effects of subgrade frost heave on vehicle dynamic behaviors. Luo et al. [23] presented a vehicle dynamic model to study the influence of uneven frost heave on train vibration, and the frost-induced irregularity was considered as a major influential factor in the dynamic model. Yang et al. [24] studied the influence of frost heave on track irregularity and interlayer seam and evaluated the dynamic response of the vehicle-track system through a dynamic model; a standard of safety management of CRTS Ⅲ slab track in the seasonally frozen ground was also presented. There are also a number of studies focusing on the influence mechanism of the foundation settlement on the dynamic system, which provide some references for this study [25,26,27,28,29]. However, in terms of the influence mechanism of frost heave on the vehicle-track dynamic system, there are so far few investigations which take into account the change in the stress and constraint state of the ballastless track itself after the occurrence of subgrade frost heave, and only track irregularity and interlayer contact loss area caused by frost heave are included in existing dynamic models [14,21,22,23,24]; the explicit mechanisms of frost heave have not been fully disclosed.
y = { f 0 [ 1 2 1 2 cos ( 2 π Z L ) ] ,    Z F r o z e n   g r o u n d 0 ,    Z N o n f r o z e n   g r o u n d
In Equation (1), f 0 represents the vertical amplitude of frost heave; Z refers to the coordinates of the subgrade surface along the longitudinal direction; L represents the wavelength of frost heave.
The objective of the present paper is to investigate the influencing mechanism of frost heave on the vehicle-track dynamic system. A novel numerical model based on an explicit algorithm is established. CRH (China Railway High-Speed) 3 vehicle and CRTS Ⅲ slab track, which are widely used in the HSR of China, are treated as analysis objects. The changes in the stress and constraint state of the slab track caused by subgrade frost heave are computed first in the model as an initial condition before the vehicle started running, then the dynamic response of the vehicle-track system is calculated. Compared with results from other existing models, the influence mechanism of frost heave on the vehicle-track system is introduced in detail in Section 3; the influence of different ratios of wavelength to amplitude is also analyzed in the paper. The results obtained would be useful in the construction and maintenance of the HSR in cold regions.

2. Materials and Methods

The vehicle-slab track dynamic model is one of the general methods for assessing the effects of frost heave on vehicle-track systems [30,31]. In this section, the FEM model of the vehicle-slab track dynamic system was developed by the vehicle-track coupling dynamics theory [32]. The whole model could be divided into vehicle model, slab track model, and wheel-rail contact model.

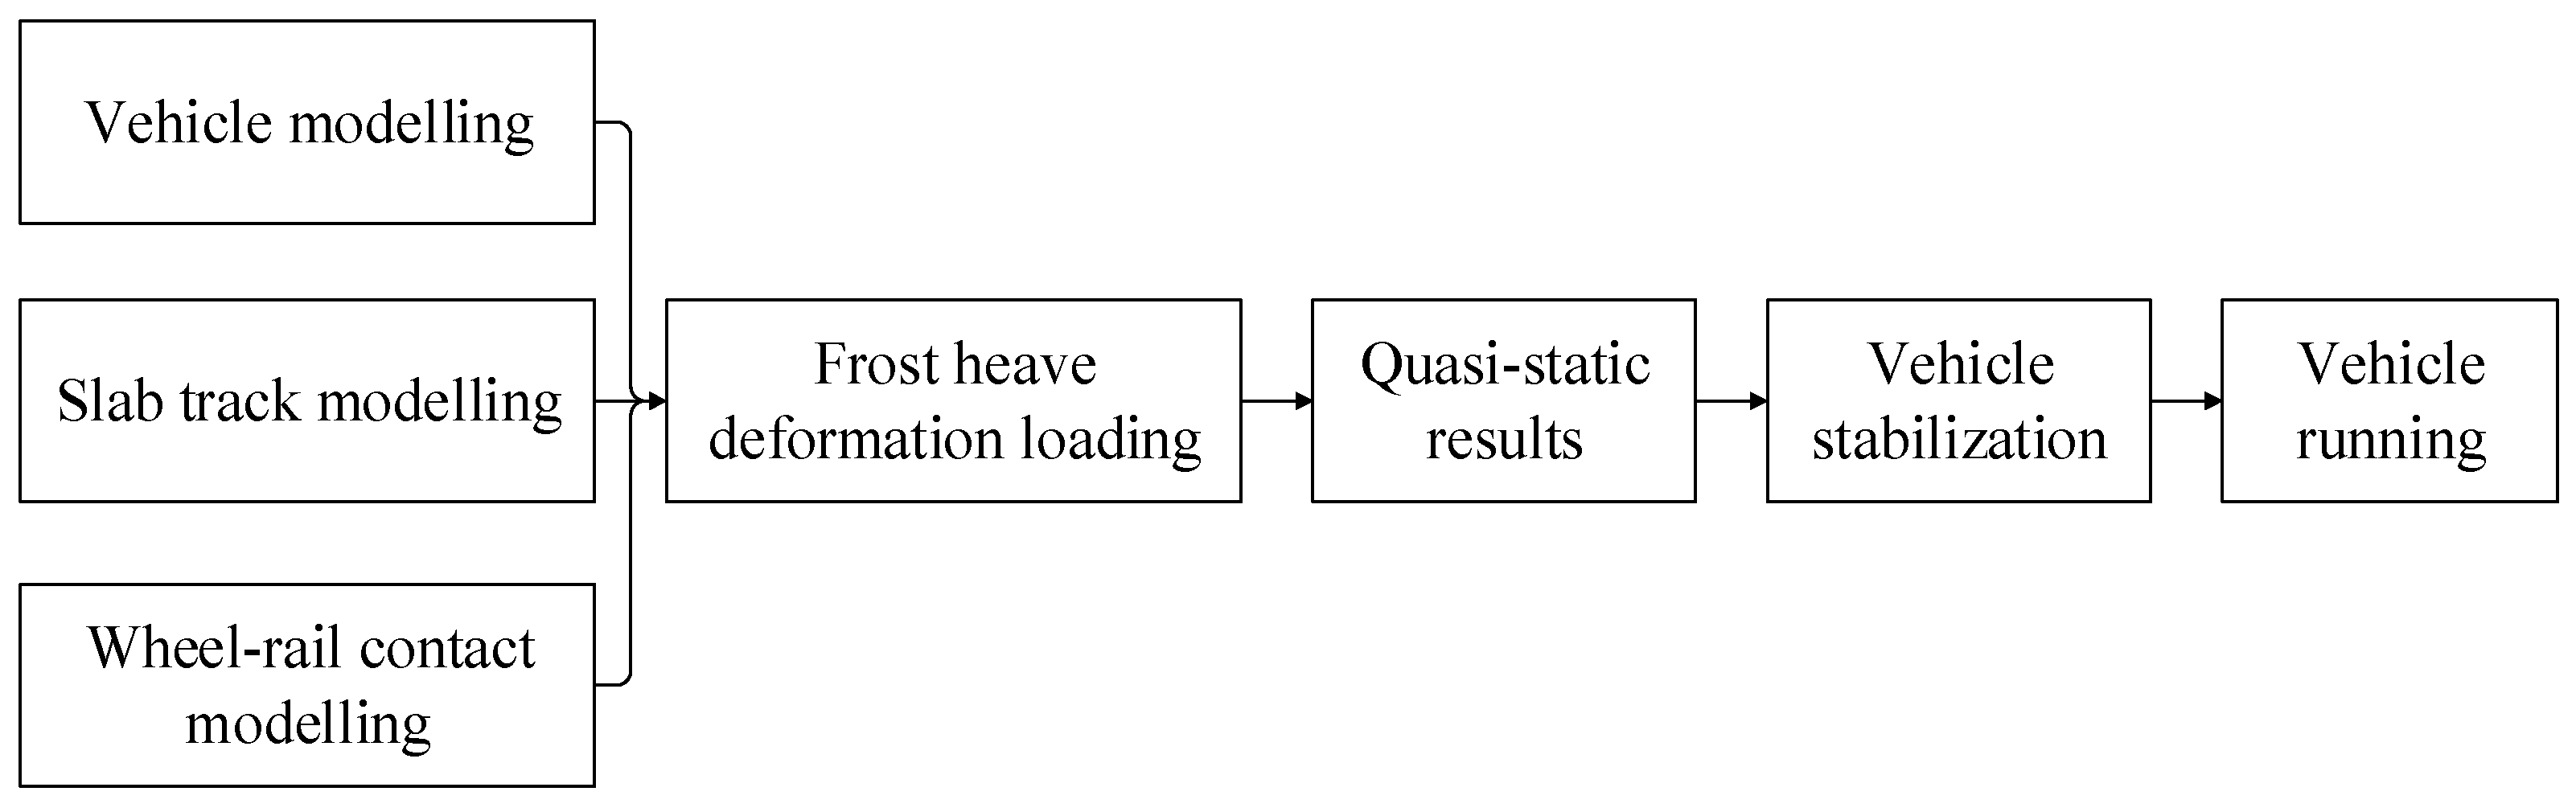
2.1. Modelling Method of a Vehicle-Slab Track Dynamic System

2.1.1. Vehicle Model

The vehicle was modeled as a multi-rigid-body system (ABAQUS, v. 6.14, Dassault Systems, Vélizy-Villacoublay, France) [33,34], with 6 degrees of freedom in the car body and each bogie (in total, 2 bogies in a model) and 5 degrees of freedom in each wheelset (in total, 4 wheelsets in a model) [35], which is a total of 38 degrees in the model. The kinematic equation of the multi-body system can be derived from the Lagrange and Newton-Euler method, as shown in Equation (2).
M v x ¨ + C v ( x ˙ ) x ˙ + K v x = F v ( x , x ˙ ,   x t r a c k ,   x ˙ t r a c k )
In Equation (2), M v is the mass matrix of the vehicle. C v and K v are the damping and the stiffness matrices describing the non-linearities within the suspension. x , x ˙ and x ˙ are the vectors of displacements, velocities and accelerations of the vehicle subsystem, respectively. x t r a c k and x ˙ t r a c k are the vectors of displacements and velocities of the track subsystem. F v ( x , x ˙ ,   x t r a c k ,   x ˙ t r a c k ) is the system load vector representing the non-linear wheel-rail contact forces which are the function of x , x ˙ , x t r a c k and x ˙ t r a c k .
There were three simplifications in the model [36,37,38,39]:
(1)
There was no eccentricity effect considered during the modelling of the multi-rigid-body system.
(2)
The bogie was assumed to be connected by rigid beams.
(3)
The primary and secondary suspension systems were simulated by non-linear connector elements which consider both the stiffness and damping in the longitudinal, lateral and vertical directions.
The CRH3 vehicle has been established for simulation. The parameters of the CRH3 vehicle are used for the vehicle model [22], which can be found in Table 1.

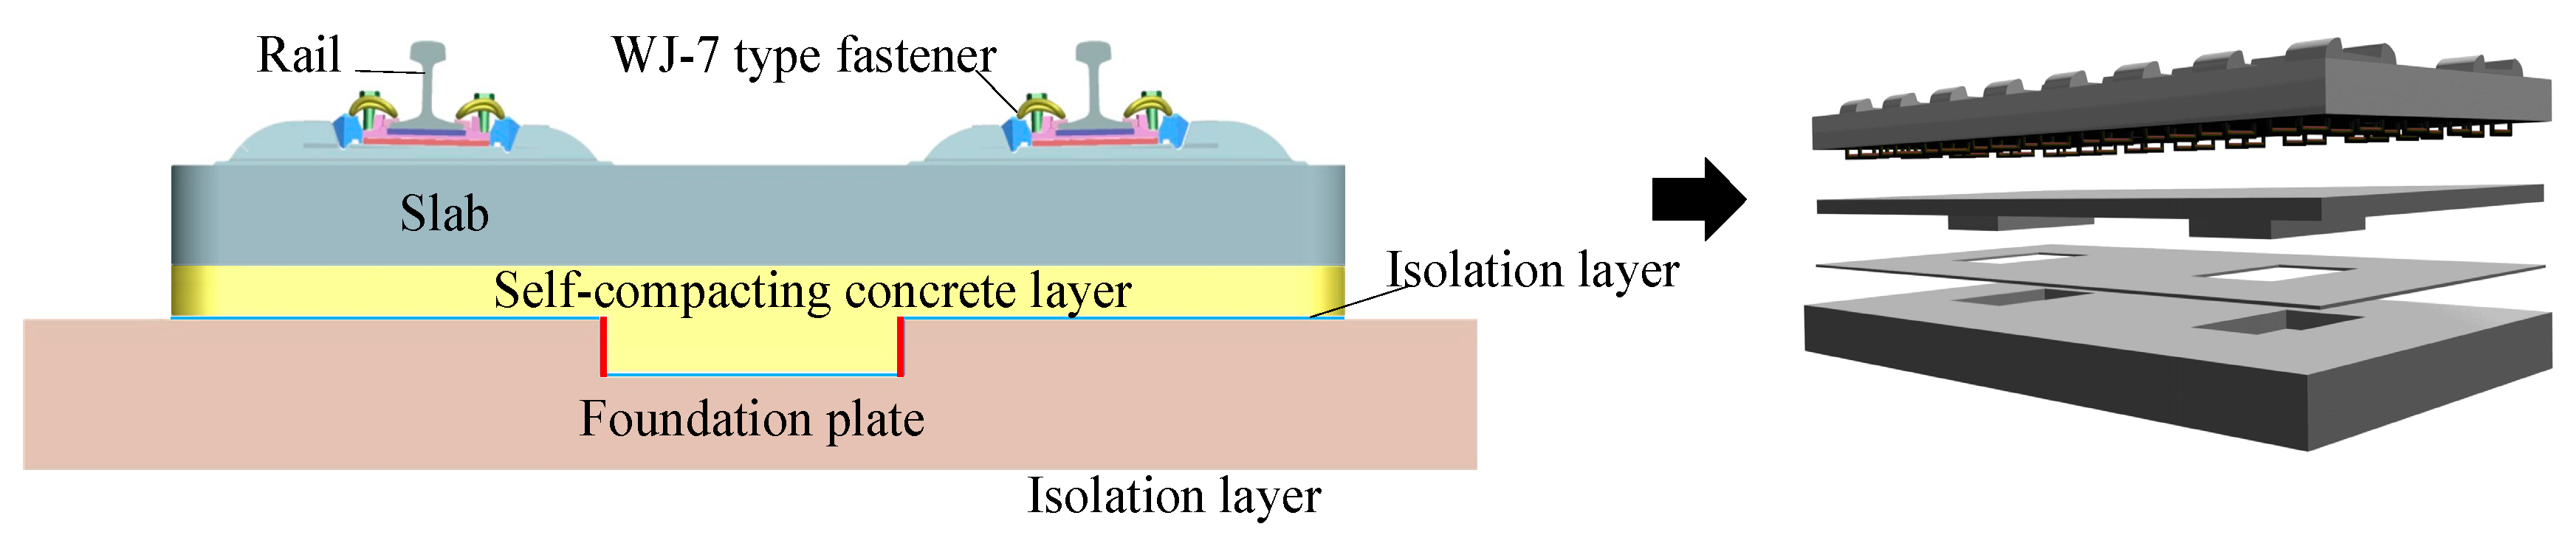
2.1.2. Slab Track Model

CRTS Ⅲ slab track is a two-dimensional prestressing slab track, independently developed by China, which has been applied in high-speed railways in cold regions. The track system consists of rails, WJ 7 type fasteners, the slab, the self-compacting concrete layer, the isolation layer made by geotextile and the foundation plate (shown in Figure 3) [40]. The slab track model is modelled by ABAQUS (v. 6.14, Dassault Systems, Vélizy-Villacoublay, France). The fasteners were simulated by a connector element which contained stiffness and damps in three directions; the isolation layer was treated as contact elements which only provided compressive stress, with a friction coefficient of 0.5 in the tangential direction; other components were simulated by solid elements [41,42]. As a filling layer, the self-compacting concrete layer was reinforced by u-shaped steels; thus, the interface between the slab and the self-compacting concrete layer was considered to be in a superior bonding state. Cooperating with the filling layer, two concave grooves (shown in Figure 3) were provided on the foundation plate to act as a limiting structure, and a contact stiffness was given to simulate the cushion inside the grooves [43]. Moreover, there were two slabs placed on one foundation plate. The structure parameters of the CRTS Ⅲ slab track are shown in Table 2.

2.1.3. Wheel-Rail Contact

The well-known Hertz non-linear elastic contact theory expressed by Equation (3) was applied to calculate the wheel-rail normal force [44].
p ( t ) = [ 1 G δ z ( t ) ] 3 / 2
In Equation (3), G refers to the wheel-rail contact constant (m/N2/3); δ z ( t ) represents the elastic compression between the wheel and rail (m); t refers to time (s).
The worn profile tread wheel was applied in this study; thus, the wheel-rail contact constant G was calculated by
G = 3.86 R 0.115 × 10 8
In Equation (4), R represents the wheel radius.
The wheel-rail tangential force is calculated by Kalker linear creep theory. Creep force in three directions Tx, Ty, Mz can be calculated by Equation (5):
{ T x = f 11 ξ x T y = f 22 ξ y f 23 ξ s p M z = f 32 ξ y f 33 ξ s p
In Equation (5), ξ x   , ξ x   , ξ s p refer to creepage in three directions;   f 11 , f 22 refer to longitudinal and lateral creep coefficients, respectively; f 23 , f 32 refer to lateral/spin creep coefficients, f23 = f32; f33 refers to spin creep coefficient.
ξ x , ξ x   , ξ s p could be calculated by Equation (6):
{ ξ x = V w 1 V r 1 V ξ x = V w 2 V r 2 V ξ s p = Ω w 3 Ω r 3 V
In Equation (6), V w 1 , V w 2 , Ω w 3 refer to longitudinal linear speed, lateral linear speed and spin angular speed of the wheel at the contact point, respectively; V r 1 , V r 2 , Ω r 3 refer to longitudinal linear speed, lateral linear speed and spin angular speed of the rail at the contact point, respectively; V refers to nominal speed of the wheel.
f 11 , f 22 , f 23 , f 33 can be determined by Equation (7):
{ f 11 = E a b C 11 f 22 = E a b C 22 f 23 = E ( a b ) 2 / 3 C 23 f 33 = E ( a b ) 2 C 23
In Equation (7), a and b refer to the major and minor axes of the wheel-rail contact ellipse area; E is the elastic modulus of wheel set and rail material; C i j refers to the Kalker coefficient, which can be obtained according to table lookup [45].
In order to avoid non-convergence in the iterative process caused by the non-positive definite coefficient matrices, the penalty function method is used to solve the wheel-rail contact behavior by introducing the normal and tangential contact conditions into the functional equation [38].
The random track irregularity recommended by the Chinese Track Irregularity Spectrum of High-Speed Railway Ballastless Track was used for the excitation of the wheel-rail system [24], as shown in Figure 4.

2.2. Simulation of Frost Heave in the Dynamic Models

2.2.1. Simulation of Frost Heave in Existing Dynamic Models

As mentioned above, when the vehicle-track system was the main analysis object, the subgrade frost heave was simulated by an upper convex cosine curve on the surface of the subgrade. The subgrade frost heave affected the track structure first and then the entire vehicle track coupling system indirectly. According to the influencing factors taken into account in the model, the dynamic models currently used to evaluate the dynamic response of vehicle-track systems in the frozen ground region could be classified into two categories, which, for ease of presentation, are referred to as Model-A and Model-B, respectively:
  • Model-A was only used to assess the impact of the track irregularity caused by subgrade frost heave on the dynamic system. In Model-A, the deformation of rail caused by subgrade frost heave was imported into the dynamic model as an initial track irregularity [22,23], as shown in Figure 5a;
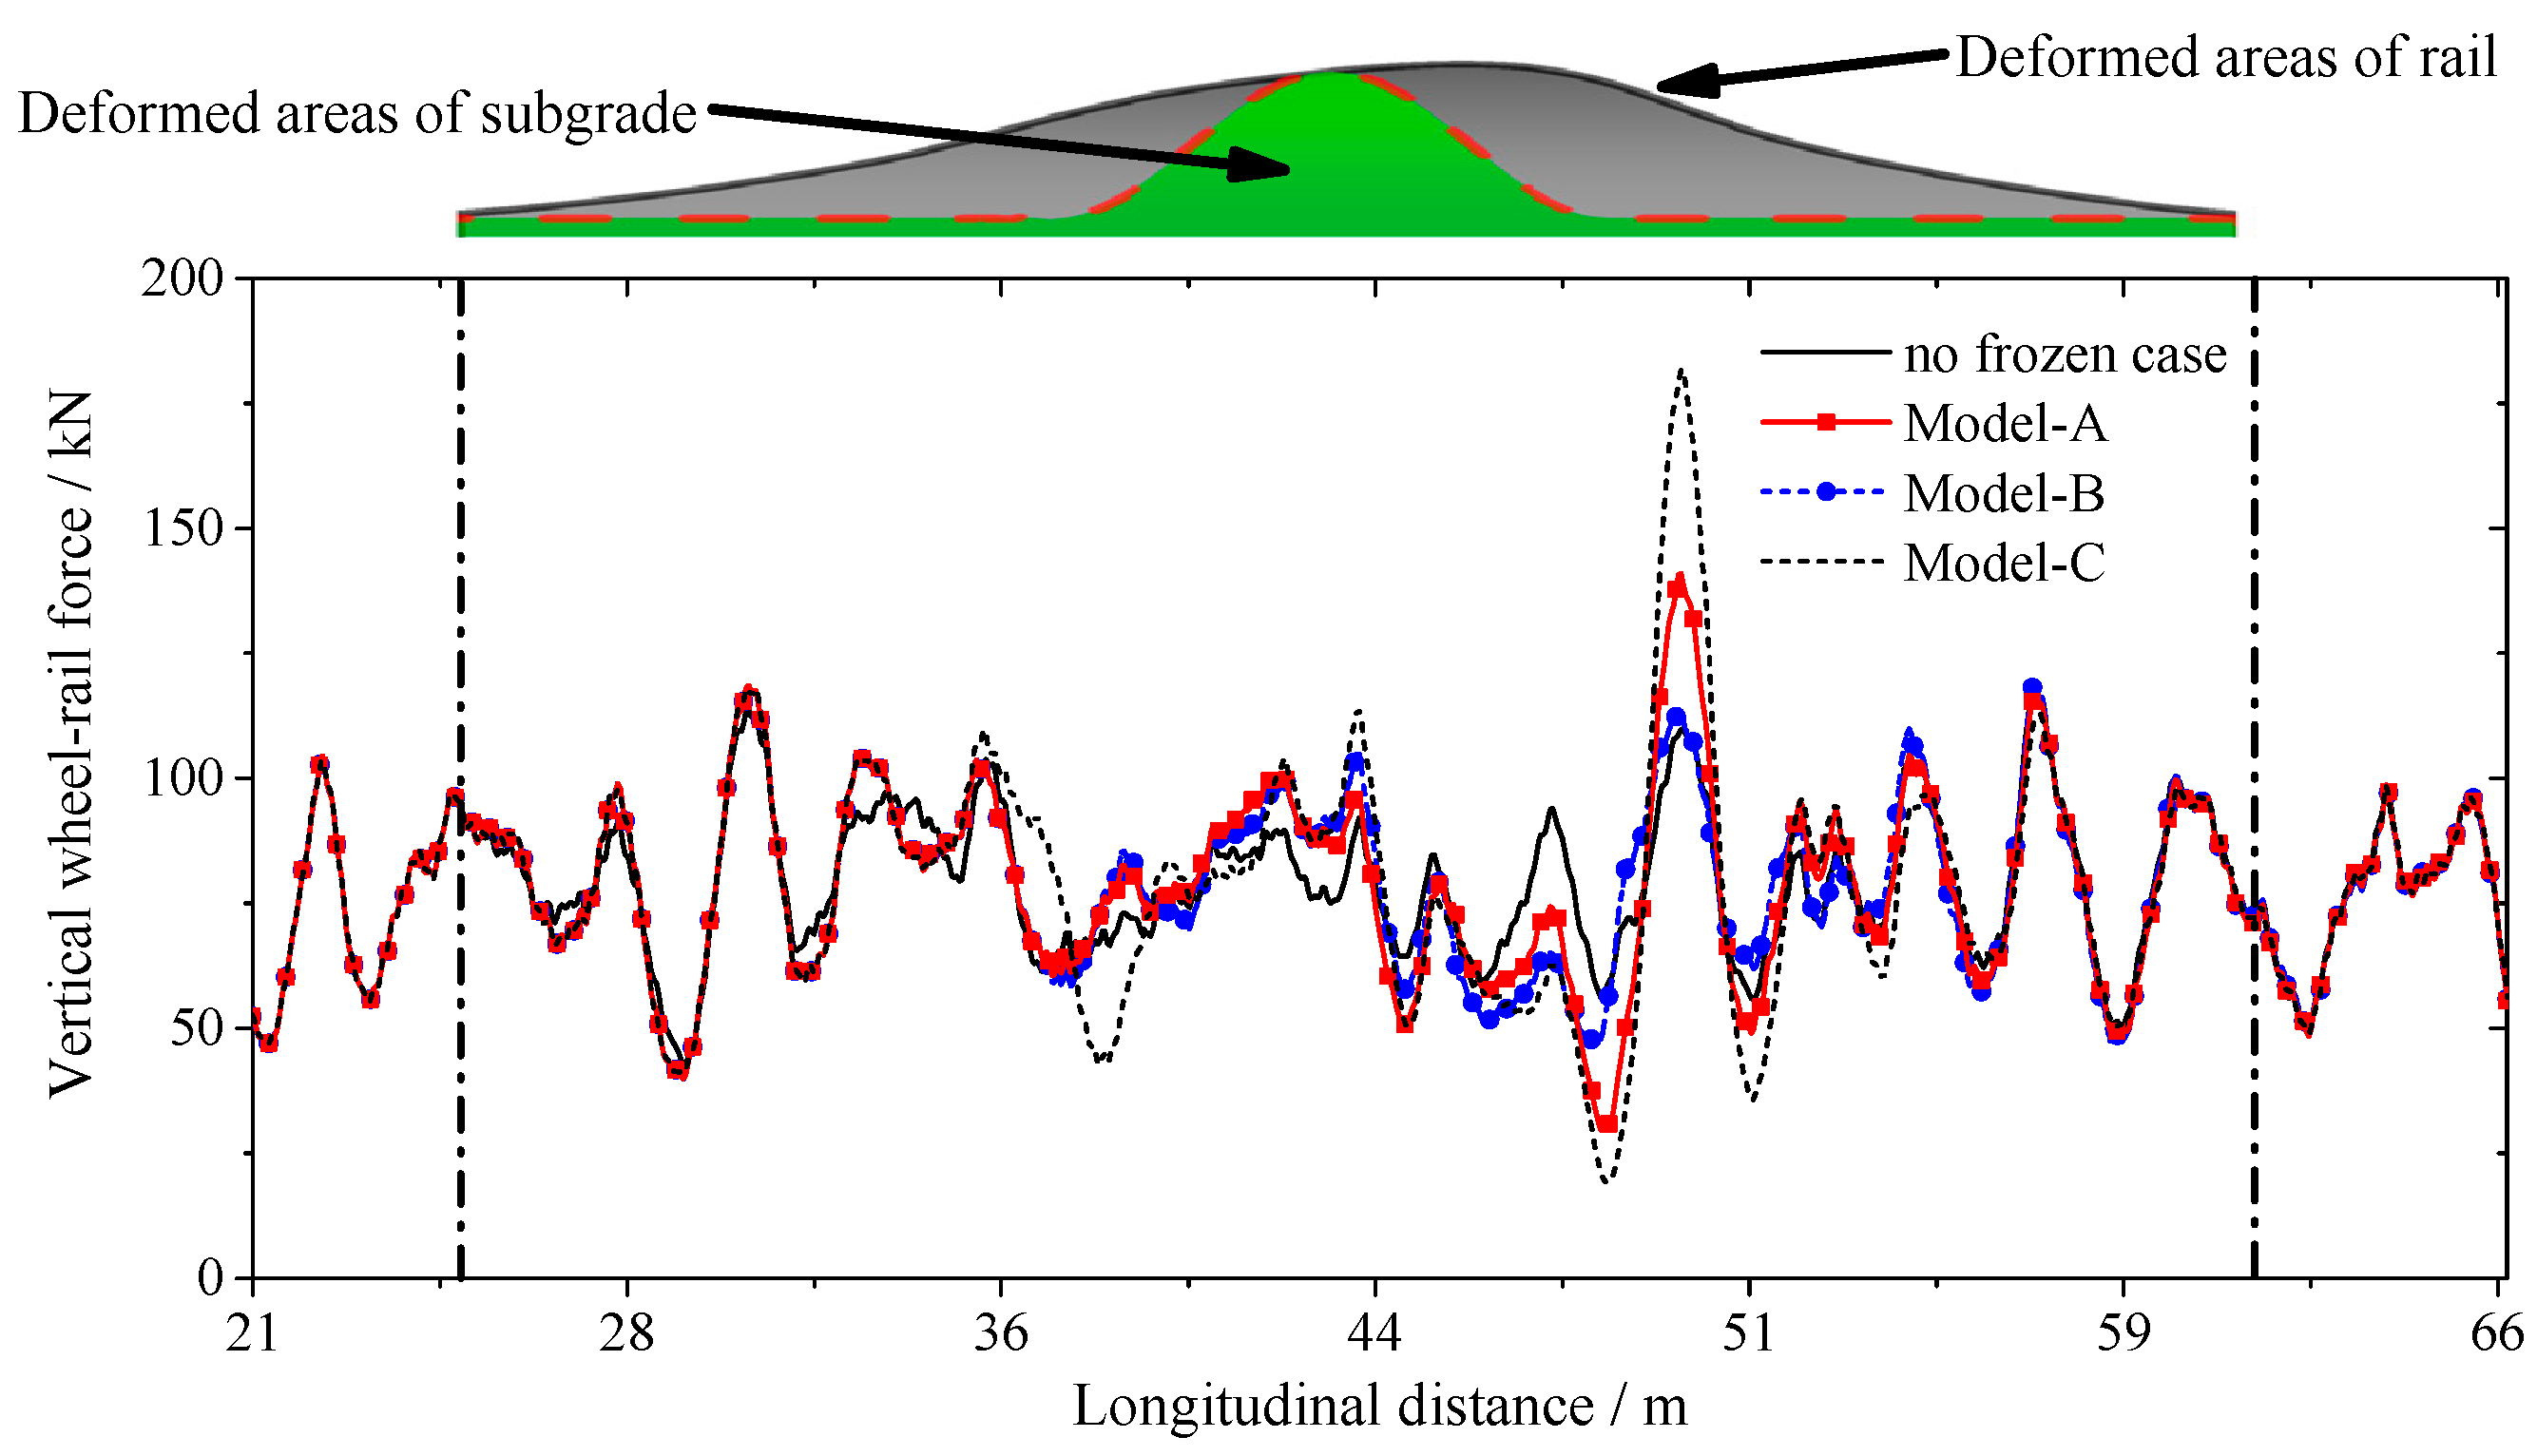
  • Model-B was built according to the method produced by Yang et al. [24]; the irregularity of rail as well as the contact loss underneath the foundation plate were both imported into the dynamic model, as shown in Figure 5b. Compared with Model-A, this model is more reasonable in the case of a short wavelength of frost heave.

2.2.2. A Novel FEM Model Based on Explicit Algorithm

After the occurrence of uneven subgrade frost heave, the slab track was lifted by the surface of the roadbed. Therefore, in addition to the track irregularities and the contact loss area considered in the above two models, the deformations and the constraints of the slab track itself were changed. The change would also alter the dynamic properties of the track structure, and the two existing models cannot simulate this very well. Thus, a novel dynamic model was built to analyze the effects on the dynamic response of the whole vehicle-track system when the track was lifted up by the subgrade frost heave. For convenience, the novel model was called Model-C.
Model-C uses the central difference method to perform explicit time integration on the kinetic equation throughout the whole time period [46], and the dynamic state of the previous increment is applied to calculate the dynamic state of the next increment. At the initial increment, the relation expressed by Equation (8) is used to solve the dynamic equilibrium equation in the solution program.
M · u ¨ = P I
In Equation (8), M is the mass matrix of nodes, u ¨ is the initial nodal acceleration, P is the initial external force, and I is the initial internal force of elements.
The nodal acceleration at time of t is calculated as:
u ¨ | ( t ) = M 1 ( P I ) | ( t )
In Equation (9), ( P I ) | ( t ) is the difference value between the external force and the internal force of elements at time of t.
The central difference method is used to perform time integration on the acceleration, and the acceleration is assumed to be constant when computing the change in velocity. The speed at the midpoint of the next increment is determined by the speed of the current increment and the midpoint of the previous increment, as shown in Equation (10).
u ˙ | ( t + Δ t 2 ) = u ˙ | ( t + Δ t 2 ) + Δ t | ( t + Δ t ) + Δ t | ( t ) 2   u ¨ | ( t )
In Equation (10), Δ t | refers to the time interval between two increments.
Moreover, the displacement of the next increment is determined by the displacement at the beginning of the increment and the integration of the velocity, as shown in Equation (11).
u | ( t + Δ t ) = u ( t ) + Δ t | ( t + Δ t )   u ˙ | ( t + Δ t 2 )
After the responses of nodes are calculated, the strain increments of elements are further calculated according to the strain rate shown in Equation (12), and the strain increment is substituted into the constitutive relation to calculate the stress, as shown in Equation (13).
d ε ( t ) = ε ˙ ( t ) = f ( u ˙ | ( t + Δ t ) u ˙ t )
In Equation (12), ε ˙ ( t ) refers to the strain rate; f ( u ˙ | ( t + Δ t ) u ˙ t ) is the computational formula of the strain rate, which is the function of u ˙ t and u ˙ | ( t + Δ t ) .
  σ ( t + Δ t ) = f ( σ ( t ) ,    d ε )
In Equation (13), f ( σ ( t ) ,    d ε ) is the constitutive relation described by σ ( t ) and d ε .
The explicit algorithm in Model-C based on the center of the central difference method always adopts a diagonal or centralized mass matrix, so it is not necessary to solve simultaneous equations when solving acceleration. The end state of the increment only depends on the initial state at the beginning of the increment, which greatly reduces the calculation cost.
We next present the analytical concept of Model-C (shown in Figure 6). Due to the weak correlation between vehicle loading and frost heave in the time series, the influence of subgrade frost heave deformation on the slab track was calculated as a quasi-static process before the vehicle started running.
In the quasi-static process, the subgrade frost heave was also simulated by an upper convex cosine curve, and only the vertical displacement was loaded in the model. To ensure that there was a separation between the foundation plate and the subgrade after the displacement loading, the interlayer between the foundation plate and the subgrade in the frozen region was simulated by contact elements in Model-C, whose normal direction was compression-only, and the tangential direction used the Coulomb friction model.
After the frost heave displacement was loaded in the quasi-static process, the vehicle model and the track model were connected by the wheel-rail contact. After the multi-rigid-body vehicle model was stabilized under its own weight, a certain velocity was assigned to the vehicle to calculate the dynamic response of the whole system.
It was noticed that all models mentioned in the paper could be built by the FEM software ABAQUS (v. 6.14, Dassault Systems, Vélizy-Villacoublay, France), and the explicit algorithm could also be implemented by using the ABAQUS/explicit solver, which provided an efficient solution for our research work.
To ensure the accuracy of quasi-static results in Model-C, the amplitude and the loading time of the frost heave were strictly controlled in the model to avoid the effects of inertial forces. The displacement of the frost heave was loaded by a ramped amplitude. The model provided 1.2 s for loading frost heave, 0.4 s for vehicle stabilization and 1 s for vehicle running. The length of the whole model was 120 m to ensure that the vehicle could fully drive through the affected area.

2.3. Model Validation

Model validation in this paper could be separated into two parts: Part 1 is the validation of quasi-static results caused by frost heave deformation in Model-C; Part 2 is the validation of vehicle-track dynamics calculation.
According to previous research, when the wavelength, the amplitude and the crest position of frost heave change, the impact on the ballastless track would also change. For example, when the relationship between the crest location of the upper cosine deformation and slab joint changes, the contact loss area under the foundation plate would be different. In order to clarify the action mechanism of contact loss in the system after frost heave more clearly, and to facilitate the verification of Model-C and the existing study, the condition consistent with the existing study [24] was chosen in this study, whereby the peak position of the upper cosine deformation was located below the quarter of the foundation plate and also the middle of the track slab (as shown in Figure 7).
After performing the quasi-static calculation of a subgrade frost heave with a wavelength of 10 m and an amplitude of 10 mm, the deformation of the slab track and the subgrade was determined and is shown in Figure 7. It was demonstrated that the CRTS Ⅲ slab track was raised into a bent state by the subgrade before the next vehicle running step was performed.

2.3.1. Validation of Subgrade Frost Heave Process Calculated by Explicit Algorithm

The quasi-static results (with the explicit algorithm in Model-C) and the static results (with the implicit algorithm) of the stress and deformation of the slab track are compared in this section. As a comparative indicator, the vertical deformation of the rail is shown in Figure 8a, and longitudinal stress of the foundation plate, which was impacted directly by subgrade deformation, is shown in Figure 8b.
It was found that the static and quasi-static results were in good agreement and only had minor differences in some of the peaks. It was assumed that the initial state of the slab track was correct before entering vehicle running analysis.

2.3.2. Validation of Vehicle-Track Dynamics Response

The same calculations as in Yang et al. (2017) [24] (the wavelength and amplitude of frost heave were 10 m and 10 mm respectively, with a speed of 300 km/h) were performed to verify the validity of the dynamic models. The car body acceleration result is compared with the results of [24] in Figure 9. Figure 9 shows that the vertical acceleration predicted from the analysis matches reasonably with the existing results, which validates the performance of the dynamic model of this paper.
To further compare and analyze the role of each factor in the influence mechanism, based on the basic calculation assumptions, this paper also considers the establishment of Model-A (the model only takes into account the track unevenness caused by freezing and swelling) and Model-B (the model takes into account both track unevenness and degassing).
To further compare and analyze the role of each factor in the influencing mechanism, based on the consideration of the basic computational assumptions, Model-A (where only the track irregularity caused by frost heave was considered in the model) and Model-B (where both the track irregularity and the contact loss area were considered in the model) were also established reductively.
The calculation results of the three models were also compared with actual dynamic test results of similar conditions on the Harbin-Dalian high-speed railway (shown in Table 3). Due to the distinctions with the actual lines in the aspects of irregularity, compaction of area, etc., there are some slight differences in the partial results. However, it can be found that the main dynamic response, such as the wheel-rail force and the car body acceleration, were all within the range of measured data. Moreover, the vertical acceleration of car body from Model-C, which considers the bending state and the weak constraint caused by frost heave, is much closer to the measured data. The other results of the dynamic model were more conservative and safe.
By comparing the results with the existing model and measured data, the dynamic modelling method proposed in the paper is validated.

3. Results

In this section, a typical case of short-wavelength frost heave (the amplitude of frost heave is 10 mm, and the wavelength is 5 m, with a speed of 300 km/h) is firstly analyzed, and results from three types of models are compared to study the influencing mechanism of frost heave on a vehicle-track coupling system. The vertical wheel-rail force of the first wheelset from different models is compared as an analysis example, as shown in Figure 10. It is noted that to better clarify the effect of frost heave on the vehicle-track system, the dynamic response of a normal line was also calculated. For convenience, the result of the normal line is referred to as the no frozen case (shown in Figure 10).

3.1. Comparison of Results between Model-A and No Frozen Case

The actual deformation areas of subgrade and rail, which were caused by frost heave, are marked at the top of Figure 10. It can be seen that the deformation of subgrade frost heave results in a wider range of track irregularities. To determine the influence of track irregularity caused by frost heave, the results from Model-A and the no frozen case are compared first.
As shown in Figure 10, compared with the results of the no frozen case, the vertical wheel-rail force of Model-A starts to fluctuate at 0.30 s. Until 0.74 s, the vertical wheel-rail force under the two cases returns to the same. After the vehicle enters the affected area at 0.3 s, the sudden change in irregularity makes the wheel-rail force increase to some extent. The wheelset receives the crest of the track irregularity at 0.57 s, and the vehicle has to balance the centrifugal force to adapt to the decrease in the height of the rail surface, which leads to a significant reduction in vertical wheel-rail force. Compared to the no frozen case, the vertical force of Model-A decreases by 42.90% at the corresponding moment.
After this, the downward centripetal force of the vehicle results in the increase in wheel-rail force at 0.6 s. There is a curvature change in the same position which could also increase the impact effect. The maximum wheel-rail force of Model-A also appears at this moment. The maximum wheel-rail force of Model-A is around 140.95 kN, which is 26.44% higher than that of the no frozen case. This result is consistent with data obtained in [22].
When the wavelength and amplitude of frost heave are 5 m and 10 mm, respectively, the length of the area, where the wheel-rail force is affected, is more than three times the wavelength of frost heave. Besides this, though the results of other models are different, the lengths of the affected area are basically the same (from 0.45 to 0.57 s in Figure 10). Moreover, the lengths of the affected area are also the same as the range of rail deformation, as marked by the chain lines in Figure 10. This illustrates that the affected distance of vehicle dynamic response in the longitudinal direction depends on the track irregularity caused by frost heave.

3.2. Comparison of Results between Model-A and Model-B

Results from Model-A and Model-B are compared to determine the influence of contact loss area caused by frost heave. According to Figure 10, the significant load reduction position at 0.57 s and the load increase position at 0.60 s are the most obvious differences among the four models. The vertical force of Model-B is around 47.86 kN at 0.57 s, while the result of Model-A is 30.14 kN. When the vehicle reaches 0.60 s, the vertical force of Model-B is around 111.61 kN, which is 20.82% less than Model-A. The result of Model-B is much closer to that of the no frozen case.
To explore the reasons for the difference between Model-A and Model-B, both track irregularity and contact loss area under the foundation plate caused by frost heave are compared in Figure 11. As shown in Figure 11, there is no contact loss at the crest of irregularity, but the amplitude of contact loss is similar to that of other regions within the affected area. The special spatial distribution of geometric features, which works with random irregularities, might reduce the dynamic irregularity of the first wheelset.
Figure 12 shows the vertical acceleration of the track slab with different cases. The selected node for comparison is located at the end of the slab (which is described as Position A in Figure 7). According to Figure 12, there is a large fluctuation in the result of Model-B. The maximum acceleration of Model-B is 29.92 m/s2, which is more than twice that of Model-A. Moreover, the result of Model-A is much more similar to that of the no frozen case. The existence of the contact loss area makes the bottom support of the track structure discontinuous and the weak vertical constraint changes the vibration law of the track slab. For structures under the rail, the contact loss area under the foundation plate brings a larger vibration.

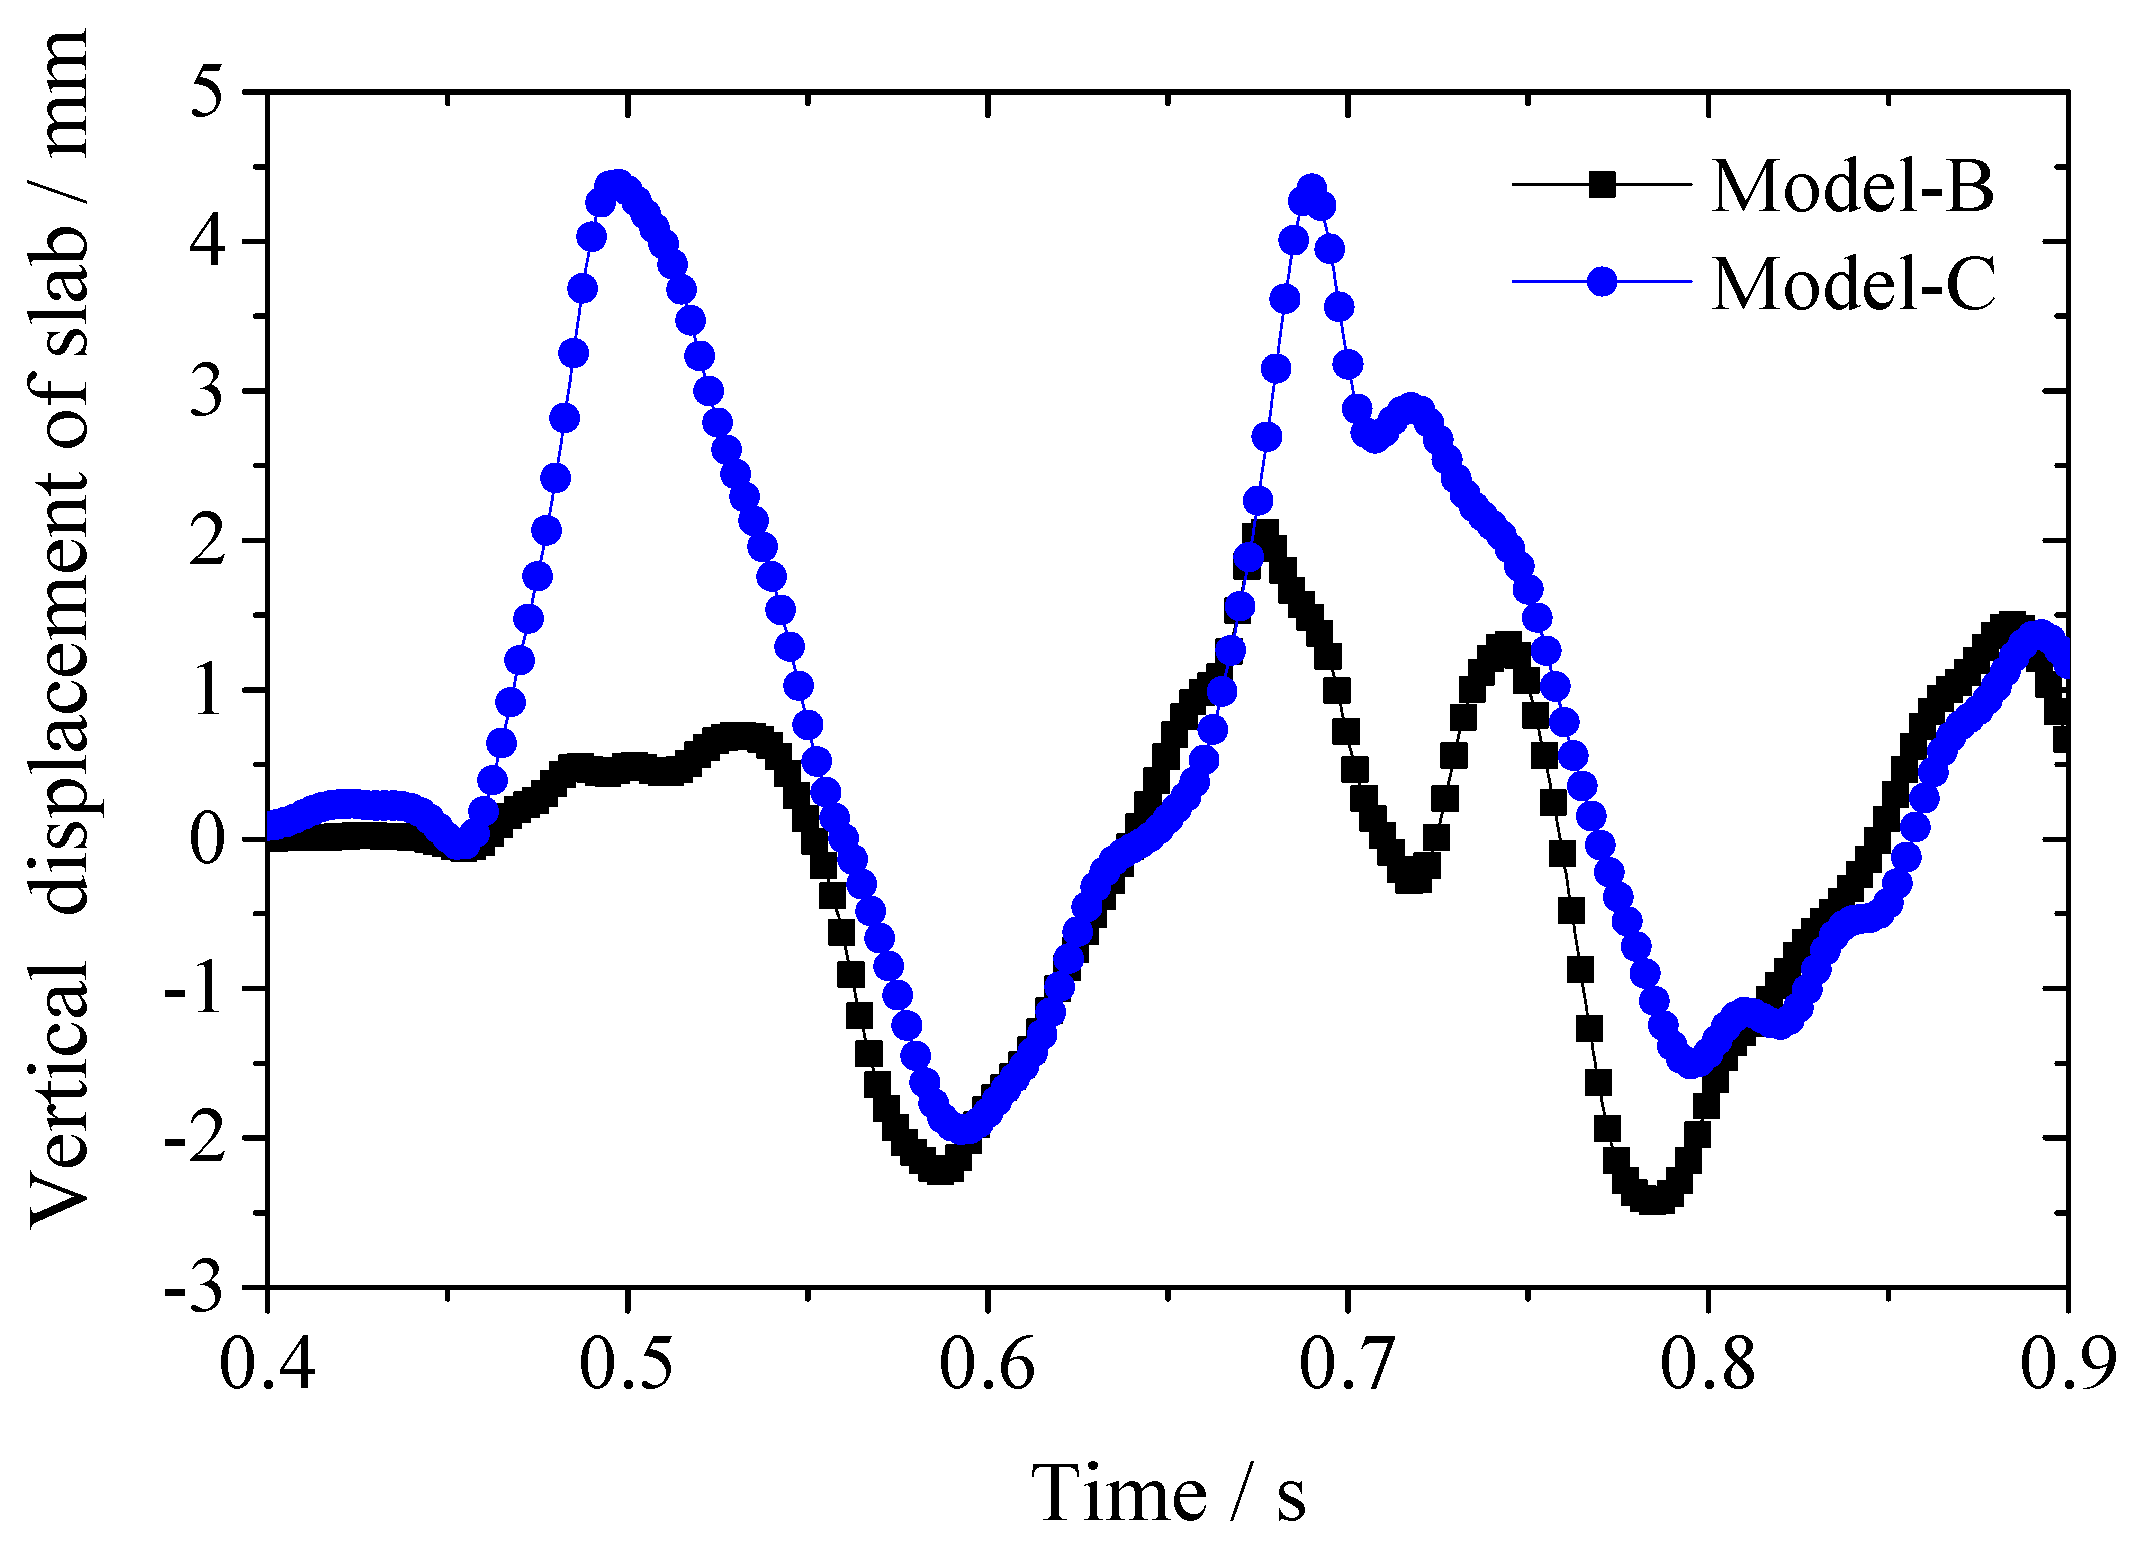
3.3. Comparison of Results between Model-C and Other Models

Results from Model-C and other models are compared to determine the influence of initial stress and deformation of slab track caused by frost heave. According to Figure 10, there is also a relatively large difference between the result of Model-C and the other two models. For example, both Model-B and Model-C have taken into account the influence of contact loss area during the calculation; however, the maximum vertical force of Model-C is around 181.74 kN at the time of 0.60 s, which is 30.10% higher than that of Model-B. Moreover, whether the contact loss plays an important role in the difference is debatable.
To determine the reason for the difference in wheel-rail force between Model-B and Model-C, the dynamic response of the track structure needed further analysis. When the vehicle passes by the contact loss area, the interlayer gap closes and there is a clapping action between the structural layers. The clapping action between all structures’ layers is finally reflected in the interlayers between the foundation plate and subgrade. The contact pressure of the foundation plate-subgrade interlayer is shown in Figure 13. The selected contact layer for comparison is located in the contact loss area (which is described as Position B in Figure 7). It can be seen that the maximum contact pressure of Model-C is not too different from that of Model-B. It is suggested that the contact loss area in Model-C may not be the cause of the increment in the wheel-rail force. Besides this, the time history was very similar in shape and value to that in [24].
Figure 13 has demonstrated that the contact loss area is not the cause of the difference between Model-C and Model-B. However, in further analysis, we found that there is also a significant difference in the dynamic displacement of the track slab above the contact loss area in the two models, which may be a key factor to increase the dynamic response of the wheel and rail in Model-C.
The time history of vertical displacement with Model-B and Model-C is compared in Figure 14. The selected node for comparison is located above the end of the foundation plate (which is described as Position A in Figure 7). According to Figure 14, the maximum upturned deformation of Model-C is around 4.38 mm, while the result of Model-B is only 2.26 mm.
Because the track structure is bent by subgrade, only a small part of the whole foundation plate is supported by the crest of frost heave, and the contact loss area appears in the front and back of the crest, making the slab track more like a lever. When the wheel load compacts the contact loss area in front of the crest, the structure, which is located above the contact loss area in the back of the crest, would appear as an upturned displacement due to the bending stiffness of the track structure. The upturned displacement would be amplified by the bending state of the track slab itself.
In the calculation of Model-B, the contact loss area is simply imported, while the track structure is still in normal condition. However, the leverage effect of the slab track is first calculated and the deformation, the stress and the constraint were transferred into the vehicle running analysis in Model-C, which generates a larger upturned displacement of the track structure.
In the end, a larger upturned displacement brings larger dynamic irregularity, which leads to a greater vertical wheel-rail force in Model-C.
The vertical acceleration of the car body under different cases is shown in Figure 15. Compared with the no frozen case, the vertical acceleration of the car body showed obvious fluctuations after entering the frost heave area. The mode of fluctuation is influenced by the superposition between the dynamic responses of the front and the back bogies, which could also achieve a good agreement with the results in [22,23,24]. However, the results of the three models showed no significant differences in this short-wavelength frost heave condition, which indicates that the short-wave impacted caused by the contact loss area and the leverage effect has been basically eliminated through the transmission of primary and secondary suspensions, while the track irregularity with a longer wavelength becomes the main factor affecting the acceleration of the car body.

4. Discussion

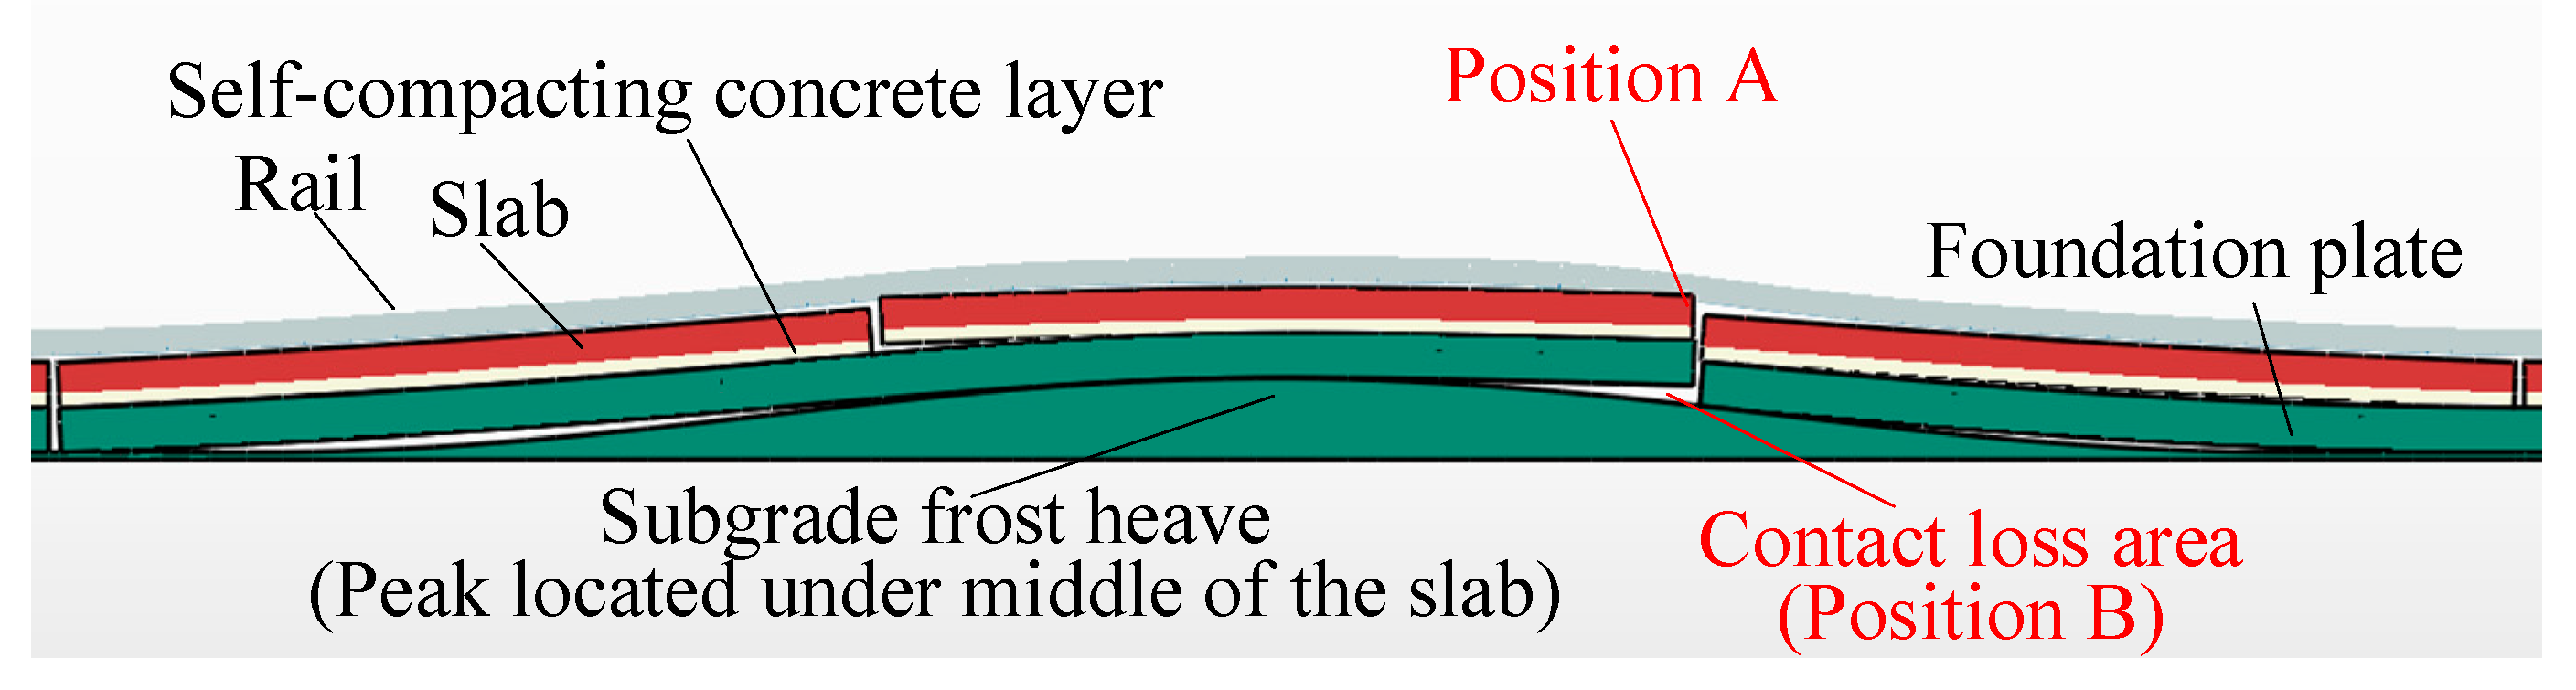
4.1. Discussion of the Influencing Mechanism of Frost Heave on Vehicle-Track Coupling System

When subgrade frost heave occurs, the track structure is lifted by the crest of the frost heave, and the whole system works like a lever, and the dynamic process of the vehicle-track system in the frost heave zone is summarized in Figure 16.
When the vehicle is passing through the affected area, the track irregularity influences the dynamic response first; the influence of the track irregularity can be derived from the results of Model-A. When the wheel load passes by the contact loss area (if it exists), it causes the interlayer space to close, and the adjacent longitudinal structures exhibit an upturned compatible deformation due to the structure bending stiffness. This can be seen as a kind of leverage effect. Besides this, the initial bending condition caused by frost heave deformation and the weak vertical constraint of the slab track amplify this effect, which also decreases the stability of the slab track and increases the dynamic irregularity.
In summary, the influencing mechanism of frost heave on the vehicle-track coupling system can be separated into three parts:
(a)
Track irregularity, which is responsible for the changes in the dynamic response and for determining the length of the affected area of wheel-rail force.
(b)
Contact loss area underneath the structure, which may change the dynamic irregularity (increasing or decreasing for different wheelsets) and increase the vibration of the slab track;
(c)
Leverage effect of slab track caused by the constraint condition and the bending stiffness itself, which further increases the short-wavelength dynamic irregularity.

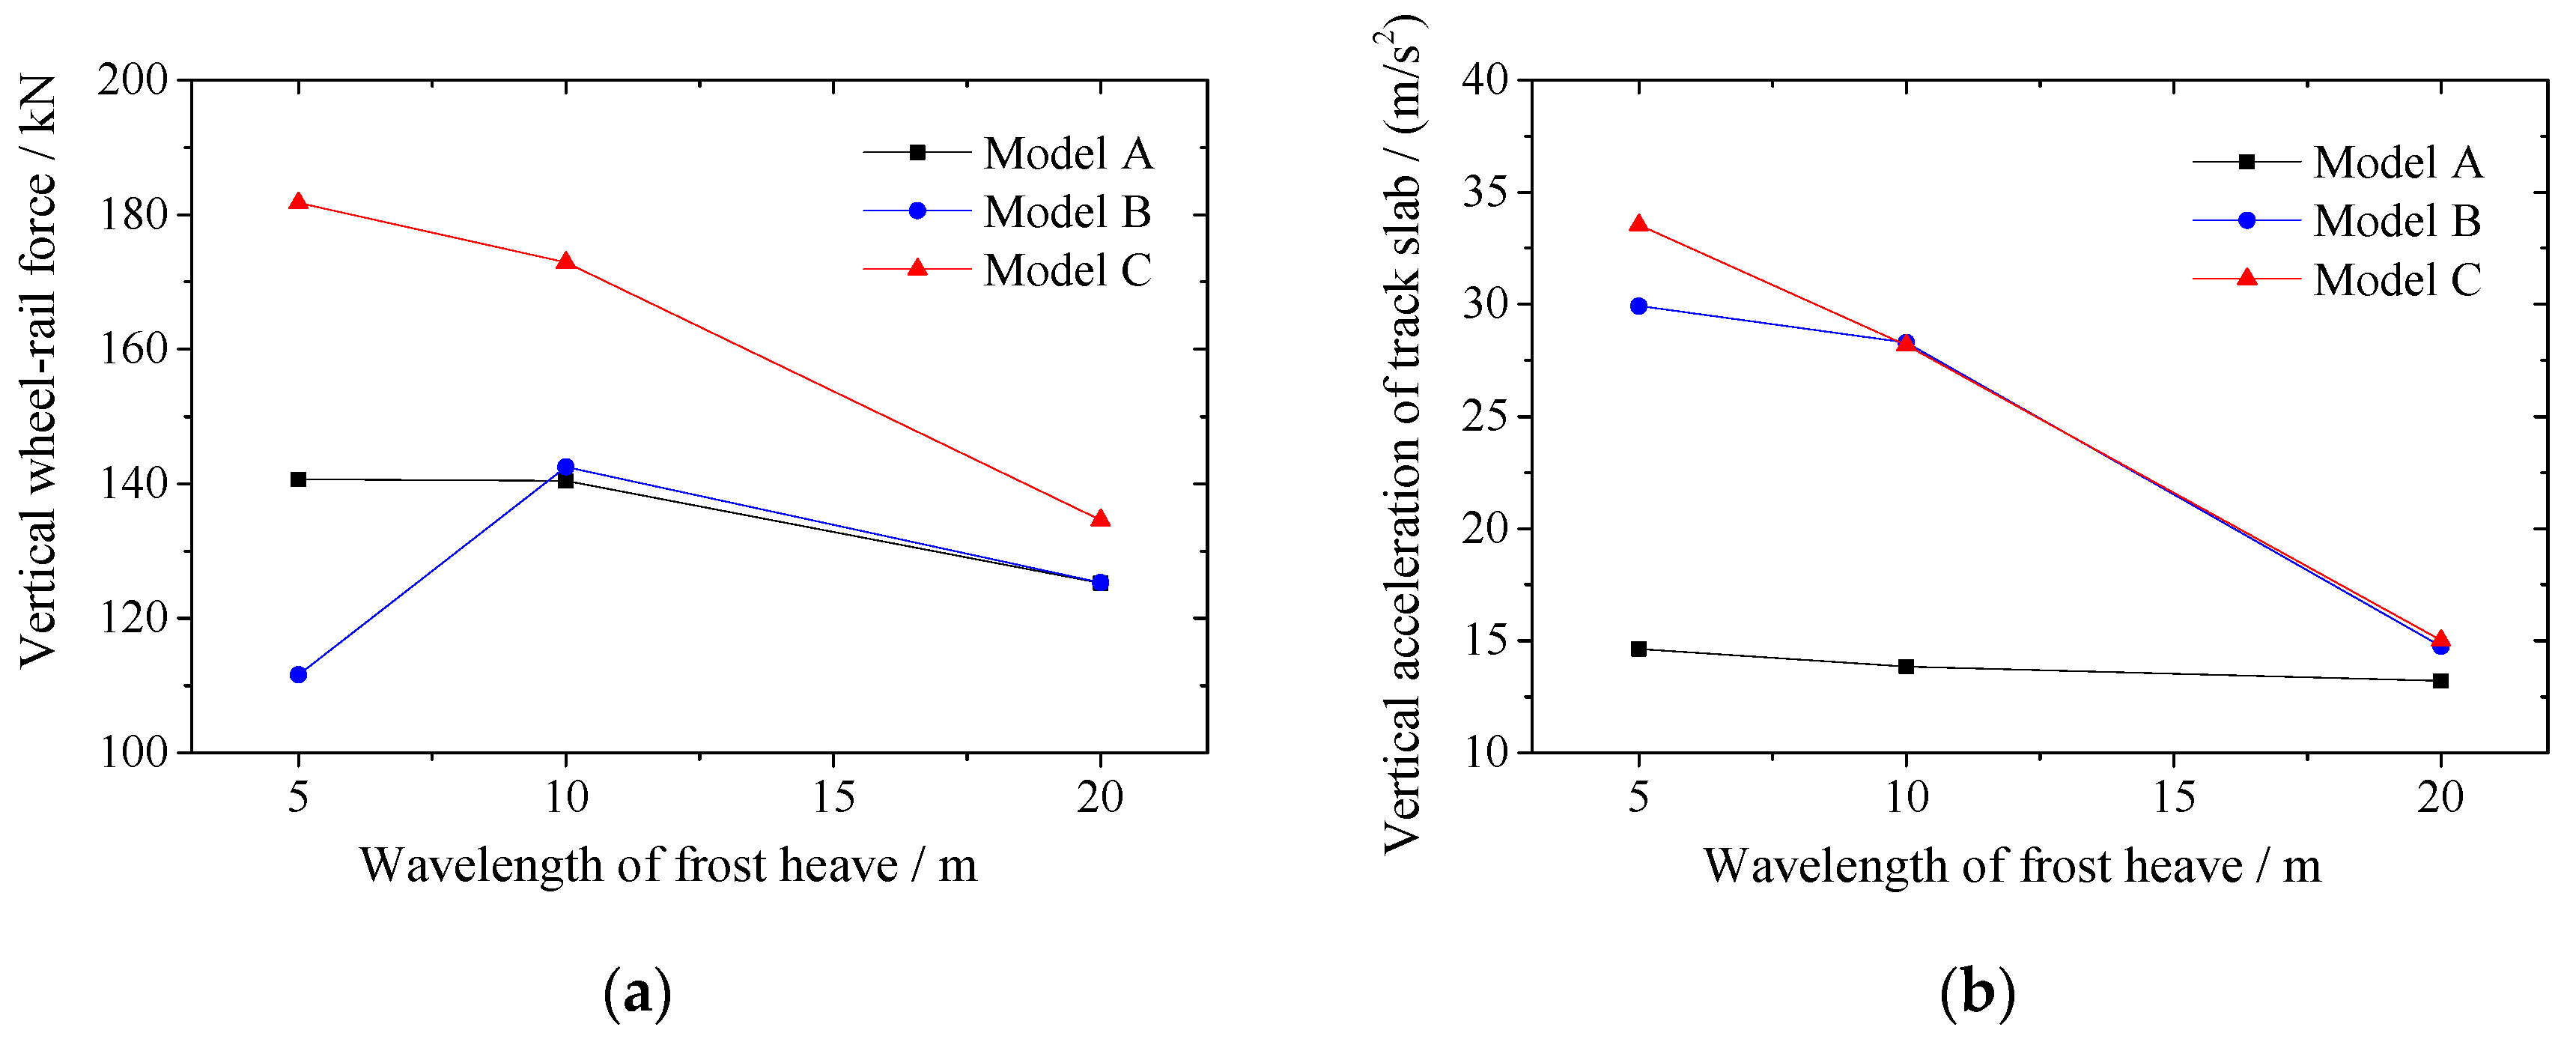
4.2. The Extension of the Influencing Mechanism in Different Ratios of Wavelength to Amplitude

The wavelength of frost heave refers to the length over which there is a change in subgrade elevation in the longitudinal direction. The increase in the ratio of wavelength to amplitude leads to a decreased rate of change in elevation due to frost heave, which would promote compatible deformation between slab track and subgrade.
According to the monitoring data, the maximum wavelength of frost heave detected in the field is up to 40 m, most of which is between 10 and 20 m. In this section, by setting the amplitude as the typical value of 10 mm, scenarios with wavelengths of 5, 10 and 20 m are calculated. The calculated results of the three models are analyzed to study how the ratio of wavelength to amplitude affects the influencing mechanism.
The maximum vertical wheel-rail force of the first wheelset under different wavelengths is shown in Figure 17a. In Model-A and Model-C, the wheel-rail force decreases as the wavelength increases. When the wavelength is 5 m and the amplitude is 10 mm, the vertical force of Model-B is even smaller. This is because the irregularity is covered by the contact loss underneath the foundation plate at the first wheelset. Significantly, only the first wheelset in Model-B shows this phenomenon, and the results of other wheelsets in Model-B are similar to those of the other two models. As the wavelength increases, the differences between the results of the three models become more and more similar. For example, the maximum wheel-rail force of Model-B is 20.82% less than that of Model-A and 46.22% less than that of Model-C when the wavelength is 5 m. When the wavelength is 20 m, the result of Model-B is 6.90% less than that of Model-C and almost the same as that of Model-A.
The effects of increasing the wavelength on the maximum vertical acceleration of the car body and the track slab are shown in Figure 17b, respectively. In Figure 17b, the acceleration is selected from the same position as in Figure 12. It can be seen that the increase in wavelength results in the decrease in the acceleration. With the contact loss area becoming smaller as a result of the longer wavelength, the results of acceleration of the slab in the three models grow closer.
The maximum interlayer contact pressure change in the contact loss area for different wavelengths is shown in Figure 17c. According to the model assumption, only the result between Model-B and Model-C is compared. Figure 17c shows that there is a sharp drop in the interlayer contact pressure as the wavelength increases. In Model-C, for example, the contact pressure drops from 0.62 to 0.39 MPa when the wavelength increases from 5 to 20 m. The divergence in contact pressure between the two models becomes lower as the wavelength increases. The decreasing amplitude of the contact loss area may cause a reduction in contact pressure.
It can be seen from the results that as the ratio of wavelength to amplitude increases, the slab track shows better adaptability to the deformation of subgrade, the contact loss area decreases and the bottom of the ballastless track almost fits with the subgrade. Therefore, even though the ballastless track is bent by subgrade at this time, the leverage effect is not apparent anymore. When the wavelength is 20 m and the amplitude is 10 mm, the track irregularity becomes the dominant influencing factor of the frost heave.
An additional uncontrolled factor in the study is the possibility that, due to the granular property of the subgrade, the contact loss area underneath the structure may be gradually compacted and reduced in the long term. Therefore, the calculation results in this paper are more conservative. The damage of the slab track, which could be induced by other complicated environmental loads in cold regions, is not taken into account in the model. The model could be further optimized according to the actual service state of the track structure in the site. Besides this, it should be noted that the method proposed in this paper can be applied to the numerical simulation of other foundation deformation problems such as subgrade settlement and bridge deflection.

5. Conclusions

In this work, different simulation methods of subgrade frost heave in the vehicle-track dynamic model were compared, and a novel FEM model based on an explicit algorithm was applied in the paper to evaluate the dynamic response of the vehicle-track system under subgrade frost heave. With a case of short-wavelength frost heave, the influencing mechanism of frost heave on the vehicle-track coupling system was studied in detail, and the influence of different ratios of wavelength to amplitude was also discussed. The research results could provide a reference for the management and maintenance of subgrade frost heave in high-speed railways. The following conclusions are drawn:
  • The influencing mechanism of frost heave on the vehicle-track system can be separated into three parts: track irregularity, contact loss area underneath the structure and leverage effect of the bent slab track.
  • Track irregularity caused by frost heave produces a fluctuation in the vehicle dynamic response, and the affected distance of track irregularity determines the effect distance of the vehicle dynamics index.
  • A short-wavelength frost heave might cause a large amplitude of the contact loss area underneath the slab track. The contact loss area weakens the constraint of the slab track, which also produces an increase in slab track vibration. There is contact pressure in the contact loss area when the vehicle passes by.
  • The slab track is lifted by the crest of frost. We observed a leverage effect, which might cause larger dynamic irregularity and lead to a greater dynamic response in the wheel-rail system. The initial bending condition caused by frost heave and the weak vertical constraint of the slab track amplify the leverage effect.
  • With the ratio of wavelength to amplitude increasing, the contact loss area and the leverage effect are reduced. The influence mechanism of frost heave on the vehicle-track coupling system gradually tends to be dominated by track irregularity.

Author Contributions

Conceptualization, L.G. and W.Z.; methodology, L.G.; validation, W.Z. and B.H.; investigation, Y.Z.; data curation, B.H. and Y.Z.; writing—original draft preparation, L.G., W.Z.; writing—review and editing, W.Z. and B.H. All authors have read and agreed to the published version of the manuscript.

Funding

This research was funded by National Key R&D Program of China (2016YFB1200402), Key Program of National Natural Science Foundation of China (U1734206), National Natural Science Foundation of China—National Major Scientific Research Instrument Development Project (51827813) and Open Fund of National Key Laboratory of Track Technology(China Academy of Railway Sciences Corporation Limited)(2019YJ197).

Conflicts of Interest

The authors declare no conflict of interest.

References

  1. Niu, F.; Li, A.; Luo, J.; Lin, Z.; Yin, G.; Liu, M.; Zheng, H.; Liu, H. Soil moisture, ground temperatures, and deformation of a high-speed railway embankment in Northeast China. Cold Reg. Sci. Technol. 2017, 133, 7–14. [Google Scholar] [CrossRef]
  2. Tong, F.; Gao, L.; Cai, X.; Zhong, Y.; Zhao, W.; Huang, Y. Experimental and Theoretical Determination of the Frost-Heave Cracking Law and the Crack Propagation Criterion of Slab Track with Water in the Crack. Appl. Sci. 2019, 9, 4592. [Google Scholar] [CrossRef] [Green Version]
  3. Hu, X.; Wu, Y.; Li, X. A Field Study on the Freezing Characteristics of Freeze-Sealing Pipe Roof Used in Ultra-Shallow Buried Tunnel. Appl. Sci. 2019, 9, 1532. [Google Scholar] [CrossRef] [Green Version]
  4. Zhang, Y.Z.; Du, Y.L.; Sun, B.C.; Hao, G.J. Analysis of High-Speed Railway Roadbed Deformation in Seasonally Frozen Region. Appl. Mech. Mater. 2014, 505, 121–124. [Google Scholar] [CrossRef]
  5. Wang, C.; Zhang, R.; Zhao, X. Frost Heaving Monitoring System and Frost Heaving Rules for the High-Speed Railway Embankment in the Seasonally Frozen Soil Regions. J. Glaciol. Geocryol. 2014, 36, 962–968. [Google Scholar]
  6. Zhao, S.; Liu, H.; Li, X.M.; Li, A.Y.; Niu, Y.H.; Niu, F.J. Intelligent monitoring system for embankment deformation of high-speed railway in cold regions: Design and implementation. J. Glaciol. Geocryol. 2014, 4, 944–952. [Google Scholar]
  7. Hou, J.F.; Wang, Y.L.; Feng, J. Field Test Study on Frost-Heave of Subgrade in Seasonal Frozen Region along Haerbin-Dalian Passenger Dedicate Line. Adv. Mater. Res. 2013, 671, 45–49. [Google Scholar] [CrossRef]
  8. Zhao, G.; Liu, X.; Gao, L.; Cai, X. Characteristic analysis of track irregularity in subgrade frost heave area of harbin-dalian high-speed railway. J. China Railw. Soc. 2016, 38, 105–109. [Google Scholar]
  9. Hwang, S.H.; Kim, S.-I.; Lee, K.-C.; Jang, S. Effects of Long-Wavelength Track Irregularities Due to Thermal Deformations of Railway Bridge on Dynamic Response of Running Train. Appl. Sci. 2018, 8, 2549. [Google Scholar] [CrossRef] [Green Version]
  10. Lei, X.; Mao, L. Dynamic response analyses of vehicle and track coupled system on track transition of conventional high speed railway. J. Sound Vib. 2004, 271, 1133–1146. [Google Scholar] [CrossRef]
  11. Wang, Z.C.; Song, Y.; Jian-Xi, W. Relation between Track Irregularity of Speed-Increased Railway and Dynamic Speed Limits through Simulation. Mech. Eng. J. 2014, 8, 197–200. [Google Scholar] [CrossRef]
  12. Gao, L.; Zhao, L.; Qu, C.; Cai, X. Analysis on Design Scheme of CRTS Ⅲ Slab Track Structure on Roadbed. J. Tongji Univ. Nat. Sci. 2013, 41, 848–855. [Google Scholar]
  13. Wang, P.; Gao, L.; Zhao, L.; Qu, C. Study on setting method of position-limitation recess of CRTS Ⅲ slab track on subgrade. J. Eng. Mech. 2014, 161, 221–224. [Google Scholar]
  14. Zhao, G.; Zhao, L.; Zhang, L.-S. Mechanical Characteristics of Ballastless Track under Subgrade Frost Heaving in High-speed Railway. J. Railw. Eng. Soc. 2017, 227, 53–61. [Google Scholar]
  15. Niu, F.; Zheng, H.; Li, A. The study of frost heave mechanism of high-speed railway foundation by field-monitored data and indoor verification experiment. Acta Geotech. 2018, 15, 581–593. [Google Scholar] [CrossRef]
  16. Zhang, S.; Sheng, D.; Zhao, G.; Niu, F.; He, Z. Analysis of frost heave mechanisms in a high-speed railway embankment. Can. Geotech. J. 2016, 53, 520–529. [Google Scholar] [CrossRef]
  17. Wu, X.; Niu, F.; Lin, Z.; Luo, J.; Zheng, H.; Shao, Z. Delamination frost heave in embankment of high speed railway in high altitude and seasonal frozen region. Cold Reg. Sci. Technol. 2018, 153, 25–32. [Google Scholar] [CrossRef]
  18. Wang, Q.; Tai, B.; Liu, Z.; Liu, J. Study on the sunny-shady slope effect on the subgrade of a high-speed railway in a seasonal frozen region. Sci. Cold Arid Reg. 2015, 7, 513–519. [Google Scholar]
  19. Zhang, Y.-Z.; Du, Y.; Sun, B.-C. Temperature distribution analysis of high-speed railway roadbed in seasonally frozen regions based on empirical model. Cold Reg. Sci. Technol. 2015, 114, 61–72. [Google Scholar] [CrossRef]
  20. Zhao, G. Study on Management Standard of Frost Heaving of Ballastless Track Subgrade on High-speed Railway in Severe Cold Region. J. China Railw. Soc. 2018, 38, 1–8. [Google Scholar]
  21. Cai, X.; Liang, Y.; Tan, S.; Shen, Y. Deformation and seam characteristics analysis of CRTS I slab ballastless track in subgrade frost heaving zone. J. Beijing Jiaotong Univ. 2017, 41, 7–13. [Google Scholar]
  22. Cai, X.; Liang, Y.; Xin, T.; Ma, C.; Wang, H. Assessing the effects of subgrade frost heave on vehicle dynamic behaviors on high-speed railway. Cold Reg. Sci. Technol. 2019, 158, 95–105. [Google Scholar] [CrossRef]
  23. Luo, B.; Lai, H.; Ishikawa, T.; Tokoro, T. Frost heave analysis of ballasted track above box culvert and its influence on train vibration. Sci. Cold Arid Regions. 2017, 9, 0229–0235. [Google Scholar]
  24. Yang, G.; Gao, L.; Liu, X.; Zhao, W. Research on division standard of subgrade frost heave for CRTS Ⅲ slab track based on dynamic analysis. J. China Railw. Soc. 2017, 39, 111–117. [Google Scholar]
  25. Ford, R. Differential Ballast Settlement, and Consequent Undulations in Track, Caused by Vehicle-Track Interaction. Veh. Syst. Dyn. 1995, 24, 222–233. [Google Scholar] [CrossRef]
  26. Lundqvist, A.; Dahlberg, T. Dynamic train/track interaction including model for track settlement evolvement. Veh. Syst. Dyn. 2004, 41, 667–676. [Google Scholar]
  27. Nguyen, K.; José, M.G.; Gabaldon, F. Dynamic effect of high speed railway traffic loads on the ballast track settlement. In Proceedings of the Congresso de Métodos Numéricos em Engenharia, Coimbra, Portugal, 14 June 2011. [Google Scholar]
  28. Grossoni, I.; Powrie, W.; Zervos, A.; Bezin, Y.; Le Pen, L. Modelling railway ballasted track settlement in vehicle-track interaction analysis. Transp. Geotech. 2020, 26, 100433. [Google Scholar] [CrossRef]
  29. Paixão, A.; Fortunato, E.; Calçada, R. The effect of differential settlements on the dynamic response of the train–track system: A numerical study. Eng. Struct. 2015, 88, 216–224. [Google Scholar] [CrossRef]
  30. Zhao, G.; Gao, L.; Lei, Z.; Zhong, Y. Analysis of dynamic effect of gap under CRTS Ⅱ track slab and operation evaluation. J. China Railw. Soc. 2017, 39, 1–10. [Google Scholar]
  31. Zhou, J.; Chen, X.; Zhou, J.; Xu, G.; Cai, D. Dynamic Responses of Asphalt Concrete Waterproofing Layer in Ballastless Track. Appl. Sci. 2019, 9, 375. [Google Scholar] [CrossRef] [Green Version]
  32. Song, Y.; Du, Y.; Zhang, Y.; Sun, Z. Evaluating the Effect of Wheel Polygons on Dynamic Track Performance in High-Speed Railway Systems Using Co-Simulation Analysis. Appl. Sci. 2019, 9, 4165. [Google Scholar] [CrossRef] [Green Version]
  33. Muñoz, S.; Aceituno, J.F.; Urda, P.; Escalona, J.L. Multibody model of railway vehicles with weakly coupled vertical and lateral dynamics. Mech. Syst. Signal. Process. 2019, 115, 570–592. [Google Scholar] [CrossRef]
  34. Gao, L.; Qu, C.; Qiao, S.; Cai, X.; Liu, W. Analysis on the influencing factors of mechanical characteristics of jointless turnout group in ballasted track of high-speed railway. Sci. China Ser. E Technol. Sci. 2012, 56, 499–508. [Google Scholar] [CrossRef]
  35. Jorge, A. Train kinematics for the design of railway vehicle components. Mech Mach. Theory. 2010, 45, 1035–1049. [Google Scholar]
  36. Zhai, W. Vehicle–Track Dynamics, 5th ed.; Science Press: Beijing, China, 2015. [Google Scholar]
  37. Li, H.; Wu, G. Fatigue Evaluation of Steel Bridge Details Integrating Multi-Scale Dynamic Analysis of Coupled Train-Track-Bridge System and Fracture Mechanics. Appl. Sci. 2020, 10, 3261. [Google Scholar] [CrossRef]
  38. Aggestam, E.; Nielsen, J.C.; Bolmsvik, R. Simulation of vertical dynamic vehicle-track interaction using a two-dimensional slab track model. Veh. Syst. Dyn. 2018, 56, 1633–1657. [Google Scholar] [CrossRef] [Green Version]
  39. Lesgidis, N.; Sextos, A.; Moschen, L.; Gomez, J.S.G.; Pistone, E. Rigorous vehicle-soil-track simulation of high-speed rail through optimization-based model order reduction. Transp. Geotech. 2020, 23, 100350. [Google Scholar] [CrossRef]
  40. Zeng, Z.; He, X.; Meng, X.; Zhu, K. Experimental study on the mechanical characteristics of CRTS Ⅲ slab ballastless track under train load. J. Railw. Sci. Eng. 2016, 13, 1229–1233. [Google Scholar]
  41. Poveda, E.; Yu, R.C.; Lancha, J.C.; Ruiz, G. A numerical study on the fatigue life design of concrete slabs for railway tracks. Eng. Struct. 2015, 100, 455–467. [Google Scholar] [CrossRef]
  42. Madhkhan, M.; Entezam, M.; Torki, M. Mechanical properties of precast reinforced concrete slab tracks on non-ballasted foundations. Sci. Iran. 2012, 19, 20–26. [Google Scholar] [CrossRef] [Green Version]
  43. Xin, T.; Zhang, Q.; Gao, L.; Zhao, L. Dynamic effects and structure optimization of damping layers of CRTS III slab ballastless track for high speed railway. China Railw. Sci. 2016, 37, 1–7. [Google Scholar]
  44. Kalker, J.J. On the rolling contact of two elastic bodies in the presence of dry friction. Ph.D. Dissertation, Delft University of Technology, Delft, The Netherlands, 1967. [Google Scholar]
  45. Ishida, M.; Ban, T.; Iida, K.; Ishida, H.; Aoki, F. Effect of moderating friction of wheel/rail interface on vehicle/track dynamic behaviour. Wear 2008, 265, 1497–1503. [Google Scholar] [CrossRef]
  46. Yankovskii, A. Modelling of the elastoplastic dynamics of longitudinally reinforced wall beams based on a time-explicit central difference method. J. Appl. Math. Mech. 2017, 81, 36–51. [Google Scholar] [CrossRef]
Figure 1. Subgrade frost heave caused by frozen fillers in Harbin-Dalian high-speed railway.
Applsci 10 08097 g001
Figure 2. The frost heave simulated by an upper convex cosine curve.
Applsci 10 08097 g002
Figure 3. Structural components of CRTS Ⅲ slab track.
Applsci 10 08097 g003
Figure 4. Random irregularity selected in the model. (a) Vertical and horizon irregularity of left rail; (b) Vertical and horizon irregularity of right rail.
Applsci 10 08097 g004
Figure 5. Theoretical topology models of different simulation methods of subgrade frost heave. (a) Theoretical model of Model-A; (b) Theoretical model of Model-B; (c) Theoretical model of Model-C.
Applsci 10 08097 g005aApplsci 10 08097 g005b
Figure 6. Analytical concept of Model-C.
Applsci 10 08097 g006
Figure 7. Deformation of the slab track before the vehicle running.
Applsci 10 08097 g007
Figure 8. Comparison between the static and quasi-static results. (a) Vertical deformation of rail; (b) Longitudinal stress of foundation plate.
Applsci 10 08097 g008
Figure 9. Comparison between the results of Model-C and [24].
Applsci 10 08097 g009
Figure 10. History of vertical wheel-rail force with different models.
Applsci 10 08097 g010
Figure 11. Contribution of rail deformation and the contact loss area in Model-B.
Applsci 10 08097 g011
Figure 12. Time history of vertical acceleration of the track slab with different models.
Applsci 10 08097 g012
Figure 13. Time history of interlayer contact pressure with Model-B and Model-C.
Applsci 10 08097 g013
Figure 14. Time history of vertical displacement of track slab with Model-B and Model-C.
Applsci 10 08097 g014
Figure 15. Time history of vertical acceleration of car body force with different models.
Applsci 10 08097 g015
Figure 16. Influencing mechanism of frost heave on vehicle-track coupling system.
Applsci 10 08097 g016
Figure 17. Typical dynamic response of different models under different wavelengths. (a) Maximum vertical wheel-rail force; (b) Maximum vertical acceleration of track slab; (c) Maximum vertical interlayer contact pressure.
Applsci 10 08097 g017aApplsci 10 08097 g017b
Table 1. Model parameters of high-speed vehicle of CRH3.
ParametersUnitsValues
Car body/bogie/wheelset masskg48,000/3200/2400
Car body rolling/nodding/yawing inertia105 kg × m21.15/2.70/2.70
Bogie rolling/nodding/yawing inertiakg × m23200/7200/6800
Wheelset rolling/ yawing inertiakg × m21200/1200
Longitudinal/lateral/vertical stiffness of primary suspension103 kN/m9.00/3.00/1.04
Longitudinal/lateral/vertical damping of primary suspensionkN × s/m0/0/45
Longitudinal/lateral/vertical stiffness of secondary suspension103 kN/m0.24/0.24/0.40
Longitudinal/lateral/vertical damping of secondary suspensionkN × s/m500/30/50
Axle distancem2.50
Bogie distancem17.375
Wheel rolling radiusm0.46
Table 2. Structure parameters of CRTS Ⅲ slab track.
PartsParametersUnitsValues
RailDensitykg/m37830
Elastic modulusGPa205
Poisson’s ratio/0.30
SlabSizem5.60 × 2.50 × 0.21
Densitykg/m32500
Elastic modulusGPa36.50
Poisson’s ratio/0.20
Self-compacting concrete layerDepthm0.10
Densitykg/m32500
Elastic modulusGPa32.50
Poisson’s ratio/0.20
Foundation plateWidth × Depthm3.10 × 0.10
Densitykg/m32500
Elastic modulusGPa32.5
Poisson’s ratio/0.20
Concave grooveSizem0.60 × 0.40 × 0.10
CushionStiffnesskN/mm250
Table 3. Comparison between measured data and simulation.
Dynamic ResponseMeasured ResultsModel-AModel-BModel-C
Vertical acceleration of car body(m·s−2)−0.6–0.8−0.36–0.40−0.35–0.42−0.40–0.44
Lateral wheel-rail force (kN)−22–31−24.5–32.5−25.5–32.1−27.50–31.7
Peak derailment coefficient0.260.420.420.31
Peak rate of wheel load reduction0.620.630.550.70
Publisher’s Note: MDPI stays neutral with regard to jurisdictional claims in published maps and institutional affiliations.

