1. Introduction
Materials that change color are called chromogenic materials. Thermochromic materials respond to changes of temperature by changing their color [
1,
2]. Thermochromic (TC) systems based on leuco dyes are widely used as a carriers of thermally induced color changes in different applications [
3,
4,
5,
6,
7]. These TC materials can be encapsulated in a polymer envelope or in the form of a pigment deposited in other polymer materials [
1]. For example, encapsulated TC composites lose their color while heated and regain it again by cooling. Reversible change of color in encapsulated leuco dye system appears through two competitive reactions, between the colorant and developer (which predominates on lower temperatures, resulting in production of colored complex) and between the solvent and developer. At lower temperatures, organic solvent is in a solid state, while, with the increase of temperature, it becomes liquid. The complex colorant–developer is decomposed by the action of solvent in liquid form. When the thermochromic complex cools down again, the color returns to its original state due to the transition of the solvent into a solid state and formation of colorant–developer complex [
8].
Crystal violet lactone (CVL) is the most common example of the spirolactone type of thermochromic dyes. In its ground state, it is colorless, while, in the presence of a weak acid or electron acceptor (color developers), the lactone ring opens and forms a triphenylmethane (TPM) type system (high color density) [
9]. Weak acids (phenolic compounds, for example, bisphenol A), which are commonly used as color developers, assist opening the lactone ring of the leuco dye and stabilize the open form. Color development occurs when the developer and dye are fused or mixed in a solvent [
9]. Since the thermochromic mixture is about 75–95 mol% solvent, the solvent’s melting point largely controls that of the mixture. Commonly used solvents are long-chain alkyl alcohols, esters or ethers, and carboxylic acids [
9]. In thermochromic (TC) printing inks, thermochromic pigments that encapsulate a leuco dye–developer–solvent system in a polymer shell are dispersed in a vehicle and are about ten times larger than the particle size of conventional pigment particles, which usually have medium particle size of a few micrometers [
10]. TC inks can be applied on different kinds of substrate materials (paper, cardboard, plastic materials) through various printing techniques (screen printing, sheet-fed and web offset printing, gravure, pad printing, flexography, and rod coating). The most widely used systems for microencapsulation of thermochromic pigments in printing inks involve urea or melamine and formaldehyde [
11], gelatin–gum arabic, and epoxy resins [
12].
In the past few years, the research and the development of different novel technologies incorporating thermochromic materials have attracted much attention. Recently, some of the thermochromic technologies for application as thermal sensors and indicators in architecture [
13,
14] and smart packaging [
15] and as smart textiles [
16,
17,
18] were studied. Despite that, most of the studies were conducted to determine the interactions inside the TC microcapsules between the solvent-developer and color former on the colorimetric properties of the thermochromic composite [
4,
19,
20,
21], but there is a lack of studies regarding printing substrates and thermochromic printing ink interactions. In the field of graphic technology, most of the studies recently were devoted to thermochromic printing inks end-of-life solutions [
22,
23,
24] and their health safety [
25,
26,
27], UV stability [
28], and novel approaches in measurements of thermochromic dynamic color change [
29]. The increasing packaging added value through combination of printed electronics with the thermochromism phenomenon for development of thermochromic displays on cardboard packaging [
30] and development of thermochromic microencapsulated inks for smart packaging [
31] was reported, as well.
Offset printing is the most common commercial printing technology used for the production of quality print products. Conventional offset inks are commonly composed of colorants (dyes, organic, as well as certain inorganic, pigments), vehicles (hard resins, alkyd resins, vegetable and mineral oils, solvents), auxiliaries (waxes, drying agents (siccative), fillers, inhibitors), and thinners. The way the fresh printed ink penetrates into the layer of paper fibers is dependent on the separation effect. The surface characteristics of the paper separate some components of the ink from the other components. For non-absorbent substrates, neither the ink vehicle nor the rest of the ink components can penetrate into the substrate. For a penetrative substrate, the thinners, the ink vehicle, and partly the auxiliaries can penetrate into the substrate (which is a time-dependent process) [
32].
Some of the key factors affecting printability are the paper’s appearance (brightness, whiteness, gloss, color), the paper surface topography (surface smoothness or roughness), surface energy, absorbency capability, and porosity, which are often crucial for end-use properties and obtaining quality product [
33,
34,
35,
36,
37,
38,
39]. The mentioned parameters (surface roughness, smoothness, and porosity) are crucial for the evaluation of the paper–ink interactions and additionally may affect the print performance [
40].
Thus, in this study, different printing substrates were used for the comparison of thermochromic ink interactions with hydrophobic and hydrophilic surfaces. As fibrous papers contain cellulose and additives, filter, bulky, and recycled paper were used. For the evaluation of ink interactions with non-fibrous polymer surfaces, commercially available synthetic paper made of polypropylene was used. The differences in paper’s properties on dimensional and positional changes of the thermochromic prints microcapsules during thermally induced process and their influence on prints colorimetric properties were investigated in this study, using an atomic force microscopy (AFM).
AFM allows imaging of the insulating surfaces, as well as describing the surface relief at the nanometer scale, and, in some cases, down to the atomic level, without destroying the material surface. AFM is a very fast technique used in different areas. In graphic technology, it is used for the evaluation of paper and prints surface topography and texture on print quality, as well as the influence on ink pigment penetration and distribution [
36,
38]. Its resolution is comparable to, or even exceeds, the resolution of scanning or transmission electron microscopy [
41,
42]. Since the technique is non-destructive, and the samples require no special surface treatment, paper samples can be examined, annealed, and re-examined many times. In this study, AFM was used at a sub-micrometer scale to investigate the behavior of the prints thermochromic microcapsules before and after heating from 25 °C to 40 °C at the nanoscale.
Scanning electron microscopy (SEM) and the FTIR spectroscopy were used to examine the physico-chemical properties of papers and prints.
In addition, roughness, smoothness, ash, and CaCO3 content of papers, as well as surface free energies of papers, prints, and papers-prints interphases, were determined.
2. Materials and Methods
2.1. Printing Substrates and Printing Ink
In this study, four types of paper with different structural and absorption capacities were used: bulky paper (Munken Print White) containing wood free pulp and more than 10% mechanical wood pulp (B), recycled paper (Evercopy + Clairefontaine) containing 100% of recycled fibers (R), synthetic paper (Yupo) extruded from polypropylene pellets (S), and filter paper (Whatman quantitative filter paper grade 589/3 blue ribbon) (F), used to simulate 100% pure cellulose paper without any additives or fillers.
Commercially available thermochromic offset ink (produced by CHAMELEON®) used in this study, changes from blue to colorless when heated above 27 °C. The printing trials were carried out using Prüfbau Multipurpose Printability Tester. The quantity of 1.5 cm3 ink was applied on the distribution rollers, while printing was carried out with the printing force of 600 N. All the samples were printed in the full tone. Drying of used offset ink occurs by penetration of the ink vehicle into the paper structure.
2.2. Determination of Roughness, Smoothness and Optical Density of Paper Surfaces
The roughness of papers was determined using Bendtsen method and a surface roughness tester TR200 (Qualitest, Lauderdale, FL, USA). The smoothness of the Bekk was determined on the PTI-Line 1 Bekk device, manufactured by the PTI Austria GmbH (Laakirchen, Austria). Xrite Spectro-Eye spectrophotometer (Grand Rapids, MI, USA) was used for the measurement of papers optical density. The results are expressed as the mean ± SD values of ten measurements.
2.3. Determination of Ash and CaCO3 Content of Papers
For determination of CaCO
3 content five test specimens of each paper were ignited in a muffle furnace at 525 and 900 ± 25 °C according to TAPPI methods (T211 om–02 and T413 om–11). The amount of residues on ignition at 525 °C and 900 °C on an oven-dry basis are related to calcium carbonate content. The percentages of calcium carbonate were calculated by Equation (1). The results of ash contents are expressed as mean ± SD value of five measurements.
2.4. Determination of Papers Grammage
The paper grammage was determined by measuring the masses of the known surfaces of paper samples and is expressed as the mean ± SD value of ten measurements.
2.5. Determination of Surface Free Energies and Surface Free Energies of the Interphases
Evaluation of surface free energy of papers and papers printed with thermochromic ink was carried out by contact angle measurements on DataPhysics OCA 30 Goniometer, using Sessile Drop method. By measuring contact angles of standard test liquids (demineralized water, diiodomethane and glycerol), in which surface tension values are known (
Table 1), it is possible to determine the total solid surface free energy and its dispersive and polar component. Measurements were performed with a droplet volume of 1 µL at room temperature 23.0 ± 0.2 °C. The contact angle was captured by CCD camera and measured 2 s after the droplet was formed. Average values of ten drops of the same sample on different areas were used for calculation of the surface free energy.
The Owens, Wendt, Rabel, and Kaelble (OWRK) calculation method was applied to the contact angle data of test liquids in order to evaluate the parameters of surface free energy (γ), e.g., its dispersive (γ
d) and polar (γ
p) components. The conducted calculation method was integrated and carried out within the software (SCA20, Version 2.01). The surface free energy of the interphase (γ
12) was calculated from the obtained surface free energies [
43]. Owens–Wendt model includes the geometric mean expression of surface free energy of the individual phase that is mutual in contact according to Equation (2) [
43]:
where the subscript refers to surface free energy of each phase, and the γ
12 denotes surface free energy of the interphase.
2.6. Determination of Papers and Prints Colorimetric Properties
The colorimetric properties of papers and thermochromic prints were described in the CIELAB color space. Temperature-dependent colorimetric properties were measured using OceanOptics USB2000+ spectrometer and OceanOptics SpectraSuite software (Orlando, FL, USA) for the calculation of the CIELAB values L*, a*, b* from measured reflectance in the spectral range between 400 and 700 nm. All measurements were in accordance with ISO 12647-1 D50 illuminant, 2° observers, employing a 50 mm integrating sphere under di: 8° measuring geometry (diffuse geometry, specular component included) and black backing. Each print sample was heated using the Full Cover water block (EK Water Blocks, EKWB; Komenda, Slovenia). The temperature of the copper plate surface was controlled by circulation of thermostatically controlled water in channels inside the water block with an accuracy of 1 °C within the applied temperature region. The sample in each cycle was heated from 15 °C to up 60 °C and then cooled back to initial temperature. The reflectance spectra between 19 and 35 °C were measured in 1 °C intervals, while between 15 and 19 °C and 35 and 60 °C were measured in 2 and 5 °C intervals, respectively. Heating/cooling rate was 0.5 °C min−1.
2.7. Fourier Transform Infrared Spectroscopy (FTIR Spectroscopy)
The FTIR spectrum of thermochromic printing ink was obtained at 25 °C and recorded in the spectral range between 4000 and 600 cm−1 at 4 cm−1 resolutions and averaged over 32 scans. The attenuated total reflection (ATR) spectra of the unprinted and printed paper samples (prints) were measured using the Speak Silver Gate Evolution ATR (Shimadzu, Kyoto, Japan) sampling accessory with a ZnSe crystal plate. The final spectra were obtained from the averaged 15 scans taken in the single reflection mode, over the spectral range 4000–600 cm−1 at 4 cm−1 resolution.
2.8. Scanning Electron Microscopy (SEM) and Atomic Force Microscopy (AFM)
The papers and prints surfaces were monitored using a FE-SEM Jeol 7000 (Tokyo, Japan) field emission scanning electron microscope.
The atomic force microscopy (AFM) analysis was performed using a Multimode AFM with Nanoscope IIIa controller (Bruker Corporation, Billerica, MA, USA) with a vertical engagement (JV) 125 µm scanner. Tapping mode imaging was performed under ambient conditions in air, by using silicon tips (RTESP, Bruker, nom. freq. 320 kHz, nom. spring constant of 42 N/m) and at a scan resolution of 512 samples per line. The soft tapping mode imaging was performed at the set point ratio of around 0.9 to avoid any destroying of the sample. The linear scanning rate was optimized between 1.0 and 2.0 Hz at a scan angle of 0°. Samples of paper material (1 cm2) were fixed onto the sample holder (stainless steel, diameter 1.5 mm) immediately before imaging. Imaging was performed with a temperature controller stage (Digital instruments, high temperature heater controller, range up to 60 °C, resolution 0.1 °C and accuracy 3%). Temperature setup, consisting of a resistor placed between the scanner and the sample, transmits heat towards the sample from underneath. The whole sample glued to the metal disc remained attached to the microscope scanner using a magnet. The small distance of < 2 mm between the heating element and the sample itself ensured the temperature gradient between the displayed and the real temperature is insignificant. Therefore, the calibration of individual sample holders was not needed. The imaging of thermochromic prints was obtained at 25 °C and 40 °C. Processing and offline-analysis of images were carried out using the NanoScopeTM software (Digital Instruments, Version V531r1). Images were processed and analyzed employing of the AFM NanoScope software (version 5.12r5, Digital Instruments, USA). All images are presented as raw data except for the first-order two-dimensional flattening. The investigated sample surface areas 15 μm × 15 μm ensured that the scan areas of 5 μm × 5 μm were representative of the material features of interest.
3. Results
3.1. Structural and Optical Characterization of the Papers
The primary structural component of paper is cellulose, but non-structural polysaccharides (hemicelluloses) and lignin may be present, as well. In addition to the cellulosic fibers, many mineral inert pigments (often known as fillers) are incorporated into the paper structure to improve certain optical (opacity or brightness) and surface (flatness and smoothness) properties or simply as a cheap replacement for costly fibers [
44]. The addition of pigment particles fill the voids between fibers in the paper and affects the paper properties. The proportion of fillers that may be added is limited to a maximum of 30% because the replacement of fiber reduces the hydrogen bonding network and the strength of the paper [
45].
The porosity of the paper is a function of the various stages of the papermaking process. An increased level of fiber refining causes the fibers to bond together more strongly and tightly, making the paper denser and reducing the porosity. Surface sizing and coating also act to seal and/or compress surface fibers, reducing the paper’s porosity. As can be seen in
Table 2, filter paper (F) has the largest porosity, surface roughness and the smallest smoothness. Bulky paper (B) has higher porosity and surface roughness and smaller smoothness relative to the recycled paper (R). Ashori et al. [
33] concluded that sized papers were smoother than the surfaces of the non-sized papers. The smallest roughness shows the surface of the S paper. From the surface porosity results, it can be concluded that S paper is not absorbent. The highest CaCO
3 content is in S (44.5%) and B paper (33.9%). The high CaCO
3 content in B paper is due to presence of lignin in its structure, i.e., the bulky paper is made of mechanical pulp that has lower whiteness than papers made from chemical pulp. CaCO
3 when used as a filler in papermaking processes improves paper whiteness. Despite a greater proportion of CaCO
3 in B paper concerning the R paper (19.1%), B paper is rougher and more porous. Therefore, some other additives present in R paper cause smaller roughness and porosity of R paper, most likely sizing agents. The addition of sizing agents (synthetic and natural chemical additives) reduces the absorbency of paper [
46]. They are usually added at level of around 0–5% by weight [
47]. Modern papermaking uses neutral synthetic sizes (alkenyl succinic anhydride (ASA) and alkyl ketone dimer (AKD)), which are reactive size molecules that polymerize in the presence of an activator [
45]. Surface sizing is applied to control some relevant paper surface properties, such as porosity, roughness, and surface energetics, to promote an adequate interaction with inks and to improve the final printing quality [
37,
46].
The paper’s optical properties (optical density, color, whiteness, brightness) have a large impact on the print quality due to the paper visible between the printed area, defining the background reflectance for the print layer [
48].
Whiteness measures the amount of reflectance of all wavelengths of visible light across the visible spectrum. Paper whiteness quantifies a paper’s ability to equally reflect a balance of all wavelengths of light across the visible spectrum. If some wavelengths are absorbed, while others are reflected, the object exhibits the color of the reflected light [
45].
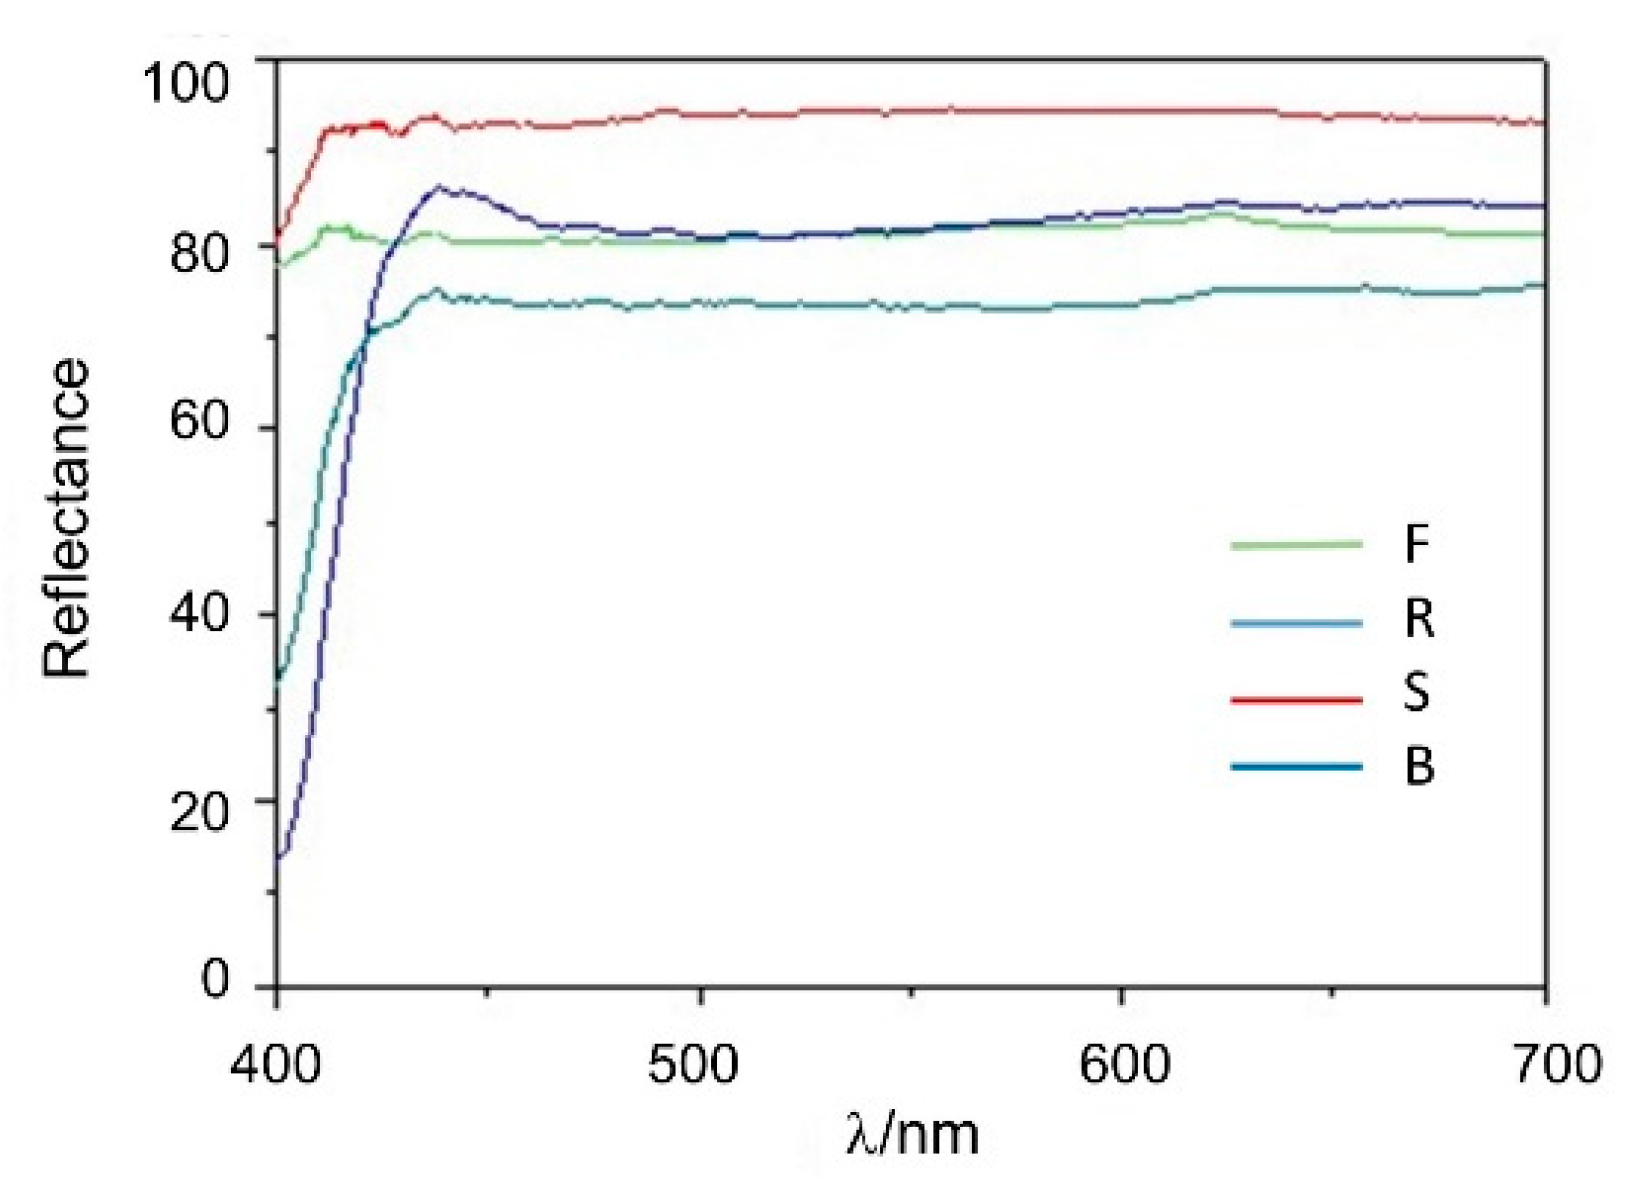
Figure 1 shows the reflectance curves of used papers. The most uniformly white paper is filter paper (F), which indicates an equal reflectance of all wavelengths. The whitest paper is the S paper which, although less uniformly reflecting, shows the greatest total reflectance. The smallest whiteness has R paper. B and R papers have a small reflection in the blue region of the visible part of the spectrum (420–470 nm) due to the presence of optical brighteners in the paper structure which absorb light in the UV and violet region of the spectrum (340–370 nm), and reemit light in the blue region. Impurities that lower the whiteness (for example lignin) absorb the light in the blue part of the spectrum.
Table 2 shows the results of optical density determination and CIELAB values of papers. Optical density is the ability of a material to absorb the light. The darker the color appears to the eye, the higher is the density. Of all tested papers, R paper has the highest optical density (0.13), while S paper has the smallest (0.06). Optical density of F and B papers are equal (0.08).
S paper has the highest lightness value (97.7), while R paper has the smallest (88.7). All papers except S paper, have positive a* values (shift to the red area). B paper has the highest a* value (1.3), while S paper has the highest b* value (0.9).
3.2. SEM Analysis of Papers
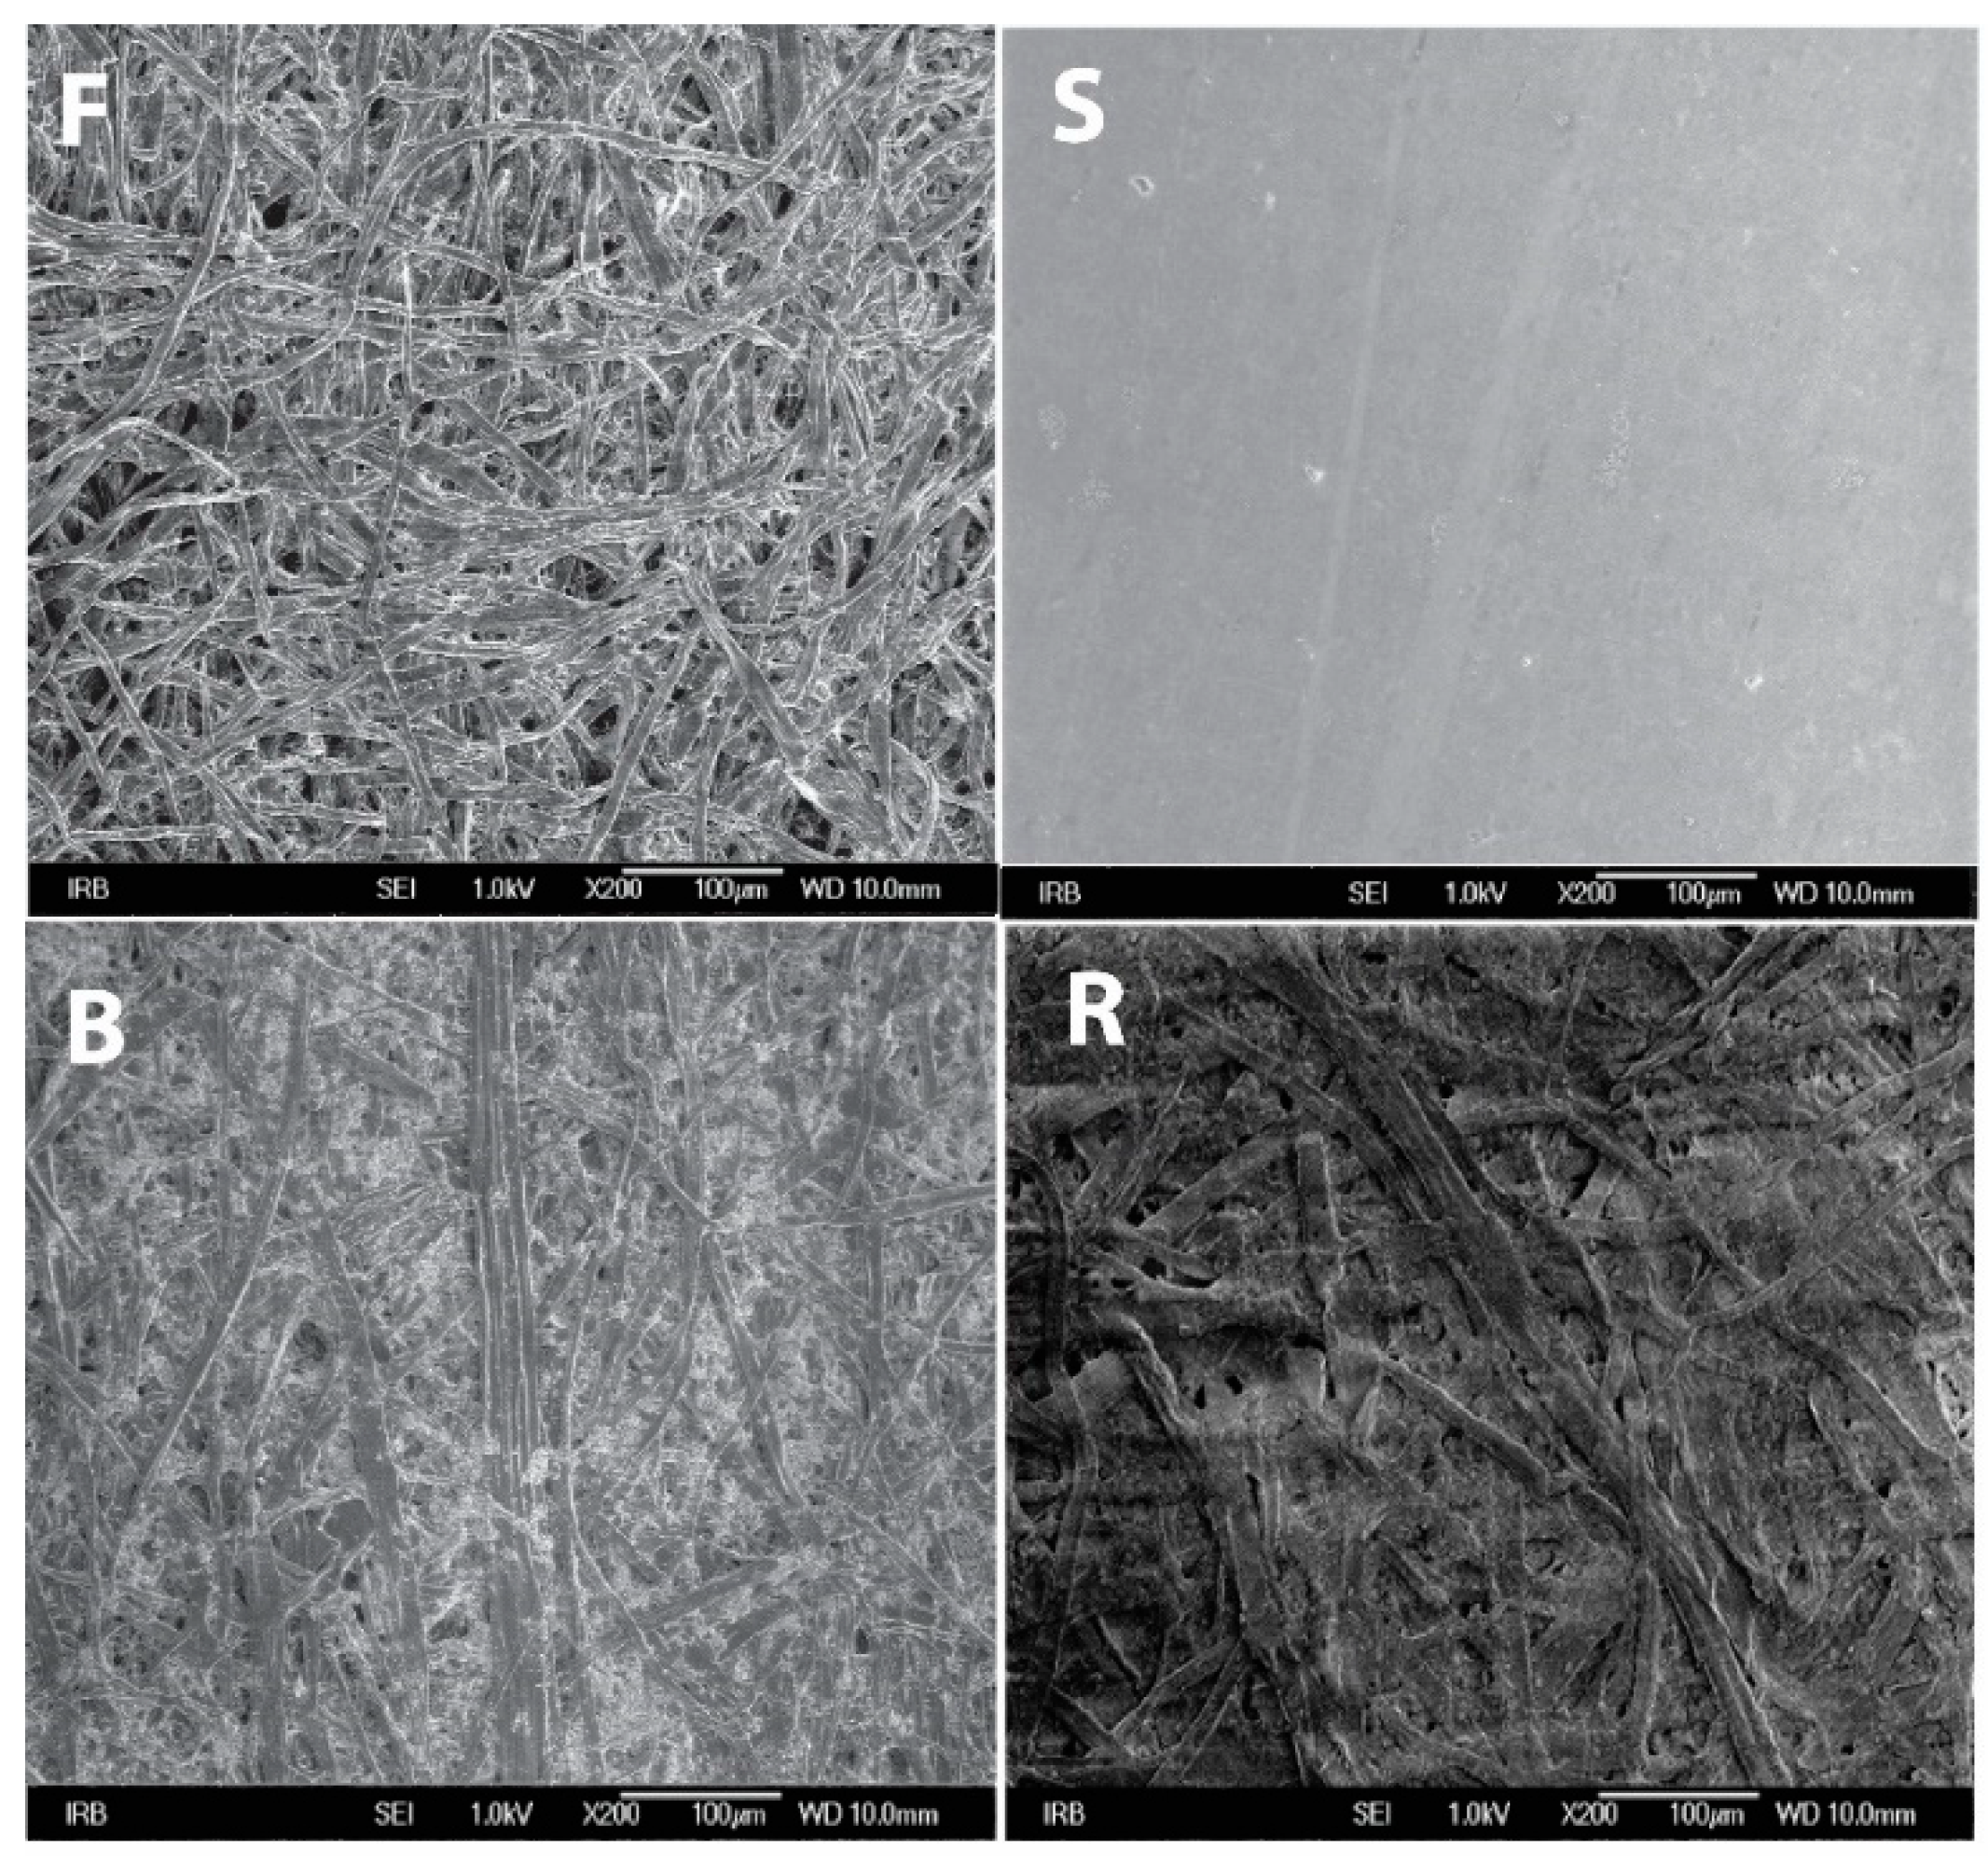
Figure 2 shows the SEM micrographs of examined papers. SEM micrograph confirms that F paper is more porous than other papers. Moreover, the pore diameters of F paper are larger than the pores of other papers. The pores in B paper are filled with filler (CaCO
3), resulting in a significantly smaller number and smaller diameters of pores which are visible in F paper. The same trend was observed in the roughness of papers. Recycled paper (R) has the smaller number and pores diameter. Addition of sizing agents reduces both, the absorption and the porosity of paper, cementing the fibers to the body of the paper [
33]. Synthetic paper is made of synthetic polymer that does not have fibrous structure; therefore its surface is smooth.
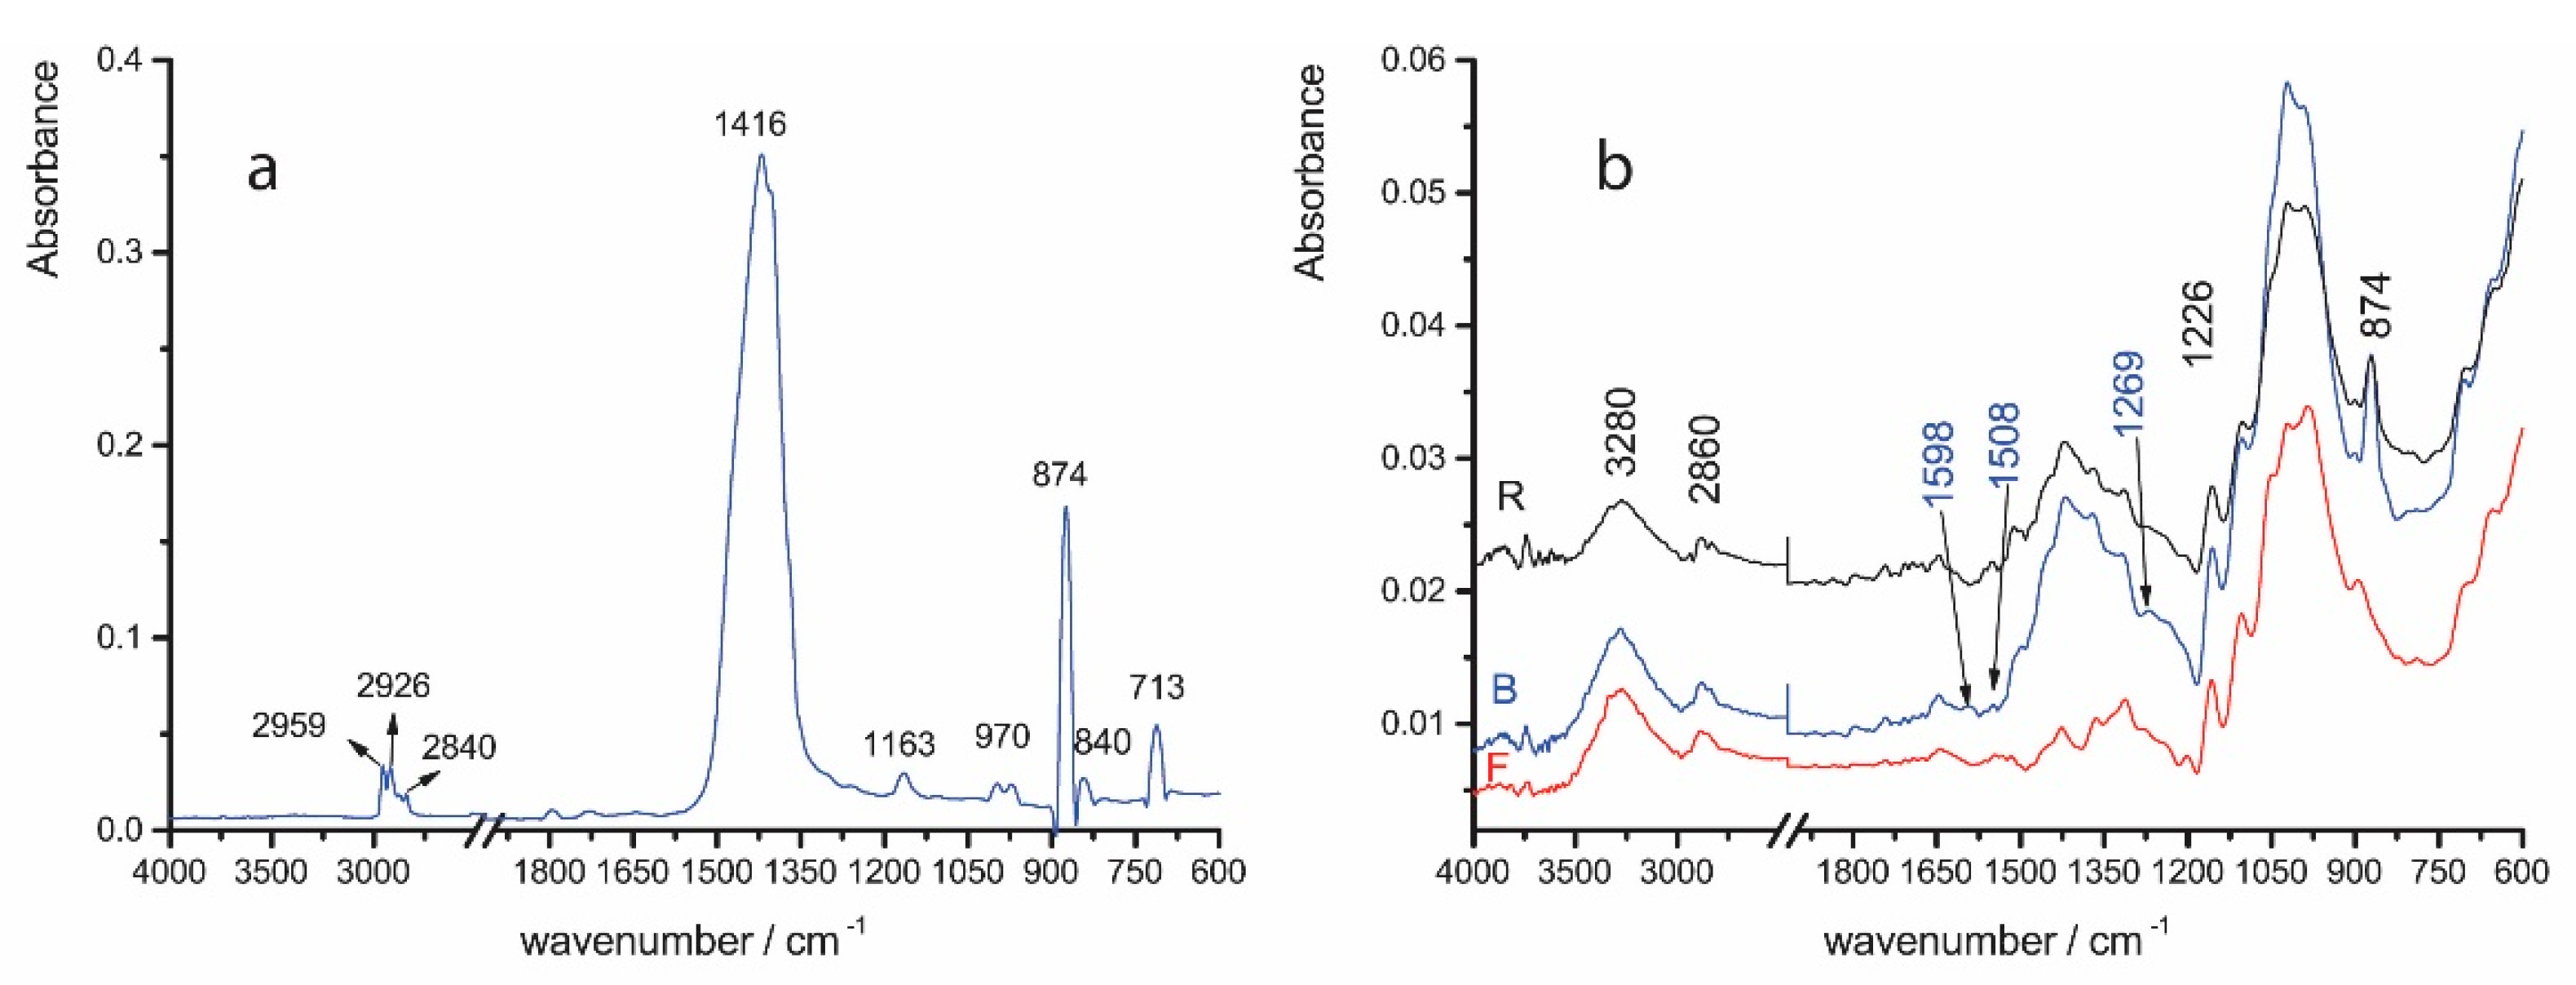
3.3. FTIR Analysis of Papers
The assignment of vibration bands in the IR spectra of paper samples indicates the composition of the paper or the components present in the samples in larger quantities. Thus, in the IR spectrum of synthetic paper (
Figure 3a) calcium carbonate vibrational bands (874 and 713 cm
−1) [
47,
49] and polypropylene vibration bands (from 2960 to 2840 cm
−1 (νCH
2), and 1416 cm
−1 (δCH
3), 1373 cm
−1 (δCH
3, ωCH
2, δCH), 1163 cm
−1 (δCH, pCH
3), 970 cm
−1 (pCH
3, nCC
b), and 840 cm
−1 (pCH
2, nCC
b, nC-CH
3, pCH
3) cm
−1 dominate [
50,
51]. The IR spectrum of synthetic paper refers to polypropylene as the predominant polymer used for its manufacture.
Figure 3b shows the FTIR spectra of R, F, and B papers. The IR spectrum of filter paper corresponds to the spectrum of cellulose. The band in the IR spectrum of F paper at 3280 cm
−1 corresponds to OH stretching vibrations. This band is present in the R and B papers, as well. The vibrational band at 2860 cm
−1 originates from the antisymmetric and symmetric stretching of C-H bonds of methylene groups and it is also present in R and B papers. Vibrational bands between 1500 and 1300 cm
−1 originate from deformation vibrations of the cellulose group, while bands between 1160 and 950 cm
−1 correspond to the stretching of the C-C and C-O ring bonds. Compared to F paper, the most noticeable changes in R and B papers can be observed in the vibrational bands between 1500 and 1300 cm
−1 (deformational vibration of a group of cellulose). They point to changes in cellulose structure by rearrangement in hydrogen bonding (changing crystalline to amorphous form), which changes the vibrational pattern of C-C-H, C-O-H, O-C-H, and H-C-H bending vibrations. This can be attributed to the increase in the proportion of additives (sizing agents or mineral fillers) in the paper, responsible for the reduction of the hydrogen bonds number in cellulose structure, as well as the processing of cellulose pulp, when papers were prepared [
52,
53]. The vibrational bands appearing at 874 cm
−1 in B and R papers were assigned to filler (CaCO
3) [
47,
49]. In addition to the cellulose and CaCO
3 bands occurring in the IR spectrum of B paper, lignin vibrational bands are also noticed, for example, at 1598 and 1508 cm
−1 (C=C of aromatic), at 1226 cm
−1, and 1269 cm
−1 (C-O-C of aryl-ether) [
54]. The vibration band of other lignin functional groups are covered with intense vibration bands of the corresponding cellulose groups. According to Brinen [
55], incorporated organic reagents present in papers are difficult to detect using conventional spectroscopic techniques due to their low concentrations.
3.4. Specific Surface Free Energy of Papers
The contact angles measurements (
Table 3) show that water spreads over the surface of the hydrophilic F paper (Φ = 20.9°). The surfaces of other papers are waterproof (Φ > 90°), so these surfaces are hydrophobic. Wetting of F paper with glycerol (Φ = 59.0°) is also better than the wetting of other paper surfaces (Φ > 90°). Glycerol, as well as water molecules, with the exception of F paper, have the best ability to cover the surface of synthetic paper. Improved surface wetting with water and glycerol may result from a heterogeneous surface of synthetic paper and better adhesion of polar molecules of water and glycerol to areas with higher CaCO
3 content. Diiodomethane spreads the best over the surface of F paper (Φ = 27.0°) due to its large surface free energy and low tension of the diiodomethane surface. Diiodomethane spreads well over the surfaces of other papers, but not as good as over the surface of F paper. This can be explained by their smaller surface free energies. When comparing the R, B and S papers, diiodomethane spreads the best over the surface of R paper due to its higher surface free energy compared to surface free energy of S and B papers (
Table 4).
Table 4 shows the values of the surface free energies and the surface free energy components of unprinted paper samples. According to the OWRK method, the largest surface free energy (γ) was calculated for the surface of F paper (60.8 mJ m
−2). Surfaces of other papers have significantly lower values of surface free energies. The smallest surface free energy has the surface of S paper (23.0 mJ m
−2). The highest surface free energy with the exception of F paper has the surface of R paper (29.4 mJ m
−2). In work by Moutinho et al. [
46], it was demonstrated that the nature and the amount of sizing agents influence the paper surface free energy. The combination of the cationic starch with synthetic surface sizing influences the paper surface energy, i.e., it causes the reduction of the polar component of the surface free energy; therefore, the surface becomes less hydrophilic. The application of more hydrophobic surface-sizing agents decreases more significantly the polar component of surface free energy. In the study by Kannangara and Shen [
56], it was shown that the static contact angles of the sized cellulose films increased monotonically with the sizing dosage. For the highest sizing dozing level, the film shows a water contact angle of 101.7°.
B paper that contains lignin has the smaller surface free energy (26.4 mJ m
−2). According to Fardim and Durán [
54], the adhesion of two components with high surface energy, such as cellulose (55 mJ m
−2) and lignin (47 mJ m
−2) in the fiber wall, tends to lower the free energy of the system considerably (up to 23 mJ m
−2). During alkali pulping, lignin is extensively removed and exposure of carbohydrates generates the sites with relative high surface energy (up to 33 mJ m
−2). At the same time, molecules with low surface energy, e.g., wood extractives, tend to segregate to the surface and minimize the total surface free energy.
The cellulose molecules on the surface of F paper are connected by dispersive (γd = 32.7 mJ m−2) and polar forces (hydrogen bonds) (γp = 28.1 mJ m−2). Interactions occurring on the surfaces of other papers are mainly dispersive and weaker than the dispersive interactions of cellulose fibers on the surface of F paper. In R and B papers, this is the result of shorter cellulose fibers and addition of additives. The weakest dispersive interactions are between the polypropylene molecules on the surface of S paper (γd = 23.0 mJ m−2), and the strongest on the surface of R paper (γd = 27.5 mJ m−2). The highest polarity index, with the exception of filter paper, has recycled paper.
3.5. Colorimetric Properties for TC Prints
Color hysteresis (
Figure 4) describes temperature dependence of prints for
b* component of color. The CIELAB values of thermochromic print samples were calculated applying measured reflectance spectra during heating from 15 °C up to 60 °C and cooling down to 15 °C. At a temperature lower than the activation temperature (27 °C) the microcapsules are blue, while, above that, temperature they become colorless.
b* values of papers have no impact on the
b* values of the prints (
Table 2). Characteristic temperatures (T
1, T
2, T
3, T
4) determined according to Kulčar et al. [
8] are presented in
Table 5.
The process of decolorization is presented by T
1 and T
2, i.e., by the initial and final achromatic temperature, while the reversible reaction is presented by T
3 and T
4, i.e., by the initial and final chromatic temperature (
Table 5,
Figure 4). Colored complex predominates at temperatures below T
4, while decolorized complex predominates at temperatures above T
2. Between these temperatures, the system passes through changes. Between T
1 and T
2 deculturation occurs, while, between T
3 and T
4, the system returns to its colored state [
8].
As it is evident from the
Table 5, the activation temperature given by the producer is between the temperatures T
1 and T
2, more likely closer to T
2. It is obvious that all four characteristic temperatures for the TC print are similar, regardless of the type of papers used. However, the T
2 temperature is slightly higher on the print obtained on F paper. This could be due to high porosity and roughness of the F paper where, apparently, the microcapsules penetrate deeper into the paper structure; thus, a slightly higher temperature is required to start the decolorization process.
The dynamic color of TC prints was analyzed through the color hysteresis and following parameters: opening, Area
Lab and TCC (
Table 6). Opening of hysteresis loop measured at 15 °C represents the color difference of a sample before heating and after undergoing the entire heating–cooling cycle. Surface area between the heating and cooling color trajectories described in the CIELab space is defined as Area
Lab, while total color contrast (TCC) is defined as the color difference between the completely colored and decolorized states of the sample.
Higher paper porosity and roughness (
Table 2) will result in higher Area
Lab and higher TCC of TC prints (
Table 6). Therefore, TC print has the largest area on F paper, followed by TC print on B and then on R paper. Synthetic paper made of polypropylene does not have a fibrous structure like F, B and R papers, so it should be studied separately. Although it is not porous, due to its specific surface energy resulting from the chemical structure, it creates a certain affinity for the ink and holds it to itself so that the entire paper is covered with an ink binder that contains TC microcapsules (see SEM and FTIR,
Figure 5 and Figure 7). With F, B, and R papers, the ink components are absorbed through the paper structure.
The opening of the hysteresis loop is the largest on TC print on S paper and the smallest on TC print on F paper. This effect is dependent upon the dimensional properties (diameter and height) of the TC microcapsules (see AFM, Table 9).
The larger opening of the hysteresis loop indicates that the TC print on S paper needs to be cooled down more to return the print coloration to its original state than the TC print on F paper due to the smallest loop opening. The larger opening of the hysteresis loop indicates that the TC print on S paper must be cooled to a much lower temperature than the initial one or left for a longer time at a lower temperature to achieve the initial coloring of the TC print of S paper.
3.6. SEM Analysis of Prints
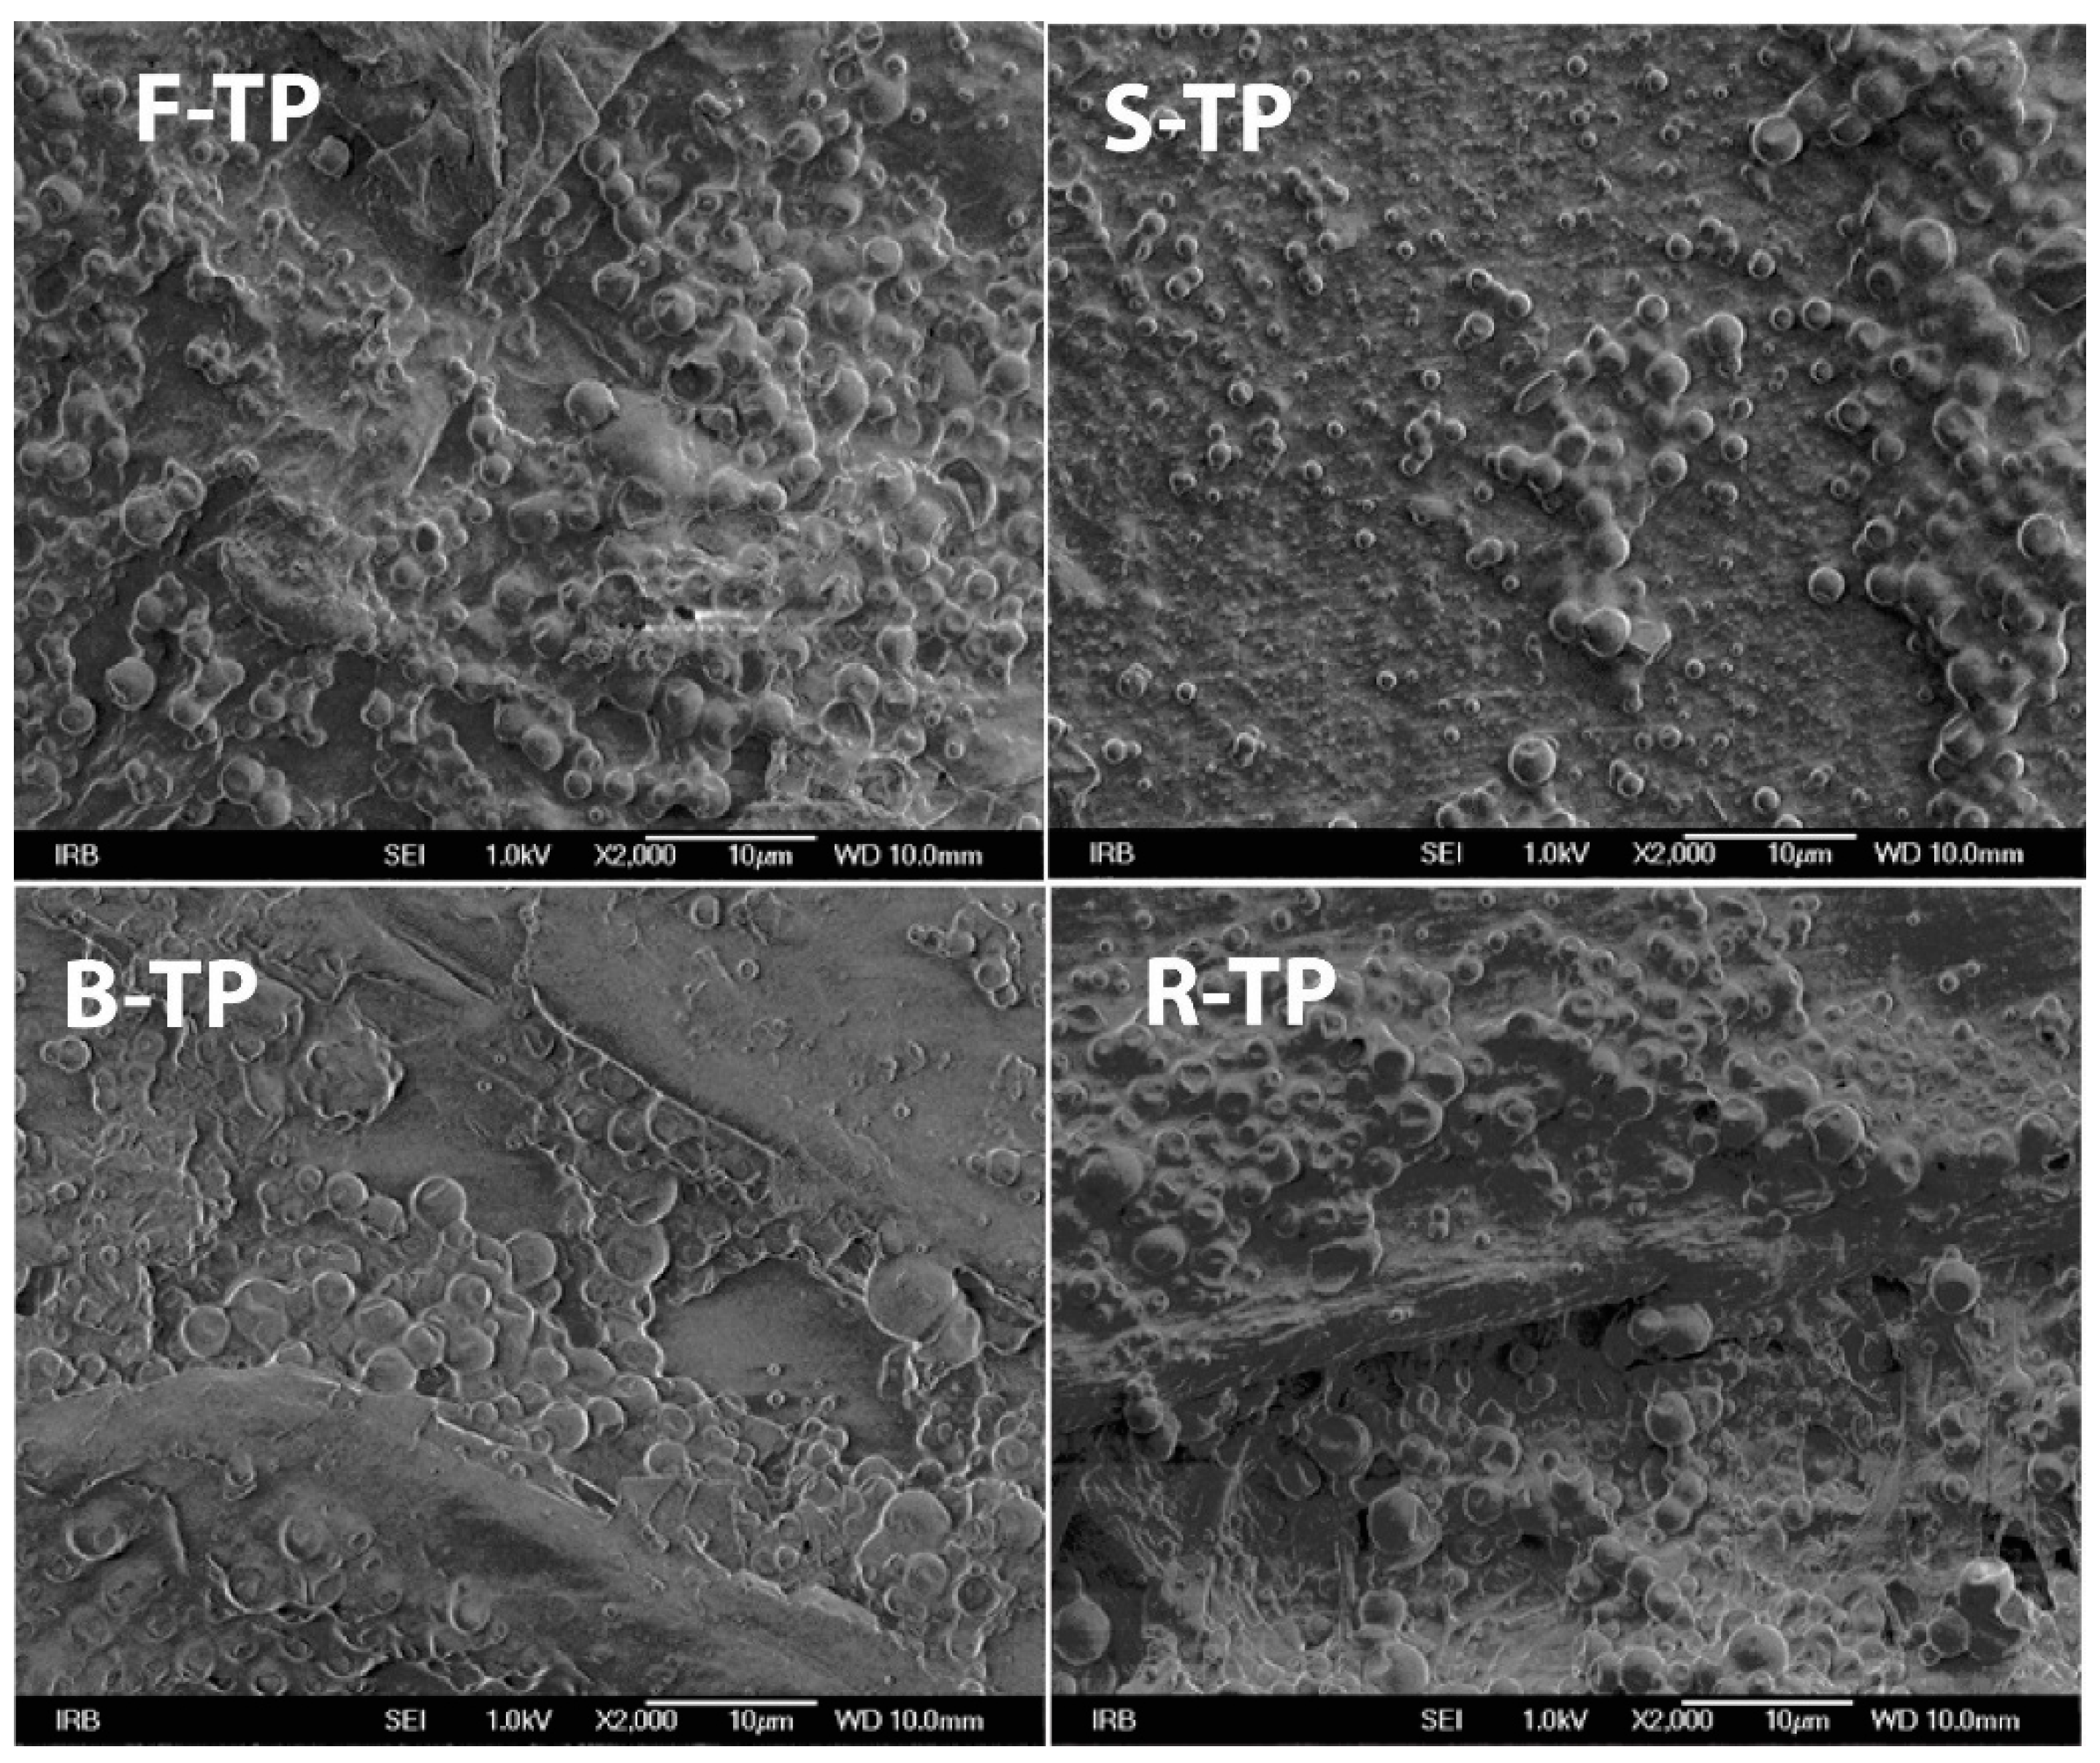
SEM micrographs (
Figure 5) show that unique microcapsules of the smallest size are visible on TC print on S paper (S-TP). Large microcapsule agglomerates have occurred on the surface of TC print on F (F-TP), R (R-TP), and B (B-TP) papers. There is an uneven distribution of microcapsules on the surface of S-TP print. In the case of F-TP, R-TP, and R-TP prints, penetration of ink components into the paper structure is visible since some cellulose fibers can be noticed (
Figure 5). The sizes of the microcapsules are not uniform.
3.7. Structural Characterization of Thermochromic Printing Ink by FTIR Analysis
The main components in offset ink are the colorant, the binder or vehicle, solvent (ink oils) and additives (catalytic dryers, antioxidants, wax particles, and others). In classic offset inks, the colorant is usually a hydrophobic organic pigment, while the binder consists of alkyd and hard resins. In the used thermochromic ink, the pigment is microcapsule containing leuco–dye-developer system. Ink oils can be classified into mineral (mixture of hydrocarbons from petroleum distillates) and vegetable oils (esters). Drying of used offset ink occurs by penetration of the ink vehicle into the paper structure. Ink oil usually penetrates deeper than pigments and resins. The amount of pigments, resins, and oil that remain on the printed surface or penetrates into the paper, depends mainly on the amount of ink transferred, the rheological properties of the ink, and the structural properties of paper, such as roughness and porosity [
32].
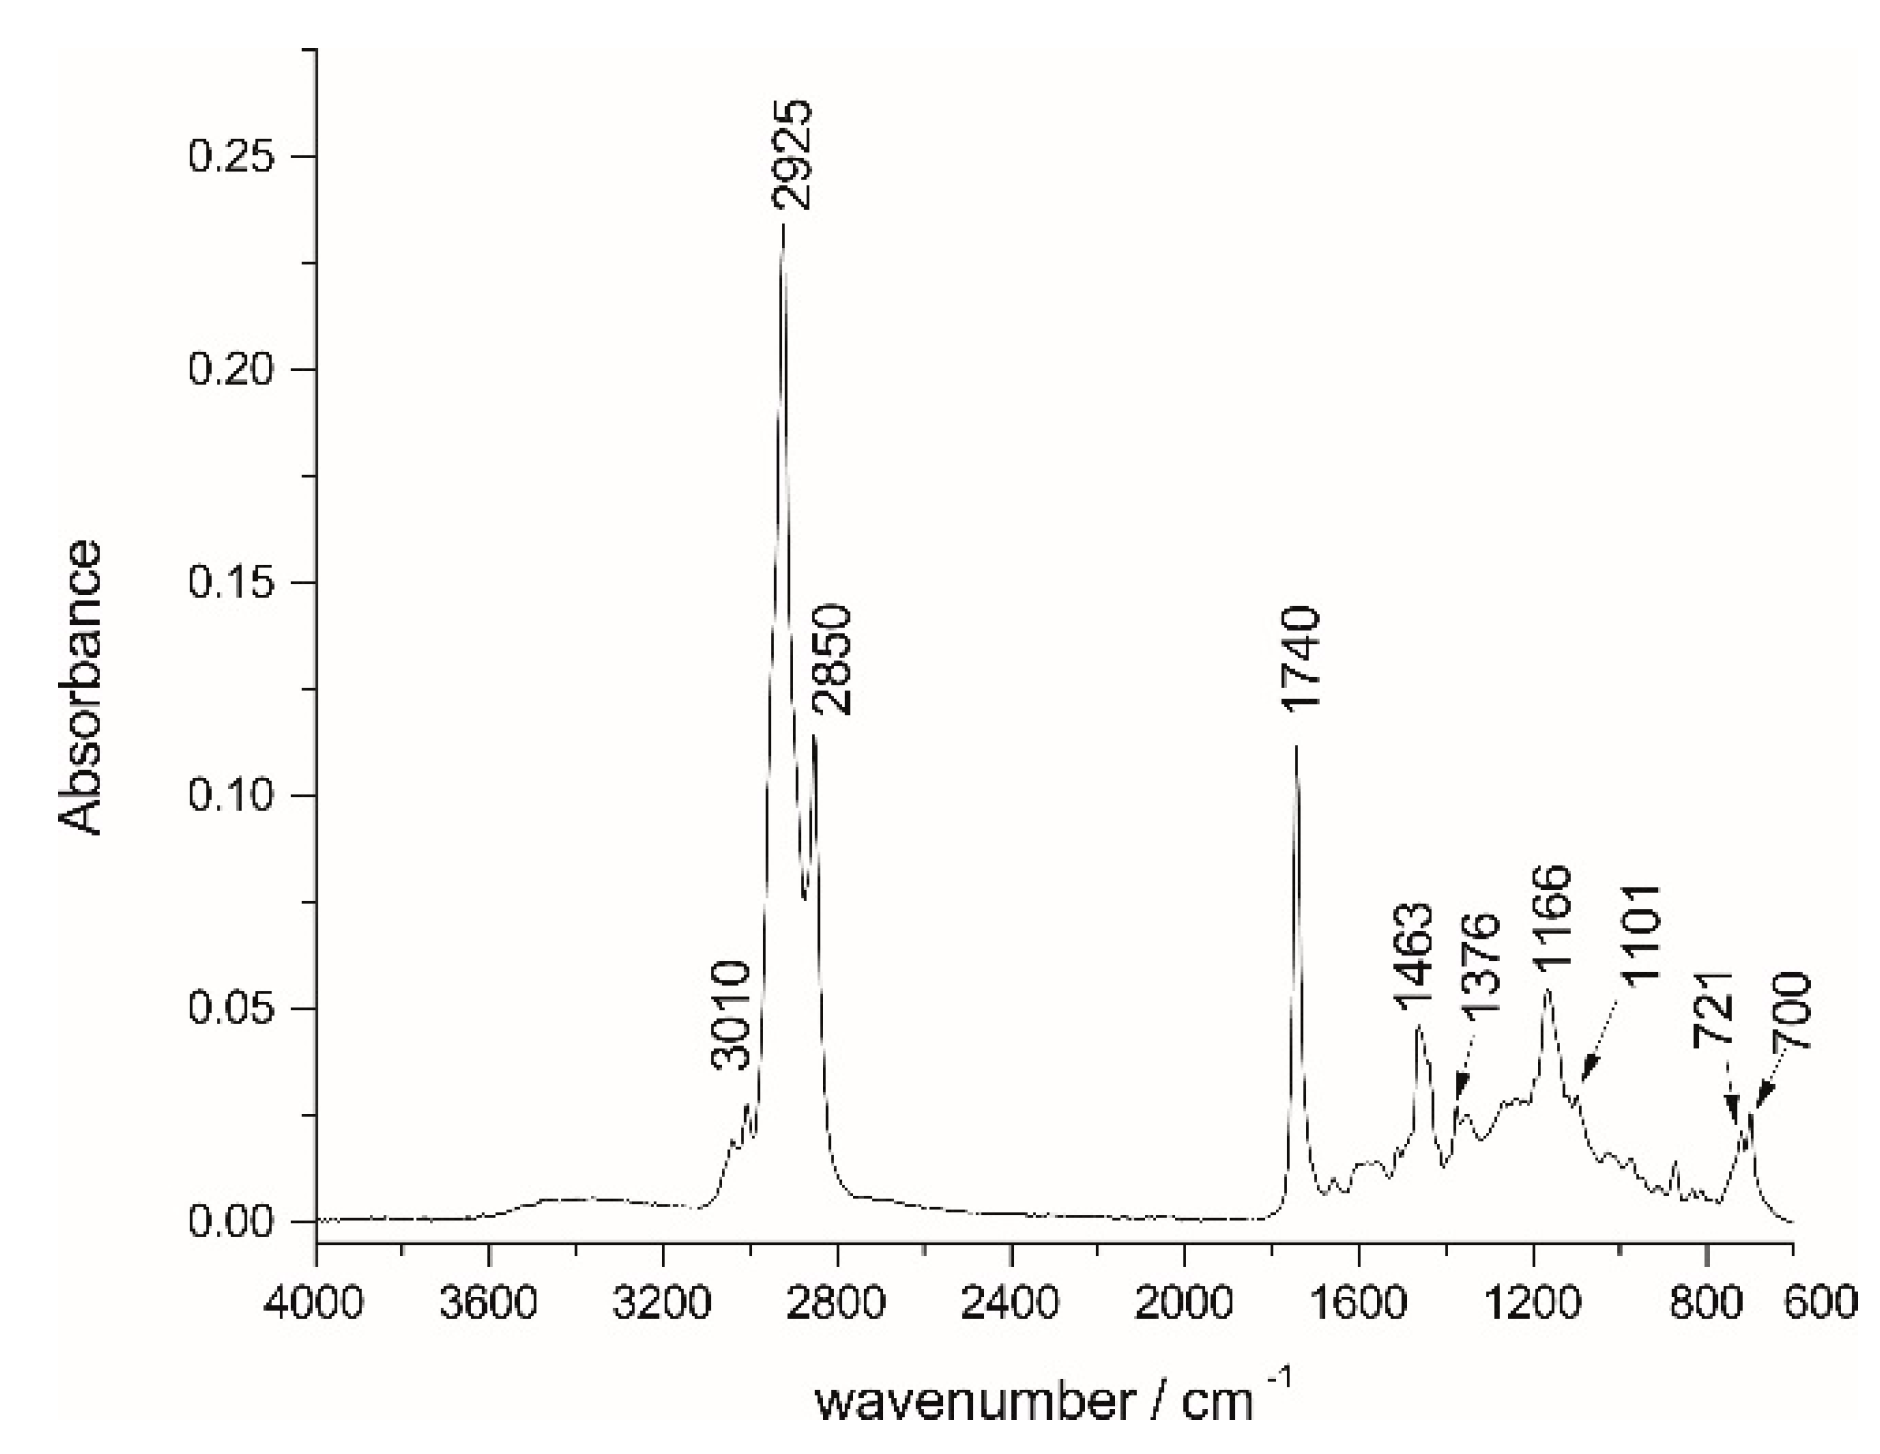
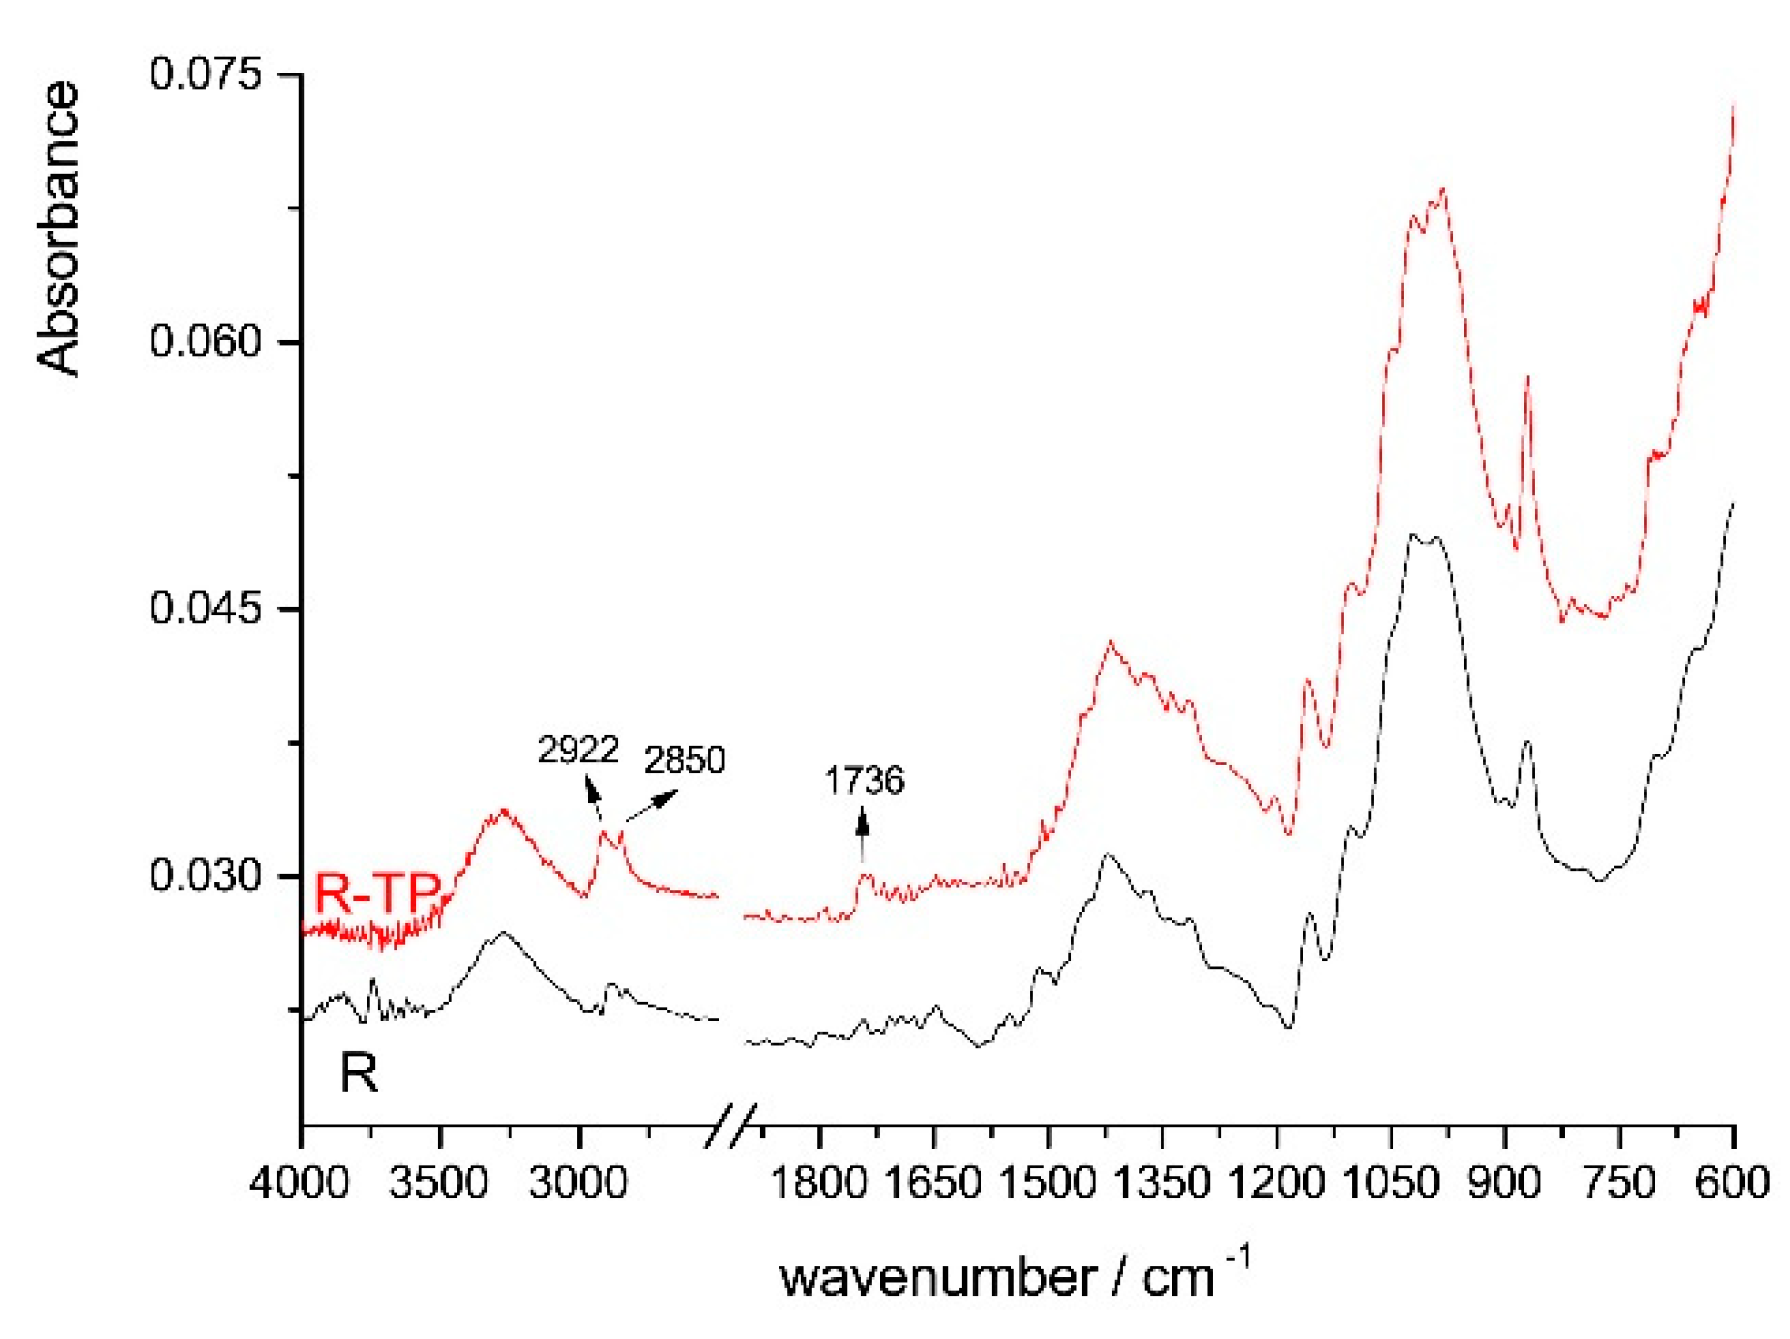
FTIR spectrum of thermochromic printing ink (
Figure 6) shows vibrational bands characteristic for vegetable and mineral oils [
32,
53,
54,
55,
56]. Oils have vibrational bands from 2925 to 2850 which are assigned to -CH, -CH
2, and -CH
3 stretching bonding vibration of aliphatic chains. In addition, vegetable oils show bands at 3010 (alkenyl CH stretching), 1463 (CH, CH
2 stretching), 1166 (C-O stretching), 1101 (C-O stretching), and 721 (-CH
2- rocking) cm
−1 and an intense band at 1740 cm
−1, assigned to the carbonyl group of esters [
32,
57,
58,
59,
60]. The bands at 1463 cm
−1 (aromatic C-H bending) and 1376 cm
−1 indicate the presence of mineral oil [
32,
61]. The binder in used thermochromic ink therefore contains mineral and vegetable oils that cover microcapsules in a way that they cannot be detected by FTIR analysis. This behavior was also confirmed in research by Vukoje et al. [
24] and Vukoje et al. [
23]. The proportion of vegetable oils used to manufacture cold-set ink is quite low (less than 5%) [
32]. The ink may contain resins in a binder, as well, but the resin bands may overlap with vibrational bands of oils [
32,
62].
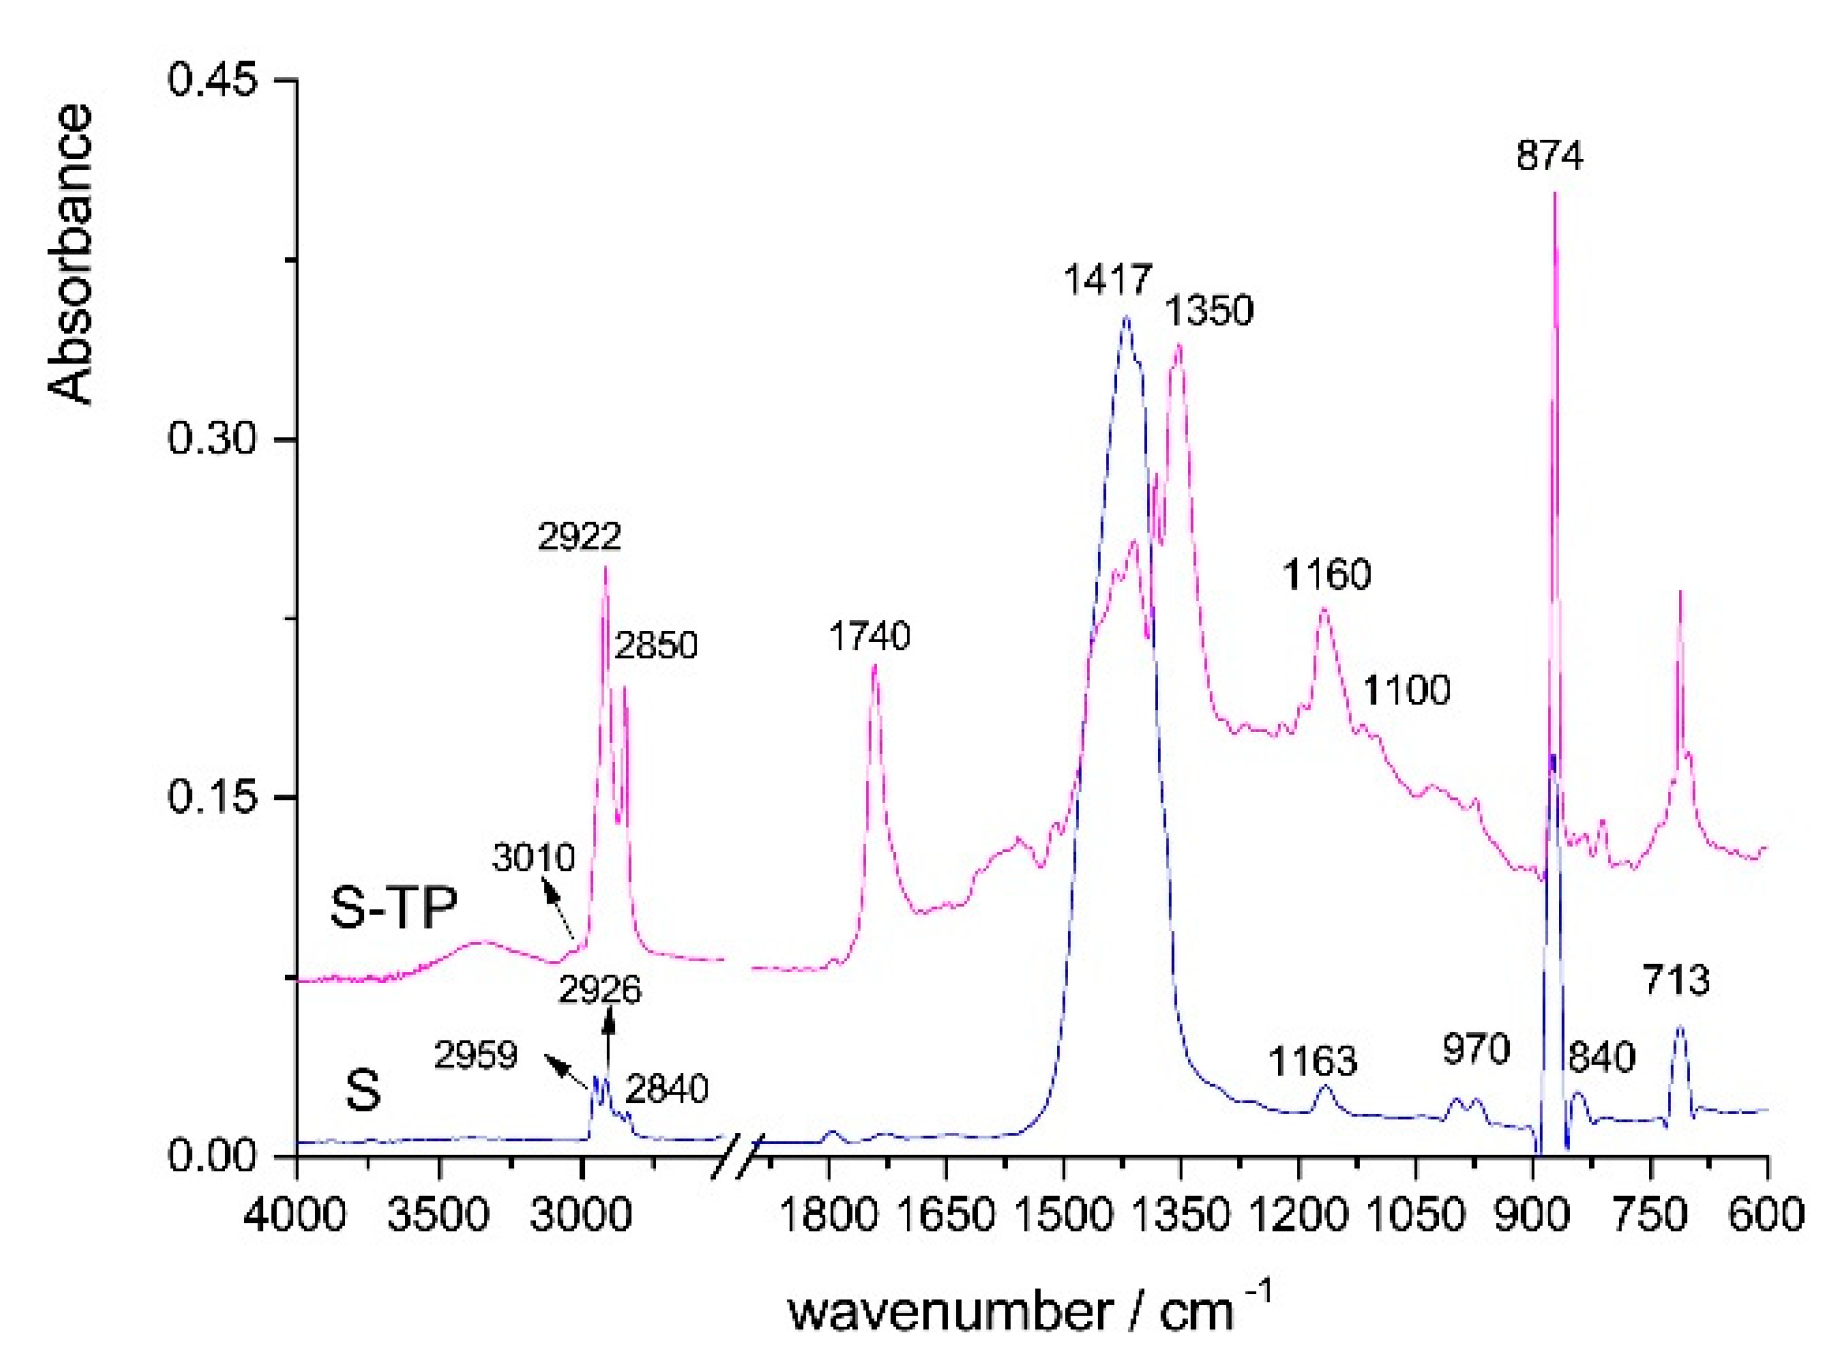
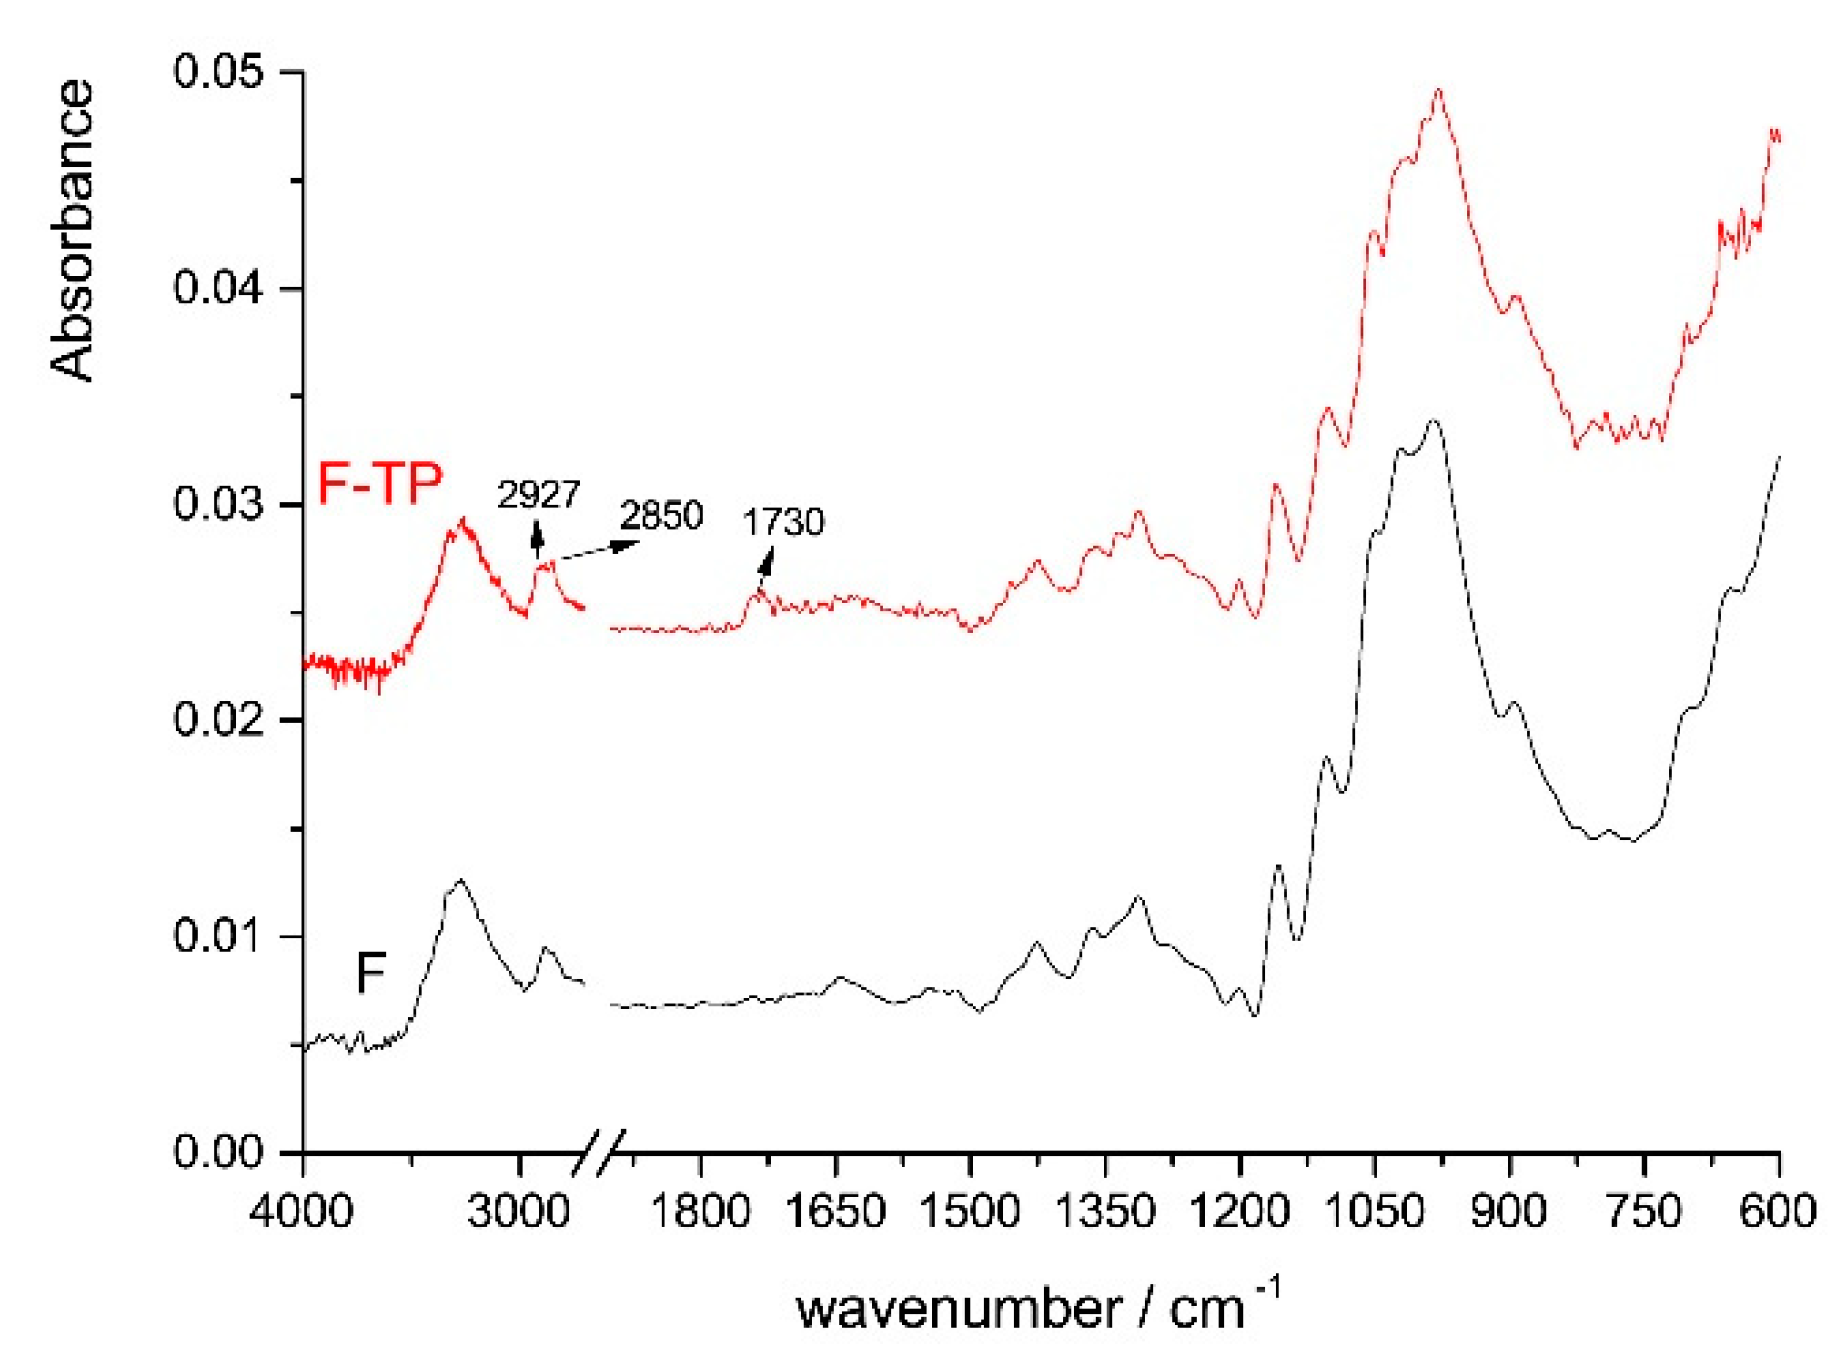
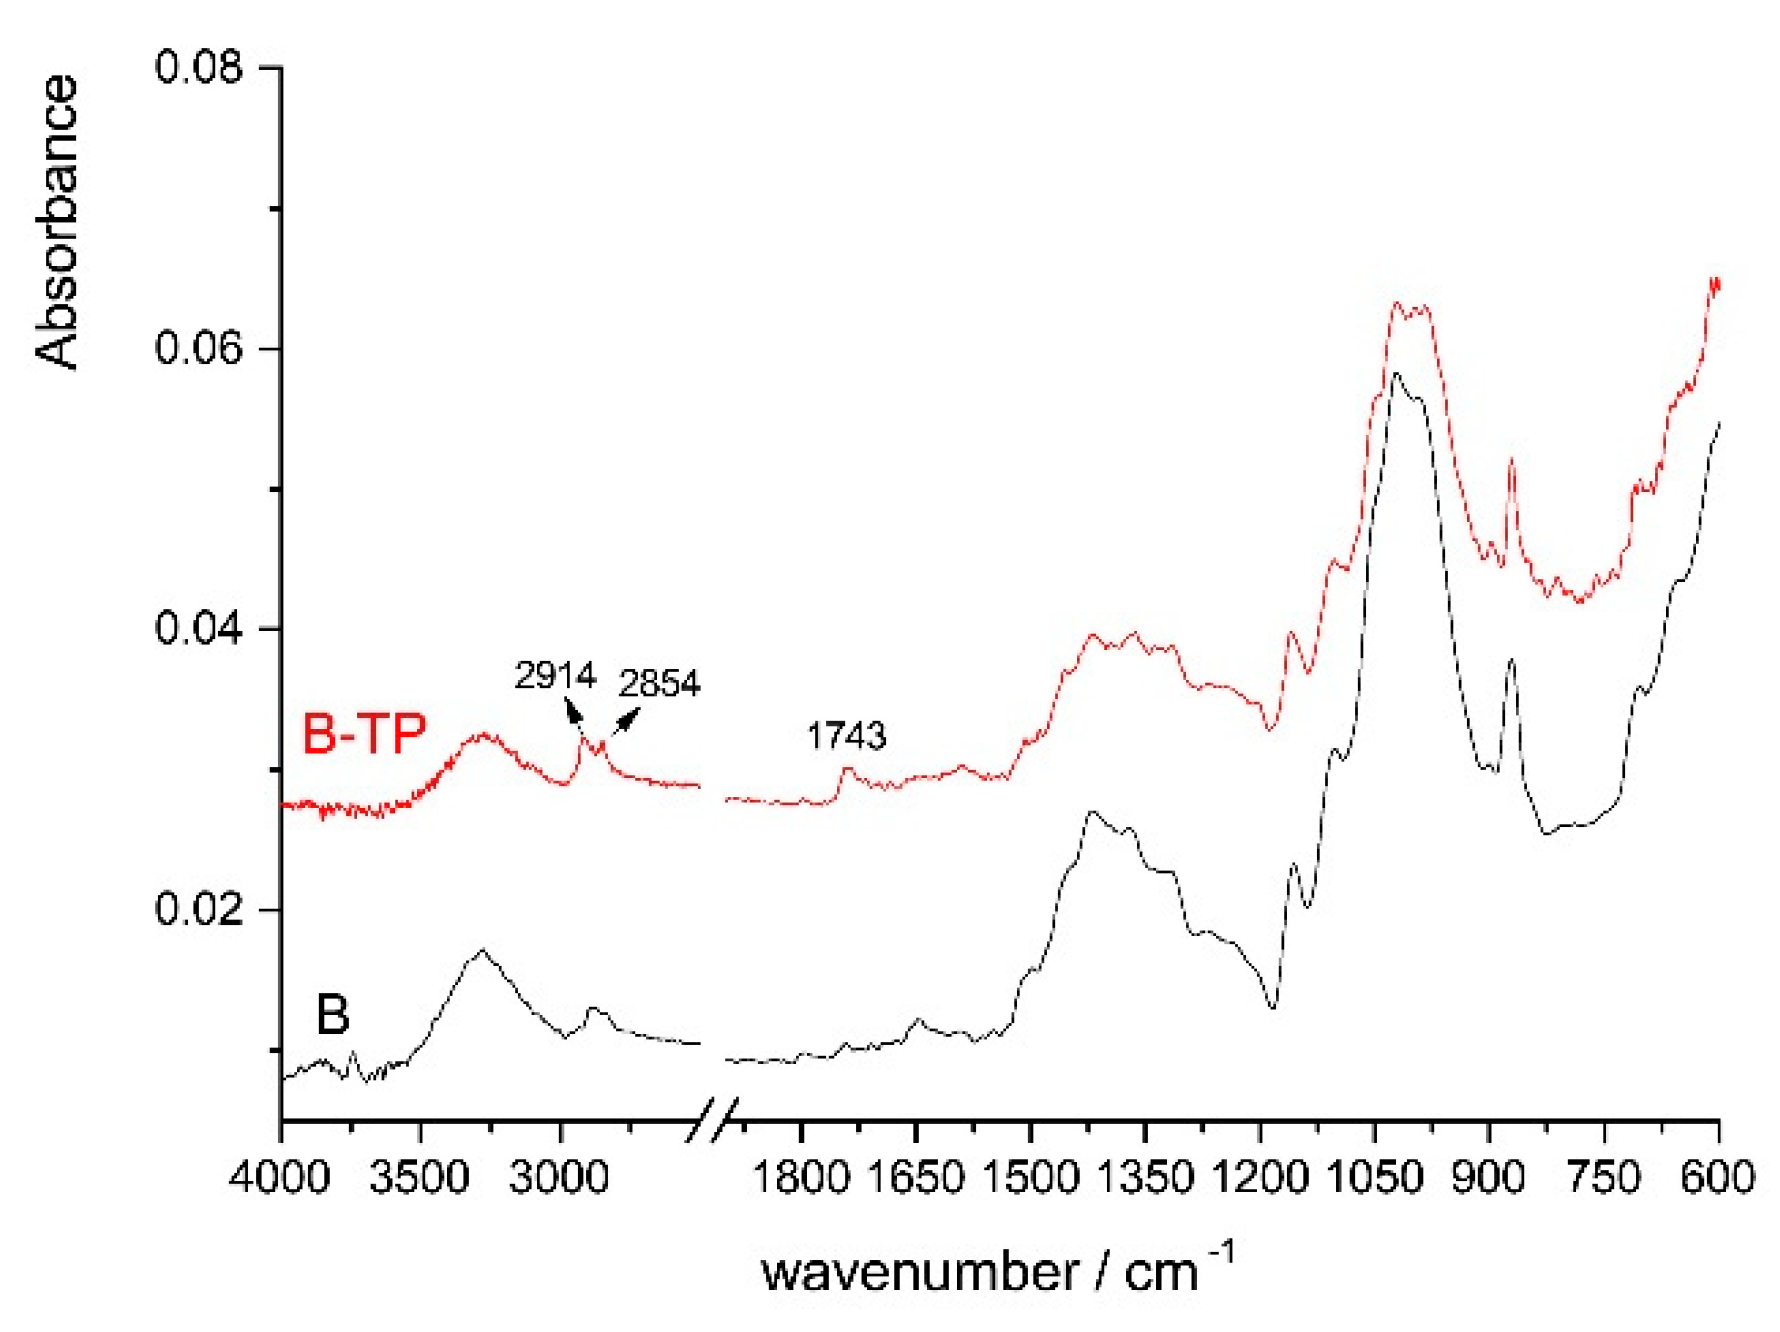
3.8. FTIR Analysis of Thermochromic Prints
Figure 7 shows the FTIR spectrum of thermochromic ink on S paper. The bands that are characteristic for mineral and vegetable oils are also visible in the spectrum of thermochromic print on S paper (
Figure 6 and
Figure 7). This is because the S paper is not absorbent.
In the print’s spectra on the F (
Figure 8), B (
Figure 9) and R (
Figure 10) papers, the bands characteristic of cellulose and additives are visible, while the bands of oils are very low. The oils spectra are only visible in the spectral range from 2850–2930 cm
−1 and around 1740 cm
−1 (C=O stretching vibration). Thus, it is possible to assume a good absorption of oils within the structure of these papers.
The largest decrease in 2850–2930 cm
−1 spectral range and 1740 cm
−1 area are visible on the F paper (
Figure 8). Accordingly, the oils are mostly absorbed in the structure of F paper. According to Koivula et al. [
35], the pigments and resins remain on the surface of the paper coating, whereas the mineral and vegetable oils are mobile and penetrate into the coating layer. Polar vegetable oils are less mobile than the non-polar mineral oils.
3.9. Surface Free Energies of Prints and the Interfacial Free Energies
Table 7 shows the values of surface free energies and surface free energy components of thermochromic prints. All surface free energy values of the prints are greater than the surface free energy of unprinted papers (
Table 4), except in the case of F paper. In addition, the dispersion components of all prints are higher compared to dispersion components of unprinted paper surfaces. The polar component of F-TP print is considerably smaller than the polar component of the surface of unprinted F paper. Polar components of the R-TP and B-TP prints are higher than the polar component of unprinted paper surfaces.
The interfacial free energy (γ
12) is the smallest at the R-TP interphase (0.23 mJ m
−2) (
Table 8). Slightly higher values are calculated for the S-TP interphase (0.31 mJ m
−2) and for the interphase B-TP (0.33 mJ m
−2). The greatest γ
12 is at the F-TP interphase (19.32 mJ m
−2) due to hydrophobic effect. F paper contains only cellulose molecules, i.e., it is hydrophilic. Thermochromic ink is hydrophobic. The interaction between a hydrophobic molecule and hydrophilic molecule is actually attractive due to dispersion interactions that are not very different from those between hydrophilic-hydrophilic or hydrophobic-hydrophobic. However, the interaction of hydrophilic cellulose molecules with themselves is much more attractive due to the H-bonding interactions. Cellulose has the effect of squeezing the hydrophobic ink’s molecules to attract each other to form a larger aggregate. An increase in the temperature can increase the hydrophobic attraction [
43,
63].
The interfacial free energy of the S-TP interphase is somewhat smaller than the interfacial free energy on B-TP interphase. This can be attributed to the lack of absorbency of S paper. In F, B, and R papers, the oils are absorbed into the structure, while the polar resins remain more on the paper surface. These resins have the highest affinity for R paper. On the surface of S paper, separation of the ink vehicle may also occur. In this case, the resins are absorbed on the surface of S paper, while, on the resin’s surface, there are mineral oils that are chemically similar to the surface of S paper.
3.10. Ordering of the Microcapsules on a Paper (AFM)
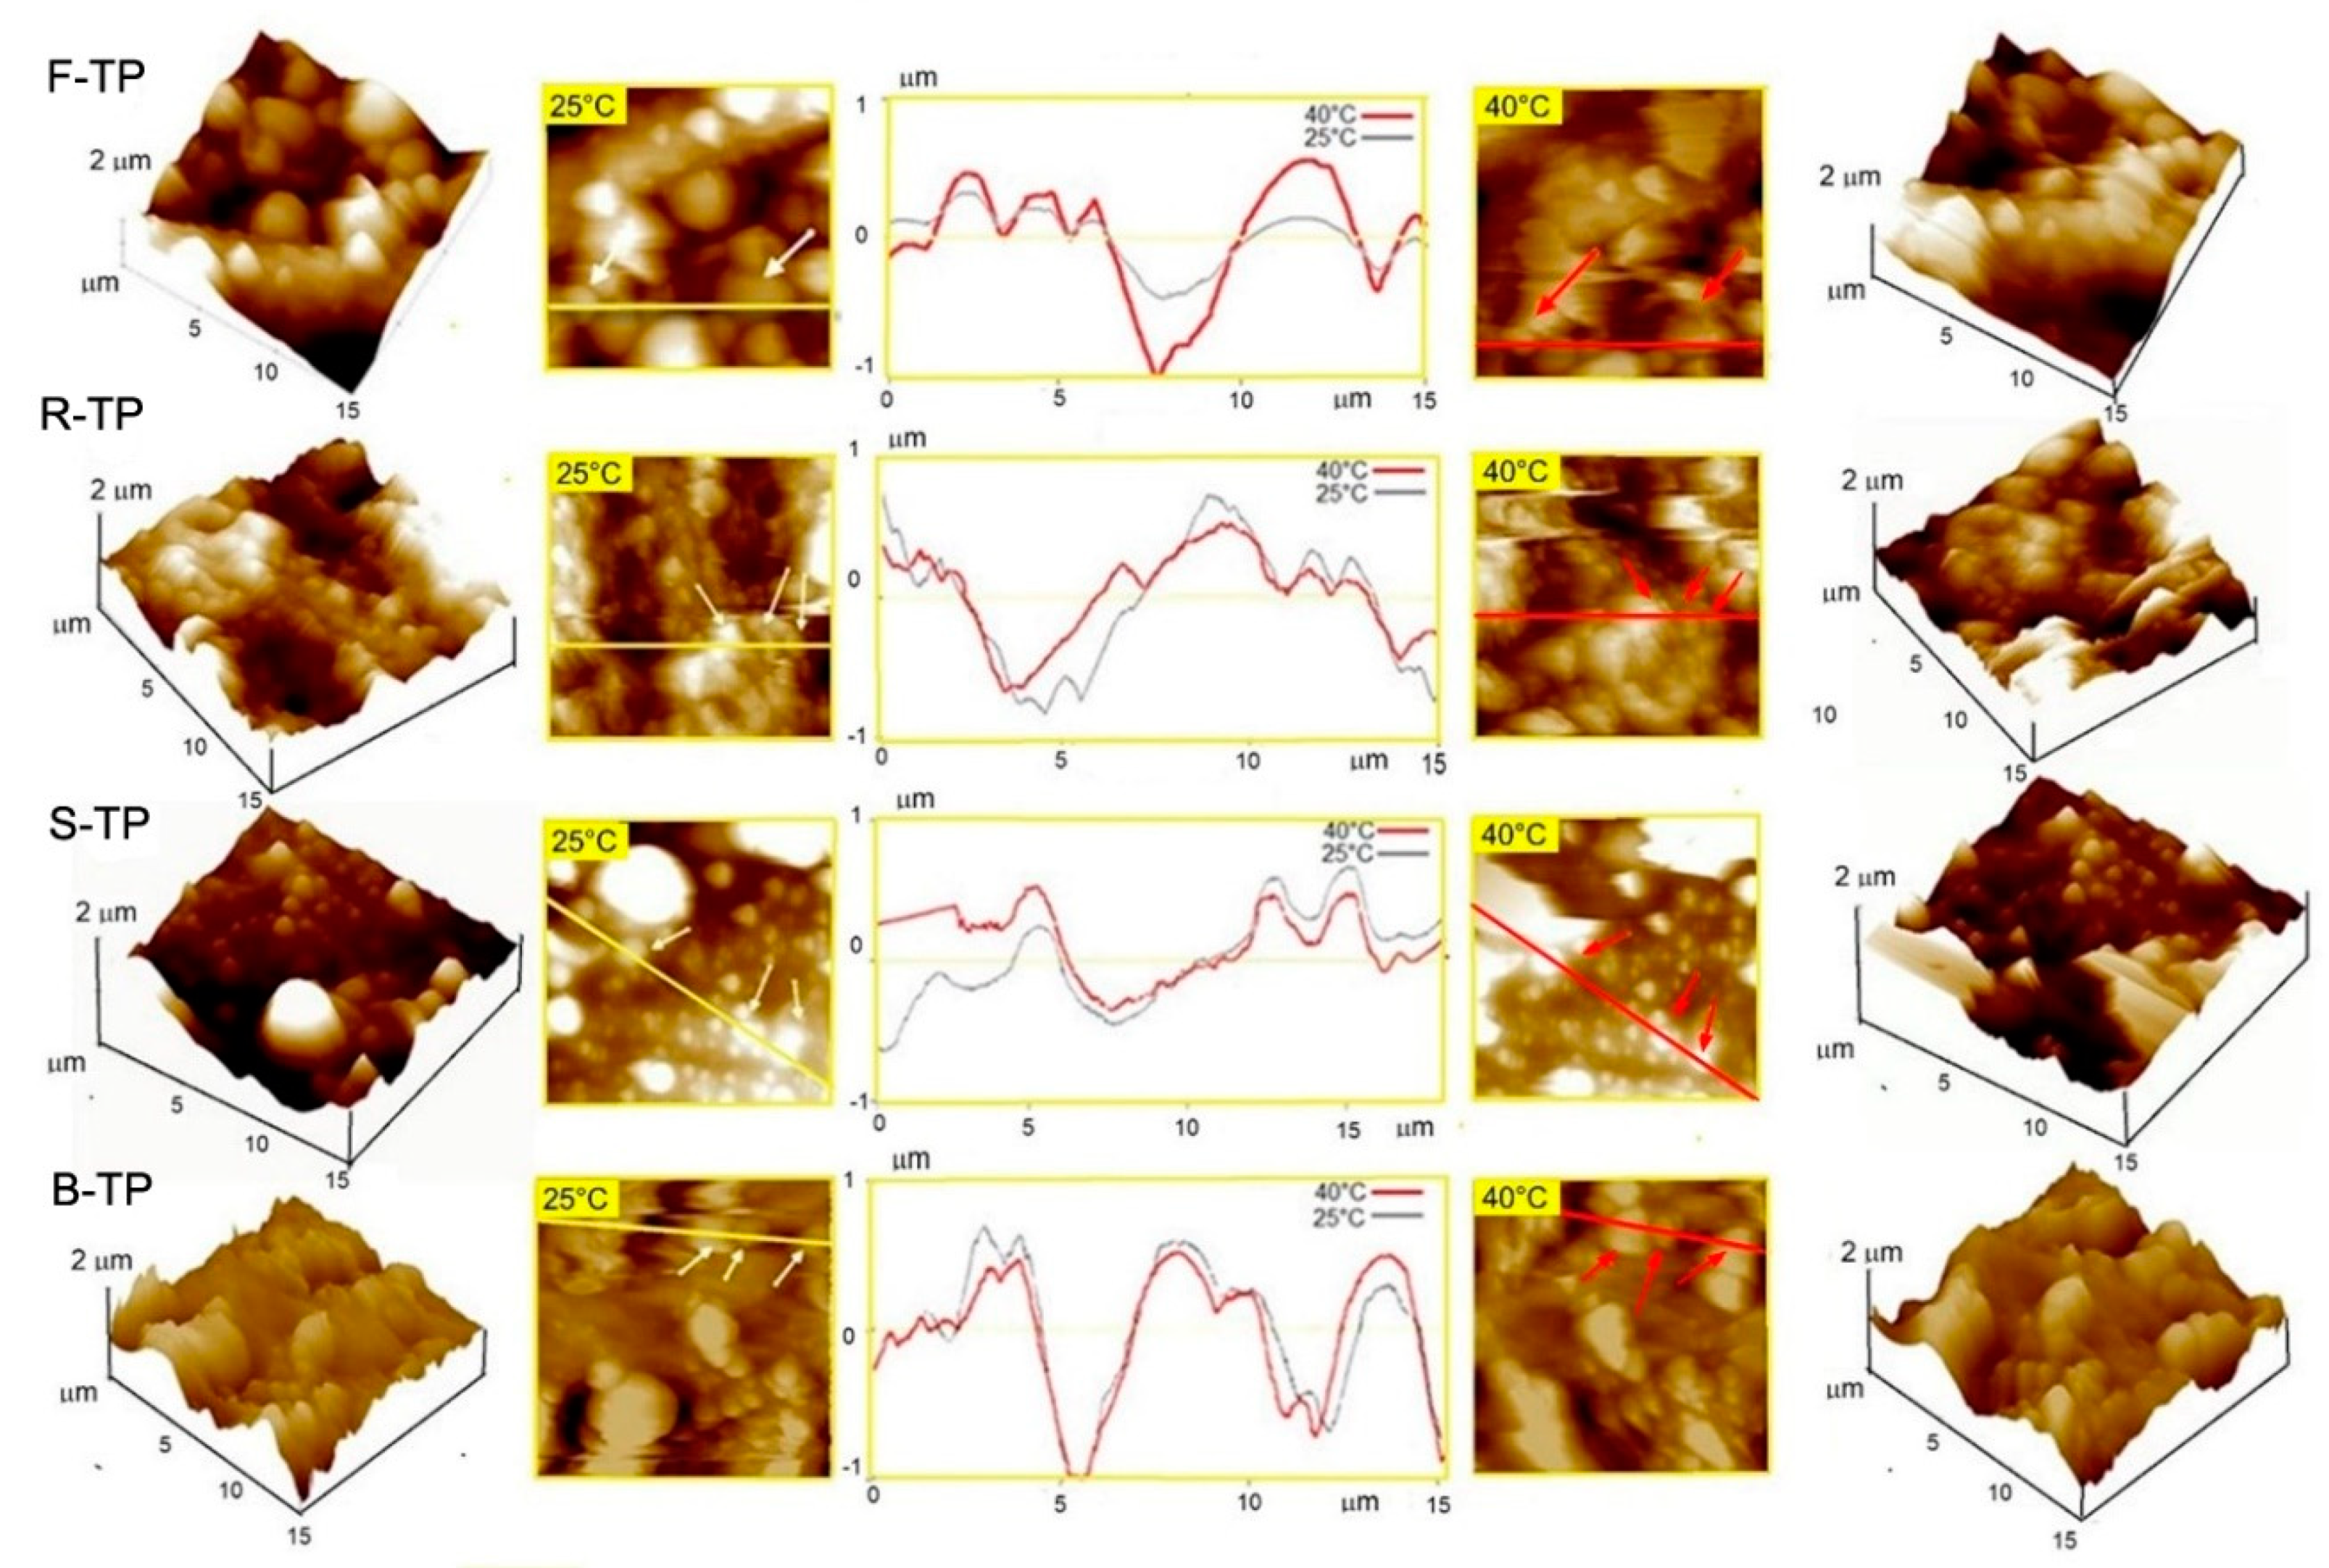
Typical AFM 3D and 2D height-images, having the area of 15 μm × 15 μm, obtained with the thermochromic prints on investigated papers, are shown in
Figure 11. Since the AFM vertical resolution is under 1 nm, it was used to characterize both the small difference of the surface topography and the height of the microcapsules.
The “white mountains” correspond to microcapsules and the lower surface between the “mountains” corresponds to the uncovered paper. This image reveals the distribution of microcapsules after printing, measured at 25 °C (left) and after heating to 40 °C (right). The results demonstrated that the samples behaved differently in terms of the surface structure and the micro smoothness after being printed on the paper. The microcapsules were distributed on all investigated prints and for chosen ink concentrations, the F, R, and B papers showed very similar regularity in paper covering. Microcapsules appeared to be arranged more tightly and orderly, while on S paper different surface morphology and the individual microcapsules protruded above the supporting paper. This was also confirmed by the SEM analysis (
Figure 5). The AFM image on
Figure 11 shows mainly that all microcapsules are brought into contact forming larger agglomerates of microcapsules, except in the case of S paper. The average microcapsule height and diameter on the investigated (15 μm × 15 μm) papers at 25 °C and 40 °C are given in
Table 9. The section profile analysis (middle) revealed the height line section profiles that showed microcapsule lateral profiles at 25 °C (black line in the middle) and 40 °C (red line in the middle).
The largest diameter of microcapsules in average was evaluated on F paper (3.6 ± 1.3 μm) while the smallest diameter in average was observed on S paper (1.1 ± 0.9 μm). On the other hand, in both samples, B and R paper, the lateral diameters in average were 1.8 ± 1.1 μm and 1.6 ± 1.4 μm, respectively.
Depending on the TC microcapsule dimensions (diameter and height) the colorimetric characteristics of the prints will be affected. Therefore, the dimensions of the microcapsules and the opening of the hysteresis loop at low temperatures are directly related. The larger the dimensions, the sample needs to be exposed to somewhat lower temperatures during the reversible reaction (i.e., cooling) in order to get to its original state (i.e., coloration). The smaller the dimensions of the TC microcapsules (in the case of S paper) the samples needs to be cooled down more during the reversible reaction. This is visible from the opening of the hysteresis loop (see colorimetric measurements in
Figure 4 and
Table 6).
The increase of temperature to 40 °C (above the melting point of the solvent within the microcapsule) altered the morphology and the average microcapsule diameters in F-TP, R-TP and S-TP prints, while its value in average remained unchanged for B-TP print. Thus, the highest decrease in diameter of microcapsules was observed fpr F-TP print, from 3.6 ± 1.3 μm to 2.0 ± 1.3 μm, e.g., for −44% in average, following with the smaller decrease in diameter of microcapsules for R-TP print from 1.6 ± 1.4 μm to 1.2 ± 0.5 μm (−25% in average). The smallest decrease in diameter was observed for S-TP print, from 1.1 ± 0.9 μm to 0.9 ± 0.5 μm (−18% in average), while no change in diameter of B-TP print has been observed. Interestingly, a decrease of the microcapsule diameter was followed by the change of the measured heights at the highest points of the microcapsules. The largest increase of the height in average was measured on microcapsule hosted on F-TP print (40%), followed by some slighter increase (11%) on B paper. In contrast, the height of microcapsules observed on paper-TP print showed opposite effects as height was decreased for 25% in average. In addition, no changes were observed in height of microcapsules hosted S-TP print.
The mentioned dimensional changes of the TC microcapsules during heating–cooling cycle can be a consequence of printing ink adhesion to the paper substrate. Optimum adhesion is achieved on R paper that has the optimal polarity index (
Table 7). By increasing the temperature to 40 °C, the diameter and height of the microcapsules are changed. The largest changes in the shape of the microcapsules (increase in height and decrease in diameter) were obtained on the surface of the F paper. Due to the hydrophobic effect on F paper–TC print interphase, a high surface tension occurs (
Table 7 and
Table 8). After F paper, microcapsules of the R-TP print surface show the highest changes in height and diameter (
Table 9). However, the height and diameter of the microcapsules are reduced. Reducing the diameter and reducing the height of the microcapsule by increasing the temperature on the surface of R-TP print means that the microcapsules penetrate deeper into the paper structure (optimum adhesion). On B paper surface, which is more hydrophobic than the R paper surface, the increase in temperature does not cause any significant changes in the shape and position of the microcapsules on B-TP print surface. On the surface of non-porous synthetic paper, an increase in temperature above the activation temperature also does not cause a significant change in the shape of the microcapsules. Because the synthetic paper is not porous, it is not possible to move the microcapsules.
A section profile evaluation showed that microcapsules were held on the surface of the printing substrate, but that they penetrated into/out of the center of the paper to some degree through the small pores in the paper depending on the physicochemical properties of the paper. Since the experiment was performed in the same experimental conditions (with the same ink concentration, i.e., microcapsules concentration), the distribution and their penetration into the substrate is probably the function of the paper characteristics.
4. Conclusions
The proper selection of paper substrate is crucial for the production of good printed product. In order to select the most suitable printing substrate, it is crucial to study the influence of different paper properties on the print quality. Thus, in this study, papers of different structural and chemical properties, i.e., fibrous (filter, bulky, recycled) and polymer film (synthetic paper), were used.
The SEM and AFM analysis showed that the microcapsules on the surface of the smoothest S paper possess the smallest diameter and height, while, on the most porous and the most roughened surface of F paper, they possess the highest diameter and height. The overall results indicate that the characteristics of the paper and their structure significantly affect the colorimetric characteristics of TC prints and their behavior during the heating and cooling cycle. In the case of paper with a fibrous structure (made of cellulose and additives), the porosity and roughness of the paper have the most significant influence. The paper with higher porosity and roughness will result in a stronger thermochromic print effect (higher TCC and hysteresis surface–AreaLab). In addition, the papers with higher roughness will retain larger microcapsules on their surface, which will give better results during the process of reversible cooling reaction, i.e., they will return to their original state sooner. In contrast, non-fibrous materials with smooth surface (polymer films) will also give a satisfactory colorimetric properties (TCC and hysteresis surface–AreaLab). Such materials should be exposed to a much lower temperature to return to the original state (coloration) due to presence of smaller microcapsules. Results indicate that the opening of the hysteresis loop is directly related to dimensions of the microcapsules. That indicates the need of the cooling process of the sample in order to return the print coloration to the original state. Dimensional changes of TC microcapsules during heating and cooling cycle may be the function of thermochromic ink adhesion to paper. The obtained data clearly shows that the physicochemical properties of the paper affect the position and dimensions of microcapsules in thermochromic prints, i.e., its colorimetric properties. Still, it is questionable what happens to microcapsules in thermochromic prints that dry in different ways (oxidation or radiation-induced curing), which is going to be the aim of the next study.


