Article

Tensile Tests for the Improvement of Adhesion between Rubber and Steel Layers in Elastomeric Isolators

Polytechnic Department of Engineering and Architecture, University of Udine, 33100 Udine, Italy
*
Author to whom correspondence should be addressed.
Appl. Sci. 2020, 10(22), 8063; https://doi.org/10.3390/app10228063
Submission received: 5 October 2020 / Revised: 30 October 2020 / Accepted: 12 November 2020 / Published: 13 November 2020
(This article belongs to the Special Issue Advances in Building Materials and Concrete)

Abstract

:
Steel reinforced elastomeric isolators are currently the most used bearings for seismic isolation purposes. The steel reinforcements are cut to the desired shape, sandblasted, cleaned with acid, and coated with bonding compound during the manufacturing process. Then the elastomer and steel layers are stacked in a mold and subjected to vulcanization so that they are glued together and constitute a single body. Good adhesion between the layers is very important for the correct functioning of the device. Adhesion conditions become critical when the isolators are subjected to tensile stresses, which arise under direct tensile actions or large shear strains. To analyze the influence of changes in the manufacturing process on the isolator adhesive behavior, the authors performed tensile tests on square-shaped small-scale specimens rather than expensive shear tests on full-scale isolators. Hence, the adhesion behavior between elastomer and steel layers was investigated through the tensile tests discussed herein. Among the influencing parameters that were considered, it was found that an increase in vulcanization time does not improve the adhesion, but it may actually worsen the capacity of the isolator in terms of strength. Moreover, it was found that using elastomer without an oily component improves the adhesion between the layers and increases the isolator’s dissipative capacity.

1. Introduction

Steel reinforced elastomeric isolators (SREIs) are currently the most used bearings for seismic isolation purposes. They are made with steel reinforcing layers (2–3 mm thick) alternating with layers of elastomer (5–20 mm thick), which are bonded together by means of a bonding compound and a vulcanization process. These isolators are delimited at the top and at the bottom by two 25–30 mm thick steel endplates, which are anchored to the isolator steel end layers and anchor the isolator to the sub- and super-structure.
In the process of producing the SREI core, i.e., the central part of the isolator without the thick steel end plates, the steel reinforcements are cut into the desired shape, sandblasted, cleaned with acid, and coated with bonding compound. The sandblasting roughens the steel surface to facilitate bonding with the elastomer. The bonding compound is made of two chemical substances: the primer and the mastic. The primer, which is applied directly to the steel, is meant to improve adhesion between the steel and mastic. The mastic is applied over the primer and glues the elastomer layer to the steel plates. The steel and the elastomer layers are then stacked in a mold and subjected to a pre-determined compression at a temperature and pressure that causes them to be glued together by means of vulcanization, so that they are held together and constitute a single body.
Good adhesion is very important in all rubber composite devices for the correct functioning of materials bonded to the elastomer [1,2,3,4,5,6,7,8,9]. Moreover, it is important, because the theoretical calculus of rubber composite devices is based on the hypothesis of perfect bonding between the elastomer and the other materials [1,2,10].
The adhesion conditions of the steel and elastomer layers, obtained in SREIs as described above, become critical under two particular conditions:
-
the isolator is subjected to direct tensile stresses, i.e., a tensile action is present
-
the isolator is subjected to large shear strains, which induce tensile stresses in the isolator extremities bounded by the white dotted line shown in Figure 1.
The first condition may occur in tall buildings [11], which undergo large overturning moments that induce tensile stresses on the isolators and uplift of the building.
However, this is not the only situation in which isolators undergo tensile stress.
Keda and Nagahashi [12] investigated the earthquake response characteristics of the isolators in a base-isolated high-rise building with a set-back and found that axial stresses in isolators at the corners below the low-rise part are higher than those in isolators under the high-rise part, with some strong motions inducing maximum tensile stresses exceeding 1 MPa.
Mitoulis [13] performed an extended parametric study that revealed that bearing uplift due to tensile action may also occur in isolated bridges, and this effect is more critical for the bearings on shorter piers. This finding was also confirmed by Tubaldi et al. [14].
The standard UNI EN 15129 [15] takes into account the possibility that the isolators are able to undergo tensile stress; however, to avoid the cavitation of the rubber the value of this load is limited to 2G, where G is the isolator shear modulus measured at a 100% strain. The strain is calculated as the ratio between the maximum applied displacement and the isolator rubber total thickness. Since the G values provided by the isolator manufacturers generally range from 0.4 MPa to 1.4 MPa, the above limit ranges from 0.8 MPa to 2.8 MPa.
The second condition is where tensile stress arises in the isolator due to large shear strains, even if the isolator is subjected to compression.
Kalfas et al. [16] observed that when a rotational restraint is applied on the anchor plates of the bearings, which is the case in vertically heavily-loaded buildings, under shear strains in the range of 125–375%, compressive stresses develop in the regions closer to the center of the bearing while tensile stresses are observed at the edges of the rubber layers bounded by the white dotted line shown in Figure 1.
To take this phenomenon into account, the standards impose severe shear tests on the isolators during the device qualification stage.
In standard UNI EN 15129 [15], the tests provided to assess the performance requirements for elastomeric isolators involve the isolators being subjected to increasing maximum shear strains up to a value of 2.5. Under this very demanding condition, the isolator extremities (bounded by the white dotted line in Figure 1) are subjected to tensile stresses. If the bonding between the steel and the rubber layers is not well realized, these stresses may induce a phenomenon called delamination, which involves the detachment of the steel layers from the elastomeric ones.
In the first stage of production, a new isolator is subjected to many tests at the maximum shear strain before it attains the required isolator performance and is qualified to be placed on the market.
These shear tests are quite expensive because they require the use of a specific machine, and moreover, a number of isolators, which are individually expensive. Therefore, it would be helpful for manufacturers if they could perform less expensive tests on a number of small-scale simple specimens using a less specific machine, for example, a tension-compression test machine used for testing materials.
The authors were prompted to consider this issue when an isolator manufacturer requested an investigation of the adhesion between elastomer and steel layers of isolators while varying some of the manufacturing processes. Various manufacturing processes could be changed one at a time to study their individual influence on the isolator performance. Hence, a large number of isolators would need to be produced and subjected to testing, which would involve considerable expense. To reduce this expense and conduct preliminary investigations, the authors proposed that the tensile tests be performed on square-shaped small-scale specimens.
The experimental procedures used to study the behavior of the bond between the steel and elastomeric layers of the isolator are described herein, and the influence of the changes in the manufacturing process on the isolator performance are discussed.

2. Sample Characteristics

The isolator prototypes were built by ILPEA Industries of Pordenone, Italy, and experimentally tested at the Laboratory for Testing Materials and Structures of the University of Udine, Italy. The samples were square-shaped and small, because this configuration results in the lowest cost for the manufacturer. The thickness of the elastomer and steel layers were realized in the same order of magnitude of those used for medium-size real isolators. The geometrical characteristics of the samples are shown in Figure 2.
The samples were produced using a square-based mold, in which a 20 mm thick steel plate was placed at the bottom and an elastomer covering of 5 mm (if provided) was placed on the vertical lateral surfaces. Subsequently, 6 mm thick elastomer layers alternating with the 3mm thick reinforcement elements, were inserted one on top of the other.
The steel reinforcements were sandblasted and pre-treated with primer and mastic. The sandblasting roughens the steel surface to facilitate bonding. The primer, applied directly to the steel, is a chemical substance that is meant to improve the adhesion between steel and mastic. The mastic, a liquid glue. is applied over the primer to paste the elastomer layer to the steel reinforcement. After the whole mold is filled with these layers, the next operation is the vulcanization. During vulcanization the layers are subjected, for certain period of time, to a pre-determined compression at a temperature that causes them to glue to each other, so that the layers are held together and substantially constitute a single body. The vulcanization time varies, depending on the dimensions of the isolator.
The characteristics of all 24 tested samples are reported in Table 1.
Elastomer layers with three different shear modulus, G = 0.4 MPa, G = 0.8 MPa and G = 1.4 MPa, were used. Different types of compound can be present in a group of samples with the same shear modulus. The compounds that were considered and their characteristics are:
-
35,713—hardness 70, shore A, styrene butadiene rubber (SBR)-based, which is a synthetic rubber, dissipative compound
-
35,718—hardness 60, shore A, natural rubber (NR)-based, dissipative compound
-
34,821—hardness 40, shore A, NR-based, dissipative compound
-
312—hardness 70, shore A, SBR-based, non-dissipative compound
-
27,303—hardness 60, shore A, SBR-based, dissipative compound.
All of these compounds are used by ILPEA to produce seismic isolators, apart from compound 312, which is used to produce road joints. This compound has good abrasion resistance and good elongation capacity, but it is not dissipative.
To investigate how the adhesion between elastomer and steel layers can vary, the following manufacturing processes were taken into consideration:
-
The basic vulcanization time of the tested samples, considering their dimensions is 135 min according to ILPEA manufacturing standards. In the experimental campaign, this time was varied to investigate if the variation produced effects on the layers’ adhesion. Longer vulcanization time involves longer pressure application and heating, which are the processes that result in the reorganization of the rubber compound crosslinks to obtain the final elastomer and the gluing of the elastomer to the steel layers. Time periods of 150 and 180 min are taken into consideration.
-
Corundum was used for sandblasting instead of standard grit to produce some of the samples used in the study. Corundum is an aluminum oxide and it is used in the manufacture of abrasives because of its great hardness, which is close to that of diamond. It can also be produced synthetically. This material may be able to increase the roughness of steel reinforcements, and consequently, the adhesion between steel and elastomer layers.
-
Isolators usually have an elastomer layer covering the lateral external surface. This layer is obtained by using steel reinforcements that have a diameter or side length smaller than the interior dimension of the mold. During the vulcanization, the elastomer of the horizontal layers occupies the spaces that remain empty near the surface of the mold, and thus creates the external covering. This covering protects the isolator core from external agents. For most of the considered samples, the thickness of the external covering was equal to 5 mm, but some samples without external covering layer were also tested for comparison.
-
In the isolator manufacturing process, the elastomer layers are sometimes left for a long time in the warehouse before being used to build isolators. During this storage period, an oily component of the elastomer tends to rise on the outer surface of the layer. Therefore, this oily component could partially compromise the adhesion of the elastomer to the mastic. For this reason, a number of samples were produced using elastomer without this component.
-
Additionally, several samples were produced with elastomer layers that had been refreshed before being put into the mold for vulcanization, in order to eliminate the problem of oily component on the surfaces.
-
In some samples, a “bridge layer”, which aims at increasing the elastomer-steel adhesion, was put between the mastic and the elastomer layer.
-
Moreover, considering samples with the same shear modulus of 0.8 MPa, three different elastomeric compounds: 35,718, 312 and 27,303 were used to investigate the influence of compound type on the adhesion behavior. The difference between compound 35,718 and 27,303 is in the type of rubber used to produce the elastomer, that is, NR for the former and SBR for the latter, while compound 312 is not dissipative, unlike compound 27,303.
In Table 1, samples indicated with a star are the “control samples” that were used for comparison with the results of the tests on the samples where the manufacturing processes was changed.
Sample 0 was used to calibrate the test instrumentation.
The samples labeled with the same number followed by letter a or b are identical to each other.

3. Experimental Investigation

The experimental campaign investigated how the adhesion between elastomer and steel layers varies when the above-described manufacturing processes are varied. The aim of the investigation was to select those solutions where the sample failure occurred due to elastomer rupture and not for delamination of the elastomer layers from steel layers. This ensured that the sample achieved the highest possible strength.
Moreover, according to UNI EN 15129 [15], it is important that all specimens have a tensile strength greater than 2 G.

3.1. Test Setup and Instrumentation

A MTS machine (model 810) with a displacement capacity of 150 mm and a load capacity of 500 kN (Figure 3) was used for the tensile tests. The specimens end plates were welded to two steel plates, which were disposed vertically and used to anchor the specimen to the jaws of the machine, as shown in Figure 3.
The tensile tests were carried out under displacement control, with an increasing quasi-static displacement applied until the sample failed.

3.2. Experimental Results

Under the application of increasing displacements, the sample first stretches uniformly, then it undergoes necking at an indeterminate region (as in Figure 4a) and finally, the failure occurs in the region of the necking (as in Figure 5a).
The experimental force-displacement diagrams of all samples were recorded and are reported below in the discussion of the experimental results. The following significant parameters were extrapolated from these diagrams:
-
F m a x , which is the maximum force that the sample withstands
-
d F m a x , which is the elongation of the sample for F m a x
-
d u , which is the elongation of the sample at failure, calculated as the elongation corresponding to a force reduced of 5% with respect to F m a x .
The values of these parameters for all of the tested samples are shown in Table 2, Table 3, Table 4, Table 5, Table 6 and Table 7 together with the type of failure exhibited by the sample. The sample failures are classified as follows [6]:
-
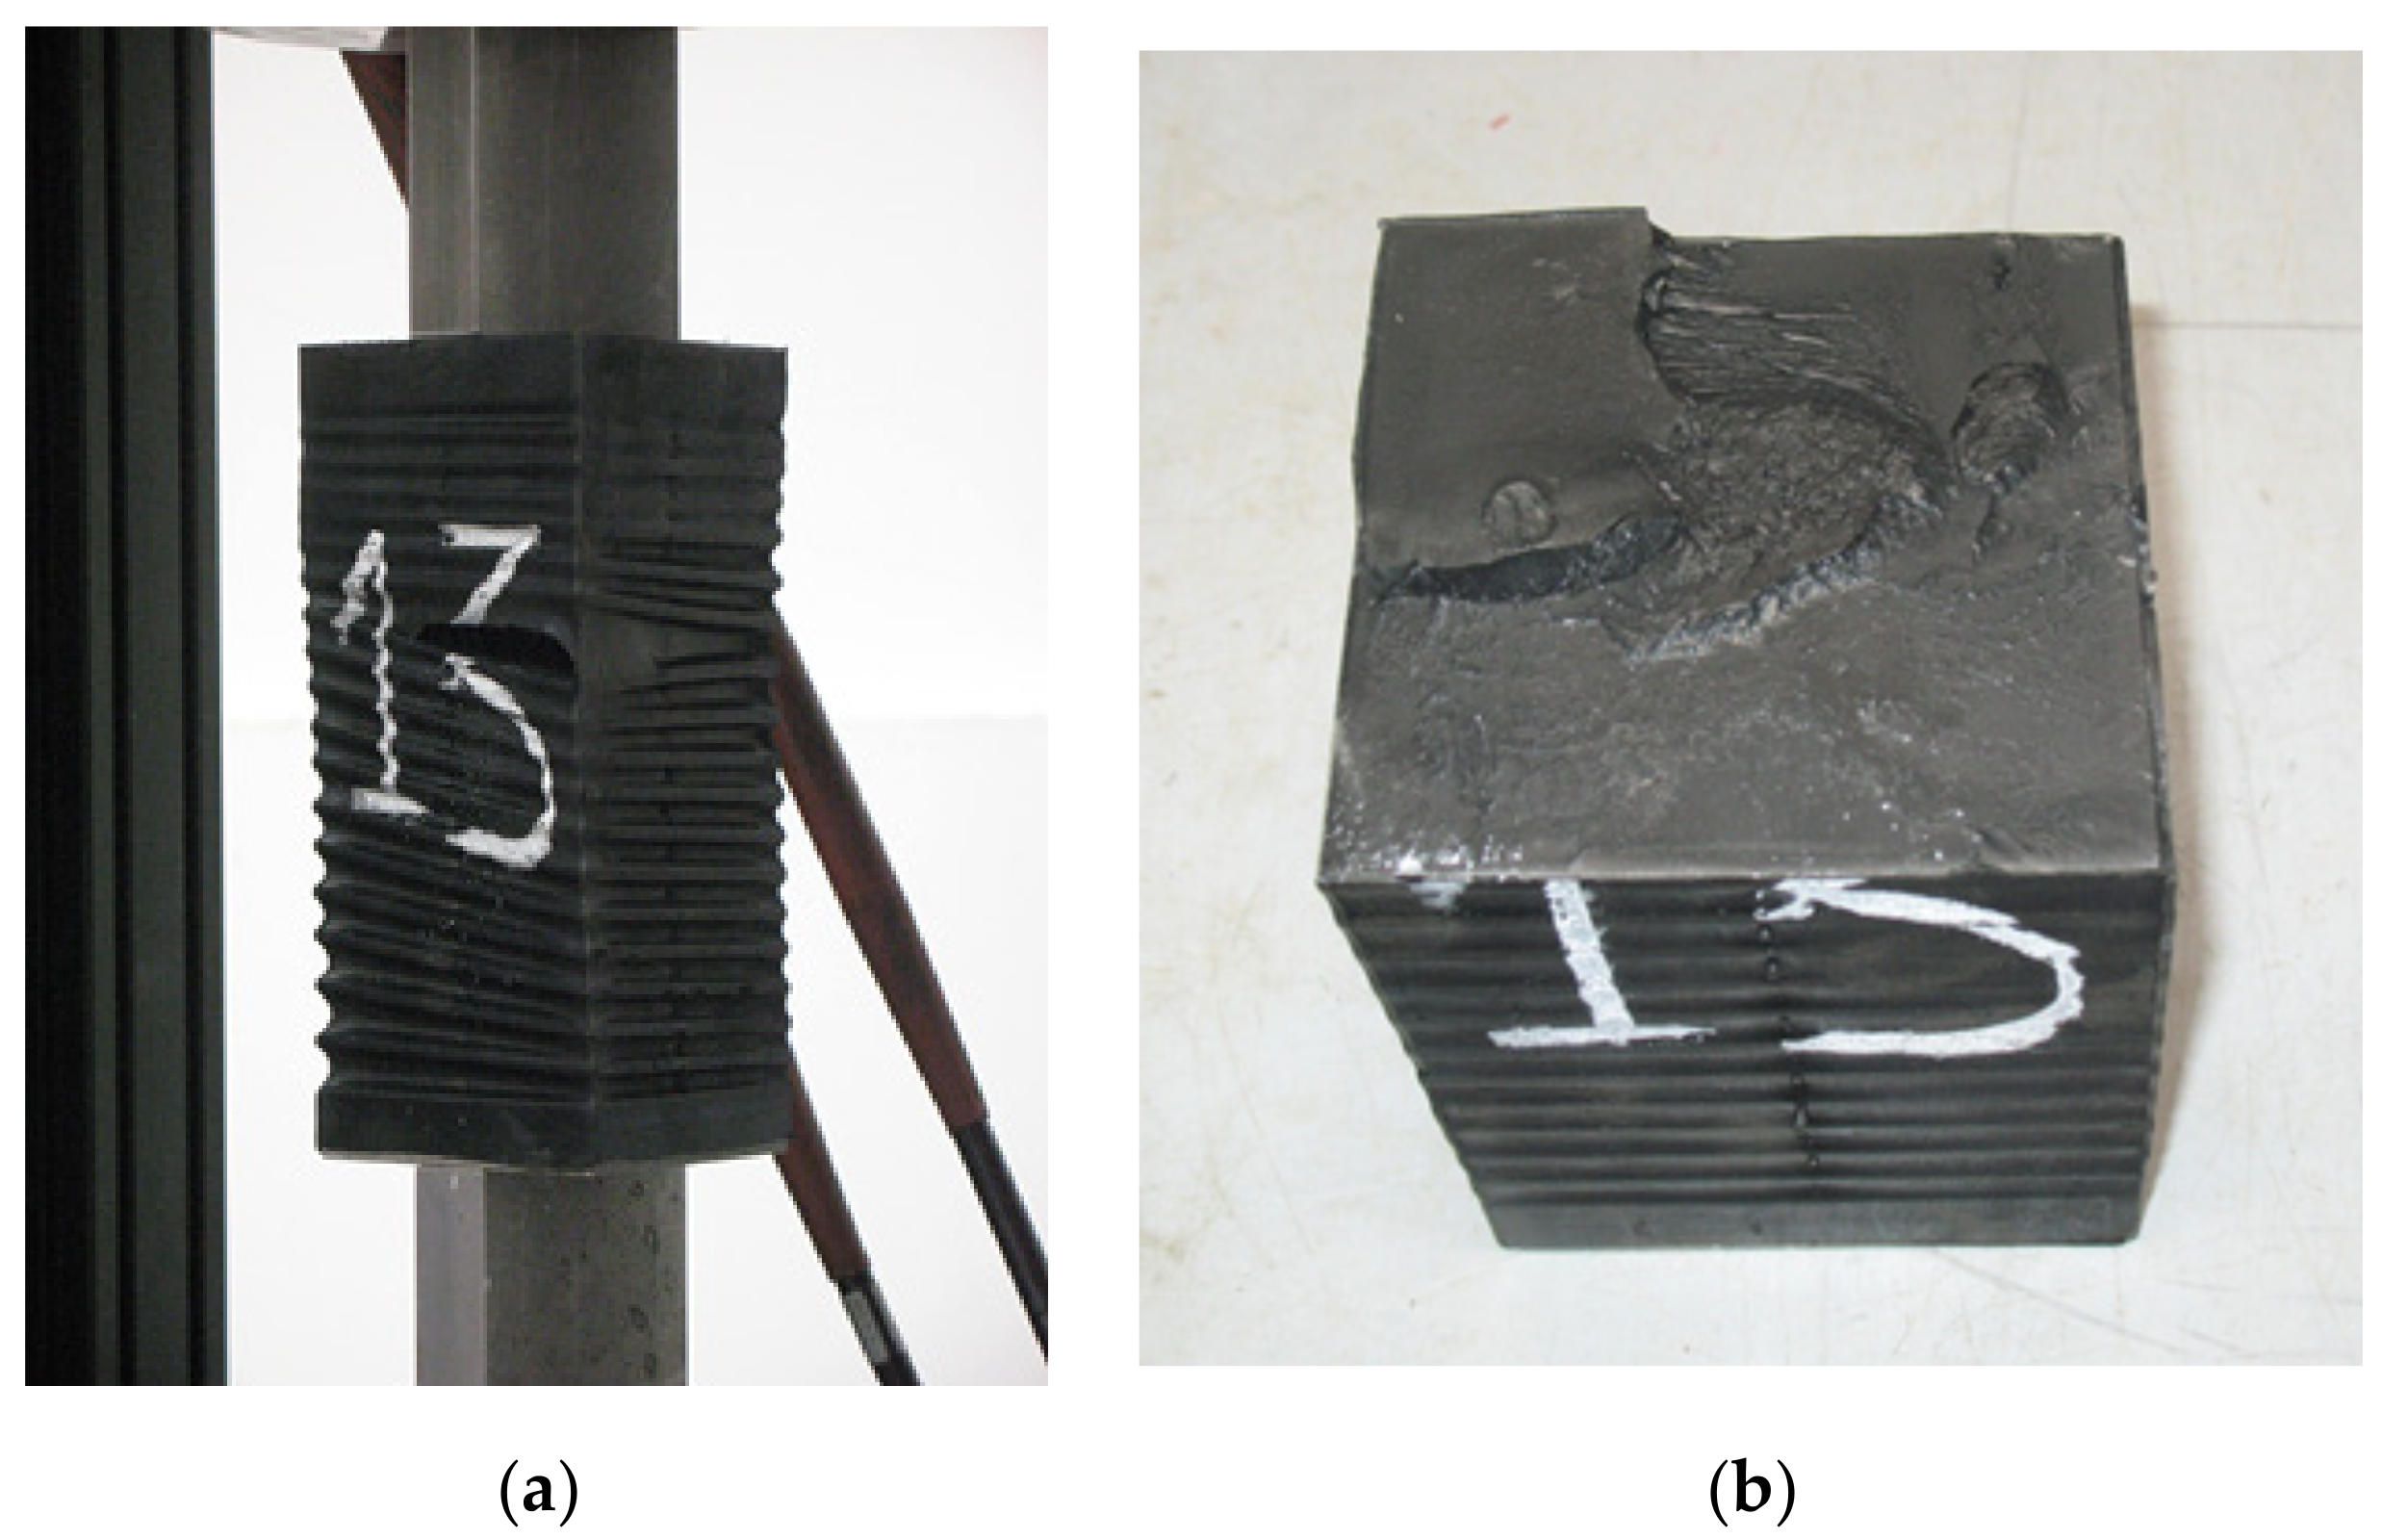
Cohesive failure is when the failure occurs only inside the elastomer due to the tensile stresses. This failure produces a ruptured surface within the elastomer with tear damage, as it can be seen in Figure 4b. In samples that undergo this type of failure, the deformation and strength properties of the elastomer are completely exploited before the occurrence of adhesive failure.
-
Adhesive failure occurs when the failure involves the bonding surface between the steel and elastomer and results in a detachment, without any damage to the elastomer component. It results in the elastomeric layer detaching from the steel layer (Figure 5b) and occurs when the bond strength between the two layers is not sufficient to attain cohesive failure.
-
Mixed failure is manifest by intermediate behaviors (Figure 6b) between the cohesive and adhesive failures described above. In this case, some portions of the sample show rubber detached from steel, and other portions show tear damage.

4. Discussion

Table 2, Table 3, Table 4, Table 5, Table 6 and Table 7 show that the minimum strength of the tested samples were 14.12 kN, 12.60 kN and 29.50 kN for the group of samples with G = 0.4 MPa, G = 0.8 MPa and G = 1.4 MPa, respectively. Since UNI EN 15129 [15] limits the value of tensile stresses acting on elastomeric isolators to 2G, by multiplying 2G by the sample base area (0.1 × 0.1 m2), the isolators should have strengths at least equal to 8 kN, 16 kN and 28 kN, respectively. The experimental results shown in Table 2, Table 3, Table 4, Table 5, Table 6 and Table 7 are reported in Figure 7, Figure 8 and Figure 9, together with the relative minimum tensile strength provided by [15]. It should be noted that the minimum strength for samples of the group with G = 0.8 MPa (12.60 kN, sample 6) is lower than 16 kN. Moreover, the strength of another sample in this group, sample 5 (14.62 kN), is also lower than this value. This suggests that these two samples do not satisfy the standards required by UNI EN 15129, as can also be seen in Figure 8. On the contrary, the strengths of all the other samples are greater than the required values, as can be seen in Figure 7, Figure 8 and Figure 9. This indicates that these samples have satisfactory tensile behavior according to UNI EN 15129. Figure 7 shows several samples with a deformation capacity much greater than that of other specimens. These are samples 15a and 15b, 18a and 18b, which are identical pairs, and the average of their experimental outcomes is reported in the figure. The particular behavior of samples 15a and 15b is discussed in Section 4.4, and that of samples 18a and 18b is discussed in Section 4.6.
As regards Figure 8, the scattered results suggest that further experimentation should be performed to verify the materials’ behavior and to exclude the possibility of a problem during the manufacturing of the samples.
In the following, we compare the tensile test results between groups of samples that differ in only one characteristic, in order to detect the influence of such a characteristic on the adhesion between elastomer and steel layers. It will also enable an understanding of the reason for the low strength of samples 5 and 6.

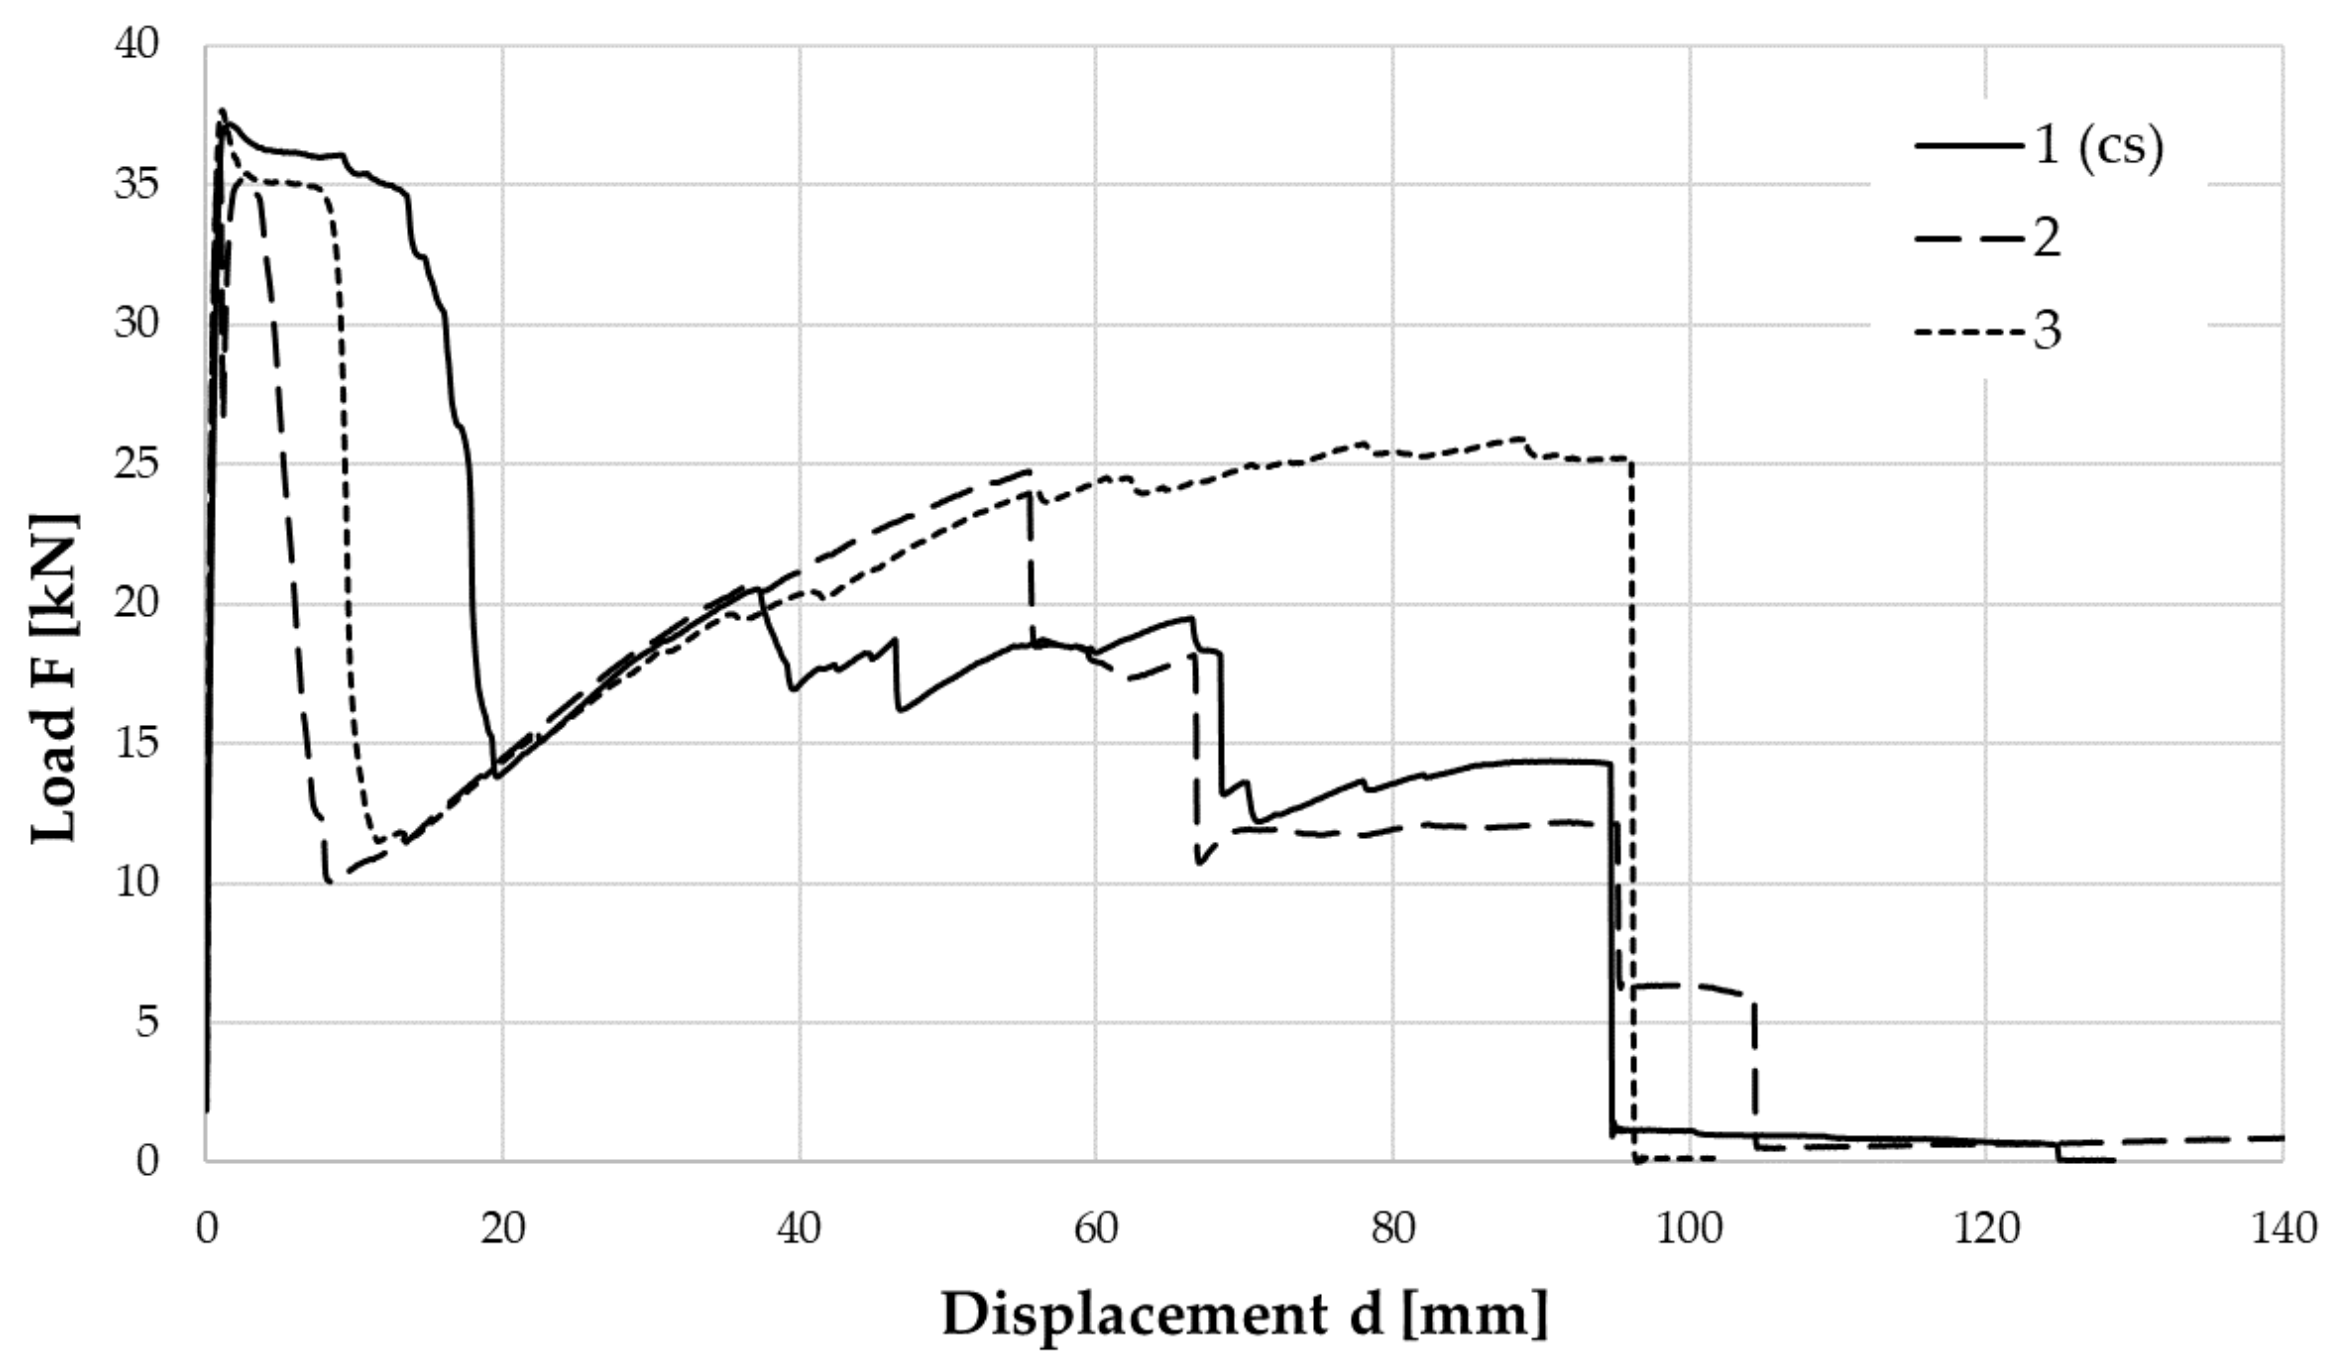
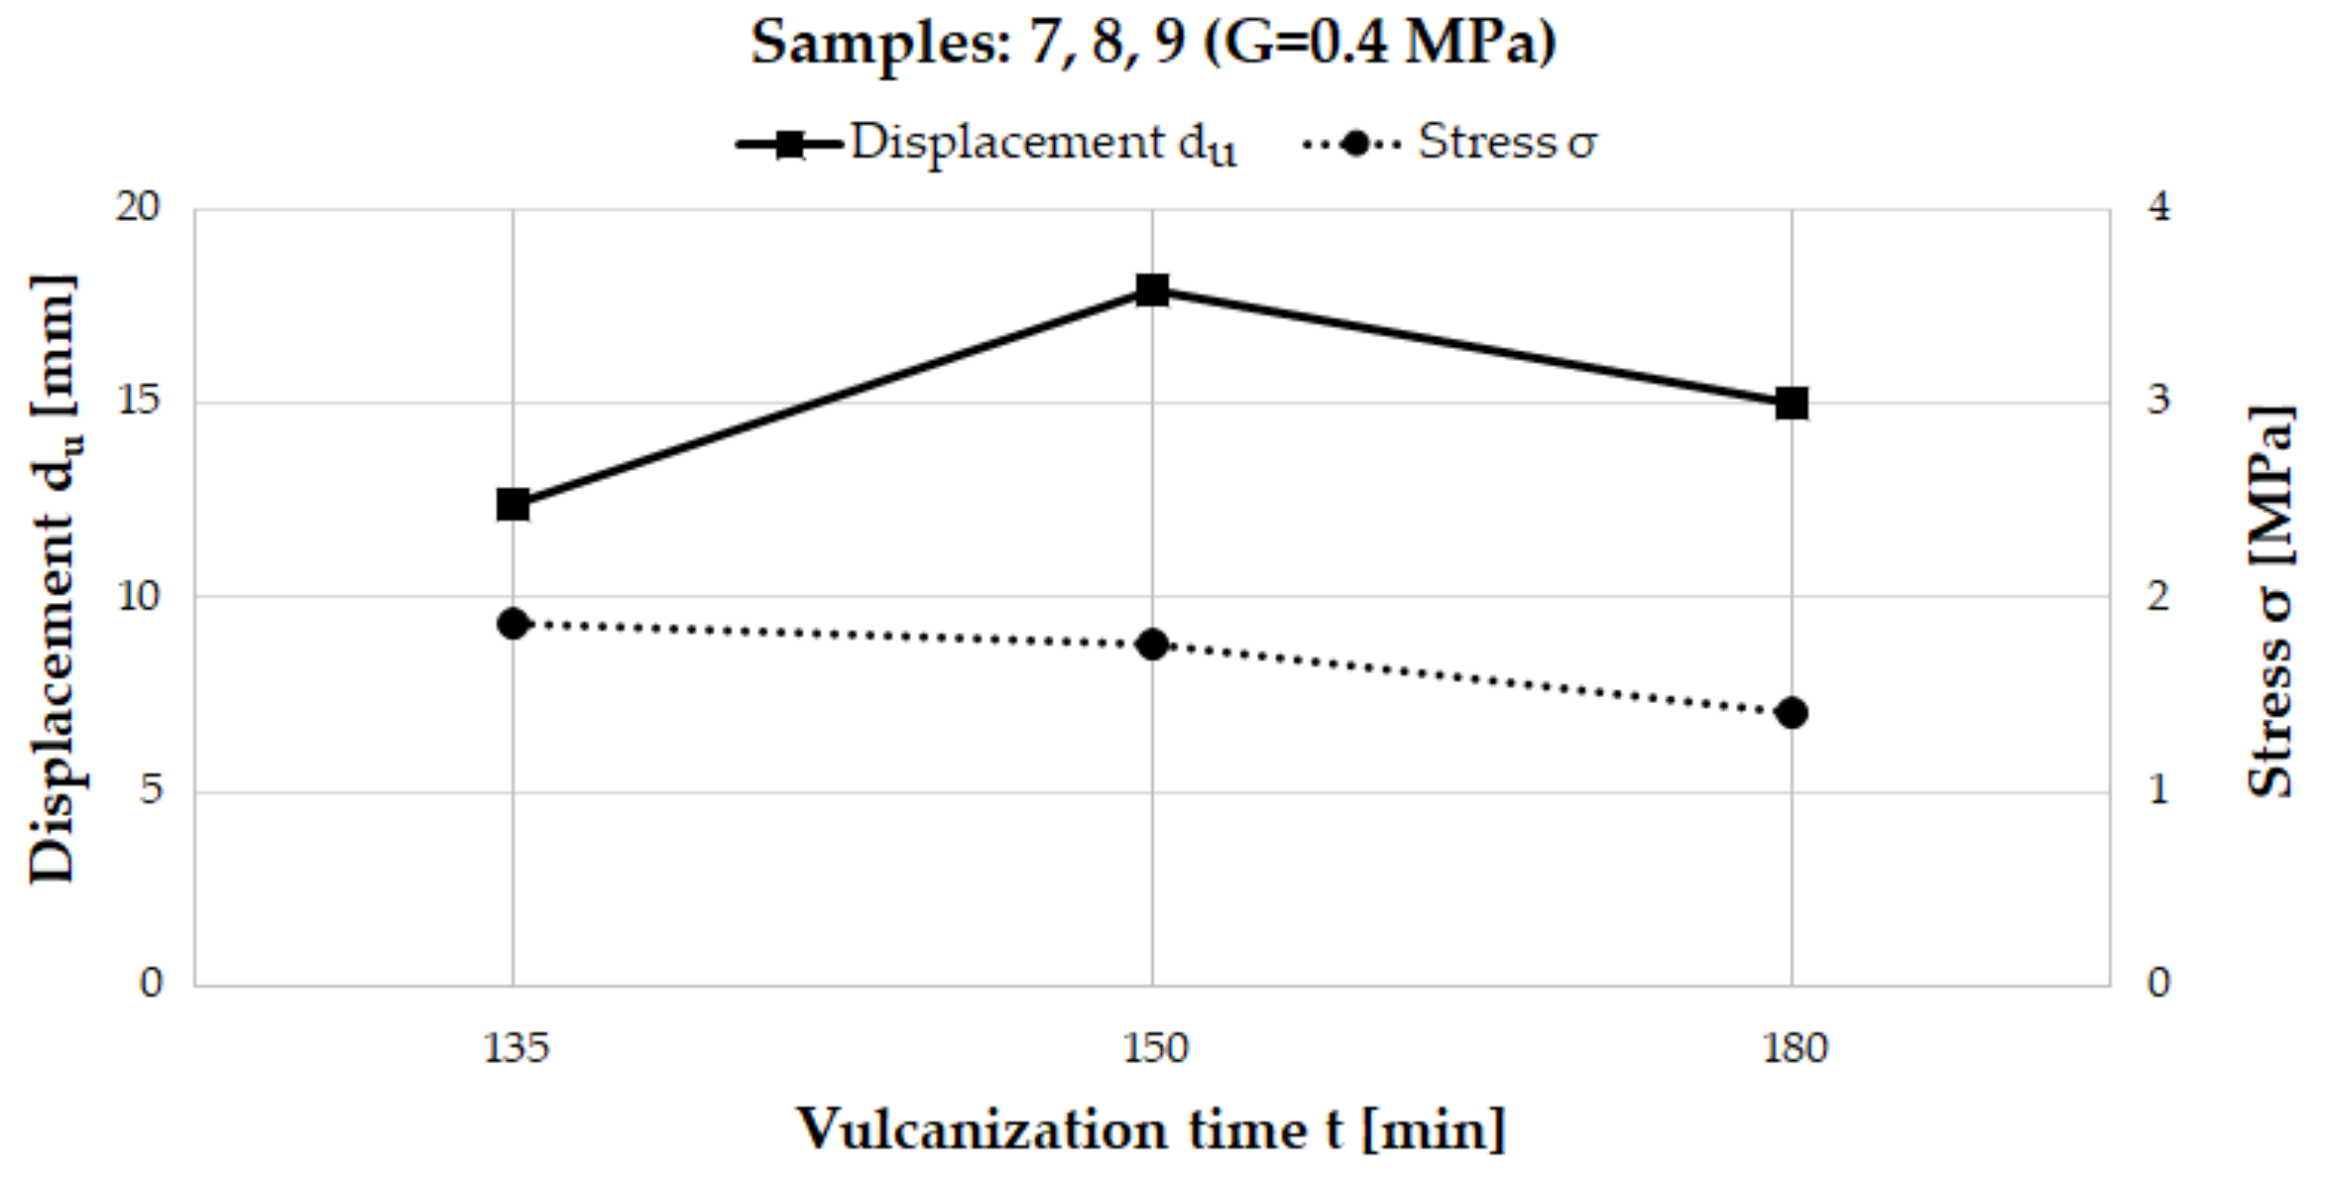
4.1. Influence of Increase in Vulcanization Time

In Figure 10, Figure 11 and Figure 12, the tensile load-displacement response curves of samples according to the variation in vulcanization time are reported for direct comparison. The control sample is identified by the initials (cs) placed next to the specimen number.
These figures are followed by Table 2, where the features of the compared samples are reported together with the experimental results in terms of the maximum recorded force, Fmax, the corresponding displacement, dFmax, and the ultimate displacement, du.
In Figure 13, Figure 14 and Figure 15, the test results in terms of maximum stress and maximum elongation of samples with the same shear modulus G and with different vulcanization times are shown.
From Figure 10, Figure 11, Figure 12, Figure 13, Figure 14 and Figure 15 and Table 2, it can be seen that there was no improvement in the strength of samples with a vulcanization time of 150 and 180 min compared to the control sample, which had a vulcanization time of 135 min. Indeed, in general the strength stayed almost the same or decreased. Regarding the deformation capacity, only the elongations in samples 6, 8 and 9 were greater than that of the control sample, however, the strength decreased in these samples.
The longer vulcanization time probably influences the degradation of elastomer material due to the longer exposure to high temperature. Moreover, the steel layers, being made of metal, can store the heat within them. Since the layers are packed in elastomer, they release the heat to the elastomer over a period of time even longer than the vulcanization time. This may result in degradation of the elastomer. The two described phenomena can explain the observed drop in the maximum load.
The samples that showed cohesive failure are samples 1 and 4, which also performed the best in terms of maximum strength because the strength of the elastomer prevents premature detachment of the elastomer from the reinforcement layers. The other samples show adhesive or mixed failures.
The conclusion regarding the influence of increasing the vulcanization is that this parameter does not improve the adhesion between elastomer and steel layers. On the contrary, for specimens 5 and 6, it reduced their capacity in terms of strength, which decreased to values lower than the strength required by UNI EN 15129 [15] under tensile action, as already pointed out (Figure 8).

4.2. Influence of Sandblasting with Corundum

The tensile load-displacement response curves of samples when different material was used for sandblasting are reported in Figure 16 for direct comparison.
This figure is followed by Table 3, where the features of the compared samples are shown together with the experimental results.
The reinforcements of sample 10 were sandblasted with corundum. As it can be seen from the relevant data in Table 3 and the curves in Figure 16, the performance of this sample was not better than that of the control sample (sample 1), but it was quite similar. Therefore, it can be concluded that the use of corundum sandblasting does not improve the adhesion between elastomer and steel layers.

4.3. Influence of External Covering Layer

In Figure 17, the tensile load-displacement response curves of samples with or without an external covering layer are reported for direct comparison.
This figure is followed by Table 4, where the features of the compared samples are reported together with the experimental results. For the identical samples, the average values of the parameters were calculated and reported below the two samples.
Samples 14a and 14b, which were realized without an external covering layer, show slightly worse behavior in terms of strength compared to the control specimen (sample 1). However, their behavior is worse in terms of ultimate elongation and also the type of failure. Hence, it can be concluded that the absence of the covering layer does not improve the adhesion between the layers, but, instead, worsens it.

4.4. Influence of Elastomer without an Oily Component

In Figure 18, the tensile load-displacement response curves of samples that have or do not have the oily component in their elastomer layers are reported for direct comparison.
This figure is followed by Table 5, where the features of the compared samples are reported together with the experimental results.
Samples 15a and 15b were built using elastomer layers without an oily component. In comparison with samples 14a and 14b (Table 5), which are considered as control samples in this case, samples 15a and 15b show a slightly greater strength, and clearly better ultimate elongation (almost 8 times greater) and type of failure. In fact, as can be seen from Figure 18, the force-displacement curves recorded for samples 15a and 15b are more “ductile” in the sense that these samples are able to maintain the maximum strength for a larger range of displacements, in comparison to samples 14a and 14b. This happens because the failure in samples 15a and 15b occurs on the elastomer side, which can undergo great elongation before breaking, while samples 14a and 14b show a mixed failure. In light of this, it can be concluded that using elastomer layers without oily component. improves the adhesive behavior of the elastomeric isolators, because it helps to avoid adhesive failure. Moreover, the increase in the isolator ductility increases the dissipative capacity of the isolator, which is very important for reducing the seismic action on a building.

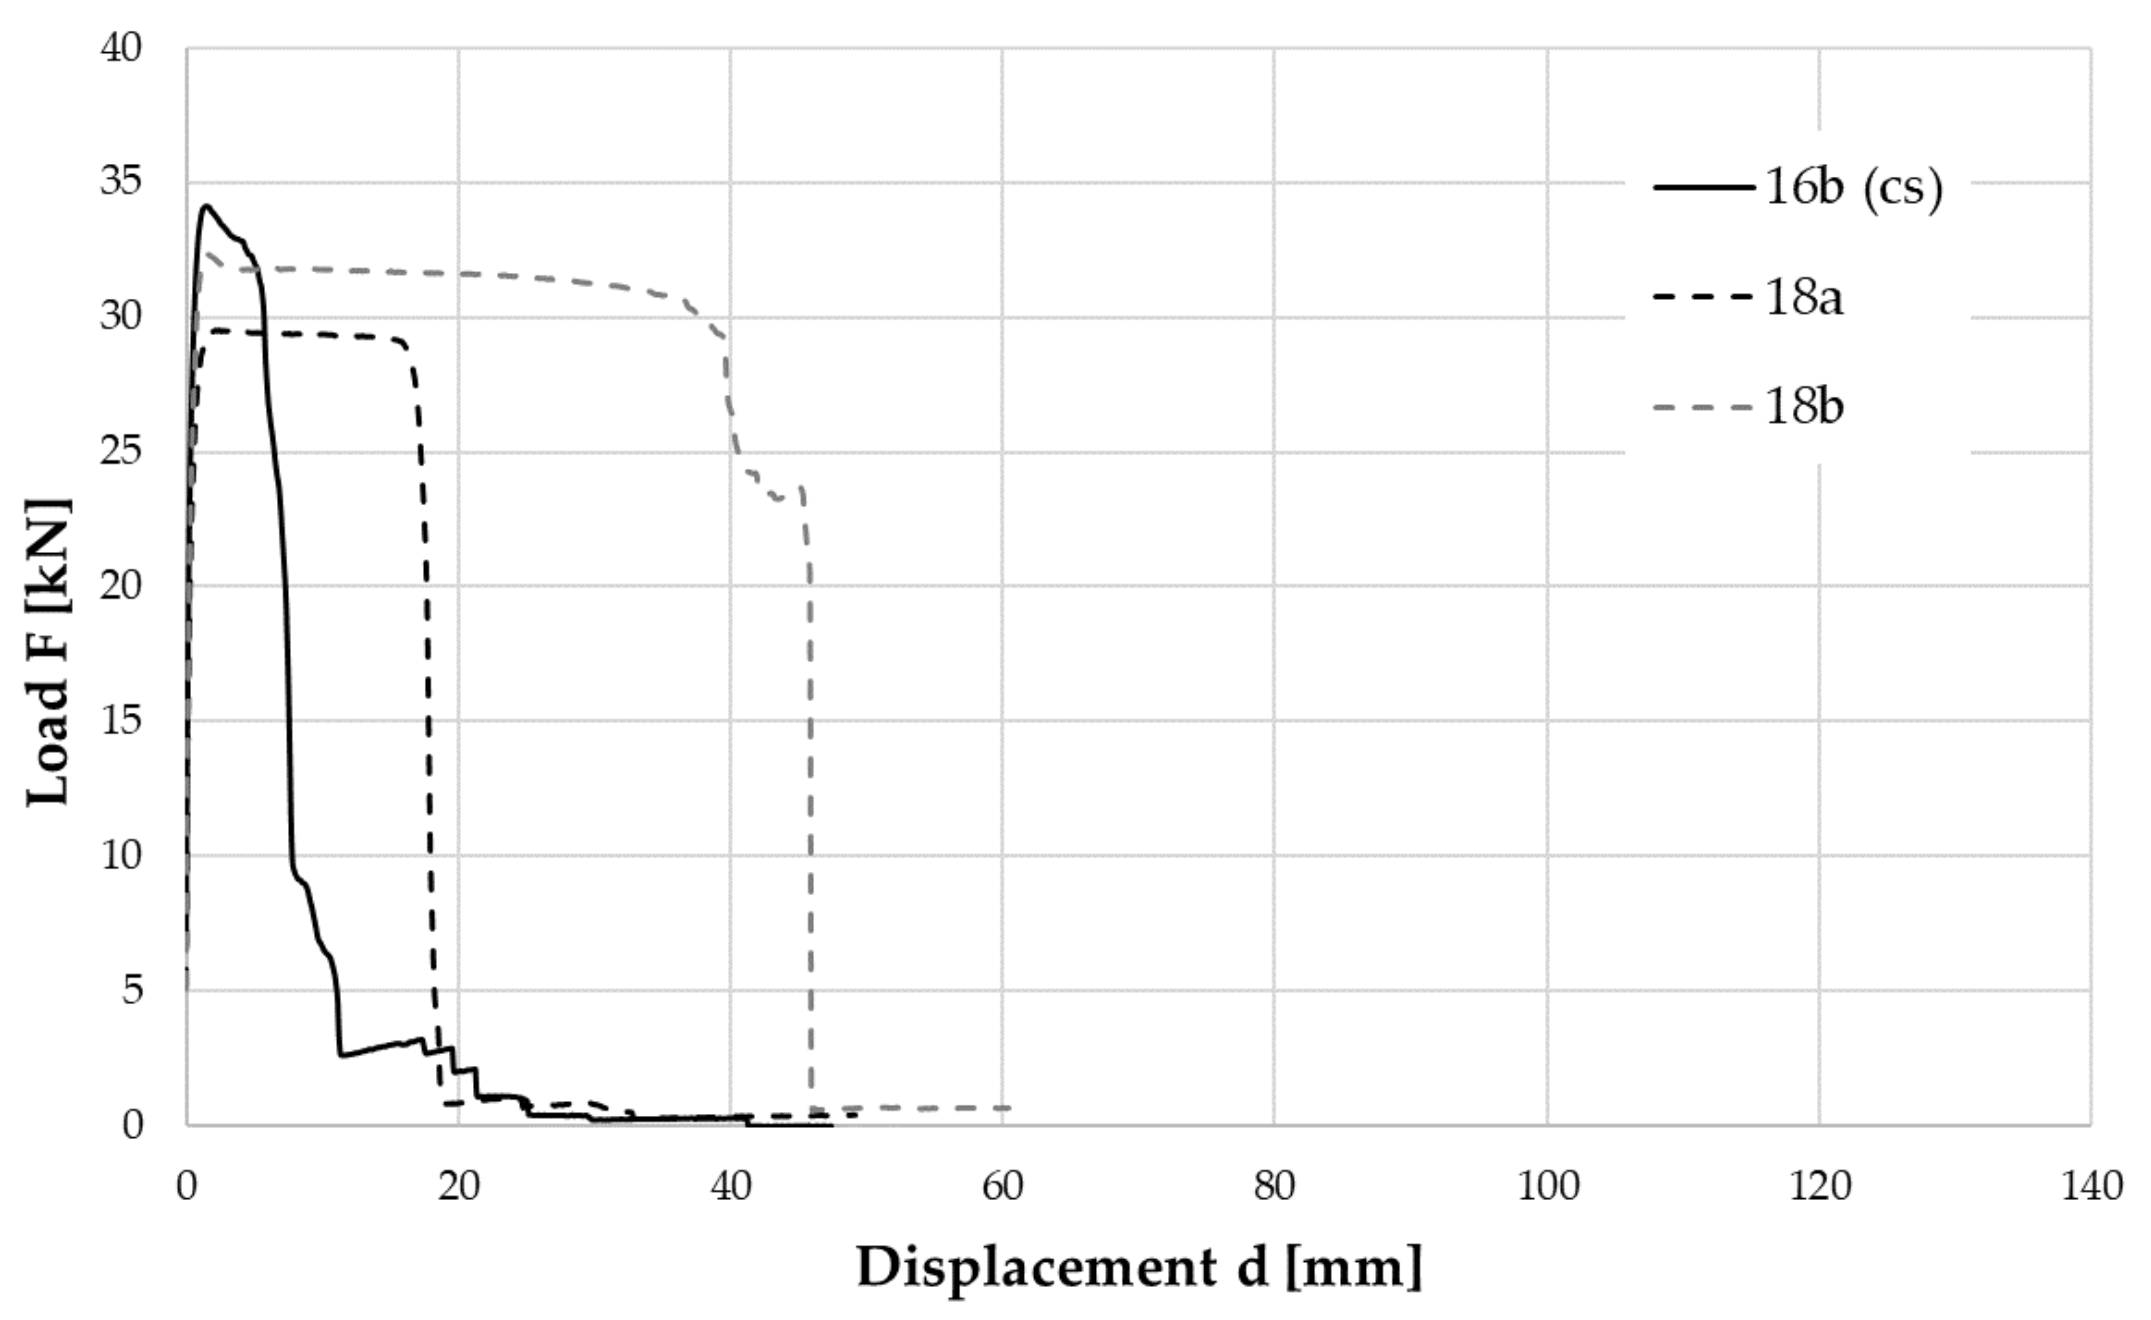
4.5. Influence of Use of Refreshed Elastomer

In Figure 19 and Figure 20, the tensile load-displacement response curves of samples with refreshed elastomer layers are compared to control samples, whose elastomer layers have not been refreshed.
These figures are followed by Table 6, where the features of the compared samples are reported together with the experimental results.
Samples 16a and 16b and 18a and 18b were built using elastomer layers that were refreshed before being put into the mold for vulcanization to eliminate the problem of oily component on the surfaces. Sample 16a was excluded from the study, because its behavior was anomalous.
Sample 16b, in comparison with samples 14a and 14b, which were the control samples in this case, shows almost the same strength, and only a little more ultimate elongation, as it can be seen in Figure 19.
Samples 18a and 18b, in comparison with samples 17a and 17b, which were used as the control samples, show a little less strength on average, but greater elongation capacity (Figure 20).
Hence, since the observations were ambiguous, the only certainty is that the use of refreshed elastomer does not negatively influence the adherence between steel and elastomer and it may improve the elongation capacity, i.e., the ductility, and consequently, the dissipative capacity of the isolator.

4.6. Influence of Bridge Layer

In Figure 21 and Figure 22, the tensile load-displacement response curves of samples with bridge layers are compared to the control samples, which do not have bridge layers.
The features of the compared samples and the relative experimental results can be found in Table 6.
Samples 17a and 17b and 18a and 18b were built using a “bridge layer”, which was put between the mastic and elastomer layer. Compared to the control samples (samples 14a and 14b), samples 17a and 17b show almost the same behavior (Figure 21), both in terms of strength and elongation capacity. Samples 18a and 18b show a little less strength, but greater elongation capacity (Figure 22) in comparison with their control samples (samples 16a and 16b).
Hence, since the observations are ambiguous, the only certainty is that the use of bridge layers does not negatively influence the adherence between steel and elastomer, and it may improve the elongation capacity, i.e., the ductility, and consequently, the dissipative capacity of the isolator.

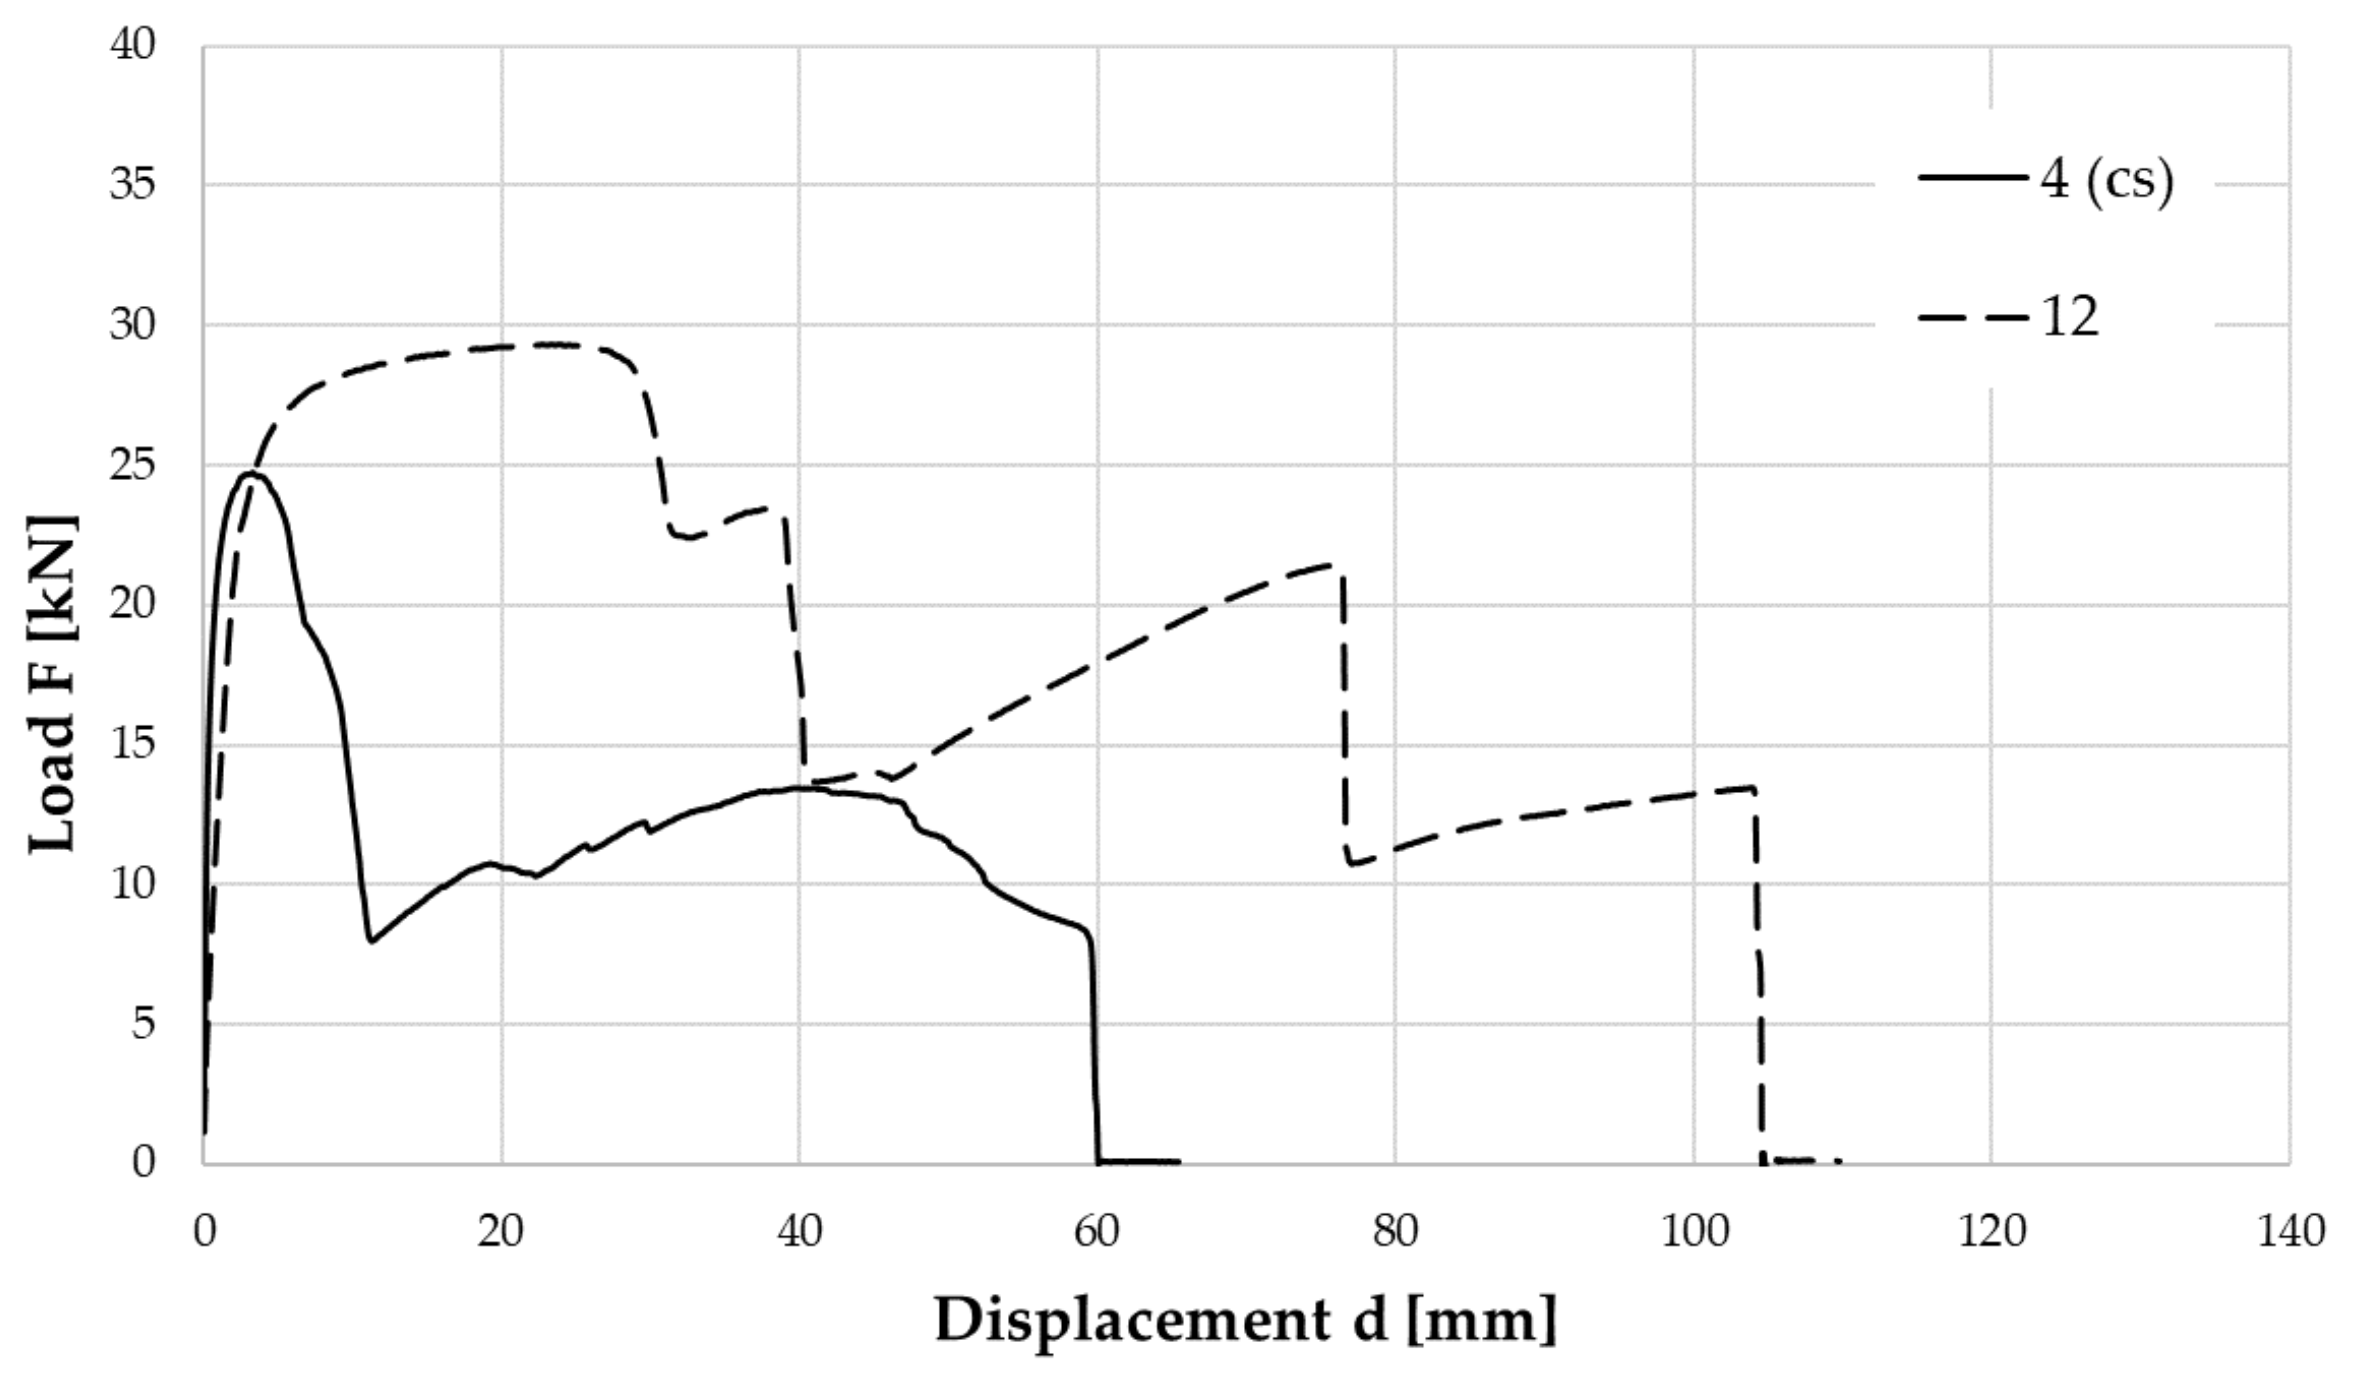
4.7. Influence of Base Rubber Type and Non-Dissipative Behavior of the Elastomer Compound

In Figure 23 and Figure 24, the tensile load-displacement response curves of samples with elastomer layers made of different types of compound are reported for direct comparison.
These figures are followed by Table 7, where the features of the compared samples are reported together with the experimental results.
With regard to the influence of the rubber used to produce the elastomer, sample 12, which was built using a synthetic rubber-based compound was compared to sample 4, which was built using a natural rubber-based compound. As it can be seen in Table 7 and the curves in Figure 23, sample 12 shows greater strength and much greater ultimate elongation compared to sample 4. This happens even if sample 12 undergoes mixed failure, while sample 4 shows cohesive failure.
It can be concluded that synthetic rubber provides the isolator with greater ductility, i.e., dissipative capacity in comparison with natural rubber.
With regard to the influence of the non-dissipative behavior of the elastomer compound, sample 11, which was built using a non-dissipative compound was compared to sample 12, which is the control specimen in this case. As it can be seen from Table 7 and the curves in Figure 24, sample 11 has slightly greater strength, but much less ultimate elongation in comparison to sample 12. Hence, as was expected, the non-dissipative compound gives the isolator lower ductility.

5. Conclusions

The adhesion behavior between elastomer and steel layers of elastomeric isolators was investigated through tensile tests performed on 24 square-based samples. The effects of varying some of the manufacturing processes on the performance of the tested samples was analyzed. On the basis of the obtained experimental results, the authors make the following conclusions:
-
All samples, apart from samples 5 and 6, show satisfactory tensile behavior according to UNI EN 15129, i.e., they have a strength that is greater than 2 G.
-
An increase in vulcanization time does not improve the adhesion between elastomer and steel layers, on the contrary, for samples 5 and 6, it reduced their capacity in terms of strength.
-
The use of corundum in the sandblasting process does not improve or worsen the adhesion between elastomer and steel layers.
-
The absence of an external covering layer does not improve the adhesion between the layers, but instead, it worsens it in terms of the deformation capacity and failure type.
-
Using elastomer layers without an oily component. improves the adhesive behavior of elastomeric isolators, because they are able to avoid adhesive failure. Moreover, it increases the isolator ductility, i.e., its dissipative capacity.
-
The use of refreshed elastomer and the use of bridge layers does not negatively influence the adhesion between steel and elastomer, whereas they may improve the elongation capacity, i.e., the ductility, and consequently, the dissipative capacity of the isolator.
-
Synthetic rubber provides the isolator with greater ductility, i.e., dissipative capacity, in comparison with natural rubber, and greater strength.
-
A non-dissipative compound gives the isolator lower ductility without affecting its strength.

Author Contributions

Conceptualization, M.P.; methodology, M.P.; software, F.P.; investigation, G.F. and M.P.; resources, G.R.; data curation F.P.; writing—original draft preparation, F.P., G.F. and M.P.; writing—review and editing, M.P.; visualization, F.P.; supervision, G.R.; project administration, G.R. All authors have read and agreed to the published version of the manuscript.

Funding

This research received no external funding.

Acknowledgments

ILPEA Industries S.p.A is gratefully acknowledged for providing the samples. The authors also acknowledge engineer Guido Tognan for collaborating in the arrangement of the test setup.

Conflicts of Interest

The authors declare no conflict of interest.

References

  1. Kelly, J.M. Earthquake-Resistant Design with Rubber, 2nd ed.; Springer: London, UK, 1997. [Google Scholar]
  2. Naeim, F.; Kelly, J.M. Design of Seismic Isolated Structures from Theory to Practice; John Wiley & Sons: New York, NY, USA, 1999; 304p. [Google Scholar]
  3. Pauletta, M. Method to design fiber-reinforced elastomeric isolators (U-FREIs) and application. Eng. Struct. 2019, 197, 109366. [Google Scholar] [CrossRef]
  4. Pauletta, M.; Cortesia, A.; Pitacco, I.; Russo, G. A new bi-linear constitutive shear relationship for Unbonded Fiber-Reinforced Elastomeric Isolators (U-FREIs). Comp. Struct. 2017, 168, 725–738. [Google Scholar] [CrossRef]
  5. Russo, G.; Pauletta, M.; Cortesia, A. A Study on Experimental Shear Behavior of Fiber-Reinforced Elastomeric Isolators with Various Fiber Layouts, Elastomers and Aging Conditions. Eng. Struct. 2013, 52, 422–433. [Google Scholar] [CrossRef]
  6. Pauletta, M.; Battocchio, E.; Russo, G. A weathering steel elastomer joint for the connection between new and existing bridges. Eng. Struct. 2015, 105, 264–276. [Google Scholar] [CrossRef]
  7. Russo, G.; Pauletta, M. Sliding instability of fiber-reinforced elastomeric isolators in unbonded applications. Eng. Struct. 2013, 48, 70–80. [Google Scholar] [CrossRef]
  8. Russo, G.; Pauletta, M.; Cortesia, A.; Del Bianco, A. Experimental behavior of carbon fiber reinforced isolators. In Proceedings of the 2008 Seismic Engineering International Conference Commemorating the 1908 Messina and Reggio Calabria Earthquake, Reggio Calabria, Italy, 8–11 July 2008. [Google Scholar]
  9. Pauletta, M.; Cortesia, A.; Russo, G. Roll-out instability of small size fiber-reinforced elastomeric isolators in unbonded applications. Eng. Struct. 2015, 102, 358–368. [Google Scholar] [CrossRef]
  10. Angeli, P.; Russo, G.; Paschini, A. Carbon fiber-reinforced rectangular isolators with compressible elastomer: Analytical solution for compression and bending. Int. J. Solids Struct. 2013, 50, 3519–3527. [Google Scholar] [CrossRef] [Green Version]
  11. Maureira, N.; de la Llera, J.; Oyarzo, C.; Miranda, S. A nonlinear model for multilayered rubber isolators based on a co-rotational formulation. Eng. Struct. 2017, 131, 1–13. [Google Scholar] [CrossRef]
  12. Keda, Y.; Nagahashi, S. Earthquake response characteristics on uplift of multilayered elastomeric isolator of base isolated high-rise building with setback elevation: A study on the effects of simultaneous action input from horizontal and vertical ground motion on earth quake response characteristics of base isolated high-rise building, Part 2. J. Struct. Constr. Eng. 2010, 75, 913–922. [Google Scholar]
  13. Mitoulis, S.A. Uplift of elastomeric bearings in isolated bridges subjected to longitudinal seismic excitations. Struct. Infrastruct. Eng. 2015, 11, 1600–1615. [Google Scholar] [CrossRef]
  14. Tubaldi, E.; Mitoulis, S.A.; Ahmadi, H.; Muhr, A. A parametric study on the axial behaviour of elastomeric isolators in multi-span bridges subjected to horizontal seismic excitations. Bull. Earthq. Eng. 2016, 14, 1285–1310. [Google Scholar] [CrossRef] [Green Version]
  15. European Committee for Standardization. UNI EN 15129-2009. Anti-Seismic Devices; European Committee for Standardization: Brussels, Belgium, 2009. [Google Scholar]
  16. Kalfas, K.N.; Mitoulis, S.A.; Katakalos, K. Numerical study on the response of steel-laminated elastomeric bearings subjected to variable axial loads and development of local tensile stresses. Eng. Struct. 2017, 134, 346–357. [Google Scholar] [CrossRef]
Figure 1. Cylindrical elastomeric isolator under shear strains.
Applsci 10 08063 g001
Figure 2. Geometrical characteristics of samples used for the tensile tests.
Applsci 10 08063 g002
Figure 3. Test setup.
Applsci 10 08063 g003
Figure 4. Sample 11 (a) just before failure; (b) after cohesive failure.
Applsci 10 08063 g004
Figure 5. Sample 7 (a) at failure; (b) after adhesive failure.
Applsci 10 08063 g005
Figure 6. Sample 18b (a) at failure; (b) after mixed failure.
Applsci 10 08063 g006
Figure 7. Test results in terms of displacements and loads for samples with G = 1.4 MPa.
Applsci 10 08063 g007
Figure 8. Test results in terms of displacements and loads for samples with G = 0.8 MPa.
Applsci 10 08063 g008
Figure 9. Test results in terms of displacements and loads for samples with G = 0.4 MPa.
Applsci 10 08063 g009
Figure 10. Tensile load-displacement response curves of samples 1, 2, 3 (G = 1.4 MPa).
Applsci 10 08063 g010
Figure 11. Tensile load-displacement response curves of samples 4, 5, 6 (G = 0.8 MPa).
Applsci 10 08063 g011
Figure 12. Tensile load-displacement response curves of samples 7, 8, 9 (G = 0.4 MPa).
Applsci 10 08063 g012
Figure 13. Test results in terms of displacement and stress for samples 1, 2, 3 (G = 1.4 MPa) for various vulcanization times.
Applsci 10 08063 g013
Figure 14. Test results in terms of displacement and stress for samples 4, 5, 6 (G = 0.8 MPa for various vulcanization times.
Applsci 10 08063 g014
Figure 15. Test results in terms of displacement and stress for samples 7, 8, 9 (G = 0.4 MPa) for various vulcanization times.
Applsci 10 08063 g015
Figure 16. Tensile load-displacement response curves of samples 1 and 10, which were sandblasted with standard grit and corundum, respectively.
Applsci 10 08063 g016
Figure 17. Tensile load-displacement response curves of sample 1 with an external covering layer and samples 14a and 14b without an external covering layer.
Applsci 10 08063 g017
Figure 18. Tensile load-displacement response curves for samples 14a and 14b, with an oily component in the elastomer layers, and samples 15a and 15b, without it.
Applsci 10 08063 g018
Figure 19. Tensile load-displacement response curves for samples 14a and 14b, without refreshed elastomer layers, and sample 16b, with refreshed elastomer layers.
Applsci 10 08063 g019
Figure 20. Tensile load-displacement response curves for samples 17a and 17b, without refreshed elastomer layers, and 18a and 18b, with refreshed elastomer layers.
Applsci 10 08063 g020
Figure 21. Tensile load-displacement response curves for samples 14a and 14b, without bridge layers and 18a and 18b, with bridge layers.
Applsci 10 08063 g021
Figure 22. Tensile load-displacement response curves of sample 16b, without bridge layers, and samples 17a and 17b, with bridge layers.
Applsci 10 08063 g022
Figure 23. Tensile load-displacement response curves of samples 4 and 12, with elastomer layers made by natural and synthetic rubber-based compounds, respectively.
Applsci 10 08063 g023
Figure 24. Tensile load-displacement response curves of samples 11 and 12, with elastomer layers made by non-dissipative and dissipative compounds, respectively.
Applsci 10 08063 g024
Table 1. Characteristics of the samples subjected to uniaxial tensile tests.
SampleElastomerG [MPa]T [min]Features
035,7131.4135-
1 *35,7131.4135-
235,7131.4150-
335,7131.4180-
4 *35,7180.8135-
535,7180.8150-
635,7180.8180-
7 *34,8210.4135-
834,8210.4150-
934,8210.4180-
1035,7131.4135Corundum sandblasting of steel.
113120.8135-
12 *27,3030.8135-
1327,3030.8150-
14a35,7131.4135Without external covering layer.
14b35,7131.4135Without external covering layer.
15a35,7131.4135Without external covering layer, elastomer without oily component.
15b35,7131.4135Without external covering layer, elastomer without oily component.
16a35,7131.4135Without external covering layer, refreshing of elastomer layers.
16b35,7131.4135Without external covering layer, refreshing of elastomer layers.
17a35,7131.4135Without external covering layer, presence of bridge layer.
17b35,7131.4135Without external covering layer, presence of bridge layer.
18a35,7131.4135Without external covering layer, refreshing of elastomer layers,
presence of bridge layer.
18b35,7131.4135Without external covering layer, refreshing of elastomer layers,
presence of bridge layer.
* Control samples.
Table 2. Experimental results for samples 1 to 9.
SampleG [MPa]Vulcanization Time [min] F m a x   [ kN ] d F m a x   [ mm ] d u   [ mm ] Type of Failure
01.413536.781.914.22-
1 (cs)1.413537.181.607.82Cohesive
21.415035.860.903.71Mixed
31.418037.651.102.11Adhesive
4 (cs)0.813524.773.315.12Cohesive
50.815014.621.303.01Adhesive
60.818012.6026.30-Mixed
7 (cs)0.413518.0710.3212.43Adhesive
80.415017.5713.4217.93Mixed
90.418014.128.4315.03Not detected
(cs) = control sample.
Table 3. Experimental results for samples 1 and 10.
SampleSandblasting Material F m a x   [ kN ] d F m a x   [ mm ] d u   [ mm ] Type of Failure
1 (cs)Grit37.181.607.82Cohesive
10Corundum36.321.003.21Mixed
Table 4. Experimental results for samples 1, 14a and 14b.
SampleCovering Layer F m a x   [ kN ] d F m a x   [ mm ] d u   [ mm ] Type of Failure
1 (cs)Yes37.181.607.82Cohesive
14aNo35.341.412.91Mixed
14bNo33.421.713.12Mixed
Average 14a and 14b34.381.563.02
Table 5. Experimental results for samples 14a, 14b, 15a and 15b.
SampleOily Component F m a x   [ kN ] d F m a x   [ mm ] d u   [ mm ] Type of Failure
14a (cs)Yes35.341.412.91Mixed
14b (cs)Yes33.421.713.12Mixed
Average 14a and 14b34.381.563.02
15aNo37.221.2030.45Cohesive
15bNo35.231.2817.80Cohesive
Average 15a and 15b36.231.2424.13
Table 6. Experimental results for samples 14a, 14b, 16a, 16b, 17a, 17b, and 17a, 16b.
SampleRefreshed ElastomerBridge Layer F m a x   [ kN ] d F m a x   [ mm ] d u   [ mm ] Type of Failure
14a (cs)NoNo35.341.412.91Mixed
14b (cs)NoNo33.421.713.12Mixed
Average 14a and 14b34.381.563.02
16aYesNo34.29123.34123.61Abnormal
16bYesNo34.161.514.52Adhesive
17a (cs)NoYes34.773.312.32Adhesive
17b (cs)NoYes32.832.614.91Adhesive
Average 17a and 17b33.802.963.62
18aYesYes29.502.4116.63Mixed
18bYesYes32.331.6136.46Cohesive
Average 18a and 18b30.922.0126.55
Table 7. Experimental results for samples 4, 11 and 12.
SampleRubber TypeCompound Type F m a x   [ kN ] d F m a x   [ mm ] d u   [ mm ] Type of Failure
4 (cs for 12)natural-24.773.315.12Cohesive
11-non-dissipative30.387.6211.03Cohesive
12 (cs for 11)syntheticdissipative29.3423.3429.25Mixed
Publisher’s Note: MDPI stays neutral with regard to jurisdictional claims in published maps and institutional affiliations.

