Featured Application
The methodology proposed herein can be used for structural analysis in the field of structural integrity evaluation and maintenance, since it has fewer spatiotemporal limitations.
Abstract
This paper presents an experiment-based synthetic structural analysis method that combines digital image processing (DIP) and the particle difference method (PDM), which is a strong form-based meshfree method. The proposed method uses images to determine the displacement of deformed specimens, interpolates the displacement onto nodes of the PDM model without meshes or grids, and calculates the kinematic variables. Furthermore, the pixel extraction method for the target area and the method of setting the region of interest for expediting DIP were used during the synthetic structural analysis. A method for effectively expanding the number of tracking points and an improved method for labeling tracking points are also presented. To verify the performance of the analysis, the experimental and numerical analysis results of a three-point bending test on a rubber beam were compared in terms of various mechanical variables as well as with the PDM results of a simulated bending test. It was found that tracking point expansion and adjusting the radius of the domain of influence are advantageous for performing an accurate calculation without losing computational efficiency. It was demonstrated that the synthetic structural analysis effectively overcomes the shortcomings of the conventional experiments and the limitations of pure simulations.
1. Introduction
In the process of managing the life cycle of an existing structure or developing a new type of structure, it is important to directly measure the kinetic and kinematic variables such as stress and strain of the structural member, or accurately estimate them through an analytical method. In practice, the deformation or strain of a specimen is directly obtained via linear variable differential transformers (LVDT) or strain gauges, or using numerical simulations such as meshfree methods [1,2]. Since obtaining all the kinematic variables at the desired location through direct measurement is uneconomical and time-intensive, it is more efficient to measure a few variables directly and use them to numerically estimate the other variables. Recently, an alternative method for deriving the kinematic variables of multiple test specimens or large-scale experiments was developed by combining a mechanical test and a numerical simulation method [3]. In particular, with the advancements in computing performance and the reduction of computational cost, methods to supplement or partially replace mechanical tests using digital image processing (DIP) have been studied [4,5,6,7]. In the field of structural experiments using DIP, digital images can be analyzed and processed to obtain useful information related to structural analysis. Moreover, the experimental limitations of DIP such as the number or location of measurement points can be overcome by combining DIP with numerical analysis methods. This combination allows, for example, the extraction of the required number of mechanical variables from a desired location using a limited amount of direct measurement information when the number or scale of the target structure is large.
Warren et al. [8] demonstrated the usefulness of image-based methods by comparing the vibration measurement results of the finite element method (FEM) with those of digital image correlation, dynamic photogrammetry, laser, and acceleration measurement equipment. This technique is used to evaluate the condition of structures such as in mechanical tests or structural health monitoring, where crack detection is important [9,10]. Digital image correlation estimates the deformation of a specimen by tracking a specific point by analyzing the correlation of the speckle patterns in the images obtained before and after the deformation of the specimen, based on mechanical tests mainly used for small specimens. Fayyad and Lees [11] used this technique to measure the mode I crack propagation in reinforced concrete structures. Choi et al. [12] used this technique to measure the deflection of aluminum specimens. Ko et al. [13] suggested a technology to measure the displacement and vibration of rock columns by using digital image correlation and analyzed its applicability through field tests. Similarly, digital image correlation is applied to various material technologies; however, the accuracy of this technique varies with the speckle pattern of the images used for the correlation analysis [14]. The conventional Newton–Raphson algorithm is difficult to apply in digital image correlation if a large deformation or rotation is present. This technique is time-consuming because it requires numerous calculations based on the reconstruction of repetitive subsets [15]. While DIC has high accuracy, an additional algorithm such as the Newton–Raphson method is required for efficient analysis. This algorithm needs complicated analysis due to differential calculation and requires high computation cost. Therefore, in this study, we applied the DIP method to track the displacement of a target attached to a specimen directly from the image. This eliminates the need for a speckle pattern or a subset for displacement tracking. In this study, a simple algorithm that directly tracks the target was proposed using DIP.
However, to obtain the kinematic variables for evaluating the condition of a structure from an image that only provides information on simple shape change or displacement, a process to combine the results (displacement information) with numerical analysis is required. In the past, the method connecting the results to the FEM was mainly used to reproduce the value of a kinematic variable using the displacement information acquired through direct measurement or from an image of any location [16,17,18]. Huang et al. [19] improved the computational efficiency and accuracy of the existing digital image correlation technique by combining it with FEM. Hosdez et al. [20] updated the boundary conditions at the crack tip of a crack propagation in a FEM model by combining the displacement measured by the digital image correlation and FEM. In general, to combine the values measured from digital images using numerical analysis, data are processed by aligning the measurement points of the experiment and the joints of a mesh, or by using the changes in images obtained at certain time intervals. The mesh-dependent FEM possesses the characteristic of interpolation or extrapolation and extracts the strain or stress value at the quadrature point using an element-based approximation function. However, the analysis becomes more difficult in the case of complex target structure shapes or discontinuities such as cracks, because the mesh required for the simulation must be reconfigured at every analysis step.
The element-free Galerkin method (EFGM) [21], which does not use a mesh, can avoid the constraints of FEM or the limitation of a mesh. Although the EFGM is a meshless method, its application remains limited because an integration cell similar to a mesh is required for calculating the integral describing the governing equation, which is slightly complicated [22,23,24]. In addition, it is necessary to derive the derivative approximation function for calculating kinematic variables; however, the differential calculation for the EFGM approximation function is slightly complex, making it improbable to completely alleviate the difficulties faced in applying the FEM.
On the other hand, the strong form-based meshfree method can be used even when the location of the tracking point (TP) that acquires the displacement information through DIP is irregular, because this method simplifies the calculation of the kinematic variables and differentials by using nodes only. Mesh-free-based numerical analysis methods have been studied in various domains to improve the mesh’s constraints [25,26,27,28]. The particle difference method (PDM)—a meshfree method that uses a high-speed derivative approximation based on strong form or collocation—makes the computation of displacement, strain, and stress fast and free because of its simple high-dimensional differential computations. Moreover, because this method only uses nodes and not meshes, it does not encounter problems similar to those faced by the FEM during this type of computation, even if the geometric shape used in the analysis varies over time [29,30,31,32]. Furthermore, a method to regenerate stress fields and predict crack occurrence patterns through displacement measurement and meshfree approximation using images has been proposed. However, improving techniques such as the TP extension is challenging, because the applied DIP technique is difficult to scale, and the integration with the meshfree method is still performed by simply adopting the approximation function [3]. However, it is easy to calculate the strain or stress by using the geometric description in the framework of the strong form-based meshfree method. The derivative approximation can be simplified by combining with the DIP technique, thereby quickly and accurately extracting various kinematic variables required for evaluating structural conditions because the strong form-based PDM is “truly” a meshfree method. In addition, the PDM can maintain the accuracy and consistency of the simulation even if the TP locations change excessively or increase in number.
This paper presents a synthetic structural analysis method that can calculate the kinematic parameters of a structure by combining the DIP and PDM. We suggest two methods to improve the accuracy of the DIP: algorithms for the morphology operation and expanding target points. The noise around the target was reduced through morphology operation, and the convergence of accuracy was verified according to the extended TP. In addition, a method to improve the labeling error of the target was applied. Furthermore, we proposed a method to calculate the kinematic variables of a specimen undergoing deformation by combining the DIP and PDM, and a method to arrange the additional nodes and correct the radius of the influence domain to improve the accuracy of the derivative approximation when applying the PDM. Finally, we compared the synthetic structural analysis results with the actual experimental results obtained for a rubber beam specimen. Additionally, we compared these results with those of a numerical simulation by assuming the material to be elastic and only used the PDM to verify the accuracy and efficiency of the developed method. Note that the reason for selecting the rubber material for the three-point bending test was not to consider the nonlinear behavior of the material, but to present a solution to the labeling recognition error of the TP that could occur because of the excessive deformation of the specimen during the DIP.
2. Digital Image Processing for Tracking Target Point Displacement
This section describes the process of applying the DIP algorithm using a digital image set to track the target point displacement of the specimen. In this study, DIP was used to derive the TP displacement by recognizing the target attached to the specimen and tracking the change in its location from the image acquired at regular time intervals.
Figure 1 shows the method of measuring the force, displacement, and strain as well as the image acquisition process for the actual experiments conducted in this study. During the three-point bending test, the strain value measured by a strain gauge was collected through a datalogger, and the force applied to the specimen and the deflection value at the center of the specimen were measured using a load tester and stored in the system. The image sets for DIP were acquired at regular intervals using a digital single lens reflex (DSLR) camera, from the time of loading to the time of reaching the target load, and were stored in a separate database.
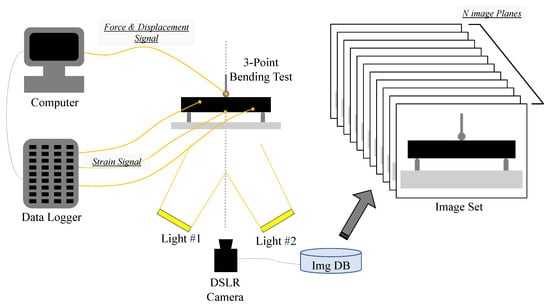
Figure 1.
Configuration of the camera image-based measurement and digital image processing experiment.
Figure 2 illustrates the process of displacement tracking of the target using the DIP proposed in this study, along with a separate pre-process conducted to improve the data processing speed and a DIP tool tracking the displacement of the target. In the pre-process, the region of interest (ROI) was set, in which the displacement of the target on each image included in the image set was tracked. It is possible to remove the pixels containing unnecessary information and reduce the time required to analyze the image by trimming the redundant areas based on the ROI and reducing the image size to be analyzed. In DIP, processes such as target classification, noise removal, and target labeling are performed to measure the displacement of the target using the image whose size was reduced.
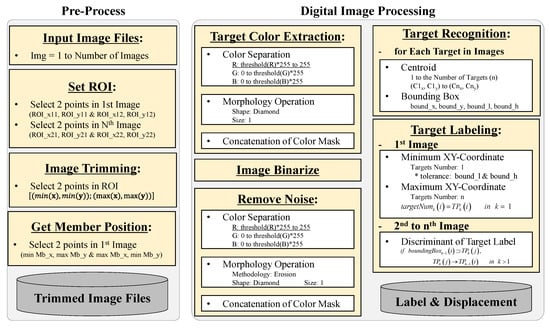
Figure 2.
Digital image processing (DIP) algorithm for tracking point (TP) displacement tracking.
2.1. Pre-Process for Digital Image Processing (DIP)
An image consists of a set of pixels, and image analysis uses unique information such as the color intensity of each pixel. The volume of data increases with the increase in the number of unused pixels in the image analysis; therefore, more resources are required to process the additional data, resulting in reduced device efficiency. Depending on the shooting environment and experimental configuration, an ROI can be set and analyzed to improve the efficiency because the original images stored for displacement tracking through DIP include areas that are unnecessary for the analysis.
In this study, the first image with the least deformation and the last image with the largest deformation among the set of images acquired at regular intervals were used to set the ROI (Figure 3). In other words, after demarcating the area to be analyzed in each of the first and last images by a rectangle, the ROI was created by combining the two rectangles. The ROI that included both rectangles was generated by combining the minimum and maximum values of the horizontal (x-direction) and vertical (y-direction) coordinates from the four-pixel coordinates of the two rectangles generated from the two images.
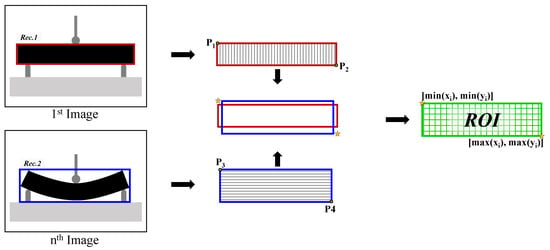
Figure 3.
ROI generated by combining two rectangles.
In Figure 3, Rectangle 1 and Rectangle 2 represent the rectangles used to demarcate the area to be analyzed in the first and the last images, respectively; and are the two coordinates of Rectangle 1; and and are the two coordinates of Rectangle 2. The collected and vectorized components can be expressed as , . Equation (1) gives the range of ROI expressed by the , vector.
In contrast to the physical coordinate system, the value of the Y component of the pixel coordinate system increased downward from the top of the image. The image was trimmed to remove the external pixels excluded in the ROI by applying the generated ROI to the image set. Through this process, the original image with 6720 × 4480 × 3 pixels and a data capacity of 6150 kb was reduced to 4700 × 1621 × 1 pixels and 141 kb, respectively, and the image size and data capacity were reduced by approximately 86.72% and 97.71%, respectively.
After the analysis, because the image was composed of pixels, it was converted into a physical unit by using a scale factor. The scale factor was determined using the pixel size and the physical dimensions of a specific object in the image. In this study, the scale factor was calculated using the ratio between the pixel sizes of the two points constituting Rectangle 1 of the first image, which was used when setting the ROI, and the size of the specimen as follows:
where D denotes the horizontal length of the actual specimen; d denotes the pixel size at the same location; X is a physical coordinate; and x is the pixel coordinate.
2.2. Displacement Tracking of the Tracking Point (TP) Using DIP
The images acquired using a digital camera contained a set of pixels composed of a color model; in this study, an RGB color model was used. The color model expressed an object through a combination of three-color channels, with each channel having a total color intensity of 256 levels from 0 to 255. Although the use of the RGB color model presents the advantage of expressing 256 × 256 × 256 = 16,777,216 colors, it is inefficient from the perspective of data analysis because it is high-dimensional and requires a large amount of computation. For effective image analysis, it is common to reduce the data size by transforming a three-dimensional (3D) color image obtained by a DSLR camera into a two-dimensional (2D) grayscale image or a binary image expressed.
In this study, to reduce the data size, only the remaining ROI target area, which was generated in the pre-process after removing the parts other than the value similar to the color intensity inside the target, was transformed into a binary image (Figure 4). In this process, the second data-reduction process is initiated, and the pixel size constituting the target area is 21,870 × 2 = 43,740, which removes 99% of the original image and 99% of the ROI image, thus greatly improving the DIP calculation efficiency.

Figure 4.
Target extraction procedure from ROI.
The pixels of the initially acquired image contain irregular noise because of the influence of illumination or light dispersion. This noise interferes with the image analysis. To remove this noise, the erosion operation of morphological image processing, which reduces the image size by removing the outer pixels of the pixel set, was applied. This operation corrects the image by sequentially comparing the structuring element (SE) composed of a 3 × 3 matrix with the target image, and selecting the pixel containing all nine elements of SE. The erosion operation can be expressed as follows:
where I represents the image to which the erosion operation is applied; S denotes the set of pixels in which the structuring elements applied to the entire image are combined; and s denotes the structuring element composed of a 3 × 3 matrix.
Later, the strain and stress caused by the loading of the specimen are calculated by applying the displacement of the TP obtained through DIP in the framework of the PDM. The larger the number of TP displacements, the higher the calculation accuracy. In this study, two target tracking methods were proposed to compare their accuracies based on the number of TPs provided by the combination of DIP and PDM. Figure 5a shows the method of tracking only one point of the centroid of the target (Case 1), and Figure 5b illustrates the method of tracking both line segments connecting the centroid of the target to the centroid of the surrounding target and the point where the boundary of the original target intersects (Case 2). In Case 2, the number of intersection points generated according to the arrangement of the surrounding targets was 3, 5, and 8.
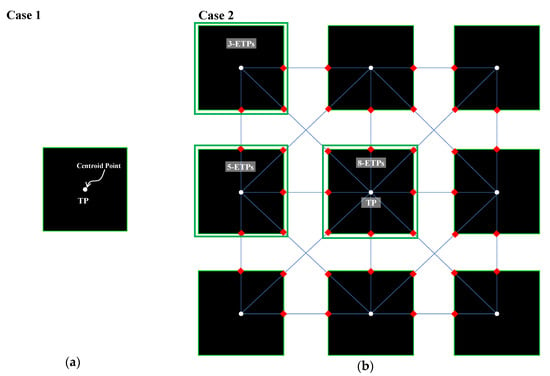
Figure 5.
Two target tracking methods: (a) TP, (b) expanded TPs.
In this study, a rectangular target that exhibited similar behavior as the specimen object, with which it was easier to perform additional analyses using vertices than other types, and that could perform the effect analysis of the rotation, was used. Rectangle targets change with the deformation of the part and have vertices, which are excellent for easily increasing the tracking points. In addition, the centroid of the pixels constituting the target was named the TP, and the intersection points of the line that connects this TP with the centroid of the neighboring target and the outline of the target were named as the expanded tracking point (ETP). Consequently, Case 1 only tracks one TP, whereas Case 2 tracks both the TP and the ETP. The equation for finding the coordinates of the k-th point constituting the ETP is as follows:
where and are the coordinates of each TP and each ETP, respectively, and denotes the coordinates of the k-th point included in vector B constituting the boundary points of the target. In this study, only a one-layer target space surrounding the reference target was considered to generate the ETP; to this end, the analysis area was limited by inputting the distance information of the points constituting the TP set.
To track the deformation of the specimen during loading, the displacement change or history of the TPs extracted from the images acquired at regular intervals must be tracked. To this end, the TPs were labeled by aligning the coordinates of the X- and Y-axes in order, and the serial number was assigned automatically. However, a few images yielded errors because the initial label could not be maintained because of the excessive movement of the TP caused by the relatively large deformation of the specimen. For example, target no. 25 of image no. 2 was mislabeled as no. 27 of image no. 3, as shown in Figure 6. In this case, it was difficult to apply the automatic labeling method, because the error occurred in the TP history, disallowing the displacement tracking.

Figure 6.
TP label mismatch.
In this study, the label of the TP remained constant, even if it exhibited excessive movement because of the relatively large deformation of the specimen. To prevent the TP labeling errors, the bounding box, which is a set of pixels comprising the border of the TP in the previous image, was synchronized with the TP at the same position in the current image when labeling the TP. In the improved labeling method, the initial image of the image set uses the number of TPs generated according to Equation (5). From the second image to the last, the TP of the current image included in the bounding box of the previous image TP was found, and it inherited the label of TPs of the previous image, as shown in Equation (6).
where k denotes the number of images included in the image set; i denotes the target label automatically generated from the first image or the target label of the previous image; and j denotes the target label automatically extracted from the current image.
Consequently, as TP no. 27 of image no. 3 is inside the bounding box of TP no. 25 of image no. 2, as shown on the right of Figure 6, no. 27, which was assigned automatically, was changed to no. 25 based on the process described in Equations (5) and (6). Through this process, the existing labeling error was improved, and the overall result is shown in Figure 7.

Figure 7.
Correction of TP label mismatching.
3. Calculation of Mechanical Variables Using a Strong Form-Based Meshfree Method
3.1. Particle Difference Method (PDM) Approximation
The basic concept of the PDM revolves around developing a Taylor series by using the moving least-squares method based on a set of nodes. The PDM obtains a numerical solution by discretizing the given governing equation as is. As the Taylor series contains the differentials of the function at the position that forms the equation, the strain and stress including the first derivative of displacement can be calculated by developing the Taylor series for the displacement at each node in the PDM model. In the PDM, the approximation function is naturally derived in the series construction process by using the moving least squares method.
In this study, the arrangement of the TP using DIP was not the same as the node arrangement of the PDM model. In general, the kinematic variables are calculated with a fixed structural model such as the mesh of the FEM or grid of the finite difference method. FEM can only obtain the stress at the Gaussian point, while PDM can calculate the stress at any location. However, accurate kinematic variables can be calculated without causing problems because the PDM consists of an approximate function only with nodes. Even if the arrangement of the TPs is irregular or the arrangement changes during the analysis, no further difficulties are caused. Figure 8 shows a comparison of the PDM process between the elastic analysis and synthetic structural analysis. Synthetic structural analysis PDM analyzes the stress using the displacement extracted from the image, so the analysis procedure is relatively simple. In particular, there is no need for treatment of the boundary condition and discretization of the governing equations.
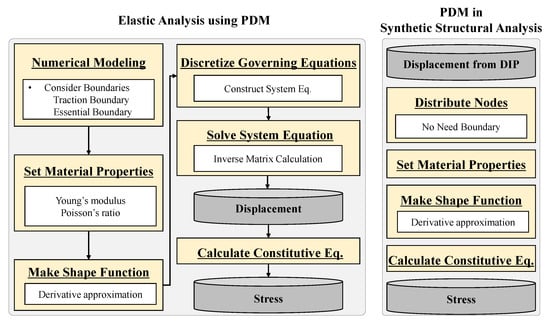
Figure 8.
Comparison of the particle difference method (PDM) process between the elastic analysis and synthetic structural analysis.
To discretize the governing equation by using the displacement for analyzing a solid mechanics problem in a strong formulation, the second order derivatives of the displacement are required [33]. However, a new PDM that can use the strong formulation without the second differential was used in this study [32]. This method exhibits excellent calculation efficiency because only the first differential is used to discretize the divergence of stress. As discussed earlier, many strong form-based meshfree methods utilize the so-called Navier’s equation, which involves second order differentials [1,2,23,24,30,33]. In this section, the process presented by Yoon et al. [33] for constructing an approximate function in the PDM is introduced briefly. When constructing the approximate function, the Taylor polynomial at an arbitrary point x relative to the reference point is given as follows:
where denotes the m-th order polynomial vector and denotes the derivative coefficient vector. , in the framework of multi-index. where n denotes the space dimension and m denotes the order of highest derivative.
Assuming that the number of nodes included in the influence domain of the reference point is N, and using the residual functional of the moving least squares method, the relationship between the approximation of Equation (7) and the nodal solution can be given as follows:
where denotes the weight function, and r denotes the radius of the influence domain that determines the number of nodes included in the approximation construction. Then, can be found by minimizing Equation (8) as follows:
where of in Equation (8) is replaced with x, and is the vector of the nodal solution included in the influence domain. According to the definition of the Taylor polynomial, contains all the derivative approximations from the zero-th to the m-th order, and is written in the matrix form as follows:
where is the differential operator expressed in a multi-index, and and represent the zero-th order shape function and the -order shape function, respectively, for node I at point x. Note that the actual differential calculation is not required, and the derivative approximation of all orders can be calculated at once in the process of calculating the unknown vector for obtaining the discrete version of the Taylor series. In this study, the new PDM method proposed by Yoon et al. [33] was applied, and approximations only up to the first differential were used. Yoon et al. [33] can be referred to for a more detailed derivation process.
3.2. Calculation of Kinematic Variables Using PDM Approximation
The synthetic structural analysis method calculates the strain and stress by obtaining the displacement of the TP from the image acquired in the experiment and substituting it into the PDM approximation. First, we describe the method of distributing the TP displacement obtained using DIP on the node of the PDM model. Basically, because the arrangements of the TP and the nodes in the PDM model do not match, the displacement obtained from the TP is converted into the PDM node value using the following equation:
where denotes the displacement at position of the PDM model, and is the vector containing the TP displacement values included in the influence domain of . The I(x) matrix contains the zero-th order shape function in the diagonal and is defined at the nodal positions of the PDM model as follows:
Although the matrix calculation of and I(x) in Equation (11) is a scalar product, note that the summation symbol Σ indicates the sum of calculations for the nodes included in the influence domain. In this process, the Jacobian need not be considered. This is a type of interpolation method, and the solving of Equation (11) between any two domains is not a mapping. Note that the PDM approximation is extremely suitable for this type of calculation.
To calculate the stress from the displacement values distributed between the nodes of the PDM model, a constitutive equation is required. The following constitutive equation for the elastic materials was used:
where σ, ε, , and denote the stress tensor, strain tensor, strain trace, and second unit tensor, respectively, and and are the Lamé constants.
If the constitutive equation is expressed in the matrix form, it can be written as Equation (14), and the component of matrix D representing the material properties for a plane strain case can be found in Equation (15).
In a small deformation problem, the strain is expressed by the symmetric part of the displacement gradient. Therefore, the strain was calculated using the following compatibility equation, which expresses the relationship between the strain and displacement:
where is the differential operator. As Equation (13) expresses the stress as a function of strain, if Equation (16) is substituted in Equation (13), the constitutive equation expressed by the displacement function can be obtained in the matrix form, as follows:
where is applicable for a 2D problem, and the matrix is constructed using the PDM shape function for the first derivative approximation, as follows:
The scalar product of the matrices and in Equation (17) naturally involves a summation of the scalars for the nodes included in the influence domain. Thus, similar to Equation (12), Equation (18) is expressed as a summation. The strain is expressed in the matrix form, as follows:
In fact, the calculation of the strain and stress using matrices is very similar to the FEM calculations. Given only the displacement values of the nodes in the PDM model, both the strain and stress can be easily calculated at any given location. However, if the number of TPs or PDM nodes is small, or the arrangement is highly uneven, the accuracy of the differential calculation such as that of the strain or stress calculation, could reduce. To avoid this problem, this study proposed a method to increase the number of TPs, and a sufficient number of nodes was properly distributed to ensure that the displacement field obtained by DIP for the TP displacement could be accurately reproduced over the entire area of the PDM model. In the FEM, because the analysis area is divided into element units, it is difficult to accurately reproduce the displacement value using the TP displacement in an arbitrary position within the entire FEM domain. The PDM, however, which uses only nodes, possesses the advantage of easily distributing the TP displacement value to the PDM node using interpolation- or extrapolation-type operations.
A linear elastic analysis using PDM was considered to verify the accuracy of synthetic structural analysis presented in this paper. The Navier’s equation for satisfying the equilibrium equation in solid mechanics is as follows:
Using the shape function for the first derivative approximation and the material property matrix, Equation (20) can be rewritten as below:
This discretized Navier’s equation was combined with traction and essential boundary conditions to construct a system equation. A detailed description of the PDM algorithm for solid mechanics can be found in previous studies [1,2].
4. Synthetic Structural Analysis for Tracking Point (TP) Displacement Tracking and Kinematic Variable Computation
To verify the accuracy of the kinematic variables obtained through the synthetic structural analysis with DIP–PDM, a three-point bending test was performed on a simply supported rubber beam. The shape of the specimen used in the experiment is illustrated in Figure 9; the elastic modulus and Poisson’s ratio of rubber were taken as 2.0 MPa and 0.5, respectively, similar to those used in the study of Howard [34]. A Zwick/Roell Z030 Universal Mechanical Tester, which can test the compressive and tensile strength in the loading range of 1–3000 N, was used as the loading equipment.
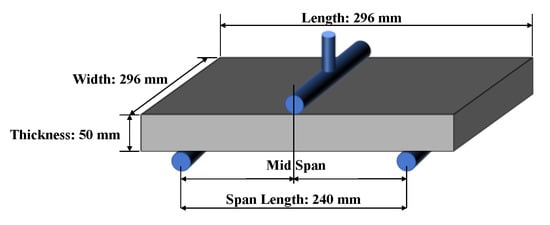
Figure 9.
Test specimen configuration for the three-point bending test of the rubber beam.
For the digital image acquisition, a Canon 5D Mark IV full-frame camera with a resolution of 30.1 million pixels (6720 × 4480 pixels) equipped with a Canon EF 24-70 F2.8L II lens was used. A tripod and a timer release were used to acquire high-quality images, and two indirect light sources were used to eliminate the effects of the natural light and shadows. Figure 10a shows the specimen used for the bending test. The targets were attached to one side of the specimen to acquire photographic images, and strain gauges were attached to the other side for measuring the local strain. Figure 10b shows the experimental setup consisting of the rubber beam, digital camera, lighting, datalogger, and a computer for data conversion. To verify the accuracy of the kinematic variable calculation, the strain gauges were attached at 1/4 (L1) and 3/4 (R1) of the total length from the lower end of the center (C1) and the left end (Figure 11).
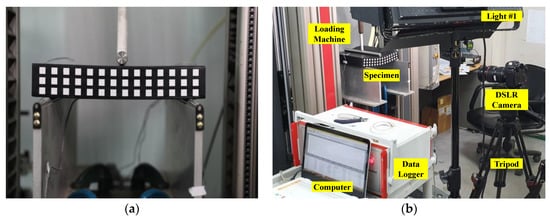
Figure 10.
Experimental setup for the synthetic structural analysis. (a) Specimen used in the experiment, and (b) DIP experimental setting.
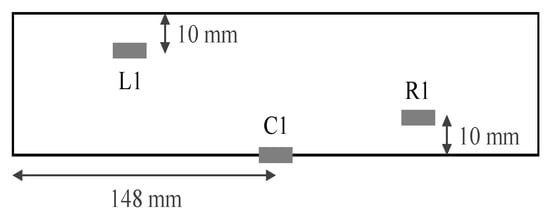
Figure 11.
Strain gauge position on the rear side of the test specimen.
The loading range was 0–2046.5 N while maintaining a speed of approximately 0.11 mm/s and a maximum deflection of approximately 50 mm. To track the deformation behavior of the specimen, an image of the specimen was acquired every 2 s. Figure 12 illustrates the force–displacement relationship obtained from the load tester, and the strain change over time obtained from the three strain gauges.
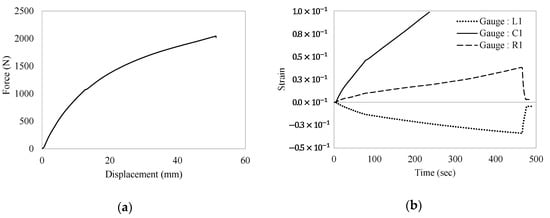
Figure 12.
(a) Force–displacement relationship obtained from a load tester, and (b) strain changes over time obtained from strain gauges.
4.1. TP Displacement Tracking Using Synthetic Structural Analysis
For the target used in the bending test, a similar rubber material was sprayed on the surface of the specimen to prevent detachment while effectively reflecting the deformation of the specimen. The size of the target was 10 × 10 mm, and 42 targets were attached at a center distance of approximately 20 mm, as shown in Figure 13a. From Equation (2), the size of the unit pixel according to the scale factor was approximately 0.063 mm. As the size of the unit pixel is the smallest unit for tracking the displacement, it is causally related to the size of the error that occurs in the synthetic structural analysis. In this study, images were extracted every 20 s from the image set to improve the computation efficiency and were used for the displacement tracking using DIP and stress calculation using the PDM. Figure 13a,c,e shows the experimental images acquired at 0, 220, and 460 s, respectively. Figure 13b,d,f shows the nodal deformed shapes processed using DIP and the PDM, indicating the deformation of the beams obtained from the synthetic structural analysis for each corresponding time (i.e., 0, 220, and 460 s). The displacement information of the 42 TPs extracted using DIP from the experimental image was distributed between 671 (61 × 11) PDM nodes using Equation (11). It can be seen that the actual deformation of the specimen and the shape of the deformation simulated by the PDM nodes were in close agreement.
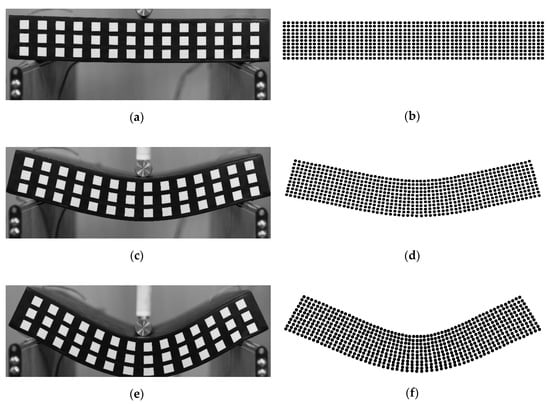
Figure 13.
Comparison of the mechanical test and numerical analysis. (a) Trimmed image at t = 0 s, (b) PDM model at t = 0 s. (c) Trimmed image at t = 220 s. (d) PDM model at t = 220 s. (e) Trimmed image at t = 460 s. (f) PDM model at t = 460 s.
To verify the effectiveness of the algorithm in calculating the kinematic variables of the synthetic structural analysis, the results were compared with the experimental results and the simulation results obtained using only the PDM. The simulation results using PDM were obtained by applying a concentrated load, similar to that in an actual experiment, on the PDM model beam, and by performing an elastic analysis on the rubber deformation process in a quasi-static state. In this case, the displacement value was obtained through the PDM analysis without the use of TP displacement through DIP. In the synthetic structural analysis, the method of utilizing the centroid of the target as the TP was first applied. Figure 13b,d,f illustrates the deformed shapes of the 42 TPs obtained through DIP in a particular interval, indicating that the displacement information of the TPs is successfully converted to the node displacement of the PDM model. Later, these nodal displacements were used to calculate various kinematic or kinetic variables. Ass the PDM analysis was performed under the assumption of static and linear elastic states, the results should be compared with the experimental results within the linear elastic range.
Figure 14a–d displays the surface plots of the displacement and stress calculated by the synthetic structural analysis and the simulation using only PDM after 60 s of loading. Figure 14a,b compares the displacement calculation results in the x-direction for the two cases, whereas Figure 14c,d compares the displacement calculation results in the y-direction. The displacement in the x-direction indicates that a flexural compressive stress is generated above the neutral axis and a flexural tensile force is generated below it. The displacement in the y-direction is also in the downward direction between the points, tracing a shape similar to the deflection shape of the specimen. In addition, because no displacement constraint exists outside the support points, as shown in Figure 14c,d, the displacement in the y-direction is upward at the end sides of the beam, similar to that in the experiment. Figure 14e,f shows the von Mises stress calculated by the synthetic structural analysis and the simulation using only PDM to confirm the accuracy of the kinematic variable calculation. In both cases, the stress value was larger in the upper center part where the load is applied, and in the lower and upper center parts where the tensile and compressive stresses were strongly generated by beam flexure occurrence. However, in the case of an actual beam, the end effect of the beam includes the constraint due to friction and the material nonlinear effect between the support point and the end of the beam. Unlike the simulation using only PDM, which assumes a complete elastic body and no end effect, the synthetic structural analysis uses the displacement value of the PDM node converted from the TP displacement. Therefore, the stress at both ends shows a value other than zero (Figure 14e), reflecting the nonlinear effect to some extent because the TP displacement describes the behavior of the actual specimen. In addition, because the test specimen is made of rubber, it does not exhibit a fully elastic behavior. Although it is necessary to consider a large deformation and material nonlinear effects for a more accurate numerical analysis, it was difficult to simulate this behavior in this study because the material was assumed to be elastic and plane strain. As mentioned in the introduction, the reason for selecting the rubber material was not to consider the behavior of nonlinear materials, but to present a solution to the labeling recognition error of the TP that could occur because of the excessive deformation of the specimen during the DIP process. Therefore, the synthetic structural analysis method can effectively track the displacement of the specimen in the actual test and accurately calculate its kinematic variables. Future works could accurately simulate the effects of large deformations on actual nonlinear materials by considering nonlinear properties.

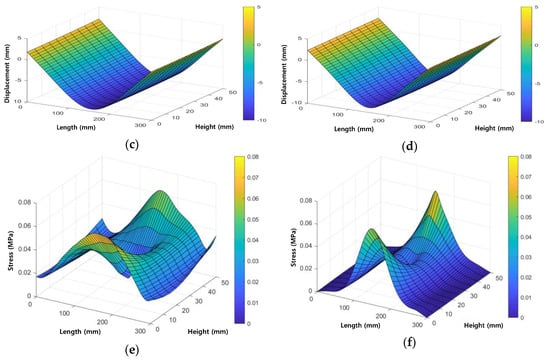
Figure 14.
Analysis results at t = 60 s: (a) displacement in the x-direction, (c) displacement in the y-direction, and (e) von Mises stress by the synthetic structural analysis; and (b) displacement in the x-direction, (d) displacement in the y-direction, and (f) von Mises stress by the simulation using only PDM.
4.2. Synthetic Structural Analysis Using Expanded TP (ETP)
This section presents a method for using the expanded TP to improve the accuracy of the calculation of the kinematic variables. When the DIP and the PDM are combined, the number of TPs affects the accuracy of the synthetic structural analysis. In other words, if the number of TPs is large, the resolution of the construction of node displacement in the PDM model increases. This is advantageous for calculating kinetic or kinematic variables such as strain, stress, and force, which require differential displacement calculations. As explained in Section 2.2, it is possible to set the expanded TP using a given image set when performing DIP. On the other hand, the number of TPs and the number of nodes in the PDM model can improve the accuracy of the calculation of the kinematic variables. In the synthetic structural analysis, the number of nodes in the PDM model can be increased without restrictions, even in the PDM application stage, regardless of the use of the expanded TP. However, note that it is difficult to reconstruct the mesh, and remap and interpolate the nodal displacement using the newly constructed shape function when the number of nodes increases because of the constraints on the mesh structure during the FEM analysis.
In addition, even if the arrangement of the TPs in the PDM nodes is irregular, bringing the TP displacement value to the PDM nodes through PDM approximation is not a problem, unlike FEM because the nodal arrangement in the PDM model can be configured regardless of the TP arrangement. Thus, the number of nodes can also be increased without restrictions, if necessary. Figure 15a illustrates the distribution of the initial TPs. Figure 15b illustrates the expanded TP distribution achieved by applying the TP expansion method suggested in Section 2.2 to the initial TP distribution. In this case, the 42 initial TPs expanded to 280 by a factor larger than six, without additional photographing or actual target adjustments. The increased number of TPs naturally increased the resolution of the nodal displacement configuration of the PDM model.
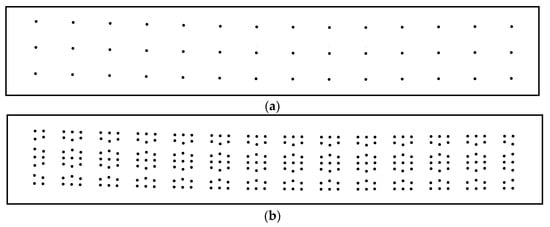
Figure 15.
Arrangements of original points for DIP-based displacement tracking: (a) TP (42 points), and (b) expanded TP (280 points).
Figure 16a,b displays the result of the von Mises stress calculation obtained by applying the expanded TP. When the expanded TP was not used, 42 TP displacement values were distributed between 671 PDM nodes. However, when the expanded TP was applied, 280 TP displacement values were distributed between 671 PDM nodes. Figure 16a shows the von Mises stress calculation results when the expanded TP was used, but the domain of influence of the PDM approximation function optimized over 42 TPs was used as is. In this case, the analysis result was generally similar to that of the previous analysis, but the stress increased abnormally at the boundary with some oscillation. This is because the radius of the domain of influence of the PDM approximation is maintained without considering the density of the expanded TPs. In this study, this problem was resolved by doubling the radius of the domain of influence, and the improved results are shown in Figure 16b. In practice, determining the radius of the domain of influence is important in all types of meshfree methods [21,29,30,32,33]. This study has the advantage of easily increasing the number of TPs and achieving a high accuracy of kinematic variable calculation by applying the expanded TP generation method. However, the appropriate number of nodes with the proper radius of the domain of influence should be determined by considering the number of TPs and an expected resolution level in this process.
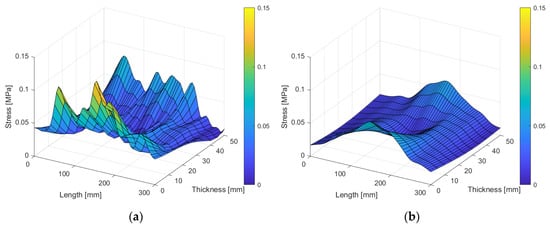
Figure 16.
Von Mises stress contour according to the corrected influence domain radius. (a) Conventional radius of influence domain (r) optimized for 42 TPs, and (b) doubling the radius of domain of influence (2r) at t = 60 s.
The relative errors were analyzed to evaluate the mathematical robustness of the synthetic structural analysis in performing accurate kinematic variable calculations. The error was calculated using the relative L2 error norm such as Equation (22), which Yoon and Song [29,30] used to evaluate the error in the strong form-based meshfree method.
where denotes the strain measured directly through the experiment, and denotes the strain calculated through the synthetic structural analysis.
To calculate the error according to the number of TPs, the number of TPs in the analysis was increased to 42 (TP), 84 (2TP), 168 (4TP), and 280 (ETP), while the number of nodes in the PDM analysis model was fixed at 671. The result of the error calculation is shown in Figure 17, wherein the x-axis represents the number of TPs and the y-axis the magnitude of the error. As the number of applied TPs increases, the relative error decreases; this implies that the numerical scheme presented in this study has a convergence property, indicating that the synthetic structural analysis is mathematically robust as a numerical technique. Figure 18 shows the computational time consumed in the PDM analysis when using the TP and the expanded TP. The PDM simulation was performed using MATLAB, and the average computational time was calculated by repeating the simulation five times under the same conditions. In the synthetic structural analysis, the computational time required for the PDM simulation was 97.02 s for the TP and 102.33 s for the expanded TP. Although the expanded TP, with more than six times the number of TPs than that in TP, took longer to compute, the difference was not significant. Therefore, the use of the expanded TP is better for improving the accuracy of the kinematic variable calculation without sacrificing computation efficiency. The PDM analysis duration differed by approximately 5 s between the TP and the expanded TP, indicating that the DIP and the labeling process occupied most of the duration of the synthetic structural analysis. In summary, the use of the expanded TP is economical for improving the analysis accuracy, which is important to overcome the disadvantage of actual experiments that require many targets attached onto the test specimen.
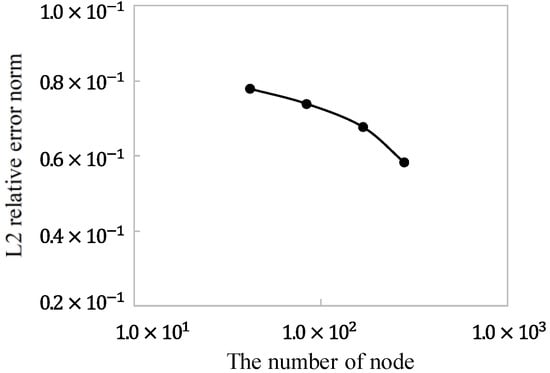
Figure 17.
Convergence study of the synthetic structural analysis using the L2 relative error norm.
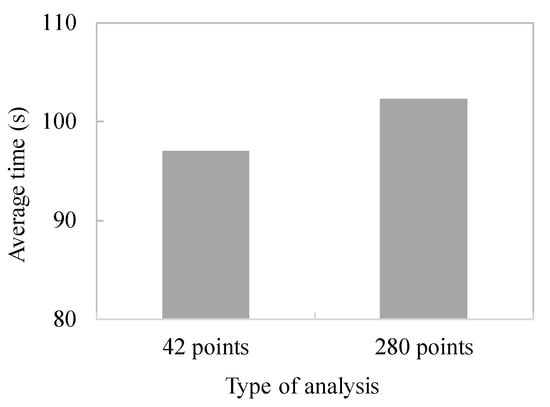
Figure 18.
Computational time comparison for the PDM simulations with TP and expanded TP.
In addition, the error analysis was performed in the same manner as before, while changing the number of nodes in the PDM model when using the TP and the expanded TP. Figure 19a–c demonstrates three PDM models with 186 (31 × 6), 671 (61 × 11), and 2541 nodes (121 × 21) used for the error analysis.
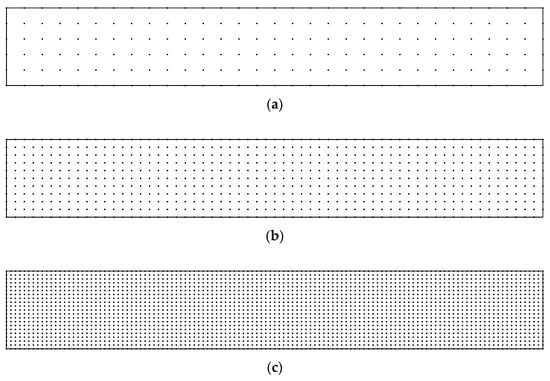
Figure 19.
Nodal arrangements of the PDM models for the error analysis: (a) 186-node model (31 × 6), (b) 671-node model (61 × 11), and (c) 2541-node model (121 × 21).
Figure 20 shows the calculation result of the relative error, with a fixed number of TPs and an increasing number of nodes used in the PDM model. As the number of nodes in the PDM model increases, the relative error decreases. Figure 17 revealed the same result even when the error evaluation was performed with a fixed number of nodes for the PDM model and an increased number of TPs. This shows again that the synthetic structural analysis exhibits convergence properties, indicating its robustness as a numerical analysis.
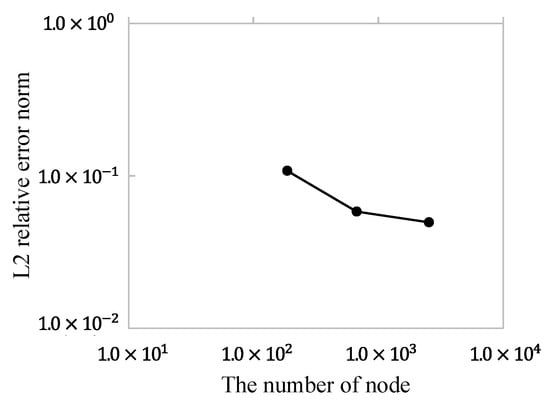
Figure 20.
Convergence rates for the PDM simulation with a fixed number of TPs.
4.3. Verification of Synthetic Structural Analysis through Comparison with Experimental Results
In this section, the calculation results of the kinematic and kinetic variables such as strain, stress, force, and displacement are compared with the values measured through actual experiments to verify the performance of the synthetic structural analysis. Figure 21 compares the force measured by the load tester and that calculated by the synthetic structural analysis. The trend of strain change in the process of gradual loading demonstrates that the strain values calculated by the synthetic structural analysis and those measured through experiment agreed well. When the load applied on the rubber beam exceeded a certain threshold, a slight slip phenomenon occurred at the support, and plastic behavior was observed. Subsequently, a change in the strain curve was observed, which did not occur during the numerical analysis in which an elastic material was assumed. As the synthetic structural analysis uses the displacement values obtained from the TP or the expanded TP, it can reasonably simulate the phenomenon of strain curve change.
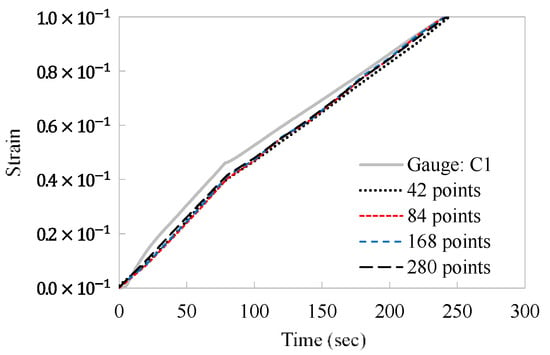
Figure 21.
Comparison of the change in strain over time measured in the experiment and the strain value calculated by the synthetic structural analysis.
Figure 22a shows a force–displacement plot for the entire duration of the loading test. From approximately 60 s after the loading starts to the time the deflection exceeds 10 mm or the load exceeds 1000 N, the behavior of the material seems to enter the nonlinear or plastic stage. After this point, nonlinearity becomes evident, and the experimental value increasingly diverges from the value measured by synthetic structural analysis. However, the results of the synthetic structural analysis correspond with the experimental results in the linear elastic region, as shown in Figure 22b. Figure 23a–c displays the results of the displacements in the x- and y-directions, and the von Mises stress calculated by the synthetic structural analysis applying the expanded TP when the displacement reached approximately 10 mm after 60 s and the load exceeded 1000 N. In fact, Figure 23c was plotted by doubling the domain of influence when calculating the PDM approximation. Thus, it shows the same result as Figure 16b, while the scale of the stress value was the same as that in Figure 14e or Figure 14f. Therefore, we determined that the analysis result was slightly more consistent with the experimental result when the expanded TP was used than when the TP was used.
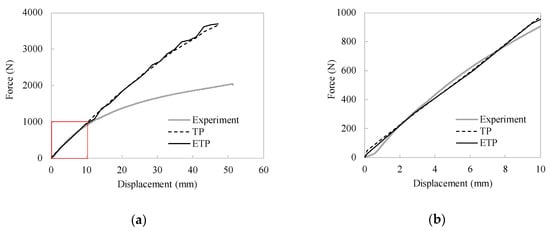
Figure 22.
Force–displacement relations obtained by the experiment and the synthetic structural analysis: (a) complete test range and (b) linear elastic stage.
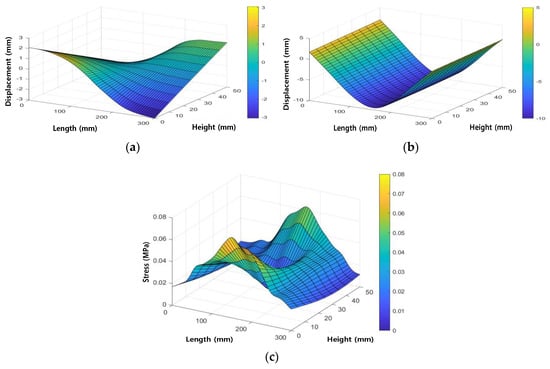
Figure 23.
Surface plots obtained by the synthetic structural analysis: (a) x-direction displacement, (b) y-direction displacement, and (c) von Mises stress using expanded TP.
5. Conclusions
This paper presented a synthetic structural analysis method that effectively calculates kinematic and kinetic variables such as strain and stress by combining a technique that tracks the TP displacement using DIP and the strong form-based PDM, which is truly meshfree and uses only nodes. The developed method accurately estimates the kinematic variables of structural members without limiting the number or distribution of nodes in the TP and the PDM model. In other words, the developed method can resolve the measurement problems that could occur when using a large number of specimens or in large-scale experiments. This allows for analyzing the experimental data and performing structural analysis by supplementing the limitations of traditional mechanical tests. First, the image processing speed was increased by improving the ROI setting and the pixel extraction method of the target area when configuring the DIP algorithm. The image size was reduced by approximately 87% and the volume of data were reduced by approximately 98% in comparison with those of the original image, ultimately reducing the effective pixel size by 99% compared with the original image by setting the ROI on the image set. To improve the accuracy of kinematic variable calculation when tracking the TP displacement using DIP, a method to expand the TPs by using the relationship between the centroid of the target on the specimen and the centroid of the neighboring target was proposed. The additional TP displacement was secured using the relationship of TPs that were already calculated without additional DIP. This paper showed that 42 TPs can be increased up to 280 using the algorithm of expanding TP. The PDM is effective in expanding the TP, as it can easily add and remove nodes in the framework of conventional mechanical theories. In addition, a target label-matching method that can maintain the label of the target regardless of the magnitude of specimen deformation was applied to the labeling of the TP, which is important when tracking the displacement through DIP. It compares the boundary coordinates and the centroid location of the target between images with time differences, reduces the label recognition errors of the TP that could occur because of the excessive deformation of the specimen during the DIP, and helps achieve consistent displacement tracking.
To verify the performance of the synthetic structural analysis, a three-point bending test was conducted on a rubber beam. First, 42 TP displacements were obtained through DIP using the centroid of 42 targets, and the displacement was distributed among 671 nodes of the PDM model using the PDM approximation for calculating the kinematic variables. The results of the synthetic structural analysis were compared with the experimentally measured values as well as with the results of the simulation using only the PDM. Although the results of the synthetic structural analysis exhibited an overall agreement with the results of the two aforementioned methods, the stress calculation results involving differential calculations exhibited slight differences near the boundary of the specimen. Modifying the distribution of the PDM nodes and expanding the TP effectively prevented this phenomenon, which is mainly due to the end effect of the beam and the nonlinearity of the material. Therefore, the displacement, strain, and force values obtained through actual experiments can be accurately reproduced through synthetic structural analysis. In addition, increasing the radius of the domain of influence of the PDM approximation function effectively eliminated the oscillation that occurs when the number of TPs is increased in the PDM application process to improve the accuracy of the kinematic variable calculation. To confirm the impact of the number of TPs transmitting the displacement information to the nodes of the PDM model on the accuracy of the kinematic variable calculation, the relative error with respect to the number of TPs in the PDM model was investigated, which is essential to validate the numerical analysis. The error analysis clearly showed that the accuracy of the synthetic structural analysis improved as the number of TPs increased. Although the application of the expanded TP consumed slightly more computation time, it is more effective in increasing the resolution. Increasing the number of TPs should not represent a major problem or sacrifice the resolution because the difference in the total calculation time after including DIP is quite small.
This study is a preliminary research on the development of the methodology to be applied to the behavior analysis of large civil structures in the future. The synthetic structural analysis method presented in this study could be a useful solution if an actual experiment involves a large volume of data or if limitations due to large experimental scales or complex hardware equipment exist. Moreover, by considering nonlinear effects and the validation of the DIP’s accuracy, future research could improve the applicability of the proposed synthetic structural analysis. As such, the method of integrating the DIP and PDM with the structural analysis approach could be applied in the field of structural integrity evaluation and maintenance because it has relatively fewer limitations with regard to time and space.
Author Contributions
Conceptualization, funding acquisition, project administration, Y.-C.Y.; Data curation, investigation, methodology, software, validation, J.P. and K.-H.K.; Formal analysis, K.-H.K.; Resources, supervision, S.-H.L.; Visualization, writing-original draft, J.P.; Writing-review & editing, J.P., Y.-C.Y., and S.-H.L. All authors have read and agreed to the published version of the manuscript.
Funding
This research was supported by the Basic Science Research Program through the National Research Foundation of Korea (NRF) funded by the Ministry of Science, ICT & Future Planning, grant number NRF-2017R1A1A1A05001196.
Conflicts of Interest
The authors declare no conflict of interest.
References
- Lee, S.-H.; Kim, K.-H.; Yoon, Y.-C. Particle difference method for dynamic crack propagation. Int. J. Impact Eng. 2016, 87, 132–145. [Google Scholar] [CrossRef]
- Yoon, Y.-C.; Kim, K.-H.; Lee, S.-H. Dynamic particle difference method for the analysis of proportionally damped system and cracked concrete beam. Int. J. Fract. 2017, 203, 237–262. [Google Scholar] [CrossRef]
- Godinho, L.; Dias-Da-Costa, D.; Valença, J.; Areias, P. An efficient technique for surface strain recovery from photogrammetric data using meshless interpolation. Strain 2014, 50, 132–146. [Google Scholar] [CrossRef]
- Aydilek, A.H.; Guler, M.; Edil, T.B. Use of image analysis in determination of strain distribution during geosynthetic tensile testing. J. Comput. Civ. Eng. 2004, 18, 65–74. [Google Scholar] [CrossRef][Green Version]
- Chang, C.W.; Chen, P.H.; Lien, H.S. Evaluation of residual stress in pre-stressed concrete material by digital image processing photoelastic coating and hole drilling method. Measurement 2009, 42, 552–558. [Google Scholar] [CrossRef]
- Kanazawa, D.; Yoneyama, S.; Ushijima, K.; Naito, J.; Chinzei, S. Evaluating stress triaxiality and fracture strain of steel sheet using stereovision. In Advancement of Optical Methods in Experimental Mechanics; Springer: New York, NY, USA, 2017; Volume 3, pp. 271–277. [Google Scholar] [CrossRef]
- Iwamoto, T.; Kanie, S. Evaluation of Bending Behavior of Flexible Pipe Using Digital Image Processing. Procedia Eng. 2017, 171, 1272–1278. [Google Scholar] [CrossRef]
- Warren, C.; Pingle, P.; Niezrecki, C.; Avitabile, P. Comparison of image based, laser, and accelerometer measurements. In Proceedings of the 28th IMAC, A Conference on Structural Dynamic, Jacksonville, FL, USA, 1–4 February 2010; Springer: New York, NY, USA, 2011; Volume 3, pp. 15–21. [Google Scholar] [CrossRef]
- Ye, X.-W.; Dong, C.Z.; Liu, T. A Review of Machine Vision-Based Structural Health Monitoring: Methodologies and Applications. J. Sens. 2016, 2016, 7103039. [Google Scholar] [CrossRef]
- Mohan, A.; Poobal, S. Crack detection using image processing: A critical review and analysis. Alex. Eng. J. 2018, 57, 787–798. [Google Scholar] [CrossRef]
- Fayyad, T.M.; Lees, J.M. Application of Digital Image Correlation to Reinforced Concrete Fracture. Procedia Mat. Sci. 2014, 3, 1585–1590. [Google Scholar] [CrossRef]
- Choi, I.Y.; Kang, Y.J.; Hong, K.M.; Ko, K.S.; Kim, S.J. Study on the Development of the Digital Image Correlation Measurements Program for Measuring the 3-Point Bending Test. J. Korean Soc. Precis. Eng. 2014, 31, 889–895. [Google Scholar] [CrossRef]
- Ko, Y.-H.; Seo, S.-H.; Lim, H.-S.; Jin, T.-L.; Chung, M.-K. Application of Digital Image Correlation Method for Measurement of Rock Pillar Displacement and Vibration Due to Underground Mine Blasting. Explos. Blasting 2019, 37, 1–9. [Google Scholar]
- Lee, J.H.; Kwon, O.H. The Effect of the DIC Speckle Patterns for a Microcrack Measurement. J. Korean Soc. Saf. 2019, 34, 15–21. [Google Scholar]
- Pan, B.; Li, K. A fast digital image correlation method for deformation measurement. Opt. Lasers Eng. 2011, 49, 841–847. [Google Scholar] [CrossRef]
- Yue, Z.Q.; Chen, S.; Tham, L.G. Finite element modeling of geomaterials using digital image processing. Comput. Geotech. 2003, 30, 375–397. [Google Scholar] [CrossRef]
- Duarte, A.P.C.; Silva, B.A.; Silvestre, N.; De Brito, J.; Júlio, E. Mechanical characterization of rubberized concrete using an image-processing/XFEM coupled procedure. Compos. Part B Eng. 2015, 78, 214–226. [Google Scholar] [CrossRef]
- Wu, Z.; Ji, X.; Liu, Q.; Fan, L. Study of microstructure effect on the nonlinear mechanical behavior and failure process of rock using an image-based-FDEM model. Comput. Geotech. 2020, 121, 103408. [Google Scholar] [CrossRef]
- Huang, Y.; Ji, J.; Lee, K.-M. Model-Based Digital Image Correlation for Noncontact Deformation Measurement of Strain Field and Mechanical Property. IEEE Trans. Ind. Inform. 2019, 15, 5109–5118. [Google Scholar] [CrossRef]
- Hosdez, J.; Langlois, M.; Witz, J.F.; Limodin, N.; Najjar, D.; Charkaluk, E.; Osmond, P.; Forre, A.; Szmytka, F. Plastic zone evolution during fatigue crack growth: Digital image correlation coupled with finite elements method. Int. J. Solids Struct. 2019, 171, 92–102. [Google Scholar] [CrossRef]
- Belytschko, T.; Lu, Y.Y.; Gu, L. Element-free Galerkin methods. Int. J. Numer. Methods Eng. 1994, 37, 229–256. [Google Scholar] [CrossRef]
- Samaan, M.F.; Rashed, Y.F. BEM for transient 2D elastodynamics using multiquadric functions. Int. J. Solids Struct. 2007, 44, 8517–8531. [Google Scholar] [CrossRef]
- Wen, P.H.; Aliabadi, M.H. An improved meshless collocation method for elastostatic and elastodynamic problems. Commun. Numer. Methods Eng. 2008, 24, 635–651. [Google Scholar] [CrossRef]
- Sadeghirad, A.; Kani, I.M.; Rahimian, M.; Astaneh, A.V. A numerical approach based on the meshless collocation method in elastodynamics. Acta Mech. Sin. 2009, 25, 857–870. [Google Scholar] [CrossRef]
- Moradi-Dastjerdi, R.; Behdinan, K. Stability analysis of multifunctional smart sandwich plates with graphene nanocomposite and porous layers. Int. J. Mech. Sci. 2020, 167, 105283. [Google Scholar] [CrossRef]
- Behdinan, K.; Moradi-Dastjerdi, R.; Safaei, B.; Qin, Z.; Chu, F.; Hui, D. Graphene and CNT impact on heat transfer response of nanocomposite cylinders. Nanotechnol. Rev. 2020, 9, 41–52. [Google Scholar] [CrossRef]
- Nguyen-Thanh, N.; Li, W.; Huang, J.; Srikanth, N.; Zhou, K. An adaptive isogeometric analysis meshfree collocation method for elasticity and frictional contact problems. Int. J. Numer. Methods Eng. 2019, 120, 209–230. [Google Scholar] [CrossRef]
- Beel, A.; Kim, T.Y.; Jiang, W.; Song, J.H. Strong form-based meshfree collocation method for wind-driven ocean circulation. Comput. Methods Appl. Mech. Eng. 2019, 351, 404–421. [Google Scholar] [CrossRef]
- Yoon, Y.-C.; Song, J.-H. Extended particle difference method for weak and strong discontinuity problems: Part I. Derivation of the extended particle derivative approximation for the representation of weak and strong discontinuities. Comput. Mech. 2014, 53, 1087–1103. [Google Scholar] [CrossRef]
- Yoon, Y.-C.; Song, J.-H. Extended particle difference method for weak and strong discontinuity problems: Part II. Formulations and applications for various interfacial singularity problems. Comput. Mech. 2014, 53, 1105–1128. [Google Scholar] [CrossRef]
- Yoon, Y.-C.; Song, J.-H. Extended particle difference method for moving boundary problems. Comput. Mech. 2014, 54, 723–743. [Google Scholar] [CrossRef]
- Yoon, Y.-C.; Schaefferkoetter, P.; Rabczuk, T.; Song, J.-H. New strong formulation for material nonlinear problems based on the particle difference method. Eng. Anal. Bound. Elem. 2019, 98, 310–327. [Google Scholar] [CrossRef]
- Lee, S.-H.; Yoon, Y.-C. Meshfree point collocation method for elasticity and crack problems. Int. J. Numer. Methods Eng. 2004, 61, 22–48. [Google Scholar] [CrossRef]
- Cambridge University Engineering Department. Materials Data Book; Cambridge University Engineering Department: Cambridge, UK, 2003. [Google Scholar]
Publisher’s Note: MDPI stays neutral with regard to jurisdictional claims in published maps and institutional affiliations. |
© 2020 by the authors. Licensee MDPI, Basel, Switzerland. This article is an open access article distributed under the terms and conditions of the Creative Commons Attribution (CC BY) license (http://creativecommons.org/licenses/by/4.0/).